enhancing phototrophic hydrogen production of rhodopseudomonas palustris via statistical...
TRANSCRIPT

International Journal of Hydrogen Energy 32 (2007) 940–949www.elsevier.com/locate/ijhydene
Enhancing phototrophic hydrogen production of Rhodopseudomonaspalustris via statistical experimental design
Chun-Yen Chena, Wei-Bin Lub, Ji-Fang Wua, Jo-Shu Changa,∗aDepartment of Chemical Engineering, National Cheng Kung University, Tainan 701, Taiwan
bDepartment of Cosmetic Science, Chung Hwa College of Medical Technology, Tainan, Taiwan
Received 24 May 2006; received in revised form 11 August 2006; accepted 12 September 2006Available online 27 October 2006
Abstract
An indigenous purple nonsulfur bacterium Rhodopseudomonas palustris WP3-5 was used to produce hydrogen via photo-fermentation.Response surface methodology was used to optimize the concentration of three critical medium components (butyric acid (HBu), glutamic acid,and FeCl3) having major impacts on the cell growth and H2 production of R. palustris WP3-5. Four performance indexes (PIs), namely, H2yield (YH2 ), maximum H2 production rate (Rmax), overall H2 production rate (Roverall), and lag time (�) were used to assess the effectivenessof the phototrophic H2 production. A new overlay 3-D contour surface plot was developed to determine optimal conditions for Rmax, Roverall,and � in the system, while maintaining a high H2 yield (YH2 = 5.5 mol H2/mol HBu) simultaneously. The overlay optimal regions of the threedouble responses (YH2 − Rmax, YH2 − Roverall, and YH2 − �) were identified. Using Rmax as the PI, the response surface analysis attainedan optimal concentration of 1832, 607, and 54 mg/l for butyric acid, glutamic acid, and FeCl3, respectively, giving an expected Rmax andYH2 value of 24.9 ml/h/l and 5.74 mol H2/mol HBu, respectively. This optimal performance is superior to most of the reported values in theliterature, indicating that the statistical experimental design was an effective tool leading to marked improvement in phototrophic H2 productionwith the R. palustris WP3-5 strain.� 2006 International Association for Hydrogen Energy. Published by Elsevier Ltd. All rights reserved.
Keywords: Medium optimization; Photosynthetic bacterium; Phototrophic hydrogen production; Response surface methodology; Overlay three-dimensionalcontour surface plot; Rhodopseudomonas palustris
1. Introduction
The demand for reliable and effective energy alternatives tofossil fuels has been increasingly rising in recent years [1]. Inparticular, hydrogen is recognized as a promising future energycarrier because it is clean, recyclable, and efficient. One of thecritical components of H2 energy technology is to develop asafe, economical, and sustainable way of H2 production. Bio-logical H2 production (e.g., photolysis of water, light-dependentor -independent fermentative pathways) appears to be a goodcandidate, as it is considered the most environment-friendlymeans of producing H2 [2,3]. Dark fermentation with mainlyacidogenic bacteria (such as Clostridium sp.) produces H2
∗ Corresponding author. Tel.: +886 6 2757575x62651;fax: +886 6 2357146.
E-mail address: [email protected] (J.-S. Chang).
0360-3199/$ - see front matter � 2006 International Association for Hydrogen Energy. Published by Elsevier Ltd. All rights reserved.doi:10.1016/j.ijhydene.2006.09.021
while converting organic substrates into volatile fatty acids andalcohols. These soluble metabolites can be further degraded ormineralized via photo-fermentation (with, photosynthetic bac-teria, such as purple nonsulfur bacteria) resulting in more H2production [4]. The highest theoretical H2 yield can be achievedthrough combination of dark and photo-H2 fermentation [5,6].However, the major drawback of photo-fermentation systemsis the slow H2 production rate primarily due to slow growth ofphotosynthetic bacteria and poor light conversion efficiency ofthe photo-bio-reactors (PBR) [7]. Meanwhile, the phototrophicH2 production is sensitively repressed by the presence of am-monia, nitrogen, and oxygen in the environment [8]. Therefore,the photo-fermentation process would most likely be a rate-limiting step when dark and photo-fermentation are combinedto trigger high-yield H2 production. Consequently, the rate ofphototrophic H2 production must be substantially improved be-fore achieving an effective and economically feasible integratedbio-H2-producing system.

C.-Y. Chen et al. / International Journal of Hydrogen Energy 32 (2007) 940–949 941
The carbon and nitrogen substrates are usually the mostcritical factors affecting the kinetics of cell growth and bio-hydrogenation [7–13]. In this study, butyric acid (HBu) wasused as the sole carbon source because HBu is known tobe the dominant soluble metabolite of dark H2 fermenta-tion when carbohydrates were used as the carbon substrate[14]. Moreover, HBu had higher substrate conversion effi-ciency than acetate, which is the other abundant metaboliteobtained from dark fermentation [15]. As the nitrogenase-driven H2-producing activity of photosynthetic bacteria (suchas Rhodopseudomonas palustris WP3-5) is strongly inhibitedby an excessive amount of NH+
4 ions [8], glutamic acid thatshows minor inhibitory effects on nitrogenase activity [16]was used as the nitrogen source. Furthermore, since iron isan important cofactor for the synthesis of nitrogenase [8,17],an appropriate supply of ferric ion (FeCl3) in the mediummay also play a crucial role in enhancing the efficiencyof the phototrophic H2 production. Therefore, the effect ofFeCl3 concentration on photo-H2 production should also beidentified.
For a multifactor system like this work, using a single-variable (i.e., “one-factor-at-a-time”) approach for experimen-tal design appears to be improper because the single-variabledesign cannot reveal the interactions between the factors, andthus the results obtained may be biased from the true optimum[18]. Therefore, in this work, a powerful and commonly adoptedstatistical experimental design methodology (i.e., response sur-face methodology; RSM) was utilized to determine the optimalmedium conditions for phototrophic H2 production. There werefew reports in the literature describing the use of the RSM ap-proach to improve the efficiency of bio-hydrogen production.Shi and Yu [19] used response surface analysis to reveal the in-teractive effects of cell concentration and light intensity on theperformance of photo-H2 production with Rhodopseudomonascapsulate. Mu et al. [9] applied central composite design to in-vestigate the individual and interactive effects of pH, tempera-ture, and substrate concentrations on anaerobic H2 production.In this work, RSM was utilized to identify the optimal concen-trations of FeCl3, glutamic acid, and butyric acid in the mediumto enhance phototrophic H2 production of an indigenous isolateR. palustris WP3-5. This improvement in phototrophic H2 pro-duction would be beneficial to the development of a successfulintegrated dark/photo-H2 fermentation process for high-yieldH2 production [5,6].
2. Materials and methods
2.1. Microorganism and medium
R. palustris WP3-5 isolated from a wastewater treatmentplant located in central Taiwan [20] was used for phototrophicH2 production. The bacterium was grown with Rhodospir-illaceae medium [20] consisting of (in g/l) K2HPO4, 0.5;KH2PO4, 0.5; MgSO4 · 7H2O, 0.2; NaCl, 0.4; CaCl2 · 2H2O,0.05; yeast extract, 0.2; iron citrate solution (1.0 g/l), 5 ml/l;trace element solution, 1 ml. The trace element solution con-tained (in mg/l) ZnCl2, 70; MnCl2 · 4H2O, 100; H3BO3, 60;
Fig. 1. Schematic description of the photo-bio-reactor system equipped withexternal light sources and gas collection device.
CoCl2 · 6H2O, 200; CuCl2 · 2H2O, 20; NiCl2 · 6H2O, 20;NaMoO4 · 2H2O, 40; HCl (25%), 1 ml/l. For preculture, thecarbon source was butyric acid with an initial concentra-tion of 2.0 g/l. The cells were grown anaerobically at 32 ◦Cfor 48 h under illumination with tungsten filament lamps(light intensity = ca.7000 lx). The anaerobic condition wascreated by sparging the medium with argon gas. The initial pHvalue of the medium was adjusted to 7.1 by 0.1 N NaOH.
2.2. Operation of PBR
The PBR was a sealed glass vessel with a working volumeof 100 ml (Fig. 1). Light source, a conventional tungsten fila-ment lamp (100 W) adjusted to ca. 10 000 lx, was mounted onboth sides of the PBR (Fig. 1). The initial cell concentration ofR. palustris WP3-5 was 0.875 g/l. The batch reactors were con-trolled at 32 ◦C, pH 7.1, and an agitation rate of 100 rpm. A gascollecting device was used to monitor gas production (Fig. 1)and the gas volumes were calibrated to 25 ◦C and 760 mmHg.The compositions of gas products were measured with respectto time. The culture samples were also collected from the sealedglass vessel at designated time intervals to determine cell con-centration, pH, and residual butyric acid concentration. The cu-mulative H2 production was simulated by modified Gompertzequation (Eq. (1)) [21,22] and the kinetic parameters for photo-H2 production were estimated via Sigma Plot 8.0 (SPSS Inc.,Point Richmond, CA, USA):
H = Hmax exp
{− exp
[Rmax,H2 × e
Hmax(� − t) + 1
]}, (1)
where H denotes cumulative H2 production (ml), Hmax denotesmaximum cumulative H2 production (ml), Rmax denotes max-imum H2 production rate (ml/h), t denotes culture time (h),and � denotes the lag time (h) required for the onset of H2evolution. The hydrogen production performance was mainlyassessed by maximum cumulative H2 production, overall H2production rate, and H2 yield. The definitions of the latter two

942 C.-Y. Chen et al. / International Journal of Hydrogen Energy 32 (2007) 940–949
Table 1Experimental design for response surface analysis
Run Code value Real value
x1 x2 x3 X1 X2 X3
1 −1 −1 −1 1000 200 252 −1 −1 1 1000 200 753 −1 1 −1 1000 600 254 −1 1 1 1000 600 755 1 −1 −1 2000 200 256 1 −1 1 2000 200 757 1 1 −1 2000 600 258 1 1 1 2000 600 759 −1.68 0 0 659.11 400 50
10 1.68 0 0 2340.9 400 5011 0 −1.68 0 1500 64 5012 0 1.68 0 1500 736 5013 0 0 −1.68 1500 400 7.9514 0 0 1.68 1500 400 92.0415 0 0 0 1500 400 5016 0 0 0 1500 400 5017 0 0 0 1500 400 5018 0 0 0 1500 400 5019 0 0 0 1500 400 5020 0 0 0 1500 400 50
X1 = butyric acid concentration (mg/l), X2 = glutamic acid concentration (mg/l), and X3 = FeCl3 concentration (mg/l).
parameters are given as follows:
Overall H2 production rate = Maximum cumulative H2 production (ml)
Culture time for H2 evolution (h) · Culture volume (1), (2)
H2 yield = Amount of H2 produced (mol)
Amount of substrate (acetic acid or butyric acid) consumed (mol). (3)
2.3. Experimental design
To investigate the effects of butyric acid, glutamic acid,and FeCl3 on phototrophic H2 production, a central compositedesign was used for the experimental design. Twenty batchexperiments were conducted (Table 1). The concentration rangeof butyric acid, glutamic acid, and FeCl3 was 1000–2000 g/l(central value = 1500 g/l), 200–600 mg/l (central value= 400 mg/l), and 25–75 mg/l (central value = 50 mg/l), re-spectively. The levels of initial butyric acid, glutamic acid,and FeCl3 concentrations were determined by the followingequation [21]:
Xi = Xi − Xi∗
�Xi, (4)
where Xi denotes the code value of the ith test variable, Xi
is a value of the ith test variable, Xi∗ is the value of Xi atthe center point of the experimental area, and �Xi is the stepchange value. The experimental design for X1 (butyric acid),X2 (glutamic acid), and X3 (FeCl3) is described in Table 1.Stepwise regression analysis was carried out by generating thesecond-order regression equation as follows:
Y = �0 + �1X1 + �2X2 + �3X3 + �11X21
�22X22 + �33X
23 + �12X1X2 + �13X1X3 + �23X2X3, (5)
where Y is the expected response value predicted from RSM;�i , �j , and �ij are the parameters estimated from the regressionresults.
Four responses (performance index; PI) were used to assessthe effectiveness of phototrophic H2 production with R. palus-tris WP3-5. The four PIs were (i) the H2 yield that representsthe conversion of carbon substrate to the desired product—H2,(ii) maximum H2 production rate (Rmax) that represents the in-trinsic kinetics of H2 production, (iii) overall H2 productionrate (Roverall) that indicates overall H2 production efficiency bytaking into account the lag time, and (iv) the lag time (�) re-quired for the onset of H2 evolution. Table 2 summarizes theresults of all the H2 production PIs with respect to differentoperation conditions.
2.4. Overlay 3-D contour surface plot
Many response surface problems involve the analysis of mul-tiple responses. In this study, the hydrogen yield (YH2 ) is im-portant and needs to be considered while analyzing the optimalconditions for the other PIs (e.g., Rmax, Roverall, and �). Simul-taneous consideration of two responses (YH2 and the other PI)involves the process of first building an appropriate responsesurface model for each response (Rmax, Roverall, or �), followed

C.-Y. Chen et al. / International Journal of Hydrogen Energy 32 (2007) 940–949 943
Table 2Performance of photo-H2 production at various concentrations of butyric acid, glutamic acid, and FeCl3
Run Model simulation H2 yield Maximum H2 production Overall H2 production Specific H2 production Final cell dry(mol H2/mol HBu) rate (ml/h/l) Rmax rate (ml/h/l) Roverall rate (ml/h/g cell) weight (g/l)
Hmax
(ml)Rmax
(ml/h)� (h) R2
1 141.2 0.98 89.5 0.995 5.21 9.82 6.14 2.51 5.482 159.9 1.67 59.1 0.998 5.89 16.69 8.74 4.31 4.873 149.6 1.81 71.4 0.995 5.38 18.10 8.17 3.15 7.184 139.4 2.34 74.4 0.995 5.10 23.4 8.77 4.20 7.425 304.1 1.37 157.3 0.994 5.47 13.70 8.10 2.82 6.916 320.5 1.70 103.8 0.998 5.76 17.00 10.58 3.03 7.167 316.4 2.21 86.2 0.998 5.69 22.1 11.30 3.23 8.658 310.6 2.56 112.1 0.995 5.58 25.6 11.11 3.39 8.89 95.5 2.24 40.1 0.999 5.21 22.4 9.55 4.86 5.39
10 334.2 1.76 98.1 0.995 5.13 17.60 10.21 2.94 8.5911 253.4 0.79 77.0 0.994 6.07 7.90 7.21 2.09 4.9112 226.5 2.20 71.7 0.998 5.42 22.0 10.90 2.82 8.9913 104.1 1.01 90.3 0.987 2.51 10.08 5.69 1.48 9.0614 195.8 1.23 116.4 0.986 4.71 12.26 7.68 2.02 8.1715 225.4 2.33 51.1 0.998 5.40 23.3 12.59 3.46 7.7216 220.0 2.41 55.4 0.998 5.27 24.1 12.29 4.21 7.0617 229.5 2.28 49.9 0.999 5.50 22.8 11.83 3.67 7.6518 235.3 2.29 46.2 0.999 5.64 22.9 12.11 3.99 6.9319 235.8 2.11 51.4 0.999 5.65 21.1 12.14 3.83 7.3820 230.0 2.20 49.6 0.999 5.52 21.9 11.84 3.80 7.36
by finding a set of operating conditions that could keep YH2 ina desired range when optimizing the other index. Overlay con-tour plots were often used to determine appropriate operatingconditions in similar cases [19,23,24]. However, for a systeminvolves more than two design variables (like in this study),overlaying contour plots would become awkward, since theyare usually 2-D plots. To apply the contour plot in this work,a new overlay 3-D contour surface plot was developed basedon the overlay 2-D contour plot [18,25]. In this new overlaycontour plot, the contour surfaces were generated from the re-sults of model simulation indicated in Eq. (5), which can berewritten as a second-order equation:
�33X23 + (�13X1 + �3 + �23X2)X3 + (�0 + �1X1
+ �2X2 + �11X21 + �22X
22 + �12X1X2 − Y ) = 0. (6)
As a result, X3 can be easily solved as
X3=−(�13X1 + �3 + �23X2)±
√(�13X1 + �3 + �23X2)
2 − 4�33(�0 + �1X1 + �2X2 + �11X21 + �22X
22 + �12X1X2 − Y )
2�33. (7)
Based on Eq. (7), contour surfaces can be drawn in a 3-D plotwith X1, X2, and X3 as axes. Each overlaying 3-D contourplot in our H2 production system contained three independentvariables (i.e., concentrations of butyric acid, glutamic acid,and FeCl3) and three binary responses (YH2 − Rmax, YH2 −Roverall, and YH2 − �). The regions for the two responses couldbe found, while the overlay space of the two response regionsis considered the optimal region.
2.5. Analytical methods
The cell concentration of the culture was determined reg-ularly by an optical density measurement at a wavelength of
660 nm (i.e., OD660) using a spectrophotometer (model U-2001,Hitachi, Tokyo, Japan). The OD660 values were converted todry cell weight concentration via proper calibration. Butyricacid concentration was analyzed by gas chromatography (GC-14B, Shimadzu, Tokyo, Japan) equipped with a flame ioniza-tion detector (FID) and a 15-m-long capillary column (Type no.11052, Restek, Bellefonte, PA, USA). Nitrogen was used as thecarrier gas with a flow rate of 20 ml/min. Detailed proceduresfor GC operation were described elsewhere [14,26,27]. The gasproducts (H2 and CO2) were also analyzed by gas chromatog-raphy (Model 9800, China Chromatography, Taipei, Taiwan)using a thermal conductivity detector. The carrier gas was ar-gon and the column (2.159 mm in inner diameter and 4 m inheight) was packed with Porapak Q (China Chromatography,Taipei, Taiwan). The detailed operation procedures were alsogiven in our recent work [14,26,27].
3. Results and discussion
3.1. Effect of medium composition on H2 yield
The response surface analysis was conducted based on theresponse of H2 yield (YH2 ). The model describing the responsesurface of H2 yield is as follows:
YH2 = 5.471 + 0.0575x1 − 0.0646x2 + 0.3134x3
+ 0.0515x21 + 0.1717x2
2 − 0.5001x23 + 0.0825x1x2
− 0.0275x1x3 − 0.17x2x3. (8)

944 C.-Y. Chen et al. / International Journal of Hydrogen Energy 32 (2007) 940–949
The regression coefficient (R2) was 0.849. The optimal mediumcomposition for the highest YH2 could not be obtained, be-cause a saddle point occurs on the response surface of H2yield.
3.2. Effect of medium composition on maximum H2production rate (Rmax)
The Rmax values were obtained from simulation of the ex-perimental data with modified Gompertz equation (Eq. (1)).The near-unity R2 values (Table 2) indicate that the modifiedGompertz equation is well suited to describe the time-courseprofiles of phototrophic H2 production by R. palustris WP3-5.The Rmax values indicated in Table 2 were used as the re-sponse values for response surface analysis. A second-orderregression equation was generated for the response surface asfollows:
Rmax = 22.6 + 0.17x1 + 4.1x2 + 1.7x3 − 0.2x21 − 2x2
2
− 3.4x23 + 0.3x1x2 − 0.7x1x3 − 0.2x2x3 (9)
where x1, x2, and x3 indicates the coded value of the threetest variables (concentration of butyric acid, glutamic acid, andFeCl3), respectively. The regression model (Eq. (9)) fits the ex-perimental data quite well with a high R2 value of 0.925. The3-D response surfaces are illustrated in Fig. 2 based on Eq. (5).The highest points in Fig. 2 indicate optimal operating condi-tion attaining the highest Rmax. According to Fig. 2a, the Rmaxsignificantly increased with increasing glutamic acid concentra-tion. A similar trend was also observed in Fig. 2b. The highestRmax occurred when glutamic acid concentration was between600 and 700 mg/l. These results indicate that glutamic acid is akey factor affecting Rmax. Moreover, inspection of the results offinal cell dry weight concentration (Table 2) shows that increas-ing glutamic acid concentration led to a substantial increasein cell growth. Hence, the glutamic acid concentration is criti-cal to both photo-H2 production and cell growth. Furthermore,Fig. 2c shows that FeCl3 concentration was also an impor-tant factor to Rmax, as the Rmax value increased as FeCl3concentration increased from 8.0 to 54 mg/l. However, whenFeCl3 concentration exceeded 54 mg/l, Rmax became indepen-dent of FeCl3 concentration. Unlike glutamic acid and FeCl3,butyric acid concentration had little influence on the Rmaxvalue (Figs. 2a and 2c). The response surface analysis showsthat the medium composition leading to a predicted optimumRmax value(24.9 ml/h/l) was a butyric acid concentration of1832 mg/l, a glutamic acid concentration of 607 mg/l, and aFeCl3 concentration of 54 mg/l (Table 3).
3.3. Effect of medium composition on overall H2 productionrate (Roverall)
The response surface analysis was also conducted to investi-gate the effects of FeCl3, glutamic acid, and butyric acid on theoverall H2 production rate (Roverall). The second-order polyno-mial model used to describe the response surface for Roverall is
Fig. 2. Response surfaces showing the effect of (a) glutamic acid and butyricacid concentration; (b) FeCl3 and glutamic acid concentration; (c) FeCl3 andbutyric acid concentration on the maximum hydrogen production rate. (Lightsource: tungsten lamp (TL); light intensity = 10 000 lx).

C.-Y. Chen et al. / International Journal of Hydrogen Energy 32 (2007) 940–949 945
Table 3Predicted values of four performance indexes under different optimal medium compositions determined by response surface analysis as well as comparisonwith comparable studies
Phototrophic H2 producers RSM analysis Medium composition Performance index
Butyric acid (mg/l) Glutamic acid (mg/l) FeCl3(mg/l)
Rmax
(ml/h/l)Roverall
(ml/h/l)� (h) H2 yield
(%)a
(Rhodopseudomonas palustris Optimum for Rmax 1832 607 54 24.9 12.3 70.1 57.1WP3-5 (this study)
Optimum for Roverall 1842 506 52 24.3 12.6 65.5 55.9Optimum for � 891 352 52 21.1 7.8 39.2 55.7
Carbon source Nitrogen source
Rhodopseudomonas sp. RV [6] Butyrate Sodium glutamate —b — — 75.0
Rhodobacter capsulatus [11] Butyrate NH+4 12.8 — 17.0 28.0
R. palustris WP2-5 [20] Butyrate NH+4 — — — 23.3
R. palustris WP3-5 [20] Butyrate NH+4 — — — 27.4
R. capsulate [19] Acetate, propionate Sodium glutamate — — — 32.6and butyrate
R. capsulate [28] Acetate, propionate Sodium glutamate — — — 40.0and butyrate
Rhodopseudomonas sp. [29] Butyrate Sodium glutamate 7.6 — — 8.4Rhodobacter 8604 [30] Butyrate Sodium glutamate — — — 44.0
aPercentage of H2 yield (mol H2/mol substrate) out of the theoretical H2 yield.b“—” means not available.
as follows:
Roverall = 12.1 + 0.76x1 + 0.88x2 + 0.65x3 − 0.63x21
− 0.92x22 − 1.76x2
3 + 0.21x1x2 − 0.12x1x3
− 0.59x2x3. (10)
The regression coefficient (R2) was 0.963, suggesting that theregression model fits the experimental data accurately. Accord-ing to Eq. (10), the 3-D response surfaces were generated asshown in Fig. 3. The highest points on the surfaces representthe optimal operating condition for Roverall.
As depicted in Fig. 3, the Roverall increased initially with in-creasing the concentration of glutamic acid, butyric acid, andFeCl3 until an optimum was reached (Figs. 3a–c). Thereafter,further increases in concentration of glutamic acid and butyricacid resulted in a slight decline in Roverall, whereas the Roveralldecreased rapidly with increasing FeCl3 concentration once theFeCl3 concentration exceeded 65 mg/l (Figs. 3b and c). Theseresults indicate that the concentration of FeCl3, glutamic acid,and butyric acid all had a significant individual influence onRoverall. Moreover, Fig. 3c shows that the reciprocal interac-tion between concentration of FeCl3 and glutamic acid had arelatively higher effect on the Roverall, thereby being critical tothe improvement of Roverall. The response surface analysis forRoverall gave an optimal butyric acid, glutamic acid, and FeCl3concentration of 1842, 506, and 52 mg/l, respectively. By fit-ting the second-order polynomial model (Eq. (10)), the optimalRoverall value is estimated as 12.6 ml/h/l. It is noticed that theoptimal medium composition for Roverall and Rmax was quitesimilar (Table 3), suggesting that the factor of lag time (�) vir-tually had a minor effect on the optimal medium condition forH2 production rates.
3.4. Effect of medium composition on time delay
Using the results listed in Table 2, the second-order polyno-mial model generated to describe the response surface for lagtime (�) is as follows:
� = 50.27 + 19.22x1 − 5.46x2 − 0.8x3 + 8.67x21
+ 10.52x22 + 20.76x2
3 − 7.48x1x2 − 0.01x1x3
+ 14.3x2x3. (11)
Simulation of the experimental data with Eq. (11) was quitesuccessful as the regression coefficient (R2) was as high as0.953. The response surface is plotted in Fig. 4, in which thelowest points present the optimal medium composition result-ing in the shortest time delay. As depicted in Figs. 4a and b, thelag time increased with increasing butyric acid concentration(Figs. 4a and b), indicating that the high butyric acid concen-tration seemed to inhibit H2 production, causing a longer lagtime. Moreover, Figs. 4b and c show that the lag time may beshortened while using a FeCl3 concentration of 50–60 mg/l, in-dicating that a suitable FeCl3 concentration would be needed totrigger the phototrophic H2 production. Based on the responseof the shortest lag time, the predicted optimum concentrationfor butyric acid, glutamic acid, and FeCl3 was 891, 352, and52 mg/l, respectively, giving the shortest � value of 39.2 h byfitting the second-order polynomial model (Eq. (11)). It is notedthat the minimization of � predicted a much lower HBu con-centration than that for maximizing Rmax and Roverall (Table 3).This is quite reasonable, because by using a lower HBu con-centration, the inhibitory effect of HBu on cell growth couldbe avoided during the early cultivation stage, thereby leadingto a shorter �. However, this compromise was at the expenseof poor H2 production rates due to a lower concentration of

946 C.-Y. Chen et al. / International Journal of Hydrogen Energy 32 (2007) 940–949
Fig. 3. Response surfaces showing the effect of (a) glutamic acid and butyricacid concentration; (b) FeCl3 and glutamic acid concentration; (c) FeCl3 andbutyric acid concentration on the overall hydrogen production rate. (Lightsource: tungsten lamp (TL); light intensity = 10 000 lx).
Fig. 4. Response surfaces showing the effect of (a) glutamic acid and butyricacid concentration; (b) FeCl3 and glutamic acid concentration; (c) FeCl3 andbutyric acid concentration on the time delay. (Light source: tungsten lamp(TL); light intensity = 10 000 lx).
C.-Y. Chen et al. / International Journal of Hydrogen Energy 32 (2007) 940–949 947
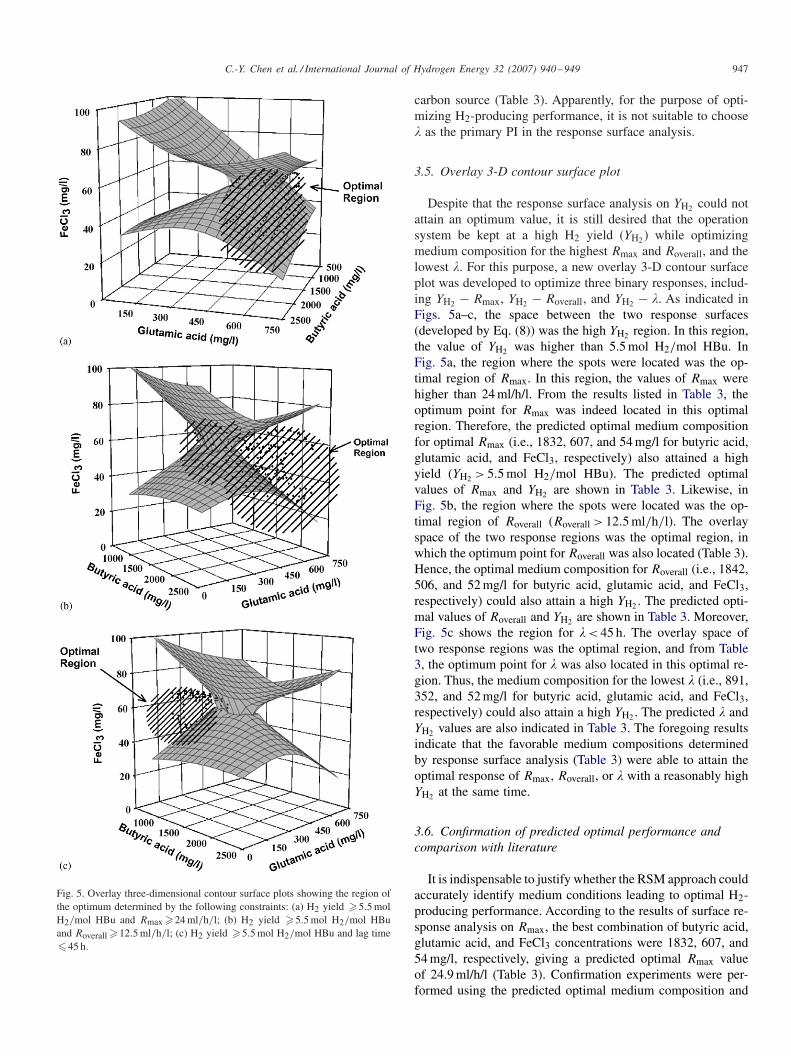
Fig. 5. Overlay three-dimensional contour surface plots showing the region ofthe optimum determined by the following constraints: (a) H2 yield �5.5 molH2/mol HBu and Rmax �24 ml/h/l; (b) H2 yield �5.5 mol H2/mol HBuand Roverall �12.5 ml/h/l; (c) H2 yield �5.5 mol H2/mol HBu and lag time�45 h.
carbon source (Table 3). Apparently, for the purpose of opti-mizing H2-producing performance, it is not suitable to choose� as the primary PI in the response surface analysis.
3.5. Overlay 3-D contour surface plot
Despite that the response surface analysis on YH2 could notattain an optimum value, it is still desired that the operationsystem be kept at a high H2 yield (YH2 ) while optimizingmedium composition for the highest Rmax and Roverall, and thelowest �. For this purpose, a new overlay 3-D contour surfaceplot was developed to optimize three binary responses, includ-ing YH2 − Rmax, YH2 − Roverall, and YH2 − �. As indicated inFigs. 5a–c, the space between the two response surfaces(developed by Eq. (8)) was the high YH2 region. In this region,the value of YH2 was higher than 5.5 mol H2/mol HBu. InFig. 5a, the region where the spots were located was the op-timal region of Rmax. In this region, the values of Rmax werehigher than 24 ml/h/l. From the results listed in Table 3, theoptimum point for Rmax was indeed located in this optimalregion. Therefore, the predicted optimal medium compositionfor optimal Rmax (i.e., 1832, 607, and 54 mg/l for butyric acid,glutamic acid, and FeCl3, respectively) also attained a highyield (YH2 > 5.5 mol H2/mol HBu). The predicted optimalvalues of Rmax and YH2 are shown in Table 3. Likewise, inFig. 5b, the region where the spots were located was the op-timal region of Roverall (Roverall > 12.5 ml/h/l). The overlayspace of the two response regions was the optimal region, inwhich the optimum point for Roverall was also located (Table 3).Hence, the optimal medium composition for Roverall (i.e., 1842,506, and 52 mg/l for butyric acid, glutamic acid, and FeCl3,respectively) could also attain a high YH2 . The predicted opti-mal values of Roverall and YH2 are shown in Table 3. Moreover,Fig. 5c shows the region for � < 45 h. The overlay space oftwo response regions was the optimal region, and from Table3, the optimum point for � was also located in this optimal re-gion. Thus, the medium composition for the lowest � (i.e., 891,352, and 52 mg/l for butyric acid, glutamic acid, and FeCl3,respectively) could also attain a high YH2 . The predicted � andYH2 values are also indicated in Table 3. The foregoing resultsindicate that the favorable medium compositions determinedby response surface analysis (Table 3) were able to attain theoptimal response of Rmax, Roverall, or � with a reasonably highYH2 at the same time.
3.6. Confirmation of predicted optimal performance andcomparison with literature
It is indispensable to justify whether the RSM approach couldaccurately identify medium conditions leading to optimal H2-producing performance. According to the results of surface re-sponse analysis on Rmax, the best combination of butyric acid,glutamic acid, and FeCl3 concentrations were 1832, 607, and54 mg/l, respectively, giving a predicted optimal Rmax valueof 24.9 ml/h/l (Table 3). Confirmation experiments were per-formed using the predicted optimal medium composition and

948 C.-Y. Chen et al. / International Journal of Hydrogen Energy 32 (2007) 940–949
obtained an Rmax value of 24.7 ml/h/l, which was very close tothat predicted by RSM. This appears to validate the feasibil-ity of using RSM to optimize the phototrophic H2 productionwith R. palustris WP3-5. Moreover, as indicated in Table 3, theperformance of phototrophic H2 production under the optimalmedium composition is compared with the reported values inthe literature. It is evident that the H2-producing performanceis in general better than most of the results obtained by com-parable studies in all PIs. This, again, indicates that responsesurface analysis was a powerful and effective tool in enhancingthe performance of phototrophic H2 production.
4. Conclusions
This work is a successful demonstration of using statisticalexperimental design methodology to obtain favorable mediumcomposition leading to improvement of H2-producing perfor-mance of an indigenous photosynthetic bacterium R. palustrisWP3-5. By choosing concentrations of carbon source (butyricacid), nitrogen source (glutamic acid), and essential metal ion(FeCl3) as the target factors, optimization was achieved via re-sponse surface analysis using the PI of maximum H2 produc-tion rate (Rmax), overall H2 production rate (Roverall), H2 yield(YH2 ), and time delay (�). Since the response surface for H2yield did not exhibit an optimum value, an innovative over-lay 3-D contour surface plot was developed, showing that thepredicted optimal medium compositions for Rmax, Roverall, and� were all located in the overlay regions with the constraintof YH2 > 5.5 mol H2/mol HBu. The optimal medium compo-sition for the highest Rmax was a butyric acid concentrationof 1832 mg/l, a glutamic acid concentration of 607 mg/l, anda FeCl3 concentration of 54 mg/l, giving a Rmax, Roverall, �,and YH2 value of 24.9 ml/h/l, 12.3 ml/h/l, 70.1 h, and 5.71 molH2/mol HBu, respectively. The Rmax predicted by response sur-face analysis was confirmed experimentally with a good con-sistency. The optimal H2-producing performance obtained inthis study is better than that reported in the literature. Thus, theRSM approach is effective and useful in enhancing H2 produc-tion of R. palustris WP3-5, making it more feasible to integratedark and photo-H2 fermentation processes for a high-yield andhigh-efficiency production of H2.
Acknolwledgments
The authors gratefully acknowledge financial supports fromNational Science Council of Taiwan (Grant nos. NSC-93-2211-E-006-040 and NSC 94-2211-E-006-026) as well as Bureau ofEnergy of Taiwan (Grant nos. 93-ET-7-006-001-ET and 94-ET-7-006-004-ET).
References
[1] PEC. Organization of the Petroleum Exporting Countries. Website:〈http://www.opec.org〉, 2004.
[2] Urner JA. Sustainable hydrogen production. Science 2004;305:972–4.
[3] Zhu H, Suzuki T, Tsygankov AA, Asada Y, Miyake J. Hydrogenproduction from tofu wastewater by Rhodobacter sphaeroidesimmobilized in agar gels. Int J Hydrogen Energy 1999;24:305–10.
[4] Oh YK, Seol EH, Kim MS, Park S. Photoproduction of hydrogen fromacetate by a chemoheterotrophic bacterium Rhodopseudomonas palustrisP4. Int J Hydrogen Energy 2004;29:1115–21.
[5] Kataoka N, Miya A, Kiriyama K. Studies on hydrogen production bycontinuous culture system of hydrogen-producing anaerobic bacteria.Water Sci Technol 1997;36(6–7):41–7.
[6] Miyake J, Mao XY, Kawamura S. Photoproduction of hydrogen fromglucose by a co-culture of a photosynethic bacterium and Clostridiumbutyricum. J Ferment Technol 1984;62(6):531–5.
[7] Das D, Veziroglu TN. Hydrogen production by biological processes: asurvey of literature. Int J Hydrogen Energy 2001;26:13–28.
[8] Koku H, Eroglu I, Gündüz U, Yücel M, Türker L. Aspects of themetabolism of hydrogen production by Rhodobacter sphaeroides. Int JHydrogen Energy 2002;27:1315–29.
[9] Mu Y, Wang G, Yu HQ. Response surface methodological analysis onbiohydrogen production by enriched anaerobic cultures. Enzyme MicrobTechnol 2006;38(7):905–13.
[10] Segers L, Verstraete W. Conversion of organic acids to H2Rhodospirillaceae grown with glutamate or dinitrogen as nitrogen source.Biotechnol Bioeng 1983;25:2843–53.
[11] Fang HHP, Liu H, Zhang T. Phototrophic hydrogen production fromacetate and butyrate in wastewater. Int J Hydrogen Energy 2005;30:785–93.
[12] Stevens P, Van Der Sypt H, Vos PD, Ley JD. Comparative on hydrogenevolution from DL-lactate acetate and butyrate by different strains ofRhodopseudomonas capsulate in a new type of reactor. Biotechnol Lett1983;5(6):369–74.
[13] Tsygankov AA, Fedorov AS, Laurinavichene TV, Gogotov IN, Rao KK,Hall DO. Actual and potential rates of hydrogen photoproduction bycontinuous culture of the purple non-sulphur bacterium Rhodobactercapsulatus. Appl Microbiol Biotechnol 1998;49:102–7.
[14] Lee KS, Wu JF, Lo YS, Lo YC, Lin PJ, Chang JS. Anaerobichydrogen production with an efficient carrier-induced granular sludgebed bioreactor. Biotechnol Bioeng 2004;87:648–57.
[15] Kim MS, Baek JS, Yun YS, Sim SJ, Park S, Kim SC. Hydrogenproduction from Chlamydomonas reinhardtii biomass using a two-step conversion process: anaerobic conversion and photosyntheticfermentation. Int J Hydrogen Energy 2006;31(6):812–6.
[16] He D, Bultel Y, Magnin JP, Willison JC. Kinetic analysis ofphotosynthetic growth and photohydrogen production of two strains ofRhodobacter capsulatus. Enzyme Microb Technol 2006;38(1–2):253–9.
[17] Woo SJ, Lee JK, Kwon TJ, Kho YH. Sanop Miseangmul Hakhoechi1985;13:257.
[18] Montgomery DC. Design and analysis of experiments. 3rd ed., NewYork: Wiley; 1991.
[19] Shi XY, Yu HQ. Response surface analysis on the effect ofcell concentration and light intensity on hydrogen production byRhodopseudomonas capsulate. Process Biochem 2005;40(7):2475–81.
[20] Lee CM, Chen PC, Wang CC, Tung YC. Photohydrogen production usingpurple nonsulfur bacteria with hydrogen fermentation reactor effluent.Int J Hydrogen Energy 2002;27:1309–13.
[21] Ginkel SV, Sung S, Lay JJ. Biohydrogen production as a function ofpH and substrate concentration. Environ Sci Technol 2001;35:4726–30.
[22] Lin CY, Lay CH. Effects of carbonate and phosphate concentrations onhydrogen production using anaerobic sewage sludge microflora. Int JHydrogen Energy 2004;29:275–81.
[23] Gao YL, Ju XR, Jiang HH. Analysis of reduction of Geobacillusstearothermophilus spores treated with high hydrostatic pressure andmild heat in milk buffer. J Biotechnol 2006;125(3):351–60.
[24] Lay JJ, Lee YJ, Noike T. Feasibility of biological hydrogenproduction from organic fraction of municipal solid waste. Water Res1999;33(11):2579–86.
[25] Myers RH, Montgomery DC. Response surface methodology: processand product optimization using designed experiments. New York: Wiley;1995.

C.-Y. Chen et al. / International Journal of Hydrogen Energy 32 (2007) 940–949 949
[26] Lee KS, Lo YS, Lo YC, Lin PJ, Chang JS. H2 productionwith anaerobic sludge using activated-carbon supported packed-bedbioreactors. Biotechnol Lett 2003;25:133–8.
[27] Lee KS, Wu JF, Lo YS, Lo YC, Lin PJ, Chang JS. Operation strategiesfor biohydrogen production with a high-rate anaerobic granular sludgebed bioreactor. Enzyme Microb Technol 2004;35:605–12.
[28] Shi XY, Yu HQ. Continuous production of hydrogen from mixed volatilefatty acids with Rhodopseudomonas capsulate. Int J Hydrogen Energy2006;31(12):1641–7.
[29] Barbosa MJ, Rocha JMS, Tramper J, Wijffels RH. Acetate as a carbonsource for hydrogen production by photosynthetic bacteria. J Biotechnol2001;85(1):25–33.
[30] Mao XY, Miyake J, Kawamura S. Screening photosynthetic bacteriafor hydrogen production from organic acids. J Ferment Technol1986;64(3):245–9.