enhancement of systematic design processing by diagrams
TRANSCRIPT
Architectoni.ca © [2012], Copyright CCAAS Buthayna Hasan Eilouti, Architectoni.ca 2012, 1, 83-94
83
http://ccaasmag.org/ARCH
Enhancement of Systematic Design Processing by Diagrams
Buthayna Hasan Eilouti
Professor, Ph.D, Department of Architecture, Department of Interior Design Engineering, Prince Sultan
University, KSA. [email protected]
doi:10.5618/arch.2012.v1.n1.9 || Received: 23-04-2012, Accepted: 27-05-2012, Available online: 7-06-2012
Abstract
Diagrams play a significant role in most knowledge
presentation areas. This is especially the case in
disciplines concerned with conceptual design
where data visualization, processing, documenta-
tion and presentation require graphic illustration
to express their underlying tacit aspects. Despite
their significance, the visual tools available in the
toolbox of designers to help them apply generative
processes are extremely limited. This paper
introduces some conceptual and operative
diagrams that aim to aid in the visualization of
various stages of the design derivation and
development processes. The structure underlying
the proposed diagrams represents a basis for a
diagrammatic framework for architectural design-
ing that may help systematically induce form
development, organize design sequence and
externalize concept generative forces. The purpose
of this framework is not to dictate a specific
sequence of design, but rather to help designers
process their designs in ways more structured than
trial/error-based ones. The scope of the proposed
framework includes all phases of designing that
include the input, output, presentation and
assessment activities, with a focus on the core
design processing and form-making activities. To
test the applicability of this framework, it was
implemented to solve a real design problem in an
architectural design studio. The feedback of the
diagrammatic framework users was analyzed by a
survey about its implementation in comparison to
conventional design approaches. The results of this
empirical study are reported and discussed. The
results appear to support the role of diagrams in
the enhancement of designing and learning
processes. However, this contribution of diagrams
to designing and learning needs further applica-
tions in various design settings to assess its
limitations and strengths.
Keywords: Information visualization; Form
architecture; Visual studies; Design conception;
Operative diagram; Conceptual diagram; Design
process
1. Introduction: Diagrams in Design
Diagrams are essential modes of representation in
design communication, and tools of exploration in
design derivation. They concisely convey problem
interpretation, pre-design reasoning, problem solving,
design conception, form evolution, design processing
and product evaluation. They are widely used in most
design disciplines, and most significantly in fields
concerned with form making. The emphasis of this
paper will be on architectural design.
Many diagramming strategies and applications are
described in design and architectural literature. Some
focused on specific aspects of diagramming such as
the graphic representation of information and
knowledge conceptualization [e.g. 1-7]. Some other
research efforts were focused on representing the
spatial syntax as well as the formal and topological
relationships of design components [e.g. 8-9]. The
psychological and intellectual attributes of
diagramming were represented in some research
topics as well [e.g. 10-12].Other research examples
were more concerned with diagramming for reasoning
[e.g. 13-14], and analytical diagramming for the
concise encapsulation of information about contexts
of design problems [e.g. 15]. However, diagram
development as representative and operative tool and
diagram-driven methods for conceptual designing did
not receive enough attention of researchers. The focus
here will be on developing diagrams that graphically
and abstractly describe the forces, flows and
sequences that a designer may consider before and
during design processing. The diagrams developed in
this paper, in turn, from a basis for a diagrammatic
framework for design conception and processing that
may employ basic diagrams to induce the design
process.
Diagrams vary in their abstraction and symbolism
according to the phase of design sequence they are
applied in. They also vary according to many other
contextual factors such as the cultural and experiential
background of their senders and receivers. Diagrams
as modes of communication significantly contribute to
the practice and education of architectural design. For
example, Alexander [16] describes a diagram as the
starting point of design synthesis from which a design
gradually evolves through matching design
requirements to correspondent diagrams to eventually
Architectoni.ca © [2012], Copyright CCAAS Buthayna Hasan Eilouti, Architectoni.ca 2012, 1, 83-94
84
http://ccaasmag.org/ARCH
end up with a product that consolidates a tree of
diagrams. In addition, Laseau [17] describes diagrams
as abstract graphic language that consists of
vocabulary and grammatical rules to work out
problems and communicate solutions. Similarly,
Lockard [18] argues that diagramming can be used to
explore design solutions and to interact with visual
information. Other examples of diagram contribution
to design include their role in design creativity [e.g.
19], and their enhancement for design computing [e.g.
20].
Within the scope of this article, a diagram is
understood as a form of data visualization that
abstractly and graphically uses geometric elements
(e.g. lines, nodes, circles, rectangles and arrows) and
textual annotations to represent structure, hierarchy,
enclosure and/or sequence of design products, as well
as their related functions, processes and activities. It
helps transform raw data into knowledge by applying
metaphors that enable users to understand new
concepts in terms of familiar experiences. As such, a
diagram is basically a schematic drawing that may
contain text, symbols, geometric shapes and
directional arrows to describe conceptual, functional,
spatial, organizational, hierarchical, topological,
or/and sequential information. Its functions are
typically iterative, experimental, cognitive and
metaphorical, the framework of which embodies some
epistemological as well as ontological concepts about
design knowledge nature and building. Some of its
major goals are to extract, reduce, and explore
information. Other goals include the endeavor to
organize, analyze and synthesize ideas; and to
generate and manage design through visualizing
complex relationships in simplified minimalist graphic
forms.
Currently, there exist an extremely limited number
of diagram types in the toolbox of architecture
designers. These include bubble diagrams, functional
relationship matrices, spatial organization flowcharts,
and site analysis graphs. These are mostly devised for
analytical purposes. The deficiency is even greater in
the synthesis areas. Some efforts have been made to
incorporate insights from other fields to encode the
form assembly sequence in design. An example of
these efforts is the spatial development of finite state
automata for design process description [e.g. 21-23].
However, there is a continuous need for introducing
new visual aids in design processing, presentation and
visualization.
2. Research Design
New diagrams for design process and product
visualization are proposed and presented in this paper.
The research design consists of a theoretical research
and an empirical study. The first is used to develop the
proposed diagrams. The second is applied to test the
applicability of the proposed diagrams in real design
settings in general, and whether they can help novice
design learners organize their processing techniques in
particular.
The research assumptions include the ontological,
the epistemological and the methodological
assumptions. The first one is that design is the creative
translation of imagination and knowledge into
concrete components.
The concept assumed by the proposed diagrams in
the second assumption is that design knowledge is
acquired through a cognitive transformation of visual
data representations.
The third assumption is that designers externalize
their tacit knowledge through the implementation of
diagrammatic approaches to designing.
The diagrams proposed in this paper may function
as both operative and figurative aids. They aim to help
guide the actual process of designing in the former
type and describe data succinctly and visually in the
latter. It is hypothesized here that a diagram-aided
approach to designing improves design learning as
well as design knowledge building, implementation,
representation and evaluation.
3. Diagrams for the Representation of Design
Processing
In general, design can be developed through five
major inter-related, recursive and iterative phases.
These are 1) the data input and reasoning phase, 2) the
design development and processing phase, 3) the
designing output production phase, 4) the product
representation and documentation phase and finally 5)
the product performance assessment phase. The five
phases overlap as illustrated in Fig. 1 (a). The diagram
shown in Fig. 1 (a) illustrates how the five phases are
dependent on each other during both the forward cycle
of product evolution and backward cycle of product
evaluation. The functions of each are based on the
previous, but they are combined in cycles of revisions
and fine tuning. Within the process of designing, the
pre-design input sub-systems enhance the design
development and production subsystems which, in
turn, are necessary to conduct design documentation
and post-design performance simulation assessment.
Similarly, a post-design evaluation of a product helps
to inform a pre-design reasoning for a new design
problem and possible solutions. Although activities of
each phase represent prerequisite of the next, tasks
within them may overlap. In other words, a designer
does not have to wait for a phase to end in order to
start the next. S/he may find part of the reasoning
inspiring for a design concept, evaluate it and go back
to explore more layers of the problem interpretation
and solution. The diagram shown in (Fig. 1, b)
demonstrates an example of one of the subsystems,

Architectoni.ca © [2012], Copyright CCAAS Buthayna Hasan Eilouti, Architectoni.ca 2012, 1, 83-94
85
http://ccaasmag.org/ARCH
that is the pre-design data input and information
reasoning phase. This phase of design processing
itself most likely starts with the data search, location,
collection, preparation, investigation, classification,
interpretation and representation. This analytical
phase includes functional programming, site, clients
and other design stakeholders input reasoning, context
study, and case study analysis (Fig. 1, b). In the
programming phase, the design program is developed.
Its components and their space, finishing, furniture,
equipment, lighting and acoustic requirements are
planned. In the site and context analysis, the site and
its surroundings are analyzed according to their
spatial, environmental, social, cultural and natural
forces. In the case study analysis, previous design
solutions that are related partially or totally to the
problem at hand are studied and relevant information
are extracted from them as needed. In the
stakeholders’ input analysis, the requirements set by
the clients and other people involved in the project at
hand are considered and analyzed.
Figure 1. a: Design Processing Activities, b: Pre-Design Reasoning Activities.
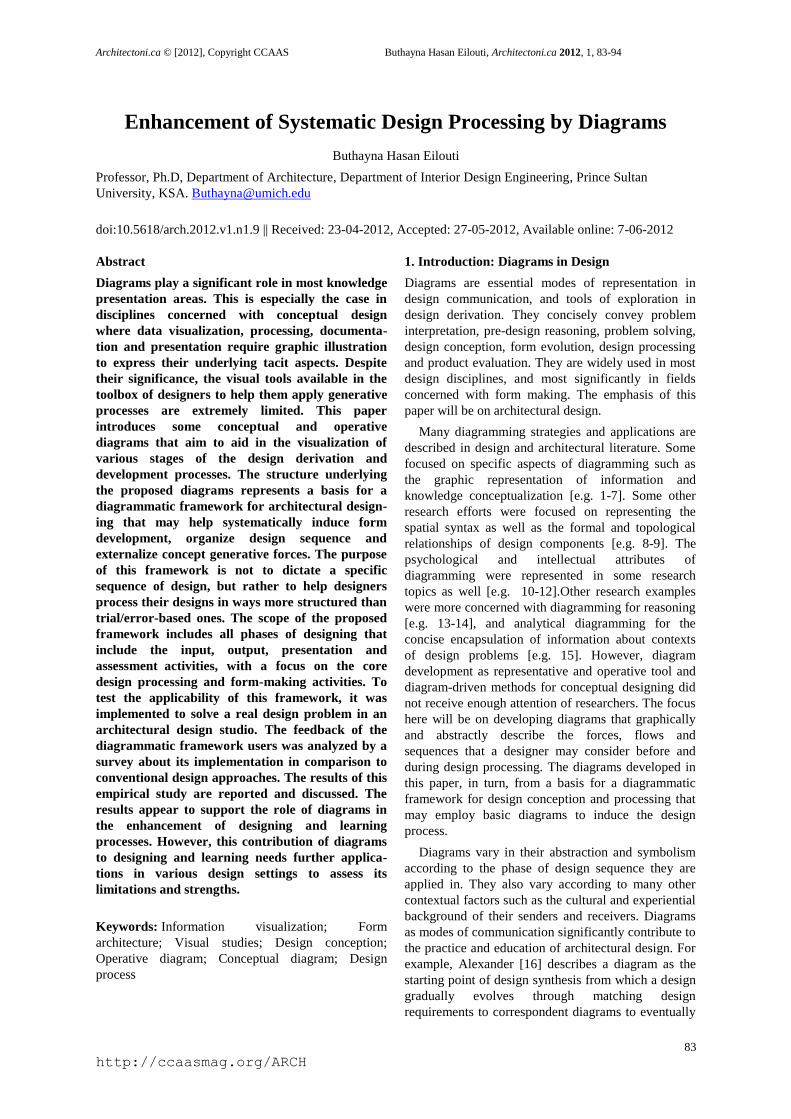
4. The Designing Loops. The designing cycle is
further demonstrated by Fig. 2. Its activities start with
the knowledge management stage, where data
collection, filtering, organization, analysis and
transformation into meaningful knowledge take place.
In this phase, the client’s and other stakeholders’ input
is most important. The tasks of this phase include, as
illustrated in Fig. 1(b), programming, case-study
analysis, contextual studies and input from potential
stakeholders. The next phase in the process is design
where formal, functional and contextual requirements
are considered and consolidated into a physical
product. The third phase is product evaluation where
physical and nonphysical environments are examined
to assess user experience, comfort level and code
compliance. The major player in the third stage is
external examiners, project client, potential users or
the designer him/herself who evaluates the design and
provides feedback that may revise the whole design
process. While the client deals with the input side, the
evaluator with the output side, the designer is the main
processor whose role moves between all players. The
keyword of the first phase is information. It is the
major axis about which pre-design knowledge
management activities are centered. The keyword of
the second phase is creativity which controls all the
major activities of design generation. The keyword of
the third phase is quality assurance where the major
axis is about testing the main tangible and intangible
attributes of the product and how they achieve a
satisfactory quality level. None of the phases is
deterministic and no clear demarcation can be
identified between them as they are all intertwined.
Following is a discussion for diagrams in each of the
three phases.
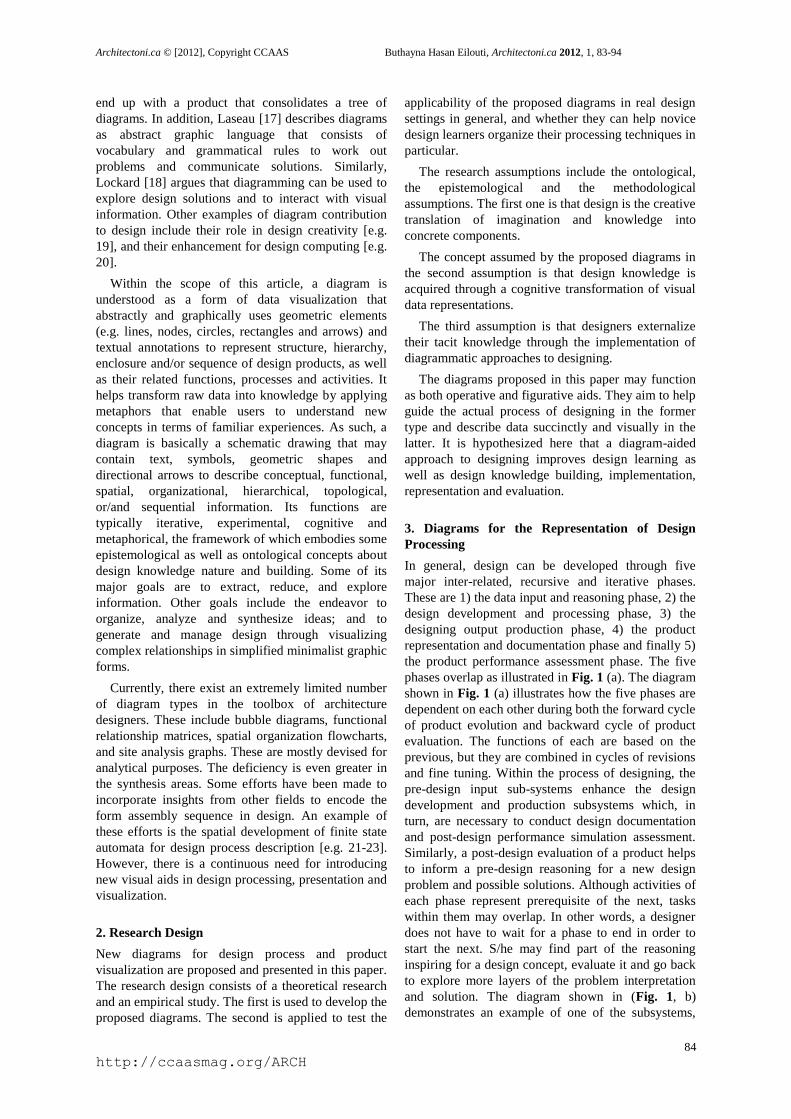
4.1 Diagrams for Design Knowledge Management.
The knowledge management and reasoning phase is
further illustrated in Fig. 3. As this figure shows, in
the programming stage, the functional components of
the design at hand are identified and their spatial and
environmental control requirements are analyzed. The
inter-relationships among the components are
investigated and classified according to their
strengths. Then, the components’ topological relations
are outlined and represented as a proportional bubble
diagram or other easy to comprehend formats.
Depending on the spatial grouping recommendations
that may result from the bubble diagram analysis,
program components can be clustered into major
functional or spatial groups, which can be represented
as an abstract zoning diagram. The result of this part
of the analysis and development is the generation of a
“functional solution” that is solely based on mapping
a solution to the program requirements. The generated
solution is context-free. It is a functional template that
needs further customizations to fit in specific location
and context.
a b
Architectoni.ca © [2012], Copyright CCAAS Buthayna Hasan Eilouti, Architectoni.ca 2012, 1, 83-94
86
http://ccaasmag.org/ARCH
Product Assesment Design Processing Precedent Analysis
Figure 2. Design Processing Cycle.
Figure 3: A Proposal for a Systematic Design Reasoning Process.
To customize the solution suggested by the
functional template, the context of the given design is
analyzed. This contextual fitting stage includes the
investigation of the site, climate and other tangible
and intangible contextual forces such as the physical,
social and cultural environment as well as the
geometric language of the surrounding urban
components. The study of the external forces should
personalize the abstract zoning that was produced by
the functional solution stage. Such a personalization
should produce a “spatial zoning on site” represented
three-dimensionally on the actual site settings. Up to
this point, the functional and the contextual impacts
are taken into consideration, but the formalistic
considerations are not yet considered. The urban
fitting and the architectural identity of the surrounding
buildings and outdoor spaces should be added at the
third stage to transform the previously generated
contextual spatial zoning diagram. Although the
diagram of Fig. 3 is shown as a sequential
development for organizational considerations, the
order of the three phases can be traded off as needed.
The sequence is in-deterministic and is proposed to
organize the work but not to restrict it.
Considerations of the human factors of design in
the functional solution phase are essential to the
solution processing. Examples of these that are related
to the functional component include: user needs,
anthropometrics and ergonomics, client’s and other
building stakeholders’ requirements, space flow,
circulation and behavior patterns and interior design
requirements. Examples of the context-related
considerations include: view, acoustics, thermal
comfort, orientation, sustainable solutions,
Architectoni.ca © [2012], Copyright CCAAS Buthayna Hasan Eilouti, Architectoni.ca 2012, 1, 83-94
87
http://ccaasmag.org/ARCH
environment-friendly considerations, accessibility,
interactive elements and social aspects of users.
Examples of aesthetics considerations include design
formal issues, cultural reflection, architectural style,
taste of internal and external users and viewers, and
relationship to temporal, demographic and geographic
factors.
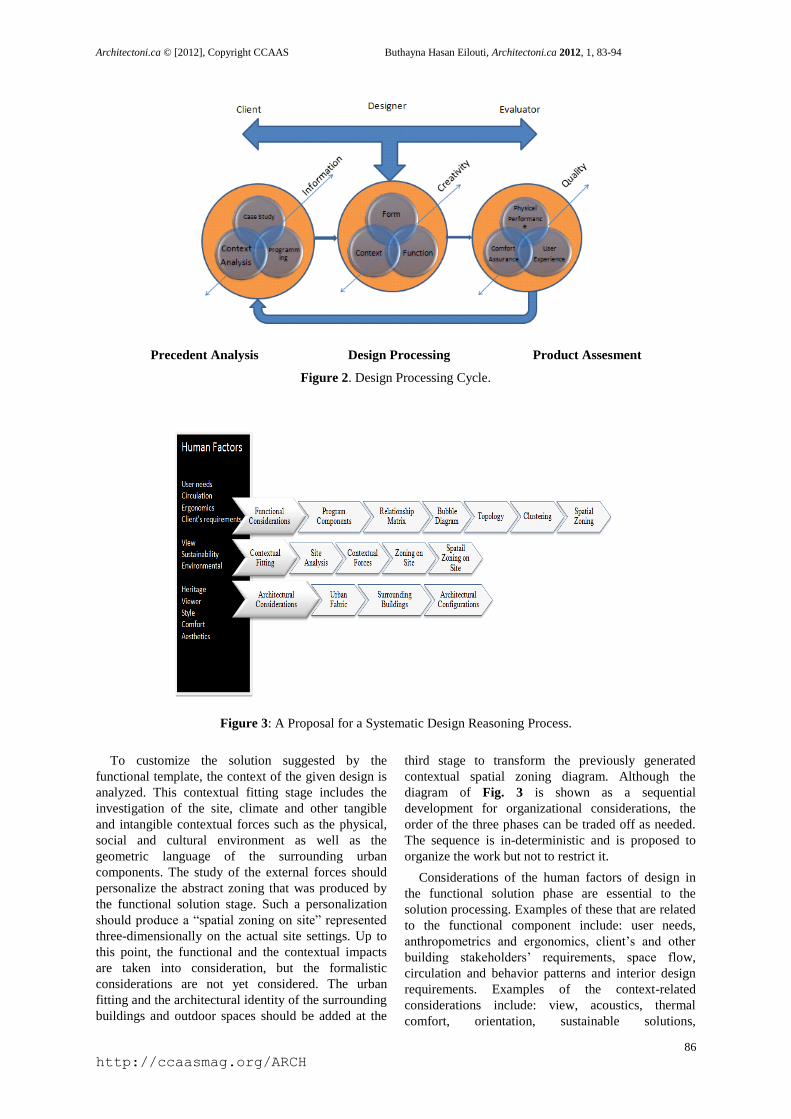
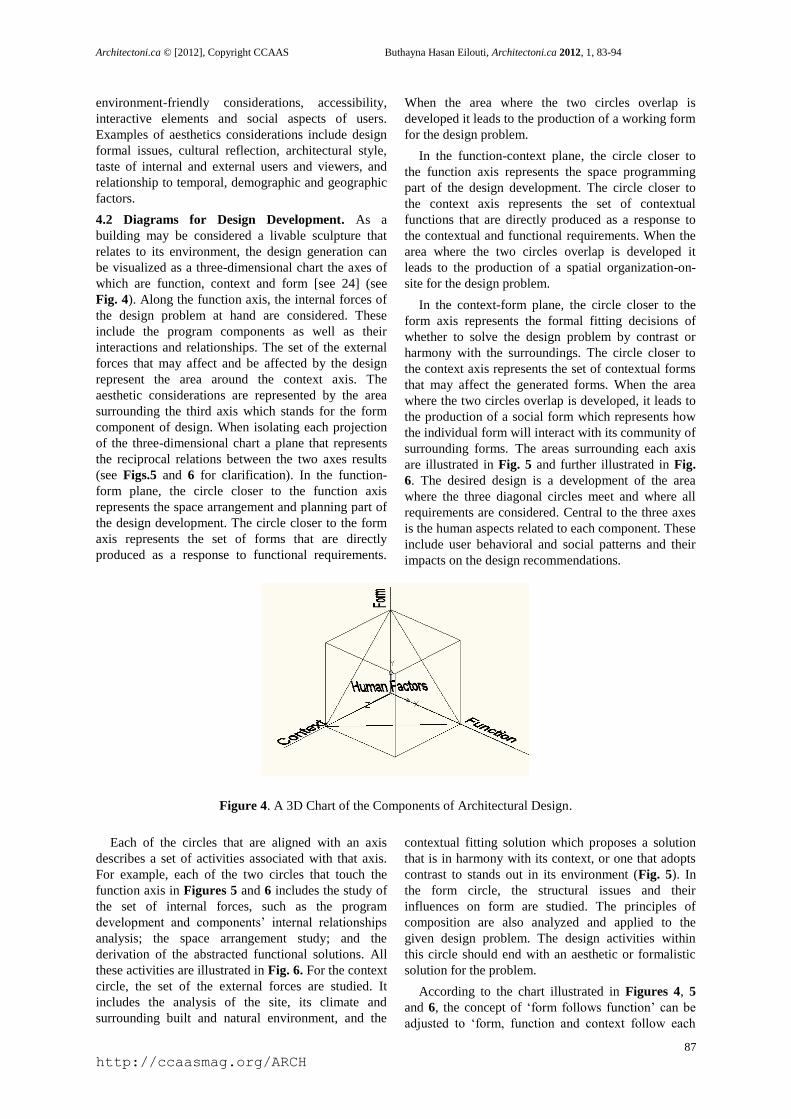
4.2 Diagrams for Design Development. As a
building may be considered a livable sculpture that
relates to its environment, the design generation can
be visualized as a three-dimensional chart the axes of
which are function, context and form [see 24] (see
Fig. 4). Along the function axis, the internal forces of
the design problem at hand are considered. These
include the program components as well as their
interactions and relationships. The set of the external
forces that may affect and be affected by the design
represent the area around the context axis. The
aesthetic considerations are represented by the area
surrounding the third axis which stands for the form
component of design. When isolating each projection
of the three-dimensional chart a plane that represents
the reciprocal relations between the two axes results
(see Figs.5 and 6 for clarification). In the function-
form plane, the circle closer to the function axis
represents the space arrangement and planning part of
the design development. The circle closer to the form
axis represents the set of forms that are directly
produced as a response to functional requirements.
When the area where the two circles overlap is
developed it leads to the production of a working form
for the design problem.
In the function-context plane, the circle closer to
the function axis represents the space programming
part of the design development. The circle closer to
the context axis represents the set of contextual
functions that are directly produced as a response to
the contextual and functional requirements. When the
area where the two circles overlap is developed it
leads to the production of a spatial organization-on-
site for the design problem.
In the context-form plane, the circle closer to the
form axis represents the formal fitting decisions of
whether to solve the design problem by contrast or
harmony with the surroundings. The circle closer to
the context axis represents the set of contextual forms
that may affect the generated forms. When the area
where the two circles overlap is developed, it leads to
the production of a social form which represents how
the individual form will interact with its community of
surrounding forms. The areas surrounding each axis
are illustrated in Fig. 5 and further illustrated in Fig.
6. The desired design is a development of the area
where the three diagonal circles meet and where all
requirements are considered. Central to the three axes
is the human aspects related to each component. These
include user behavioral and social patterns and their
impacts on the design recommendations.
Figure 4. A 3D Chart of the Components of Architectural Design.
Each of the circles that are aligned with an axis
describes a set of activities associated with that axis.
For example, each of the two circles that touch the
function axis in Figures 5 and 6 includes the study of
the set of internal forces, such as the program
development and components’ internal relationships
analysis; the space arrangement study; and the
derivation of the abstracted functional solutions. All
these activities are illustrated in Fig. 6. For the context
circle, the set of the external forces are studied. It
includes the analysis of the site, its climate and
surrounding built and natural environment, and the
contextual fitting solution which proposes a solution
that is in harmony with its context, or one that adopts
contrast to stands out in its environment (Fig. 5). In
the form circle, the structural issues and their
influences on form are studied. The principles of
composition are also analyzed and applied to the
given design problem. The design activities within
this circle should end with an aesthetic or formalistic
solution for the problem.
According to the chart illustrated in Figures 4, 5
and 6, the concept of ‘form follows function’ can be
adjusted to ‘form, function and context follow each

Architectoni.ca © [2012], Copyright CCAAS Buthayna Hasan Eilouti, Architectoni.ca 2012, 1, 83-94
88
http://ccaasmag.org/ARCH
other’ and Le Corbusier’s description of a house as ‘ a
machine for living’ can be adjusted to its
characterization as ‘a sub-machine that coordinates
with others for living’ to make it more responsive to
actual design problem settings. Within this updated
concept, decisions about form-making must be
contextualized to consider its connections with the
surroundings.
Figure 5. The Major Ingredients of Design Generation.
PROGRAM
SPACEARRANGEMENT
FUNCTIONALSOLUTION
CLIMATE
SITE &SURROUNDINGS
URBANFITTING
STRUCTURE
COMPOSITIONPRINCIPLES
AESTHETICSOLUTION
FUNCTION
Internal Forces
CONTEXT
External Forces
FORM
Aesthetics
Figure 6. The Structure and Sequence of Each Design Component.
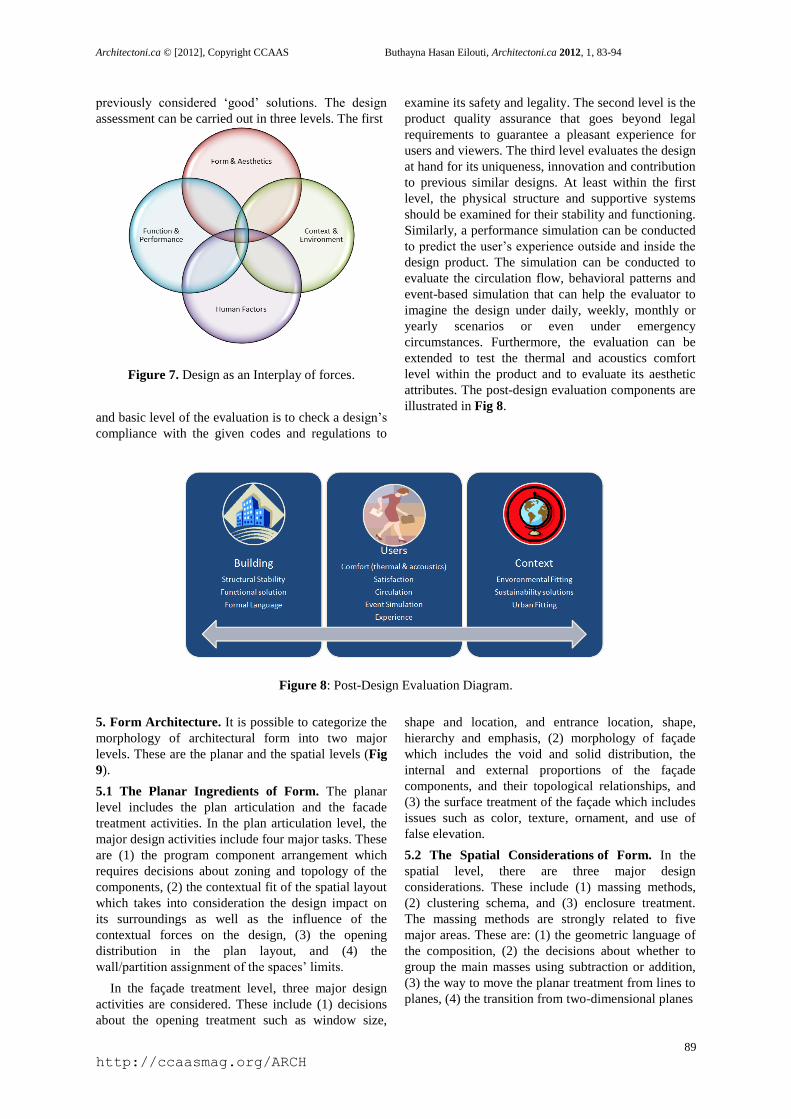
Design may be viewed as an informed response to
interplay between groups of forces. These include
external, internal and aesthetic forces (Fig. 7).
According to this view, forces in each category need
to be listed and assigned a weight according to their
impact. The interface between each pair of categories
represents the area where design issues that belong to
both categories should be considered. As a result of
this diagram consideration, a design should balance
various forces, prioritize them and optimize their
impacts on the generated design.
Since form is the main interface through which all
other design considerations are manifested and
communicated to users, it will be the focus of
discussion in the following section.
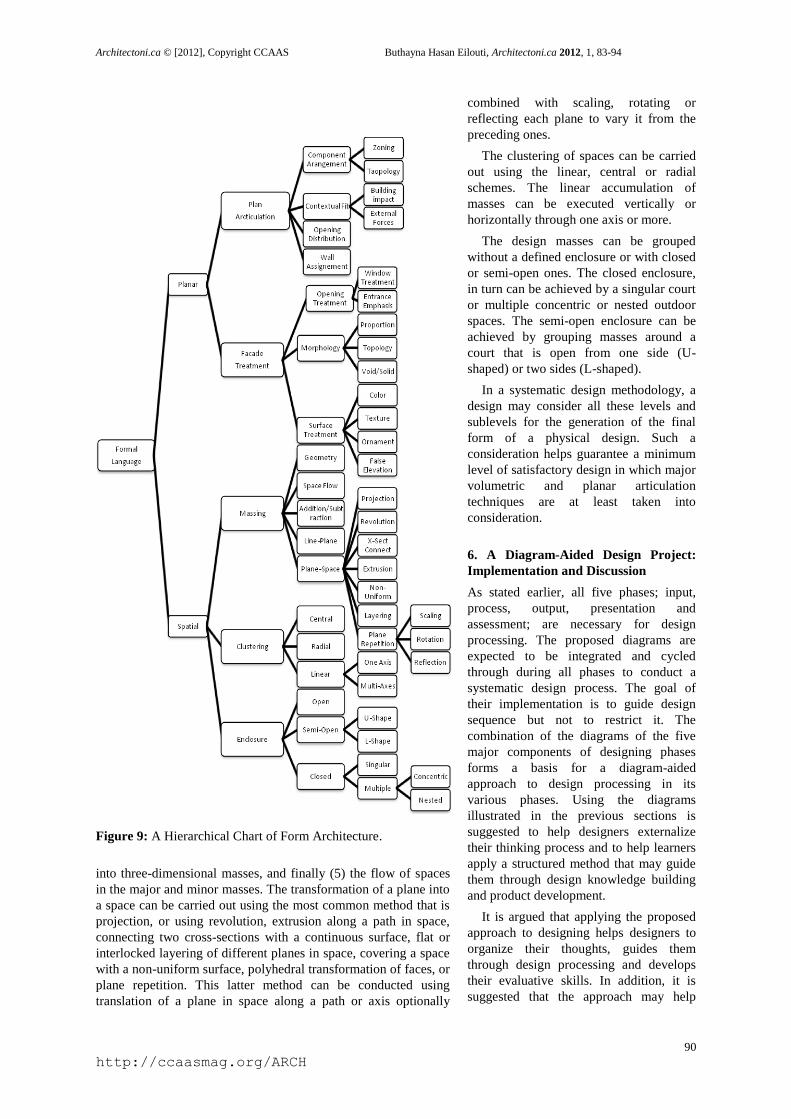
4.3 Diagrams for Design Assessment. Once a design
product is documented and presented, it is possible to
evaluate its satisfaction and compliance with the
preset criteria and goals. It may also be examined by
comparing it with other similar designs that are
Architectoni.ca © [2012], Copyright CCAAS Buthayna Hasan Eilouti, Architectoni.ca 2012, 1, 83-94
89
http://ccaasmag.org/ARCH
previously considered ‘good’ solutions. The design
assessment can be carried out in three levels. The first
Figure 7. Design as an Interplay of forces.
and basic level of the evaluation is to check a design’s
compliance with the given codes and regulations to
examine its safety and legality. The second level is the
product quality assurance that goes beyond legal
requirements to guarantee a pleasant experience for
users and viewers. The third level evaluates the design
at hand for its uniqueness, innovation and contribution
to previous similar designs. At least within the first
level, the physical structure and supportive systems
should be examined for their stability and functioning.
Similarly, a performance simulation can be conducted
to predict the user’s experience outside and inside the
design product. The simulation can be conducted to
evaluate the circulation flow, behavioral patterns and
event-based simulation that can help the evaluator to
imagine the design under daily, weekly, monthly or
yearly scenarios or even under emergency
circumstances. Furthermore, the evaluation can be
extended to test the thermal and acoustics comfort
level within the product and to evaluate its aesthetic
attributes. The post-design evaluation components are
illustrated in Fig 8.
Figure 8: Post-Design Evaluation Diagram.
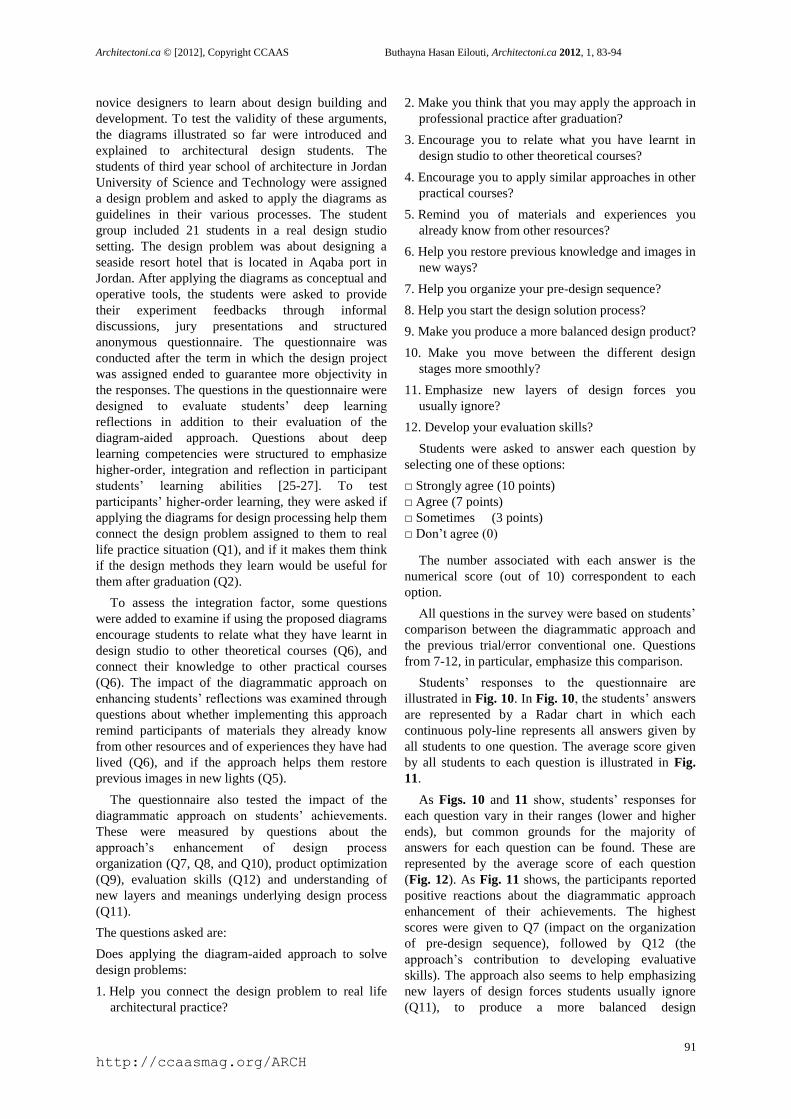
5. Form Architecture. It is possible to categorize the
morphology of architectural form into two major
levels. These are the planar and the spatial levels (Fig
9).
5.1 The Planar Ingredients of Form. The planar
level includes the plan articulation and the facade
treatment activities. In the plan articulation level, the
major design activities include four major tasks. These
are (1) the program component arrangement which
requires decisions about zoning and topology of the
components, (2) the contextual fit of the spatial layout
which takes into consideration the design impact on
its surroundings as well as the influence of the
contextual forces on the design, (3) the opening
distribution in the plan layout, and (4) the
wall/partition assignment of the spaces’ limits.
In the façade treatment level, three major design
activities are considered. These include (1) decisions
about the opening treatment such as window size,
shape and location, and entrance location, shape,
hierarchy and emphasis, (2) morphology of façade
which includes the void and solid distribution, the
internal and external proportions of the façade
components, and their topological relationships, and
(3) the surface treatment of the façade which includes
issues such as color, texture, ornament, and use of
false elevation.
5.2 The Spatial Considerations of Form. In the
spatial level, there are three major design
considerations. These include (1) massing methods,
(2) clustering schema, and (3) enclosure treatment.
The massing methods are strongly related to five
major areas. These are: (1) the geometric language of
the composition, (2) the decisions about whether to
group the main masses using subtraction or addition,
(3) the way to move the planar treatment from lines to
planes, (4) the transition from two-dimensional planes
Architectoni.ca © [2012], Copyright CCAAS Buthayna Hasan Eilouti, Architectoni.ca 2012, 1, 83-94
90
http://ccaasmag.org/ARCH
Figure 9: A Hierarchical Chart of Form Architecture.
into three-dimensional masses, and finally (5) the flow of spaces
in the major and minor masses. The transformation of a plane into
a space can be carried out using the most common method that is
projection, or using revolution, extrusion along a path in space,
connecting two cross-sections with a continuous surface, flat or
interlocked layering of different planes in space, covering a space
with a non-uniform surface, polyhedral transformation of faces, or
plane repetition. This latter method can be conducted using
translation of a plane in space along a path or axis optionally
combined with scaling, rotating or
reflecting each plane to vary it from the
preceding ones.
The clustering of spaces can be carried
out using the linear, central or radial
schemes. The linear accumulation of
masses can be executed vertically or
horizontally through one axis or more.
The design masses can be grouped
without a defined enclosure or with closed
or semi-open ones. The closed enclosure,
in turn can be achieved by a singular court
or multiple concentric or nested outdoor
spaces. The semi-open enclosure can be
achieved by grouping masses around a
court that is open from one side (U-
shaped) or two sides (L-shaped).
In a systematic design methodology, a
design may consider all these levels and
sublevels for the generation of the final
form of a physical design. Such a
consideration helps guarantee a minimum
level of satisfactory design in which major
volumetric and planar articulation
techniques are at least taken into
consideration.
6. A Diagram-Aided Design Project:
Implementation and Discussion
As stated earlier, all five phases; input,
process, output, presentation and
assessment; are necessary for design
processing. The proposed diagrams are
expected to be integrated and cycled
through during all phases to conduct a
systematic design process. The goal of
their implementation is to guide design
sequence but not to restrict it. The
combination of the diagrams of the five
major components of designing phases
forms a basis for a diagram-aided
approach to design processing in its
various phases. Using the diagrams
illustrated in the previous sections is
suggested to help designers externalize
their thinking process and to help learners
apply a structured method that may guide
them through design knowledge building
and product development.
It is argued that applying the proposed
approach to designing helps designers to
organize their thoughts, guides them
through design processing and develops
their evaluative skills. In addition, it is
suggested that the approach may help
Architectoni.ca © [2012], Copyright CCAAS Buthayna Hasan Eilouti, Architectoni.ca 2012, 1, 83-94
91
http://ccaasmag.org/ARCH
novice designers to learn about design building and
development. To test the validity of these arguments,
the diagrams illustrated so far were introduced and
explained to architectural design students. The
students of third year school of architecture in Jordan
University of Science and Technology were assigned
a design problem and asked to apply the diagrams as
guidelines in their various processes. The student
group included 21 students in a real design studio
setting. The design problem was about designing a
seaside resort hotel that is located in Aqaba port in
Jordan. After applying the diagrams as conceptual and
operative tools, the students were asked to provide
their experiment feedbacks through informal
discussions, jury presentations and structured
anonymous questionnaire. The questionnaire was
conducted after the term in which the design project
was assigned ended to guarantee more objectivity in
the responses. The questions in the questionnaire were
designed to evaluate students’ deep learning
reflections in addition to their evaluation of the
diagram-aided approach. Questions about deep
learning competencies were structured to emphasize
higher-order, integration and reflection in participant
students’ learning abilities [25-27]. To test
participants’ higher-order learning, they were asked if
applying the diagrams for design processing help them
connect the design problem assigned to them to real
life practice situation (Q1), and if it makes them think
if the design methods they learn would be useful for
them after graduation (Q2).
To assess the integration factor, some questions
were added to examine if using the proposed diagrams
encourage students to relate what they have learnt in
design studio to other theoretical courses (Q6), and
connect their knowledge to other practical courses
(Q6). The impact of the diagrammatic approach on
enhancing students’ reflections was examined through
questions about whether implementing this approach
remind participants of materials they already know
from other resources and of experiences they have had
lived (Q6), and if the approach helps them restore
previous images in new lights (Q5).
The questionnaire also tested the impact of the
diagrammatic approach on students’ achievements.
These were measured by questions about the
approach’s enhancement of design process
organization (Q7, Q8, and Q10), product optimization
(Q9), evaluation skills (Q12) and understanding of
new layers and meanings underlying design process
(Q11).
The questions asked are:
Does applying the diagram-aided approach to solve
design problems:
1. Help you connect the design problem to real life
architectural practice?
2. Make you think that you may apply the approach in
professional practice after graduation?
3. Encourage you to relate what you have learnt in
design studio to other theoretical courses?
4. Encourage you to apply similar approaches in other
practical courses?
5. Remind you of materials and experiences you
already know from other resources?
6. Help you restore previous knowledge and images in
new ways?
7. Help you organize your pre-design sequence?
8. Help you start the design solution process?
9. Make you produce a more balanced design product?
10. Make you move between the different design
stages more smoothly?
11. Emphasize new layers of design forces you
usually ignore?
12. Develop your evaluation skills?
Students were asked to answer each question by
selecting one of these options:
□ Strongly agree (10 points)
□ Agree (7 points)
□ Sometimes (3 points)
□ Don’t agree (0)
The number associated with each answer is the
numerical score (out of 10) correspondent to each
option.
All questions in the survey were based on students’
comparison between the diagrammatic approach and
the previous trial/error conventional one. Questions
from 7-12, in particular, emphasize this comparison.
Students’ responses to the questionnaire are
illustrated in Fig. 10. In Fig. 10, the students’ answers
are represented by a Radar chart in which each
continuous poly-line represents all answers given by
all students to one question. The average score given
by all students to each question is illustrated in Fig.
11.
As Figs. 10 and 11 show, students’ responses for
each question vary in their ranges (lower and higher
ends), but common grounds for the majority of
answers for each question can be found. These are
represented by the average score of each question
(Fig. 12). As Fig. 11 shows, the participants reported
positive reactions about the diagrammatic approach
enhancement of their achievements. The highest
scores were given to Q7 (impact on the organization
of pre-design sequence), followed by Q12 (the
approach’s contribution to developing evaluative
skills). The approach also seems to help emphasizing
new layers of design forces students usually ignore
(Q11), to produce a more balanced design

Architectoni.ca © [2012], Copyright CCAAS Buthayna Hasan Eilouti, Architectoni.ca 2012, 1, 83-94
92
http://ccaasmag.org/ARCH
Figure 10. Students' answers to structured
questionnaire.
Figure 11. Average score of the answers of each
question in the Diagrammatic Approach.
product (Q9), and to aid in initiating the design
process (Q8). Less positive responses were given to
the diagrams’ role in smoothing transition between
various stages (Q10). Moreover, the approach seems
to improve the deep learning abilities of the students.
It helps encourage learning by reflection (Q5 and Q6)
and integration between learned topics (Q3 and Q4).
Among these, the order from higher to lower score is
given to higher-order learning, then reflection,
followed by integration. The scores of the
achievement measures are higher than those of deep-
learning enhancement. As a result, the approach seems
promising in helping students process their design but
needs more development to more significantly
enhance deep-learning skills in general, and issues of
various topic integration in particular.
As illustrated in Fig. 11, responses to questions 7-
12 support the application of the diagrammatic
approach as opposed to the conventional one. In
addition, feedback from the project evaluators and
jury members emphasized that the projects reflected
deeper thinking than they used to see in other design
products for the same students.
Furthermore, in order to examine the impact of the
diagram-aided approach in design processing, a
comparison was made between the group of students
who applied it and another control group. The same
project was given to another section of 19 third year
Architectural students in the same college. The
approach they used was the trial/error where they
develop a design proposal based on initial analytical
stage. Then, based on instructors’ and jury members’
feedback, they modify the solution. Similar to the
other section, after the semester ended, students were
asked anonymously to respond to the same
questionnaire. A comparison between the average
scores for each question is illustrated in Fig.12.
Series 1 (dark bar): Trial/Error design development process responses
Series 2 (light bar): Diagrammatic approach design development process responses
Figure 12. A Comparative chart for survey responses to using two different design approaches.

Architectoni.ca © [2012], Copyright CCAAS Buthayna Hasan Eilouti, Architectoni.ca 2012, 1, 83-94
93
http://ccaasmag.org/ARCH
In Fig.12, Series 1 (dark bar) represents students’
responses to questionnaire about the Trial/Error
design development approach processing, and Series 2
(light bar) represents the responses for the
Diagrammatic approach design development process.
As Fig. 12 demonstrates, the proposed approach
seems to help in the higher learning aspects (where it
helps connect knowledge to real life settings), and in
reflection (where it helps connect design to other
courses and restore images from previous
experiences). It also seems to significantly help design
process organization and students’ self evaluation.
However, the proposed approach seems less helpful in
the smooth transition between different design
processing phases (Q10).Despite its limitation, the
proposed approach may contribute to scholarly efforts
in knowledge recycling of design processing [e.g. 28-
32], which, in turn, represents an area of research
where future extensions of this article may build on.
7. Conclusion
Diagrams represent significant design aid tools in the
toolbox of designers. There exist an extremely limited
number of design analysis and synthesis diagrams.
Added to this deficiency is that the known ones are
slowly –if ever- developing in most design areas.
Although diagrams help in the visualization of
designing in many knowledge areas, the scope of this
paper is focused on the architectural design domain. In
this paper, a set of operative and figurative diagrams
are proposed to help organize and inform the design
input and reasoning, processing, production and
assessment activities. Due to the special importance of
form in architectural design, additional diagrams for
form generation are introduced and discussed through
a design project that is assigned to architectural
students. The contribution of the diagrams as catalysts
for systematic design processing is tested in real
design studio settings. The results of the applicability
testing of the proposed diagrams support its positive
impact on improving users’ achievement and their
learning skills. Future extensions of this paper include
more testing in different practical and educational
settings. Another extension is that the diagrams can be
further developed into computer-aided design guides
that may vary in their sequences according to
designers’ input.
References:
[1] Goel V (1995) Sketches of Thought. Cambridge:
MIT Press
[2] Clayton M J (2000) Diagramming aesthetics:
modernism and architecture in the 21st century, in
M Anderson, P Cheng and V Haarslev (eds),
theory and application of diagrams: first
international conference, diagrams 2000
(Edinburgh, Scotland, 2000) New York:
Springer, pp 257-270
[3] Suwa M, Gero J and Purcell T (2000) Unexpected
discoveries and S-invention of design
requirements: important vehicles for a design
process, Design Studies, 21(6), pp 539-567
[4] Vidler A (2000) Diagrams of diagrams:
architectural abstraction and modern
representation, Representations (72), pp 1-20
[5] Stouffs R (2001) Visualizing information
structures and its impact on project teams: an
information architecture for the virtual AEC
company, Building Research and Information29
(3), pp 218-232
[6] Ching F (2003) Architectural Graphics (4th
ed)
New York: John Wiley
[7] Vande Moere A (2005) Form follows data: the
symbiosis between design and information
visualization, in Proceedings of CAADfutures,
(Vienna, Austria, 2005) Okk Verlag, pp.31-40
[8] Do E and Gross M D (2001) thinking with
diagrams in architectural design, Artificial
Intelligence, 15(1-2), pp 135-149
[9] Knoespel K J (2002) Diagrammatic
transformation of architectural
space, Philosophica 2002: Diagrams and the
Anthropology of space, 69, pp 11–36
[10] Cheng P, Lowe R, and Scaife M (2001) Cognitive
science approaches to understanding
diagrammatic representations, Artificial
Intelligence Review, 15(1-2), pp 79-94
[11] Shimojima A (2001) The graphic-linguistic
distinction: exploring alternatives, Artificial
Intelligence Review, 15(1-2), pp 95-114
[12] Stenning K and Lemon O (2001) Aligning logical
and psychological perspectives on diagrammatic
reasoning, Artificial Intelligence Review, 15(1-2),
pp 29-62
[13] Bauer M I and Johnson-Laird P N (1993) How
diagrams can improve reasoning, Psychological
Sciences, 4 (6), pp 372-378
[14] Chandrasekaran B, Glasgow J and Narayanan N
H (Eds) (1995) Diagrammatic Reasoning:
Cognitive and Computational Perspectives,
Cambridge: MIT Press
[15] White, E T (1983) Site Analysis: Diagramming
Information for Architectural Design, Tucson,
Arizona: architectural media ltd
[16] Alexander C (1966) Notes on the Synthesis of
Form, Cambridge: Harvard University Press
[17] Laseau P (1986) Graphic Problem Solving for
Architects and Builders (2nd
ed) Boston: Van
Nostrand Reinhold
Architectoni.ca © [2012], Copyright CCAAS Buthayna Hasan Eilouti, Architectoni.ca 2012, 1, 83-94
94
http://ccaasmag.org/ARCH
[18] Lockard W K (1977) Drawing as a Means to
Architecture, Tucson: Pepper Publishing
[19] Dorst K and Cross N (2001) Creativity in the
design process: co-evolution of problem
solution, DesignStudies, 22(5), pp 425-437
[20] Ervin S M (1990) Designing with diagrams: a
role for computing in design education and
exploration, in M McCullough, W J Mitchell and
P Purcell (Eds), The Electronic Design Studio:
Architectural Knowledge and Media in the
Computer Era, Cambridge: MIT Press, pp 107-
122
[21] Eilouti B H (2005) The representation of design
sequence by three-dimensional finite state
automata, in D. Zinn (Ed), The International
Institute of Informatics and Systemics(Orlando,
Florida, USA, 2005), pp. 273-277
[22] Eilouti B H (2007) “A Spatial Development of a
String Processing Tool for Encoding
Architectural Design Processing”, Art, Design
and Communication in Higher Education, Vol. 6,
No. 1, pp. 57-71
[23] Eilouti B H, and Vakalo E G (1999) Finite state
automata as form-generation and visualization
tools, in E. Banissi and F. Khosrowshahi (Eds.),
Information Visualization IV 99, Los Alamitos:
IEEE Computer Society, pp. 220-224
[24] Eilouti, Buthayna H (2010) Diagrams as Design
Catalysts, Design Principles and Practices: An
International Journal, Common Ground
Publishers, 4 (2) pp 217-231
[25] Beatie, V., Collins, B., and McInnes, B. (1997)
Deep and surface learning: A simple or simplistic
dichotomy? Accounting Education, 6(1), pp 1-12
[26] Biggs, J.B. (1989) Approaches to the
enhancement of tertiary teaching. Higher
Education Research and Development, 8, pp 7-25
[27] Tagg, J. (2003) The learning paradigm college.
Boston, MA: Anker.
[28] Eilouti, Buthayna H. (2009) Design Knowledge
Recycling Using Precedent-Based Analysis and
Synthesis Models, Design Studies,
Elsevier, Vol 30, No.4, pp. 340-368
[29] Eilouti, Buthayna H. (2011) Environmental
Knowledge in Engineering Design Processing,
The 5th International Conference on Knowledge
Generation, Communication and Management:
KGCM 2011, pp. 370-375, Orlando, Florida,
USA
[30] Eilouti, Buthayna H. (2009) Knowledge
Modeling and Processing in Architectural Design,
The 3rd International Conference on Knowledge
Generation, Communication and Management:
KGCM 2009 , Orlando, Florida, USA
[31] Eilouti, Buthayna H. (2007) Models for the
Management of Precedent-Based Information in
Engineering Design, in D. Zinn (ed), The
International Institute of Informatics and
Systemics WMSCI2007, pp. 321-326, Orlando,
Florida, USA
[32] Eilouti, B. H. (2012) Knowledge Recycling and
Transformation in Design, New Research on
Knowledge Management Models and Methods,
ISBN 978-953-51-0190-1 , pp. 65-76, INTECH