enhancement of nuclear medicine images using filtering
TRANSCRIPT

International Journal of Science and Research (IJSR) ISSN (Online): 2319-7064
Impact Factor (2012): 3.358
Volume 3 Issue 8, August 2014 www.ijsr.net
Licensed Under Creative Commons Attribution CC BY
Enhancement of Nuclear Medicine Images using Filtering Technique
Yousif Mohamed Y. Abdallah1, Eltayeb Wagiallah2
1Sudan University of Science and Technology, College of Medical Radiological Science,
Elbaladi Street, Khartoum 1908, Sudan
2Nuclear Medicine Department, Radiation and Isotopes Center of Khartoum (RICK), Elgaser Street, Khartoum, Sudan Abstract: These Nuclear medicine imaging is an incontestable vital tool for diagnosis, it provides in non-invasive manner the internal structure of the body to detect eventually diseases or abnormalities tissues. Unfortunately, the presence of speckle noise in these images affects edges and fine details which limit the contrast resolution and make diagnostic more difficult. The main objective of this study was to enhance of nuclear medicine images using Filtering Technique in order to evaluate contrast enhancement pattern in different nuclear medicine images such as grey color and to evaluate the usage of new nonlinear approach for contrast enhancement of soft tissues in Nuclear Medicine images. The data analyzed by using MatLab program to enhance the contrast within the soft tissues, the gray levels in both enhanced and unenhanced images and noise variance. The main techniques of enhancement used in this study were Top-hat filtering and Deblurring Images Using the Blind Deconvolution Algorithm. In this thesis, prominent constraints are firstly preservation of image's overall look; secondly preservation of the diagnostic content in the image and thirdly detection of small low contrast details in diagnostic content of the image. As shown in previously, state of the art methods provide non-convincing results. The new approach is funded on an attempt to interpret the problem from the view of blind source separation (BSS), thus to see the panoramic image as a simple mixture of (unwanted) background information, diagnostic information and noise. Keywords: Nuclear medicine, image processing, filter technique.
1. Introduction Nuclear Medicine is the section of science that utilizes the properties of radiopharmaceuticals in order to derive clinical information of the human physiology and biochemistry. The radiopharmaceutical follows its physiological pathway and it is concentrated on specific organs and tissues for short periods of time. Then, the patient is positioned under a nuclear medicine equipment which can detect the radiation emitted by the human body resulting in images of the biodistribution of the radiopharmaceutical. In Nuclear Medicine, there are two main methods of patient imaging, the imaging with Planar Imaging, Dynamic Imaging or SPECT and the PET. During the last decade, hybrid systems have been developed integrating the CT technique with either SPECT or PET resulting in SPECT/CT and PET/CT respectively. This chapter will concentrate on the implementation of MatLab code in gamma camera planar imaging, SPECT and SPECT/CT methods [1]. The gamma camera is composed of a collimator, a scintillator crystal usually made of NaI (or CsI), the photomultiplier tubes, the electronic circuits and a computer equipped with the suitable software to depict the nuclear medicine examinations. In planar imaging, the patient, having being delivered with the suitable radiopharmaceutical, is sited under the gamma camera head. The gamma camera head remains stable at a fixed position over the patient for a certain period of time, acquiring counts (disintegrations). These will constitute the radiopharmaceutical distribution image. The counts measured in a specific planar projection originate from the whole thickness of patient [2]
In SPECT, the gamma camera head rotates around the patient remaining at well-defined angles and acquiring counts for specific periods of time per angle. What makes SPECT a valuable tool in nuclear medicine is the fact that information in the three dimensions of the patient can be collected in a number of slices with a finite known volume (in voxels).Thus SPECT technique is used to display the radiopharmaceutical distribution in a single slice removing the contribution from the overlying and underlying tissues. In order to obtain the most accurate quantitative data from SPECT images, two issues that have to be resolved are the attenuation correction and the Compton scattering that the photons are undergone until reach and interact with the slice of interest tissues. As an examining organ has certain dimensions, each slice along the axis of the gamma camera has different distance from the detector. Thus, each photon experiences different attenuation. These two phenomena usually lead to distortion of the measured activity concentration [3][4]. The acquired data are processed in order to correct and compensate the undesired effect of these physical phenomena. The projection data of each slice constitute the sonogram. As a result, a series of sinograms is the files acquired. However, this kind of files needs reconstruction in order to get an image with diagnostic value. The most known reconstruction methods are the Filtered Back-Projection (FBP) and the Iterative methods. Advanced techniques of image processing and analysis find widespread use in medicine. In medical applications, image data are used to gather details regarding the process of patient imaging whether it is a disease process or a physiological process. Information provided by medical images has become a vital part of today’s patient care. The images generated in medical applications are complex and vary notably from application to application. Nuclear medicine images show characteristic information about the
Paper ID: 02015527 916

International Journal of Science and Research (IJSR) ISSN (Online): 2319-7064
Impact Factor (2012): 3.358
Volume 3 Issue 8, August 2014 www.ijsr.net
Licensed Under Creative Commons Attribution CC BY
physiological properties of the structures-organs. In order to have high quality medical images for reliable diagnosis, the processing of image is necessary. The scope of image processing and analysis applied to medical applications is to improve the quality of the acquired image and extract quantitative information from medical image data in an efficient and accurate way. MatLab (Matrix Laboratory) is a high performance interactive software package for scientific and engineering computation developed by MathWorks (Mathworks Inc., 2009). MatLab allows matrix computation, implementation of algorithms, simulation, plotting of functions and data, signal and image processing by the Image Processing Toolbox. It enables quantitative analysis and visualization of nuclear medical images of several modalities, such as Single Photon Emission Computed Tomography (SPECT), Positron Emission Tomography (PET) or a hybrid system (SPECT/CT) where a Computed Tomography system (CT) is incorporated to the SPECT system[5][6]. 2. Methods and Materials Contrast enhancement The command that implements contrast processing is the imadjust. Using this, the contrast in an image can be enhanced or degraded if needed. Moreover, a very useful result can be the inversion of colors, especially in greyscale images, where an object of interest can be efficiently outlined. The general function that implements contrast enhancement is the following: J=imadjust(I,[low_inhigh_in],[low_out high_out],gamma); While the function for color inversion is the following: J = imadjust(I,[0 1],[1 0],gamma); or J = imcomplement(I); Suppose that J, is the new image, I, is the initial image and gamma factor depicts the shape of the curve that describes the relationship between the values of I and J. If the gamma factor is omitted, it is considered to be 1. Filtering in MatLab Using Image Processing Toolbox design and filters for image data was implemented. Fspecial filter: For linear filtering, MatLab provides the fspecial command to generate some predefined common 2D filters. fspecial creates Gaussian filters using as following equition:
fspecial creates Laplacian filters using following equition:
fspecial creates Laplacian of Gaussian (LoG) filters using following equition:
This equition above describes the commands’ package that can be used for the application of the mean (average) filter in a SPECT slice for different convolution kernel sizes (for 3×3, 9×9, 25×25 average filter). h=fspecial('average', [3 3]); b=imfilter(a,h); figure, imshow(b); i=fspecial('average', [9 9]); c=imfilter(b,h); figure, imshow(c); j=fspecial('average', [25 25]); d=imfilter(c,h); figure, imshow(d); Image segmentation The image segmentation describes the process through which an image is divided into constituent parts, regions or objects in order to isolate and study separately areas of special interest. This process assists in detecting critical parts of a nuclear medicine image that are not easily displayed in the original image. 3. The results MatLab allows matrix computation, implementation of algorithms, simulation, plotting of functions and data, signal and image processing by the Image Processing Toolbox. It enables quantitative analysis and visualization of nuclear medical images of several modalities, such as Single Photon Emission Computed Tomography (SPECT), Positron Emission Tomography (PET) or a hybrid system (SPECT/CT) where a Computed Tomography system (CT) is incorporated to the SPECT system. The main objective of this study was to enhance of SPECT images using Filtering Technique in order to evaluate contrast enhancement pattern in different SPECT images such as grey color and to evaluate the usage of new nonlinear approach for contrast enhancement of soft tissues in SPECT images. Contrast enhancement The command that implements contrast processing is the imadjust. The general function that implements contrast enhancement is the following (figure 1):
Paper ID: 02015527 917

International Journal of Science and Research (IJSR) ISSN (Online): 2319-7064
Impact Factor (2012): 3.358
Volume 3 Issue 8, August 2014 www.ijsr.net
Licensed Under Creative Commons Attribution CC BY
RGB1 = imread('bonescan.jpg');
Figure 1: Shows Original bone scan image
RGB2=imadjust(RGB1,[.2,.3,0;.6,.7 1],[]); imshow(RGB1), figure, imshow(RGB2)
Figure 2: Shows bone scan image after adjustment
Filtering in MatLab Using Image Processing Toolbox design and filters for image data was implemented. Fspecial filter: For linear filtering, MatLab provides the fspecial command to generate some predefined common 2D filters. h = fspecial(type) creates a two-dimensional filter h of the specified type. fspecial returns h as a correlation kernel, which is the appropriate form to use with imfilter. I = imread('bonescan1.jpg'); subplot(2,2,1); imshow(I); title('Original Image'); (figure 3)
Figure 3: Shows original bone scan image
H = fspecial('motion',20,45); MotionBlur = imfilter(I,H,'replicate'); subplot(2,2,2); imshow(MotionBlur);title('Motion Blurred Image'); figure 3-4 H = fspecial('disk',10); blurred = imfilter(I,H,'replicate'); subplot(2,2,3); imshow(blurred); title('Blurred Image'); figure 3-4 H = fspecial('unsharp'); sharpened = imfilter(I,H,'replicate'); subplot(2,2,4);imshow(sharpened); title('Sharpened Image'); (figure 4)
Figure 4: Shows Fspecial filter
Convolution kernel filter a=imread(‘renogram.jpg’); (figure 5)
Figure 5: Shows Original Image
Paper ID: 02015527 918
International Journal of Science and Research (IJSR) ISSN (Online): 2319-7064
Impact Factor (2012): 3.358
Volume 3 Issue 8, August 2014 www.ijsr.net
Licensed Under Creative Commons Attribution CC BY
h=fspecial('average', [3 3]); b=imfilter(a,h); figure, imshow(b); (figure 6)
Figure 6: Shows [3 3] fspecial filter of figure 5
i=fspecial('average', [9 9]); c=imfilter(b,h); figure, imshow(c);(figure 7)
Figure 7: Shows [9 9] fspecial filter of figure 5
j=fspecial('average', [25 25]); d=imfilter(c,h); figure, imshow(d); (figure 8)
Figure 8: Shows [25 25] fspecial filter of figure 5
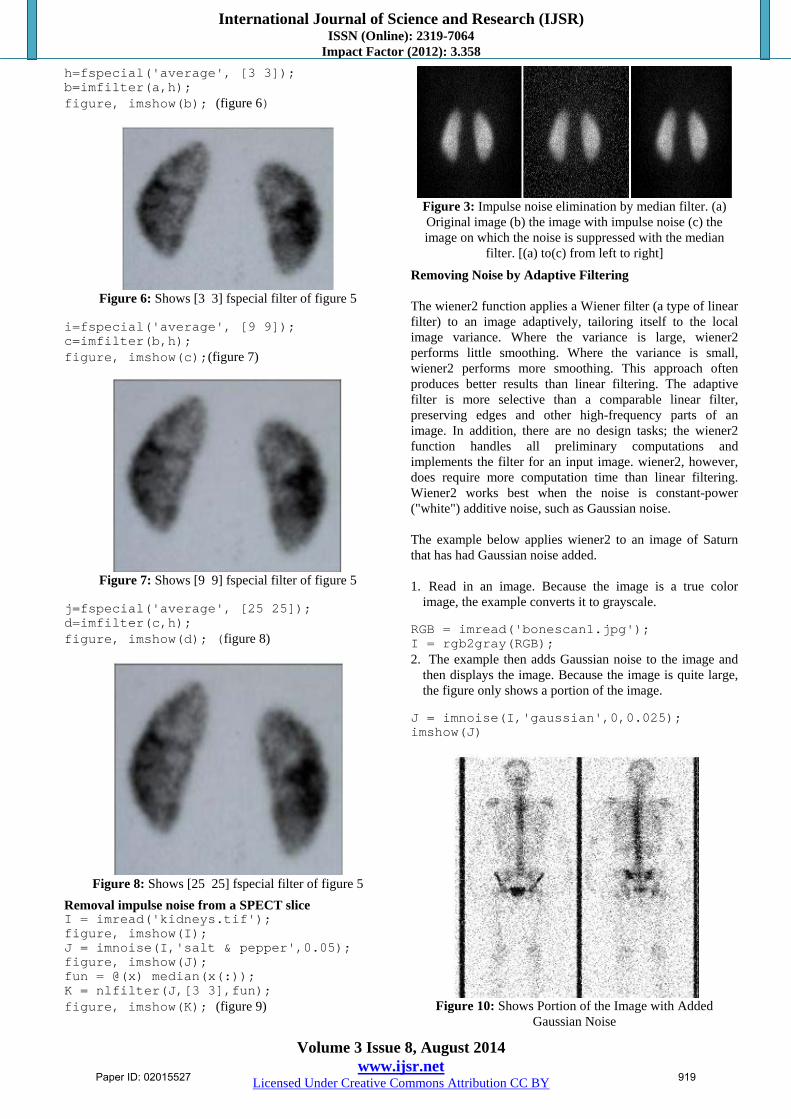
Removal impulse noise from a SPECT slice I = imread('kidneys.tif'); figure, imshow(I); J = imnoise(I,'salt & pepper',0.05); figure, imshow(J); fun = @(x) median(x(:)); K = nlfilter(J,[3 3],fun); figure, imshow(K); (figure 9)
Figure 3: Impulse noise elimination by median filter. (a) Original image (b) the image with impulse noise (c) the image on which the noise is suppressed with the median
filter. [(a) to(c) from left to right]
Removing Noise by Adaptive Filtering The wiener2 function applies a Wiener filter (a type of linear filter) to an image adaptively, tailoring itself to the local image variance. Where the variance is large, wiener2 performs little smoothing. Where the variance is small, wiener2 performs more smoothing. This approach often produces better results than linear filtering. The adaptive filter is more selective than a comparable linear filter, preserving edges and other high-frequency parts of an image. In addition, there are no design tasks; the wiener2 function handles all preliminary computations and implements the filter for an input image. wiener2, however, does require more computation time than linear filtering. Wiener2 works best when the noise is constant-power ("white") additive noise, such as Gaussian noise. The example below applies wiener2 to an image of Saturn that has had Gaussian noise added. 1. Read in an image. Because the image is a true color
image, the example converts it to grayscale.
RGB = imread('bonescan1.jpg'); I = rgb2gray(RGB); 2. The example then adds Gaussian noise to the image and
then displays the image. Because the image is quite large, the figure only shows a portion of the image.
J = imnoise(I,'gaussian',0,0.025); imshow(J)
Figure 10: Shows Portion of the Image with Added
Gaussian Noise
Paper ID: 02015527 919

International Journal of Science and Research (IJSR) ISSN (Online): 2319-7064
Impact Factor (2012): 3.358
Volume 3 Issue 8, August 2014 www.ijsr.net
Licensed Under Creative Commons Attribution CC BY
3. Remove the noise, using the wiener2 function. Again, the figure only shows a portion of the image
K = wiener2(J,[5 5]); figure, imshow(K)
Figure 11: Shows Portion of the Image with Noise Removed
by Wiener Filter 4. Conclusion For high diagnostic accuracy, nuclear medicine images must be of high contrast. The image contrast is principally affected by the radiopharmaceutical that is used for imaging and the scattered radiation. In general, it is desirable to use a radiopharmaceutical which has a high uptake within the target organ. Spatial resolution is defined as the ability of the imaging modality to reproduce the details of a non-uniform radioactive distribution. The spatial resolution is separated into intrinsic resolution (scintillator, photomultiplier tubes and electronic circuit) and system resolution. This was an experimental study to study the enhancement of ultrasound image using filtering technique using image processing technique (MatLab version R2009a). In addition to evaluate contrast enhancement pattern in different ultrasound images such as grey color in order to evaluate the usage of new nonlinear approach for contrast enhancement of soft tissues in panoramic images. The main techniques of enhancement used in this study was For linear filtering, MatLab provides the fspecial command to generate some predefined common 2D filters. h = fspecial (type) creates a two-dimensional filter h of the specified type. fspecial returns h as a correlation kernel, which is the appropriate form to use with imfilter. The results of this technique agreed the results of other authors who used non-linear filtering based methods to enhance the nuclear medicine images. The anther technique was Convolution kernel filter. Filtering is a technique for modifying or enhancing an image. For example, researchers can filter an image to emphasize certain features or remove other features. Image processing operations implemented with filtering include smoothing, sharpening, and edge enhancement. Filtering is a neighborhood operation, in which the value of any given pixel in the output image is determined by applying some algorithm to the values of the pixels in the neighborhood of the corresponding input pixel. A pixel's neighborhood is some set of pixels, defined by their locations relative to that pixel. Linear filtering is filtering in which the value of an output pixel is a linear
combination of the values of the pixels in the input pixel's neighborhood. So conclusion of this research that image processing and analysis applied to nuclear medicine images for diagnosis, improve the acquired image qualitatively as well as offer quantitative information data useful in patient’s therapy and care. Advanced techniques of image processing and analysis find widespread use in nuclear medicine. MatLab and Image Processing Toolbox enable both quantitative analysis and visualization of Nuclear Medicine images acquired as planar or angle projected images to reconstruct tomographic (SPECT, PET) slices and 3D volume surface rendering images. References
[1] A. Bonnaccorsi, “On the Relationship between Firm Size and Export Intensity, “Journal of International Business Studies, XXIII (4), pp. 605-635, 1992. (journal style)
[2] R. Caves, Multinational Enterprise and Economic Analysis, Cambridge University Press, Cambridge, 1982. (book style)
[3] Bidgood, D. & Horii, S., “Introduction to the ACR-NEMA DICOM standard“, RadioGraphics, Vol. 12, pp. (345-355), 1992
[4] Lehmann, T.M.; Gönner, C. & Spitzer, K.. “Survey: Interpolation Methods in Medical Image Processing“, IEEE Transactions on Medical Imaging, Vol.18, No.11, pp. 1049-1075, 1999
[5] Li, G. & Miller, R.W. “Volumetric Image Registration of Multi-modality Images of CT, MRI and PET, Biomedical Imaging“, Youxin Mao (Ed.), 2010.
[6] Lyra, M.; Sotiropoulos, M.; Lagopati, N. & Gavrilleli, M. “Quantification of Myocardial Perfusion in 3D SPECT images – Stress/Rest volume differences, Imaging Systems and Techniques (IST) “, 2010 IEEE International Conference on 1-2 July 2010, pp 31 – 35
[7] Lyra, M.; Striligas, J.; Gavrilleli, M. & Lagopati, N. (2010b). “Volume Quantification of I-123 DaTSCAN Imaging by MatLab for the Differentiation and Grading of Parkinsonism and Essential Tremor“, International Conference on Science and Social Research, Kuala Lumpur, Malaysia, December 5-7, 2010.
[8] Nailon, W.H. “Texture Analysis Methods for Medical Image Characterisation, Biomedical Imaging“, Youxin Mao (Ed.), ISBN: 978-953-307- 071-1, InTech, 2010,
[9] O’ Gorman, L.; Sammon, M. & Seul M.. “Practicals Algorithms for image analysis“, (second edition), Cambridge University Press, 2008
Author Profile
Yousif Mohamed Yousif Abdallah received the B.S., M.Sc. and PhD degrees and M.Sc. in nuclear medicine and Radiotherapy Technology from College of Medical radiological Science, Sudan University of
Science and Technology in 2005, 2009 and 2013, 2014, respectively. During 2006 up to date, he is staying in College of Medical radiological Science, Sudan University of Science and
Paper ID: 02015527 920

International Journal of Science and Research (IJSR) ISSN (Online): 2319-7064
Impact Factor (2012): 3.358
Volume 3 Issue 8, August 2014 www.ijsr.net
Licensed Under Creative Commons Attribution CC BY
Technology. He is now assistant professor, college registrar and Consultant Radiation Therapist. Eltayeb Wagallah received the B.S. in nuclear medicine technology, Rabat University and M.Sc. in nuclear medicine from College of Medical radiological Science, Sudan University of Science and Technology in 2005 and 2011, respectively. During 2006 up to date, he is staying in nuclear medicine department of Radiation and Isotopes Center of Khartoum (RICK).
Paper ID: 02015527 921