enhancement of noisy speech exploiting a gaussian modeling
TRANSCRIPT

Enhancement of Noisy Speech exploiting a Gaussian Modeling based Thresholdand a PDF Dependent Thresholding Function
Md Tauhidul Islama, Celia Shahnazb,
aDepartment of Electrical and Computer Engineering, Texas A M University, College Station, Texas, USA-77840bDepartment of Electrical and Electronic Engineering, Bangladesh University of Engineering and Technology, Dhaka-1000, Bangladesh
Abstract
This paper presents a speech enhancement method, where an adaptive threshold is statistically determined based on
Gaussian modeling of Teager energy (TE) operated perceptual wavelet packet (PWP) coe cients of noisy speech. In
order to obtain an enhanced speech, the threshold thus derived is applied upon the PWP coe cients by employing a
Gaussian pdf dependent custom thresholding function, which is designed based on a combination of modified hard
and semisoft thresholding functions. The e ectiveness of the proposed method is evaluated for car and multi-talker
babble noise corrupted speech signals through performing extensive simulations using the NOIZEUS database. The
proposed method is found to outperform some of the state-of-the-art speech enhancement methods not only at at high
but also at low levels of SNRs in the sense of standard objective measures and subjective evaluations including formal
listening tests.
Keywords: Speech enhancement, perceptual wavelet packet transform, Teager energy, Gaussian PDF,
Kullback-Liebler divergence
1. Introduction
Determination of a signal that is corrupted by additive or multiplicative noise has been of interest because of
its importance in both theoretical and practical field. The main interest is to recover the real signal from the noise-
mixed data received from microphone, ecg machine, radar, mobile phone or any other sound devices. Our aim is
to make the recreated signal close to the original one. The use of such operation has application in broad area
of speech communication applications, such as mobile telephony, speech coding and recognition, and hearing aid
devices [8, 18, 21].
Over the decades, several methods have been developed to solve the noise reduction and speech enhancement
problem. We can divide these methods in mainly three categories based on their domains of operation, namely
time domain, frequency domain and time-frequency domain. Time domain methods include the subspace approach
[11, 27], frequency domain methods include methods based on discrete cosine transform [5], spectral subtraction
Corresponding authorEmail address: (Celia Shahnaz)
Preprint submitted to Journal of LATEX Templates March 2, 2018

[4, 26], minimum mean square error (MMSE) estimator [10, 17], wiener filtering [1, 3] and time frequency-domain
methods involve the employment of the family of wavelets [2, 9, 12, 15, 25]. All these methods have their advantages
and disadvantages. Time domain methods like subspace method provide a tradeo between speech distortion and
residual noise. But they burden a heavy computational load and as a result real-time processing becomes very di cult
with these methods. On the other hand, frequency domain methods provide the advantage of real-time processing with
less computation load. Among frequency domain methods, the most prominent one is spectral subtraction method.
This method provides the facility of deducting noise from the noisy signal based on stationary nature of noise in speech
signals. But this method has a major drawback of producing an artifact named musical noise which is perceptually
disturbing, made of di erent tones of random frequencies and has an increasing variance. In the MMSE estimator, the
spectral amplitude of noisy signal is modified based on the minimum square error. A large variance as well as worst
performance in highly noisy situation are the main problems with this method. The main problem of wiener filter
based methods is the necessity of clean speech statistics for their implementation. Like MMSE estimators, wiener
filters also try to reach at an optimum solution depending on the error value between the computed signal with the real
one.
The methods which use thresholding as process of removing noise, Universal threshold [9], SURE[20], WPF[2]
and BayesShrink[6] are the prominent ones. In Universal thresholding method, a common threshold derived from
noise power is used to threshold the wavelet coe cients. SURE applies Steins Uncertainty and BayesShrink applies
Bayes principle to determine the threshold. WPF is modified version of Universal threshold method with speech and
silent frame detection ability.
In this paper, we develop a speech enhancement method in the PWP domain, where the threshold is determined by
performing the Gaussian statistical modeling of the TE operated PWP coe cients. Finally, a Gaussian pdf dependent
custom thresholding function is employed on the PWP coe cients to obtain an enhanced speech. This thresholding
function is designed based on the speech presence and absence probabilities so that it can perform thresholding
operation in order to preserve the speech coe cients as well as to remove the noise coe cients.
The paper is organized as follows. Section II presents the Proposed Method. Section III describes results. Con-
cluding remarks are presented in Section IV.
2. Proposed Method
The block diagram for the proposed method is shown in Fig. 1. It is seen from Fig. 1 that PWP transform is
first applied to each input speech frame. Then, the PWP coe cients are subject to TE approximation with a view to
determine a threshold value for performing thresholding operation in the WP domain. On using a custom thresholding
function, an enhanced speech frame is obtained via inverse perceptual wavelet packet (IPWP) transform.
2

Figure 1: Block diagram for the proposed method
2.1. Perceptual Wavelet Packet Transform
The key element of the perceptual wavelet packet (PWP) transform is the use of the mel warping function to
determine the WPT decomposition structure [24]. The main motivation behind using this transform is its ability to
decompose the signal according to human auditory system. At low frequency, where human auditory system can
di erentiate the pitches precisely, PWP transform decomposes the signal in finer bands. On the other hand, at high
frequency, PWP transform creates less number of bands as the human cochlea can not di erentiate small di erences
in high frequency.
The perceptual mel scale is a scale of pitches judged by listeners to be equal in distance from one another. The
conversion of frequency to mel is given in [24].
The clean and noise PWP coe cients in a subband of a noisy speech frame at an SNR of 5dB is plotted in Fig.
2(a). It is seen from this figure that for most of the coe cient indices, clean and noise PWP coe cients are not
separable. Based on similar analysis performed on many speech signals corrupted by di erent noises, it is found that
the time and frequency resolution provided by PWP transform is not su cient to separate PWP coe cients of clean
speech from that of noise even at a high SNR of 5dB. Since, TE operator has better time and frequency resolution
[16], it can be very useful in handling noise. Therefore, we apply discrete time TE operator on the PWP coe cients.
3
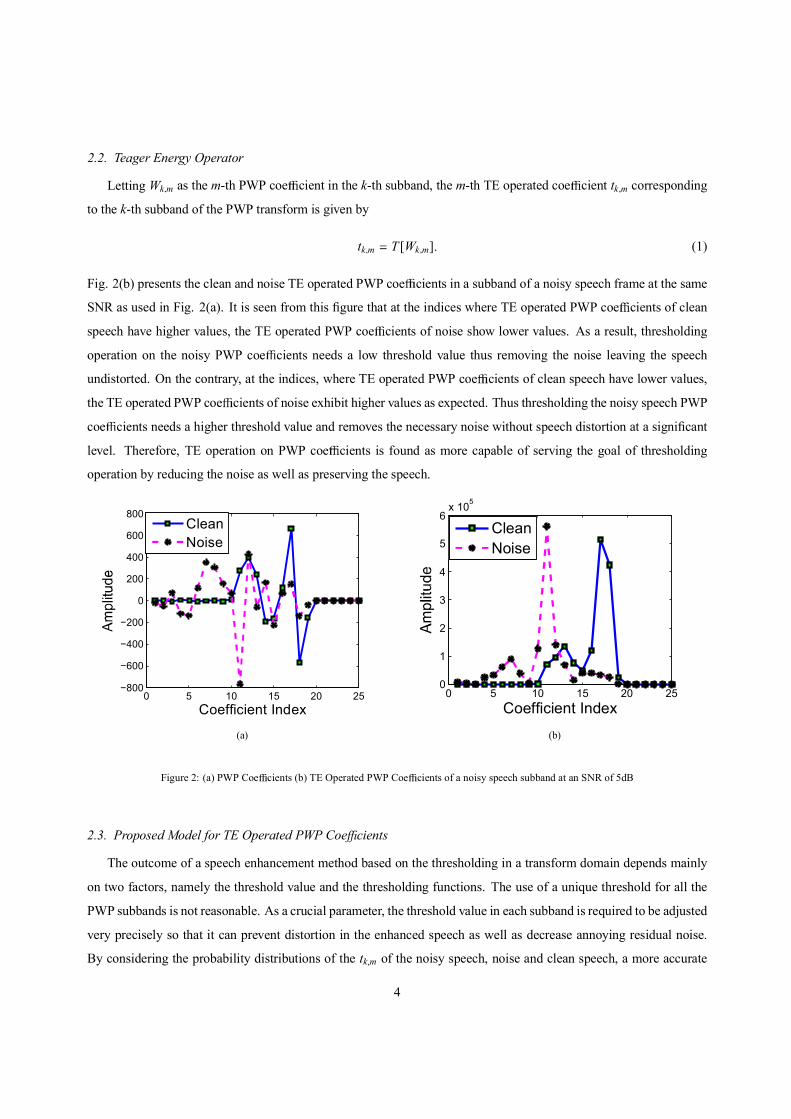
2.2. Teager Energy Operator
Letting Wk m as the m-th PWP coe cient in the k-th subband, the m-th TE operated coe cient tk m corresponding
to the k-th subband of the PWP transform is given by
tk m T [Wk m] (1)
Fig. 2(b) presents the clean and noise TE operated PWP coe cients in a subband of a noisy speech frame at the same
SNR as used in Fig. 2(a). It is seen from this figure that at the indices where TE operated PWP coe cients of clean
speech have higher values, the TE operated PWP coe cients of noise show lower values. As a result, thresholding
operation on the noisy PWP coe cients needs a low threshold value thus removing the noise leaving the speech
undistorted. On the contrary, at the indices, where TE operated PWP coe cients of clean speech have lower values,
the TE operated PWP coe cients of noise exhibit higher values as expected. Thus thresholding the noisy speech PWP
coe cients needs a higher threshold value and removes the necessary noise without speech distortion at a significant
level. Therefore, TE operation on PWP coe cients is found as more capable of serving the goal of thresholding
operation by reducing the noise as well as preserving the speech.
0 5 10 15 20 25−800
−600
−400
−200
0
200
400
600
800
Coefficient Index
CleanNoise
(a)
0 5 10 15 20 250
1
2
3
4
5
6x 10⁵
Coefficient Index
CleanNoise
(b)
Figure 2: (a) PWP Coe cients (b) TE Operated PWP Coe cients of a noisy speech subband at an SNR of 5dB
2.3. Proposed Model for TE Operated PWP Coe cients
The outcome of a speech enhancement method based on the thresholding in a transform domain depends mainly
on two factors, namely the threshold value and the thresholding functions. The use of a unique threshold for all the
PWP subbands is not reasonable. As a crucial parameter, the threshold value in each subband is required to be adjusted
very precisely so that it can prevent distortion in the enhanced speech as well as decrease annoying residual noise.
By considering the probability distributions of the tk m of the noisy speech, noise and clean speech, a more accurate
4

threshold value can be obtained using a suitable pattern matching scheme or similarity measure. Since speech is a
time-varying signal, it is di cult to realize the actual probability distribution function (pdf) of speech or its tk m. As an
alternative to formulate a pdf of the of speech, we can easily formulate the histogram of its tk m and can approximate
the histogram by a reasonably close pdf namely Gaussian distribution. For the tk ms in a subband of a noisy speech
frame, the empirical histogram along with the Gaussian distributions are superimposed in Fig. 3, 4 and 5 in presence
of car noise at SNRs of 15, 0 and 15 dB. From this figure, it is obvious that Gaussian distribution fits the empirical
histogram very finely. Similar analysis results are obtained for empirical histogram and Gaussian distribution of TE
operated noise PWP coe cients at the same SNRs as used in Fig. 3, 4 and 5 and are shown in Fig. 6, 7 and 8.
Figure 3: Empirical histogram and Gaussian distribution of TE operated PWP coe cients of noisy speech at SNR of 15 dB
Figure 4: Empirical histogram and Gaussian distribution of TE operated PWP coe cients of noisy speech at SNR of 0 dB
The e ciency of the fitting of the data with the Gaussian distribution can also be proved through objective index
Normalized Mean Square Error (NMSE), which is calculated by (2).
NMS E1N
N
i 1(yi xi
yi)2
(2)
where yi is the Gaussian fitted data, xi is the empirical data and N is the total number of data points.
5
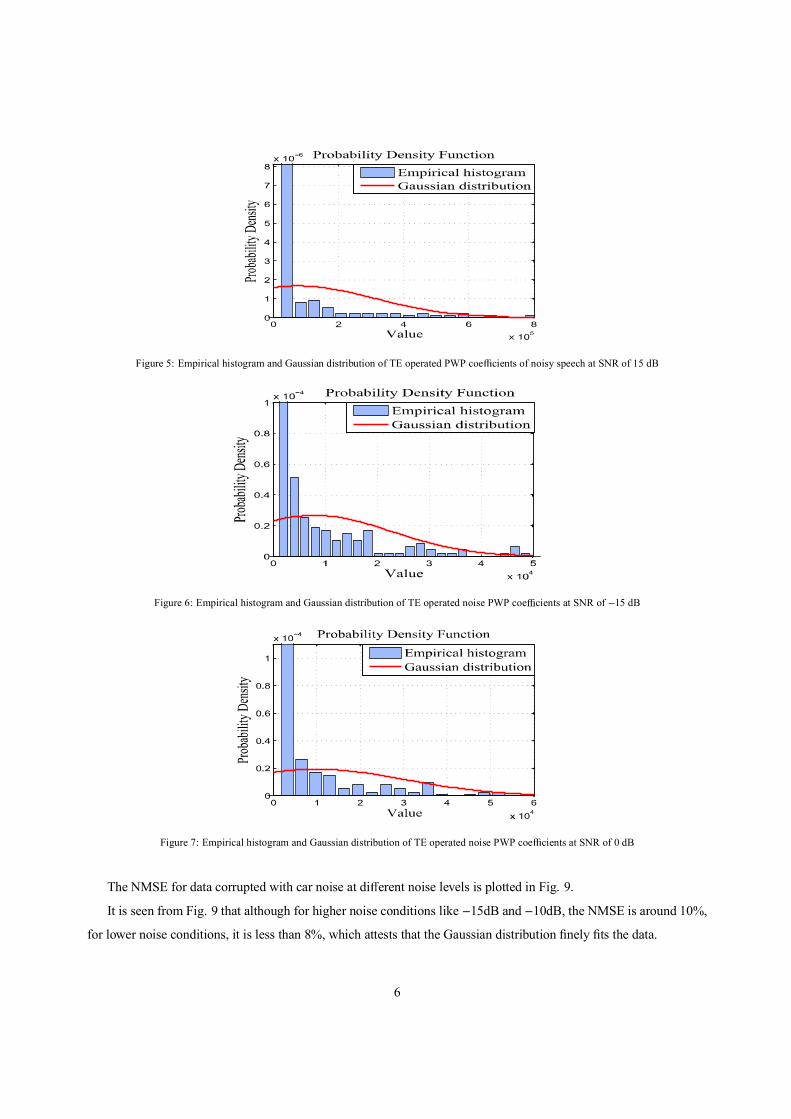
Figure 5: Empirical histogram and Gaussian distribution of TE operated PWP coe cients of noisy speech at SNR of 15 dB
Figure 6: Empirical histogram and Gaussian distribution of TE operated noise PWP coe cients at SNR of 15 dB
Figure 7: Empirical histogram and Gaussian distribution of TE operated noise PWP coe cients at SNR of 0 dB
The NMSE for data corrupted with car noise at di erent noise levels is plotted in Fig. 9.
It is seen from Fig. 9 that although for higher noise conditions like 15dB and 10dB, the NMSE is around 10%,
for lower noise conditions, it is less than 8%, which attests that the Gaussian distribution finely fits the data.
6
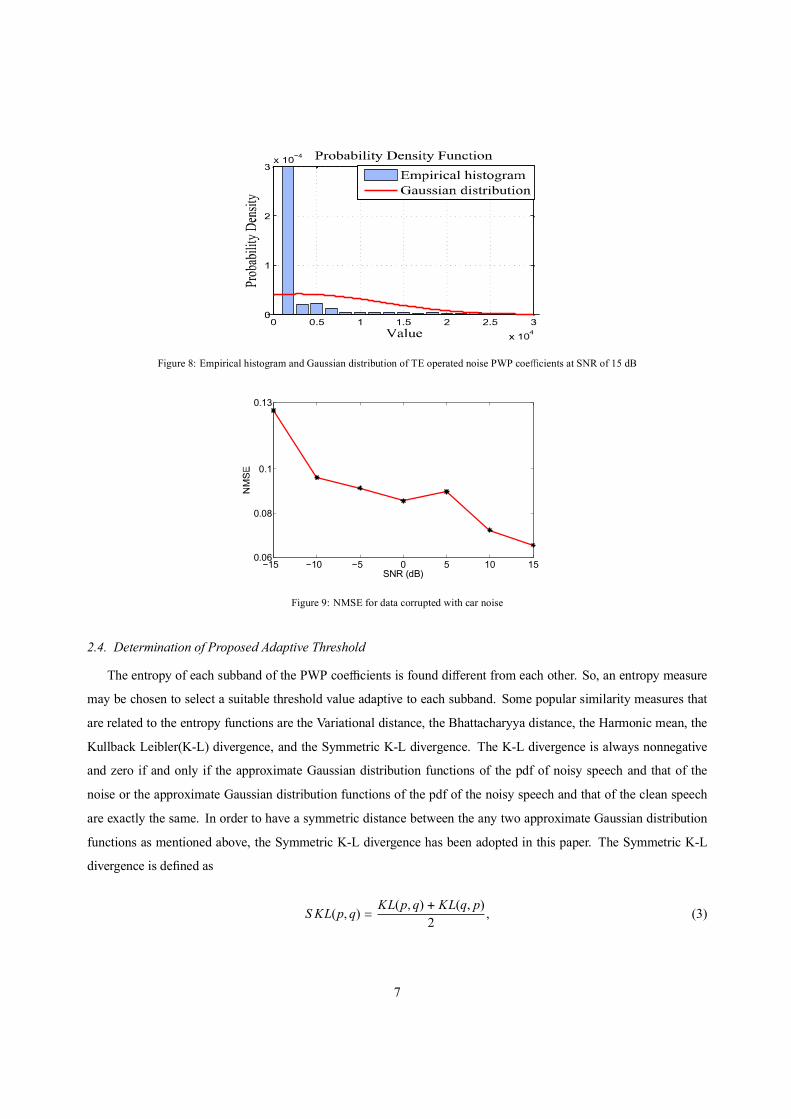
Figure 8: Empirical histogram and Gaussian distribution of TE operated noise PWP coe cients at SNR of 15 dB
−15 −10 −5 0 5 10 150.06
0.08
0.1
0.13
SNR (dB)
Figure 9: NMSE for data corrupted with car noise
2.4. Determination of Proposed Adaptive Threshold
The entropy of each subband of the PWP coe cients is found di erent from each other. So, an entropy measure
may be chosen to select a suitable threshold value adaptive to each subband. Some popular similarity measures that
are related to the entropy functions are the Variational distance, the Bhattacharyya distance, the Harmonic mean, the
Kullback Leibler(K-L) divergence, and the Symmetric K-L divergence. The K-L divergence is always nonnegative
and zero if and only if the approximate Gaussian distribution functions of the pdf of noisy speech and that of the
noise or the approximate Gaussian distribution functions of the pdf of the noisy speech and that of the clean speech
are exactly the same. In order to have a symmetric distance between the any two approximate Gaussian distribution
functions as mentioned above, the Symmetric K-L divergence has been adopted in this paper. The Symmetric K-L
divergence is defined as
S KL(p q)KL(p q) KL(q p)
2(3)
7

where p and q are the two approximate Gaussian pdfs calculated from the corresponding histograms each having N
number of bins and KL(p q) is the K-L divergence given by
KL(p q)N
i 1
pi(tk m)lnpi(tk m)qi(tk m)
(4)
In (4), pi(tk m) is the pdf of tk m of noisy speech given by
pi(tk m)ni
Nc(5)
where ni is number of coe cients in i-th bin and Nc total number of coe cients in each subband. Similarly, the
approximate Gaussian pdf of the tk m of the noise and that of the tk m of the clean speech can be estimated following (5)
and denoted by qi(tk m) and ri(tk m), respectively. Below a certain value of threshold , the symmetric K-L divergence
between pi(tk m) and qi(tk m) is approximately zero, i.e.,
S KL(pi(tk m) qi(tk m)) 0 (6)
By solving the above equation, we get a value of following [23],
(k) n(k)k
2( k2k ) ln( 1
1k) (7)
where k is segmental SNR of subband k defined as
k
2r (k)2n(k)
(8)
In this equation, 2r (k) is the signal power at k subband and 2
n(k) is the noise power at k subband.
2.5. Proposed Thresholding Function
We propose a pdf dependent custom thresholding function derived from the modified hard and the semisoft thresh-
olding functions [22]. Representing (k) derived from (7) as 1(k) and letting 2(k) 2 1(k), the proposed threshold-
ing function is developed as
(Yk m)PCT
(k m)sgn(Yk m) G if (Yk m) 1(k)
Yk m if (Yk m) 2(k)
(1 (k m)) 1 (k m) 2 otherwise
(9)
where
G(Yk m) (k m)
[ 1(k)]( (k m) 1) (10)
1 sgn(Yk m) 2(k)(Yk m) 1(k)
2(k) 1(k)(11)
8

2 Yk m (12)
In (9), (Yk m)PCT stands for the PWP coe cients thresholded by the proposed custom thresholding function expressed
from (9)-(12) and two shape parameters of the proposed thresholding function are represented by (k m) and (k m).
The comparison of the proposed custom thresholding function with the conventional modified hard and semisoft
thresholding functions is shown in Fig. 10. In the region between 1 and 2, this figure demonstrates the flexibility
of the proposed thresholding operation in a sense that it can be viewed as (1 (k m))(Yk m)S S (k m)(Yk m)MH
which is a linear combination of the modified hard and the semisoft thresholding function. Here, (Yk m)MH stands
for the PWP coe cients thresholded by the modified hard thresholding function and (Yk m)S S represents the PWP
coe cients thresholded by the semisoft thresholding function. Unlike these functions, depending on the value of
shape parameter (k m), it can be verified from (9) that the proposed thresholding function gets the following forms,
lim(k m) 0
(Yk m)PCT (Yk m)S S
lim(k m) 1
(Yk m)PCT (Yk m)MH
Figure 10: Input Output Relation for semisoft, modified hard and proposed custom thresholding function
2.5.1. E ect of the Shape Parameters on the Proposed Thresholding Function
In order to realize the e ect of (k m) and (k m) on the proposed thresholding function, the variation of (k m)
and (k m) for di erent values of R(k m)Q(k m) are obtained using (13) and (14) and plotted in Fig.11. From this figure, it is
seen that for a large value of R(k m)Q(k m) , (k m) becomes high, i.e., close to 1 that increases the probability of Yk m to be a
speech coe cient. In this case, (Yk m)PCT acts like (Yk m)MH as expected, since if a coe cient has a high probability to
be speech should not be a thresholded to zero before 1(k) and should be unchanged after 1(k) as done in modified
9
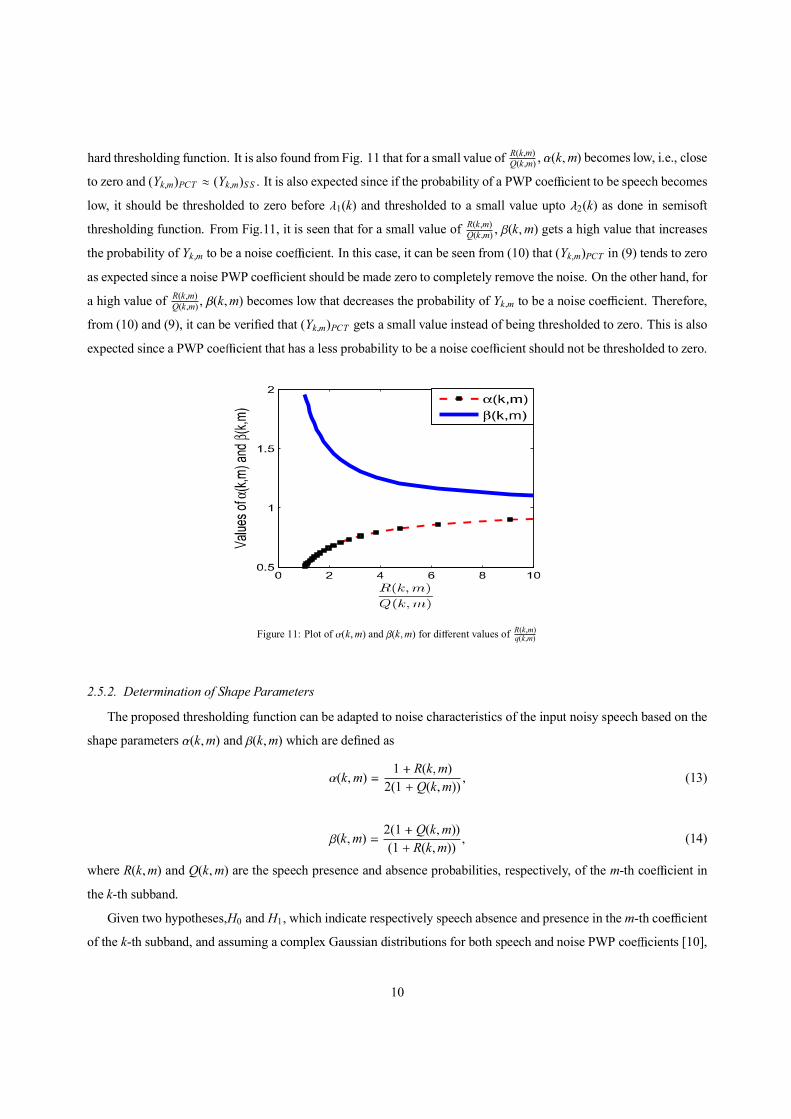
hard thresholding function. It is also found from Fig. 11 that for a small value of R(k m)Q(k m) , (k m) becomes low, i.e., close
to zero and (Yk m)PCT (Yk m)S S . It is also expected since if the probability of a PWP coe cient to be speech becomes
low, it should be thresholded to zero before 1(k) and thresholded to a small value upto 2(k) as done in semisoft
thresholding function. From Fig.11, it is seen that for a small value of R(k m)Q(k m) , (k m) gets a high value that increases
the probability of Yk m to be a noise coe cient. In this case, it can be seen from (10) that (Yk m)PCT in (9) tends to zero
as expected since a noise PWP coe cient should be made zero to completely remove the noise. On the other hand, for
a high value of R(k m)Q(k m) , (k m) becomes low that decreases the probability of Yk m to be a noise coe cient. Therefore,
from (10) and (9), it can be verified that (Yk m)PCT gets a small value instead of being thresholded to zero. This is also
expected since a PWP coe cient that has a less probability to be a noise coe cient should not be thresholded to zero.
Figure 11: Plot of (k m) and (k m) for di erent values of R(k m)q(k m)
2.5.2. Determination of Shape Parameters
The proposed thresholding function can be adapted to noise characteristics of the input noisy speech based on the
shape parameters (k m) and (k m) which are defined as
(k m)1 R(k m)
2(1 Q(k m))(13)
(k m)2(1 Q(k m))(1 R(k m))
(14)
where R(k m) and Q(k m) are the speech presence and absence probabilities, respectively, of the m-th coe cient in
the k-th subband.
Given two hypotheses,H0 and H1, which indicate respectively speech absence and presence in the m-th coe cient
of the k-th subband, and assuming a complex Gaussian distributions for both speech and noise PWP coe cients [10],
10

the conditional pdfs of the speech and noise PWP coe cients are given by
f (Y(k m) H0(k m))1
2n
exp(Y(k m) 2
2n
) (15)
f (Y(k m) H1(k m))1
( 2n
2r )
exp(Y(k m) 2
2n
2r
) (16)
Using aposteriori and apriori SNRs defined by [10]
(k m)Y(k m) 2
2n(k m)
(17)
(k m)2r (k m)2n(k m)
(18)
and following (15) and (16), the conditional pdfs of the aposteriori SNR can be written as [7]
f ( (k m) H0(k m)) e (k m)I2 (19)
f ( (k m) H1(k m))1
1 (k m)exp(
(k m)1 (k m)
)I2 (20)
In (19) and (20), I2 u( (k m)) is the unit step function. Noting that the conditional speech presence probability
R(k m) P(H1(k m) (k m)), applying Bayes rule and using (20), an expression for R(k m) can be derived as
R(k m) [1Q(k m)
1 Q(k m)(1 (k m))exp( v(k m))] 1 (21)
where (k m) is the estimated apriori SNR obtained as in [7] and
v(k m)(k m) (k m)(1 (k m))
(22)
Speech absence probability Q(k m) in (21) can be determined as
Q(k m) 1 Rlocal(k m)Rglobal(k m)Rsubband(k m) (23)
In (23), Rlocal(k m) and Rglobal(k m) are the speech presence probabilities in local and global windows in the PWP
domain. Letting for representing either “local” or “global” window, R (k m) can be given by
R (k m)
0 if (k m) min
1 (k m) max
log( (k m) min)log( max min) otherwise
(24)
11

where (k m) representing either “local” or “global” average of the apriori SNR given by
(k m)i W
i Wh (i) (k i m) (25)
In (25), h is a normalized window of size 2w 1 and (k m) represents a recursive average of the apriori SNR given
by
(k m) (k m 1) (1 ) (k m 1) (26)
where denotes a smoothing constant. Note that in (24), min and max are the two empirical constants representing
minimum and maximum values of (k m) given in (26). Rsubband(k) in (23) can be computed as
Rsubband(k)
0 if subband(k) min
1 if subband(k) subband(k 1)and subband(k) min
(k) otherwise
(27)
where (k) is expressed as
(k)
0 if subband(k) peak(k) min
1 if subband(k) peak(k) max
log( subband(k) peak(k) min)log( max min) otherwise
(28)
In (28) and (27), subband(k) is determined as
subband(k)1Nc 1 m Nc
(k m) (29)
and peak in (27) is a confined peak value of subband(k). Thus computing R(k m) and Q(k m) following (21) and (23),
the shape parameters (k m) and (k m) can be determined using (13) and (14), respectively.
2.6. Inverse Perceptual Wavelet Packet Transform
For a noisy speech frame, we obtain thresholded PWP coe cients using the proposed threshold in (7) and the
proposed thresholding function in (9). An enhanced speech frame r[n] is synthesized by performing inverse PWP
transform as
r[n] PWP 1(Yk m)PCT
The enhanced speech signal is reconstructed by using the standard overlap-and-add method [21].
3. Results
In this Section, a number of simulations is carried out to evaluate the performance of the proposed method.
12

Table 1: Constants used to determine the shape parameters
Constants Value
0.7
min -10 dB
max -5 dB
peak 10 dB
wlocal 1
wglobal 15
3.1. Simulation Conditions
Real speech sentences from the NOIZEUS database are employed for the experiments, where the speech data
is sampled at 8 KHz [13]. To imitate a noisy environment, noise sequence is added to the clean speech samples at
di erent SNR levels ranging from 15 dB to -15 dB. As in [19], two di erent types of noises, such as car and babble
are adopted from the NOIZEUS databases [13].
In order to obtain overlapping analysis frames, hamming windowing operation is performed, where the size of
each of the frame is 512 samples with 50% overlap between successive frames. A 6-level PWP decomposition tree
with 10 db bases function is applied on the noisy speech frames [24], [23] resulting in subbands k 1 2 24.
The values of used constants to determine the shape parameters in the proposed thresholding function are given in
table 1.
3.2. Comparison Metrics
Standard Objective metrics namely, Segmental SNR (SNRSeg) improvement in dB, Perceptual Evaluation of
Speech Quality (PESQ) and Weighted Spectral Slope (WSS) are used for the evaluation of the proposed method [18].
The proposed method is subjectively evaluated in terms of the spectrogram representations of the clean speech, noisy
speech and enhanced speech. Formal listening tests are also carried out in order to find the analogy between the
objective metrics and the subjective sound quality. The performance of our method is compared with some of the
state-of-the-art speech enhancement methods, such as Universal [9], SMPO [19] and Wavelet Packet Transform based
method with Modified Hard Thresholding Function (WPMH) [23] in both objective and subjective senses.
3.3. Objective Evaluation
3.3.1. Results for Speech signals with Car Noise
SNRSeg improvement, PESQ and WSS for speech signals corrupted with car noise for Universal, SMPO, WPCT
and proposed methods are shown in Fig.12, Table 2 and Fig.13.
13

Figure 12: SNRSeg Improvement for di erent methods in car noise
Table 2: PESQ for di erent methods in car noise
SNR(dB) Universal SMPO WPCT Proposed Method
-15 1.16 1.15 1.19 1.27
-10 1.23 1.37 1.36 1.45
-5 1.32 1.51 1.57 1.61
0 1.43 1.69 1.80 1.79
5 1.69 2.07 2.11 2.13
10 1.93 2.38 2.45 2.43
15 2.14 2.60 2.69 2.75
Figure 13: WSS for di erent methods in car Noise
14
In Fig.12, the performance of the proposed method is compared with that of the other methods at di erent levels
of SNR for car noise in terms of Segmental SNR improvement. We see, the SNRSeg improvement increases as SNR
decreases. At a low SNR of 15dB, the proposed method yields the highest SNRSeg improvement. Such larger values
of SNRSeg improvement at a low level of SNR attest the capability of the proposed method in producing enhanced
speech with better quality for speech severely corrupted by car noise.
In Table 2, it can be seen that at a low level of SNR, such as 15dB , all the methods show lower values of PESQ
scores, whereas the PESQ score is much higher, as expected, for the proposed method. The proposed method also
yields larger PESQ scores compared to that of the other methods at higher levels of SNR. Since, at a particular SNR,
a higher PESQ score indicates a better speech quality, the proposed method is indeed better in performance in the
presence of a car noise.
Fig.13 represents the WSS values as a function of SNR for the proposed method and that for the other methods.
As shown in the figure, the WSS values resulting from all other methods are relatively larger for a wide range of SNR
levels, whereas the proposed method is capable of producing enhanced speech with better quality as it gives lower
values of WSS even at a low SNR of 15dB.
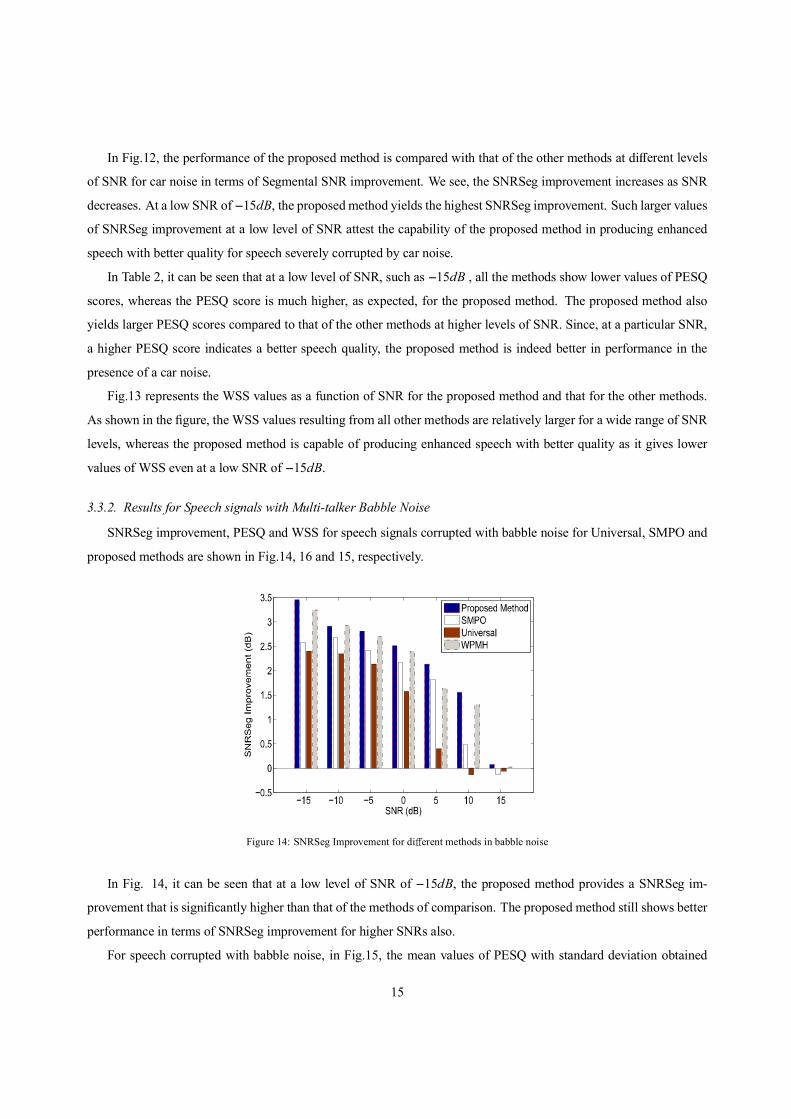
3.3.2. Results for Speech signals with Multi-talker Babble Noise
SNRSeg improvement, PESQ and WSS for speech signals corrupted with babble noise for Universal, SMPO and
proposed methods are shown in Fig.14, 16 and 15, respectively.
Figure 14: SNRSeg Improvement for di erent methods in babble noise
In Fig. 14, it can be seen that at a low level of SNR of 15dB, the proposed method provides a SNRSeg im-
provement that is significantly higher than that of the methods of comparison. The proposed method still shows better
performance in terms of SNRSeg improvement for higher SNRs also.
For speech corrupted with babble noise, in Fig.15, the mean values of PESQ with standard deviation obtained
15
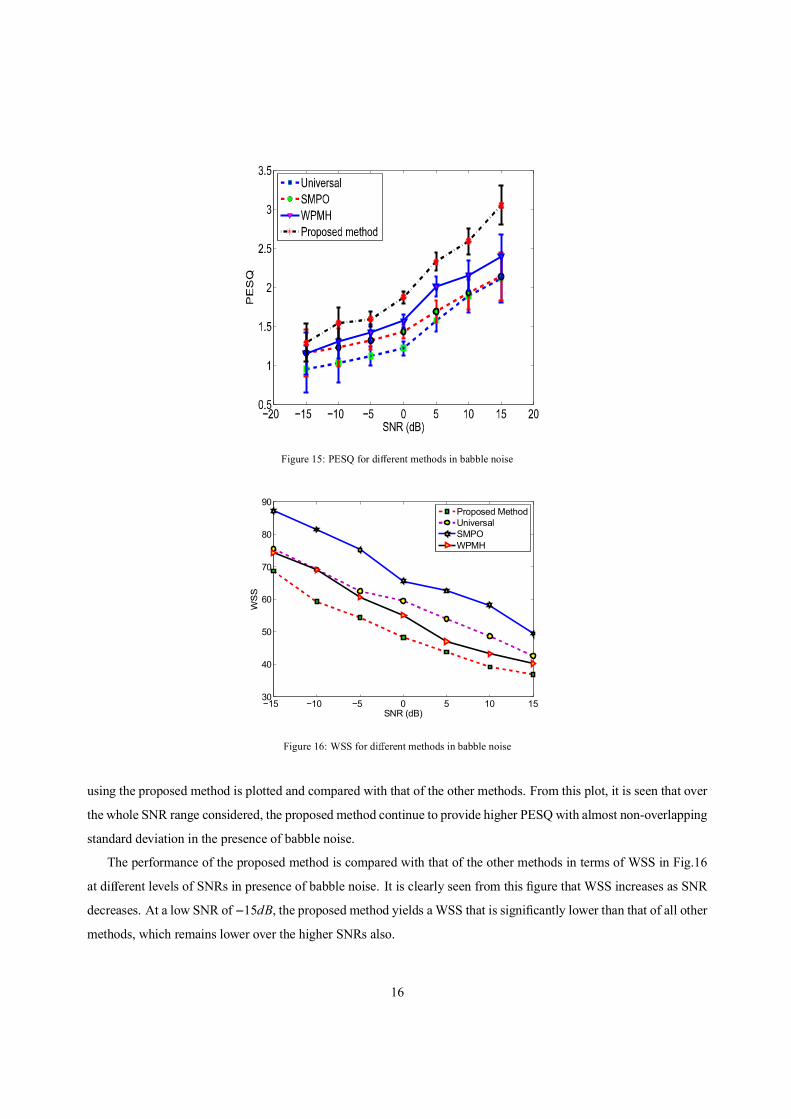
Figure 15: PESQ for di erent methods in babble noise
−15 −10 −5 0 5 10 1530
40
50
60
70
80
90
SNR (dB)
Proposed MethodUniversalSMPOWPMH
Figure 16: WSS for di erent methods in babble noise
using the proposed method is plotted and compared with that of the other methods. From this plot, it is seen that over
the whole SNR range considered, the proposed method continue to provide higher PESQ with almost non-overlapping
standard deviation in the presence of babble noise.
The performance of the proposed method is compared with that of the other methods in terms of WSS in Fig.16
at di erent levels of SNRs in presence of babble noise. It is clearly seen from this figure that WSS increases as SNR
decreases. At a low SNR of 15dB, the proposed method yields aWSS that is significantly lower than that of all other
methods, which remains lower over the higher SNRs also.
16

Figure 17: Spectrograms of (a) Clean Signal (b) Noisy Signal with 10dB car noise; spectrograms of enhanced speech from (c) Universal method
(d) SMPO method (e) Proposed Method17

Figure 18: Spectrograms of (a) Clean Signal (b) Noisy Signal with 10dB babble noise; spectrograms of enhanced speech from (c) Universal method
(d) SMPO method (e) Proposed Method18

3.4. Subjective Evaluation
In order to evaluate the subjective observation of the enhanced speech, spectrograms of the clean speech, the noisy
speech, and the enhanced speech signals obtained by using the proposed method and all other methods are presented
in Fig. 17 for car noise corrupted speech at an SNR of 10 dB. It is evident from this figure that the harmonics are well
preserved and the amount of distortion is greatly reduced in the proposed method. Thus, the spectrogram observations
with lower distortion also validate our claim of better speech quality as obtained in our objective evaluations in terms
of higher SNR improvement in dB, higher PESQ score and lower WSS in comparison to the other methods. Another
set of spectrograms for babble noise corrupted speech at an SNR of 10 dB is also presented in Fig.18. This figure
attests that the proposed method has a better e cacy in preserving speech harmonics even in case of babble noise.
Formal listening tests are also conducted, where ten listeners are allowed and arranged to perceptually evaluate
the enhanced speech signals. A full set (thirty sentences) of the NOIZEUS corpus was processed by Universal, SMPO
and proposed method for subjective evaluation at di erent SNRs. Subjective tests were performed according to ITU-T
recommendation P.835 [13]. In this tests, a listener is instructed to successively attend and rate the enhanced speech
signal based on (a) the speech signal alone using a scale of SIG (1 very unnatural, 5 very natural), (b) the
background noise alone using a scale of background conspicuous intrusiveness (BAK) (1 very conspicuous, very
intrusive; 5 not noticeable), and (c) the overall e ect using the scale of the mean opinion score (OVRL) (1 bad,
5 excellent). More details about the testing methodology can be found in [14]. The mean scores of SIG, BAK, and
OVRL scales for the three speech enhancement methods evaluated in the presence of car noise at an SNR of 5 dB are
shown in Tables 3, 4, and 5. For the three methods evaluated using babble noise-corrupted speech at an SNR of 10
dB, the mean scores of SIG, BAK, and OVRL scales are also summarized in Tables 6, 7, and 8. The mean scores in
the presence of both car and babble noises demonstrate that the lower signal distortion (i.e., higher SIG scores) and
the lower noise distortion (i.e., higher BAK scores) are obtained with the proposed method relative to that obtained
by Universal and SMPO methods in most of the conditions. It is also shown that a consistently better performance in
OVRL scale is o ered by the proposed method not only in car but also in babble noisy conditions at both SNR levels
considered in comparison to that provided by all the methods mentioned above. Overall, it is found that the proposed
method possesses the highest subjective sound quality in comparison to that of the other methods in case of di erent
noises at various levels of SNRs.
4. Conclusions
In this paper, we developed a Gaussian statistical model-based technique for the TE operated PWP coe cients of
the noisy speech in order to obtain a suitable threshold value. By employing the proposed gaussian pdf dependent
custom thresholding function, the PWP coe cients of the noisy speech are thresholded in order to obtain an enhanced
speech. Simulation results show that the proposed method yields consistently better results in the sense of higher
Segmental SNR Improvement in dB, higher output PESQ, and lower WSS values than those of the existing methods.
19

Table 3: Mean Score of SIG scale for di erent methods in presence of car noise at 5 db
Listener Universal SMPO Proposed Method
1 3.6 4.0 4.0
2 3.3 3.9 3.7
3 3.9 4.0 4.2
4 3.4 4.2 4.5
5 3.2 3.8 4.0
6 2.9 3.6 3.9
7 3.8 3.8 4.2
8 3.5 3.7 4.2
9 3.5 3.9 3.8
10 3.7 3.9 4.0
Table 4: Mean Score of BAK scale for di erent methods in presence of car noise at 5 db
Listener Universal SMPO Proposed Method
1 4.0 4.5 5.0
2 4.3 4.9 4.7
3 4.2 4.4 4.9
4 4.4 4.7 4.8
5 4.2 4.8 4.7
6 3.9 4.6 4.9
7 3.8 3.9 4.4
8 4.4 4.6 4.6
9 3.5 3.8 4.5
10 4.2 4.5 4.8
20

Table 5: Mean Score of OVL scale for di erent methods in presence of car noise at 5 db
Listener Universal SMPO Proposed Method
1 2.6 4.0 4.1
2 3.3 3.8 3.7
3 3.9 4.1 4.3
4 3.6 4.2 4.2
5 3.3 3.9 4.1
6 3.9 4.6 4.9
7 3.8 3.8 4.3
8 3.6 4.1 4.2
9 3.5 4.5 4.7
10 3.9 4.6 4.8
Table 6: Mean Score of SIG scale for di erent methods in presence of Babble noise at 5 db
Listener Universal SMPO Proposed Method
1 3.6 4.0 4.0
2 3.3 3.9 3.7
3 4.2 3.9 4.0
4 3.4 4.2 4.5
5 3.2 3.8 4.0
6 2.9 3.6 3.9
7 3.8 3.8 4.2
8 3.4 3.6 4.1
9 3.5 3.9 3.7
10 3.7 3.8 3.9
21
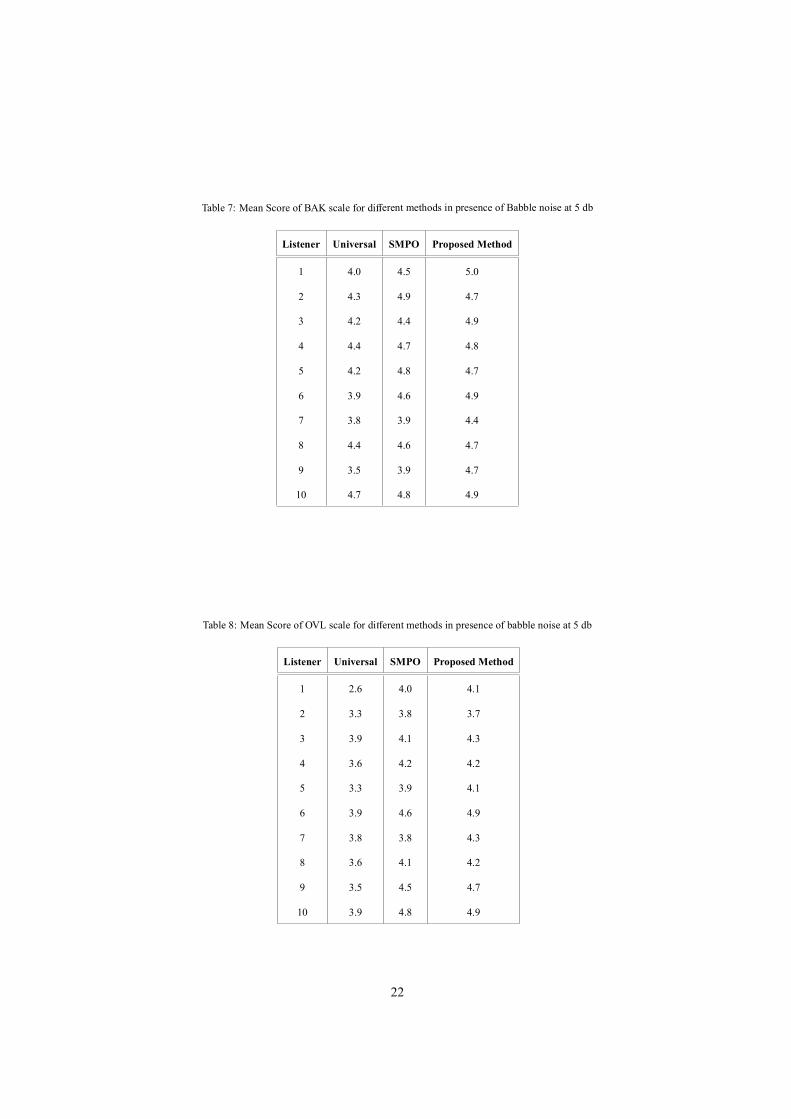
Table 7: Mean Score of BAK scale for di erent methods in presence of Babble noise at 5 db
Listener Universal SMPO Proposed Method
1 4.0 4.5 5.0
2 4.3 4.9 4.7
3 4.2 4.4 4.9
4 4.4 4.7 4.8
5 4.2 4.8 4.7
6 3.9 4.6 4.9
7 3.8 3.9 4.4
8 4.4 4.6 4.7
9 3.5 3.9 4.7
10 4.7 4.8 4.9
Table 8: Mean Score of OVL scale for di erent methods in presence of babble noise at 5 db
Listener Universal SMPO Proposed Method
1 2.6 4.0 4.1
2 3.3 3.8 3.7
3 3.9 4.1 4.3
4 3.6 4.2 4.2
5 3.3 3.9 4.1
6 3.9 4.6 4.9
7 3.8 3.8 4.3
8 3.6 4.1 4.2
9 3.5 4.5 4.7
10 3.9 4.8 4.9
22

The improved performance of the proposed method is also indicated and attested by the much better spectrogram
outputs and in terms of the higher scores in the formal subjective listening tests.
[1] Almajai, I., Milner, B., 2011. Visually derived wiener filters for speech enhancement. IEEE Trans. Audio, Speech, Lang. Process. 19, 1642–
1651.
[2] Bahoura, M., Rouat, J., 2001. Wavelet speech enhancement based on the teager energy operator. IEEE Signal Process. Lett. 8, 10–12.
[3] Ben Jebara, S., 2006. A perceptual approach to reduce musical noise phenomenon with wiener denoising technique. In: Proc. IEEE Int. Conf.
Acoust., Speech, Signal Process. (ICASSP). pp. 14–19.
[4] Boll, S., 1979. Suppression of acoustic noise in speech using spectral subtraction. IEEE Trans. Acoust., Speech, Signal Process. 27, 113–120.
[5] Chang, J. H., 2005. Warped discrete cosine transform-based noisy speech enhancement. IEEE Trans. Circuits Systems II: Express Briefs 52,
535–539.
[6] Chang, S., Yu, B., Vetterli, M., 2000. Adaptive wavelet thresholding for image denoising and compression. IEEE Trans. Image Process. 9,
1532–1546.
[7] Cohen, I., 2003. Noise spectrum estimation in adverse environments: Improved minima controlled recursive averaging. IEEE Trans. Speech
Audio Process. 11, 466–475.
[8] Deller, J. J., Hansen, J., Proakis, J., 2000. Discrete-Time Processing of Speech Signals. IEEE Press, NY.
[9] Donoho, D., 1995. De-noising by soft-thresholding. IEEE Trans. Inf. Theory 41, 613–627.
[10] Ephraim, Y., Malah, D., 1985. Speech enhancement using a minimum mean-square error log-spectral amplitude estimator. IEEE Trans.
Acoust., Speech, Signal Process. 33, 443–445.
[11] Ephraim, Y., Van Trees, H. L., 1995. A signal subspace approach for speech enhancement. IEEE Trans. Speech Audio Process. 3, 251–266.
[12] Ghanbari, Y., Mollaei, M., 2006. A new approach for speech enhancement based on the adaptive thresholding of the wavelet packets. Speech
Commun. 48, 927–940.
[13] Hu, Y., Loizou, P., 2007. Subjective comparison and evaluation of speech enhancement algorithms. Speech Commun. 49, 588–601.
[14] ITU, 2003. P835 IT: subjective test methodology for evaluating speech communication systems that include noise suppression algorithms.
ITU-T Recommendation (ITU, Geneva), 835.
[15] Johnson, M. T., Yuan, X., Ren, Y., 2007. Speech signal enhancement through adaptive wavelet thresholding. Speech Commun. 49, 123–133.
[16] Kaiser, J., 1993. Some useful properties of teager’s energy operators. In: Proc. IEEE Int. Conf. Acoust., Speech, Signal Process. (ICASSP).
pp. 149–152.
[17] Loizou, P. C., 2005. Speech enhancement based on perceptually motivated bayesian estimators of the magnitude spectrum. IEEE Trans.
Speech Audio Process. 13, 857–869.
[18] Loizou, P. C., 2007. Speech Enhancement: Theory and Practice. CRC Press, Boca Raton.
[19] Lu, Y., Loizou, P., 2011. Estimators of the magnitude-squared spectrum and methods for incorporating SNR uncertainty. IEEE Trans. Audio,
Speech, Lang. Process. 19, 1123–1137.
[20] Luisier, F., Blu, T., Unser, M., 2007. A new sure approach to image denoising: Inter-scale orthonormal wavelet thresholding. IEEE Trans.
Image Process. 16, 593–606.
[21] OShaughnessy, D., 2000. Speech Communications: Human and Machine, 2nd Edition. IEEE Press, Piscataway, NJ.
[22] Sanam, T., Shahnaz, C., 2012. Enhancement of noisy speech based on a custom thresholding function with a statistically determined threshold.
International Journal of Speech Technology 15, 463–475.
[23] Sanam, T., Shahnaz, C., 2013. Noisy speech enhancement based on an adaptive threshold and a modified thresholding function in wavelet
packet domain. Digital Signal Process. 23, 941–951.
[24] Sarikaya, R., Pellom, B. L., Hansen, J. H. L., 1998. Wavelet packet transform features with application to speaker identification. In: Proc.
IEEE Nordic Signal Process. Symp. pp. 81–84.
[25] Shao, Y., Chang, C. H., 2007. A generalized time-frequency subtraction method for robust speech enhancement based on wavelet filter banks
modeling of human auditory system. IEEE Trans. Syst., Man, Cyber. 37, 877–889.
23

[26] Yamashita, K., Shimamura, T., 2005. Nonstationary noise estimation using low-frequency regions for spectral subtraction. IEEE Signal
Process. Lett. 12, 465–468.
[27] You, C. H., K. S. N., Rahardja, S., 2005. An invertible frequency eigen domain transformation for masking-based subspace speech enhance-
ment. IEEE Signal Process. Lett. 12, 461–464.
24