enhancement of cross-linking efficiency of hyaluronic acid
TRANSCRIPT
Enhancement of cross-linking efficiency of hyaluronic acid-based
hydrogels cross-linked with 1, 4-butanediol diglycidyl ether
“A comparative evaluation of different method conditions”
Dissertation
zur Erlangung des akademischen Grades
doctor rerum naturalium (Dr. rer. nat.)
der
Naturwissenschaftlichen Fakultät I
Biowissenschaften
der Martin-Luther-Universität Halle-Wittenberg
vorgelegt
von
Mohammed Abdullah Al-Sibani geb. am 28. Juni 1971 in Oman
Gutachter /in
1. Prof. Dr. Reinhard Neubert
2. Prof. Dr. Dagmar Fischer
3. Prof. Dr. Ahmed AL-Harrasi
Tag der Verteidigung: Halle (Saale), 17.05.2017

TABLE OF CONTENT
2
TABLE OF CONTENT
TABLE OF CONTENT ......................................................................................................................................... 2
LIST OF FIGURES ............................................................................................................................................... 4
LIST OF TABLES................................................................................................................................................. 6
LIST OF ABBREVIATION .................................................................................................................................. 7
ABSTRAKT .......................................................................................................................................................... 9
ABSTRACT .........................................................................................................................................................10
AIMS OF STUDY ...............................................................................................................................................11
CHAPTER 1 ........................................................................................................................................................15
1. Theoretical background ............................................................................................................... 15
1.1 Introduction to hyaluronic acid (HA) ..................................................................................... 15
1.3 HA cross-linking .................................................................................................................... 20
1.4 Cross-linking efficiency ......................................................................................................... 24
CHAPTER 2 ........................................................................................................................................................25
2. Cross-linking hyaluronic acid with BDDE .................................................................................. 25
2.1 Introduction ............................................................................................................................ 25
2.2 Preparation of cross-linked BDDE-HA hydrogel .................................................................. 25
2.3 Comparison between native and cross-linked HA ................................................................. 27
2.4 Conclusion ............................................................................................................................. 36
CHAPTER 3 ........................................................................................................................................................37
3. Evaluation of in-vitro degradation rate of cross-linked BDDE-HA hydrogel. ............................ 37
3.1 Introduction ............................................................................................................................ 37
3.2 Development of (chromatographic, colorimetric and gravimetric) methods ........................ 38
3.4 Conclusion ............................................................................................................................. 49
CHAPTER 4 ........................................................................................................................................................50
4. Reaction time, pH and temperature.............................................................................................. 50
4.1 Introduction ............................................................................................................................ 50
4.2 Reaction time ......................................................................................................................... 50
4.3 pH ........................................................................................................................................... 55
4.4 Temperature. .......................................................................................................................... 58
TABLE OF CONTENT
3
4.4.1 Materials ............................................................................................................................. 58
4.5 Conclusion ............................................................................................................................. 62
CHAPTER 5 ........................................................................................................................................................63
5. HA initial concentration ............................................................................................................... 63
5.1 Introduction ............................................................................................................................ 63
5.2 HA initial concentration ......................................................................................................... 63
5.3 Conclusion ............................................................................................................................. 73
CHAPTER 6 ........................................................................................................................................................74
6. HA molecular weight ................................................................................................................... 74
6.1 Introduction ............................................................................................................................ 74
6.2 HA molecular weight ............................................................................................................. 74
6.3 Conclusion ............................................................................................................................. 81
CHAPTER 7 ........................................................................................................................................................82
7. Mixing approach .......................................................................................................................... 82
7.1 Introduction ............................................................................................................................ 82
7.2 Mixing approach .................................................................................................................... 82
7.3 Conclusion ............................................................................................................................. 96
SUMMARY AND OUTLOOK ..........................................................................................................................98
ACKNOWLEDGMENT ....................................................................................................................................100
REFERENCES ...................................................................................................................................................101
APPENDICES ....................................................................................................................................................111
Appendix 1: Introduction to the analytical instruments employed for HA characterization ......... 111
Appendix 2: ESI-Mass spectrometry analysis ............................................................................... 118
Appendix 3: The relation between degree of modification and BDDE concentration. ................. 138
Appendix 4: Chromatographic analysis ........................................................................................ 142
Appendix 5: Colorimetric analysis ............................................................................................... 160
Appendix 6: Results of the in-vitro degradation rate ..................................................................... 164
Appendix 7: Results of the swelling ratio measurements .............................................................. 166
Appendix 8: Excel data for the rheological measurements ............................................................ 168
Appendix 9: Images for different hydrogel samples obtained in our work ................................... 174
ERKLÄRUNG/ DECLARATION .....................................................................................................................178
PUBLICATIONS ...............................................................................................................................................179
CURRICULUM VITAE .....................................................................................................................................180

LIST OF FIGURES
4
LIST OF FIGURES
Figure 1. 1 Structure of the disaccharide repeating unit in HA ........................................................... 15
Figure 1. 2 Esterification using alkyl halide and the reaction of HA with glycidyl methacrylate ..... 22
Figure 1. 3 Ether formation by crosslinking two HA chain with BDDE ........................................... 22
Figure 1. 4 Complex coacervation between a polyanion and a polycation ....................................... 23
Figure 2. 1 Hydrated BDDE-HA hydrogel (A), Lyophilized BDDE-HA hydrogel (B). ..................... 26
Figure 2. 2 FTIR spectra of lyophilized native HA .......................................................................... 29
Figure 2. 3 FTIR spectra of cross-linked HA ...................................................................................... 29
Figure 2. 4 CE electropherogram of native HA fragments ............................................................... 30
Figure 2. 5 CE electropherogram of cross-linked BDDE-HA fragments ........................................... 31
Figure 2. 6 The ESI-MS profiles of native HA ................................................................................... 32
Figure 2. 7 The ESI-MS profiles of cross-linked HA-BDDE hydrogel .............................................. 32
Figure 2. 8 NMR spectra of lyophilized native HA digested fragments ............................................. 35
Figure 2. 9 NMR spectra of lyophilized BDDE- HA digested fragments . ......................................... 35
Figure 3. 1 Chromatograms of (NAG) for X1 A and X1 B .................................................................. 42
Figure 3. 2 Chromatograms of standard solutions and the calibration curve ................................... 43
Figure 3. 3 The violet color developed by Ehrlich's reagent in samples X4 A and X4 B ................... 45
Figure 3. 4 Color gradient of standards developed by Ehrlich's reagent ............................................ 45
Figure 3. 5 Average degradation rates obtained from the three analytical methods .......................... 47
Figure 4. 1 Degradation profiles of BDDE-HA hydrogels prepared at different reaction time .......... 53
Figure 4. 2 Swelling ratios of hydrogels prepared at different reaction times . ................................... 54
Figure 4. 3 Degradation profiles of BDDE-HA hydrogels prepared at different pH number .............. 57
Figure 4. 4 Swelling ratios of hydrogels prepared at different pH number . ...................................... 58
Figure 4. 5 Degradation profiles of BDDE-HA hydrogels prepared at different temperature ............. 60
Figure 4. 6 Swlling ratios of hydrogels prepared at different temperature. ......................................... 61
Figure 5. 1 Degradation profiles of hydrogels prepared at different HA concentrations .................... 65
Figure 5. 2 Swelling ratios of hydrogels prepared at different HA concentration ............................... 67
Figure 5. 3 SEM image for hydrogel prepared at 7.0 % HA initial concentration .............................. 68
Figure 5. 4 SEM image for hydrogel prepared at 8.0 % HA initial concentration .............................. 68

LIST OF FIGURES
5
Figure 5. 5 SEM image for hydrogel prepared at 9.0 % HA initial concentration .............................. 69
Figure 5. 6 SEM image for hydrogel prepared at 10.0 % HA initial concentration ............................ 69
Figure 5. 7 SEM image for hydrogel prepared at 11.0 % HA initial concentration ............................ 69
Figure 5. 8 SEM image for hydrogel prepared at 12.0 % HA initial concentration ............................ 70
Figure 5. 9 SEM image for hydrogel prepared at 13.0 % HA initial concentration ............................ 70
Figure 5. 10 SEM image for hydrogel prepared at 14.0 % HA initial concentration........................... 70
Figure 6. 1 Degradation profiles of hydrogels prepared at different HA molecular weight. ............... 76
Figure 6. 2 Swelling ratio of hydrogels prepared at different HA molecular weight........................... 78
Figure 6. 3 Storage modulus G' and Loss modulus G'' (Pa) for native HA ......................................... 78
Figure 6. 4 Storage modulus G' and Loss modulus G'' (Pa) for hydrogel with 100,000 Da HA ....... 79
Figure 6. 5 Storage modulus G' and Loss modulus G'' (Pa) for hydrogel with 1000,000 Da HA ..... 79
Figure 6. 6 Storage modulus G' and Loss modulus G'' (Pa) for hydrogel with 2000,000 Da HA ....... 79
Figure 6. 7 Measurements of dynamic viscosity for native HA and cross-linked hydrogels............... 81
Figure 7. 1 Degradation profiles of native HA and hydrogels 1 and 2 . .............................................. 85
Figure 7. 2 Swelling ratios of hydrogels 1 and 2 ............................................................................... 87
Figure 7. 3 Morphological structure of native HA and hydrogels 1 and 2 ........................................ 91
Figure 7. 4 Storage modulus G and Loss modulus G'' (Pa) for hydrogel 1 ......................................... 92
Figure 7. 5 Storage modulus G and Loss modulus G'' (Pa) for hydrogel 2 ......................................... 92
Figure 7. 6 FTIR and 1H NMR spectra for native HA and hydrogels 1 and 2 .................................... 95

LIST OF TABLES
6
LIST OF TABLES
Table 2. 1 Possible oligomers of native HA hydrogel . ....................................................................... 34
Table 2. 2 Possible oligomers of cross-linked BDDE-HA hydrogel .................................................. 34
Table 3. 1 Degradation rates of samples (X1, X2, and X3) obtained from HPLC method. ................... 44
Table 3. 2 Degradation rates of samples X4, X5, and X6 obtained from the colorimetric method. ...... 46
Table 3. 3 Degradation rates of samples X7, X8, and X9 obtained from the weight loss method. ........ 46
Table 4. 1 BDDE-HA hydrogels prepared at various reaction time .................................................... 51
Table 4. 2 BDDE-HA hydrogels prepared at various pH number ....................................................... 55
Table 4. 3 BDDE-HA hydrogels prepared at various temperature ...................................................... 58
LIST OF ABBREVIATION
7
LIST OF ABBREVIATION
HA
Hyaluronic acid
BDDE
1, 4-butanedioldiglycidyl ether
NAG N- acetyl glucosamine
Mw Molecular weight
ECM Extracellular matrix
PEG Polyethylene glycol
DVS Divinyl sulfone
PEGDGE poly (ethylene glycol) diglycidyl ether
COOH Carboxylic group
OH Hydroxyl group
3D Three-dimensional
FTIR Fourier-transformed infrared
µm Micrometer
NMR
Nuclear magnetic resonance spectroscopy
D2O Deuterium oxide
HPLC High performance liquid chromatography
UV Ultra-violet
nm Nano-meter
M Molarity
CE Capillary electrophoreses
GAGs Glycosaminoglycans

LIST OF ABBREVIATION
8
SEM Scanning electron microscope
G' Storage modulus
G'' Loss modulus
SAOS Small amplitude oscillatory strain
LVR Linear viscoelastic region
γ Sinusoidal deformation
δ Phase shift
NaOH Sodium hydroxide
pKa Expression number for weak acids acidity
pH Potential of hydrogen (acidity number)
HCl Hydrochloric acid
U Enzyme activity
PBS Phosphate buffer saline
BTH Bovine testicular hyaluronidase
EOF
Electro-osmotic flow
GlcNAc N-acetyl-D-glucosamine
GlcA Glucoronic acid
ΔUA Unsaturated uronic acid
ANOVA Analysis of variance
ESI -MS Electro-spray ionization mass spectrometry
SEI Secondary electron imaging
m/z Mass to charge ratio
ABSTRAKT
9
ABSTRAKT
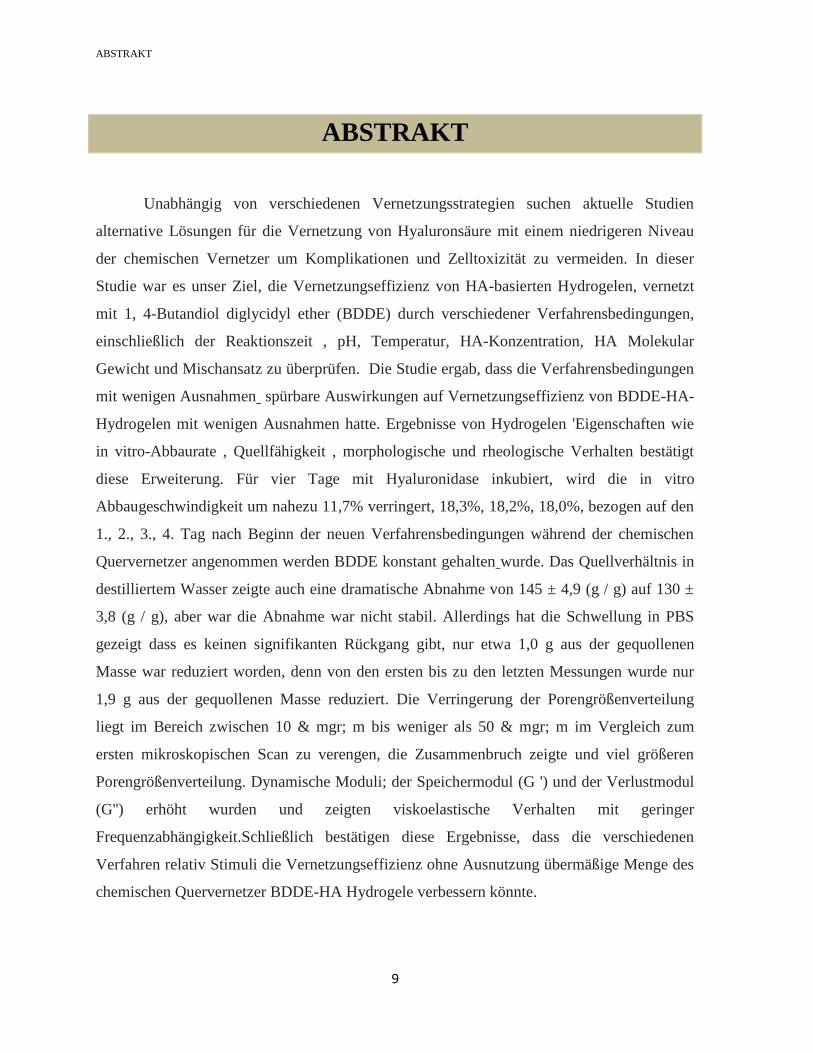
Unabhängig von verschiedenen Vernetzungsstrategien suchen aktuelle Studien
alternative Lösungen für die Vernetzung von Hyaluronsäure mit einem niedrigeren Niveau
der chemischen Vernetzer um Komplikationen und Zelltoxizität zu vermeiden. In dieser
Studie war es unser Ziel, die Vernetzungseffizienz von HA-basierten Hydrogelen, vernetzt
mit 1, 4-Butandiol diglycidyl ether (BDDE) durch verschiedener Verfahrensbedingungen,
einschließlich der Reaktionszeit , pH, Temperatur, HA-Konzentration, HA Molekular
Gewicht und Mischansatz zu überprüfen. Die Studie ergab, dass die Verfahrensbedingungen
mit wenigen Ausnahmen spürbare Auswirkungen auf Vernetzungseffizienz von BDDE-HA-
Hydrogelen mit wenigen Ausnahmen hatte. Ergebnisse von Hydrogelen 'Eigenschaften wie
in vitro-Abbaurate , Quellfähigkeit , morphologische und rheologische Verhalten bestätigt
diese Erweiterung. Für vier Tage mit Hyaluronidase inkubiert, wird die in vitro
Abbaugeschwindigkeit um nahezu 11,7% verringert, 18,3%, 18,2%, 18,0%, bezogen auf den
1., 2., 3., 4. Tag nach Beginn der neuen Verfahrensbedingungen während der chemischen
Quervernetzer angenommen werden BDDE konstant gehalten wurde. Das Quellverhältnis in
destilliertem Wasser zeigte auch eine dramatische Abnahme von 145 ± 4,9 (g / g) auf 130 ±
3,8 (g / g), aber war die Abnahme war nicht stabil. Allerdings hat die Schwellung in PBS
gezeigt dass es keinen signifikanten Rückgang gibt, nur etwa 1,0 g aus der gequollenen
Masse war reduziert worden, denn von den ersten bis zu den letzten Messungen wurde nur
1,9 g aus der gequollenen Masse reduziert. Die Verringerung der Porengrößenverteilung
liegt im Bereich zwischen 10 & mgr; m bis weniger als 50 & mgr; m im Vergleich zum
ersten mikroskopischen Scan zu verengen, die Zusammenbruch zeigte und viel größeren
Porengrößenverteilung. Dynamische Moduli; der Speichermodul (G ') und der Verlustmodul
(G'') erhöht wurden und zeigten viskoelastische Verhalten mit geringer
Frequenzabhängigkeit.Schließlich bestätigen diese Ergebnisse, dass die verschiedenen
Verfahren relativ Stimuli die Vernetzungseffizienz ohne Ausnutzung übermäßige Menge des
chemischen Quervernetzer BDDE-HA Hydrogele verbessern könnte.

ABSTRACT
01
ABSTRACT
Regardless of various cross-linking strategies, current studies seek alternative
solutions for cross-linking hyaluronic acid with a lower level of chemical cross-linker to
avoid complications and cell toxicity. In this study, we aimed to enhance the cross-linking
efficiency of HA-based hydrogels cross-linked with 1, 4-butanediol diglycidyl ether (BDDE)
via studying the effect of various method conditions such as reaction time, pH, temperature,
HA concentration, HA molecular weight and mixing approach. The study revealed that the
method conditions had noticeable effects on BDDE-HA properties with few exceptions. For
four days incubating with hyaluronidase, the in-vitro degradation rate decreased by almost
11.7 %, 18.3 %, 18.2 %, 18.0 % on the 1st , 2
nd , 3
rd ,4
th day respectively after employing the
optimum method conditions. The swelling ratio in distilled water showed also a dramatic
decrease from 145 ± 4.9 (g/g) to 130 ± 3.8 (g/g). However, the swelling in PBS did not show
a significant decline, about 1.0 g only had been reduced from the swollen mass when moved
from the initial measurements to the final measurements. The pore-size distribution
decreased to narrower ranges between 10 µm to less than 50 µm compared to the first
microscopic scan which showed collapse and much wider pore-size distribution. Dynamic
moduli; the storage modulus (G') and the loss modulus (G'') were increased and showed
viscoelastic behavior with less frequency-dependence. Finally, these findings confirmed that
the method conditions could relatively enhance the cross-linking efficiency of BDDE-HA
hydrogels without exploiting excessive amount of the chemical cross-linker.

AIMS OF STUDY
00
AIMS OF STUDY
Hyaluronic acid (HA) is a high-molecular weight, poly-anionic polymer with many
applications in human medicine (Šimkovic et al., 2000). Naturally, it is found in human skin,
extra-cellular matrix (ECM) and synovial fluid of vertebrates (Zawko et al., 2009). The HA
functions are to create volume and provide lubricants to tissues, consequently preventing cell
damages induced through various physical stresses (Romagnoli & Belmontesi, 2008). HA is
biocompatible, biodegradable and hydrophilic, so it allows the influx and retention of large
amounts of water due to the abundant hydrophilic carboxyl groups (Allemann & Baumann,
2008).
Due to the unique biological properties of HA which are very similar of that in human
tissues, it has gained great attention and interest over the years. These properties have allowed
HA to be used in different biomedical applications such as wound-healing, osteoarthritis (Liu et
al., 2007) and tissue-augmentation (Kenne et al., 2013). However, native HA has very limited
applications due to its poor mechanical properties and in vivo rapid degradation (Liu et al., 2007;
Jeon et al., 2007; Pitarresi et al., 2007 ; Verpaele & Strand, 2006). It has been reported that the
half-life of HA after injection into the skin or joints is no longer than 1 day (Brown et al.,1991).
Consequently, it is not a suitable material for therapeutic action, particularly for the
dermatological applications.
To overcome these drawbacks, HA should be stabilized via chemical modification
processes to ensure a longer residence time within the soft tissue after administration into the
body. These processes involve cross-linking of different HA chains by covalent bonds using
chemical cross-linkers (Luo et al, 2000). Various methods have been developed for the
production of cross-linked HA, the result of each method is a cross-linked HA hydrogel with a
three-dimensional network structure that retains water within its cross-linked network upon the
hydration in an aqueous environment (Berkó et al, 2013 ; Masters et al, 2005 ; Kim, Mauck &
Burdick, 2011; Yamanlar et al, 2011) .

AIMS OF STUDY
02
The cross-linked hydrogel is more resistant than native HA towards enzymatic
degradation due to the formation of bridges and intermolecular bonds between the HA chains
and the cross-linker. A number of chemical cross-linkers have been addressed for HA cross-
linking including methacrylamide (Segura et al., 2005), hydrazide (Prestwich et al., 1998),
carbodiimide (Lai, 2012), divinyl sulfone (DVS), 1, 4-butanediol diglycidyl ether (BDDE) and
poly (ethylene glycol) diglycidyl ether (PEGDGE) (Gatta et al, 2013 ; Schanté et al, 2011).
Several studies showed that by increasing the cross-linker content or concentration, the degree of
cross-linking is increased (Caillard et al, 2008 ; Wong, Ashton & Dodou, 2015 ; Schanté et al,
2011), subsequently, slower degradation rate towards enzyme is exhibited. In cosmetic, patients
commonly prefer HA hydrogels with higher degrees of cross-linking to exhibit longevity and
mechanical strength. Hydrogels prepared with a higher degree of cross-linking become stiffer
and exhibit greater resistance against enzymatic degradation. Stronger HA-filler can also provide
adequate force to lift the tissues and resist subsequent deformation.
However, from a health perspective, incorporation of high contents of chemical cross-
linkers in HA modification is not feasible. The excessive amounts of cross-linkers are often toxic
and can give unwanted reactions with the bioactive substances present in the hydrogel matrix
(Hennink, and van Nostrum, 2012 ; Boogaard et al., 2000). They affect the integrity of the
substances to be entrapped such as drugs or proteins. Treating patients with excessive amounts of
cross-linker is not a healthy practice and may be associated with undesirable effects, particularly
if the dose contains residues of un-reacted cross-linker. The chemical cross-linkers are
considered the major obstacles in the use of injectable polymer scaffolds due to their toxicity to
the cells (Sung et al, 1998 ; Ferretti et al, 2006 ; Tan et al, 2009).
Many studies have reported various complications and side-effects correlated with the
chemical cross-linkers used in HA modification, particularly for the HA fillers treated with
excessive amounts of cross-linkers (Sung et al, 1998 ; ; Ferretti et al, 2006 ; Tan et al, 2009 ;
Alijotas-Reig & García-Giménez, 2008 ; Micheels, 2001 ; Loewe et al, 2001 ; John & Price,
2009 ; Clark, 2007 ; Hennink & Nostrum, 2012 ; Boogaard, Denneman, & Van Sittert, 2000).
Any side effects or allergic reactions produced by HA-based fillers are thought to be caused by
the cross-linkers (Clark, 2007; Carpintero, Candelas & Ruiz-Rodríguez).

AIMS OF STUDY
03
Some complications such as hypersensitivity reactions, nodules, induration, facial edema
and localized cutaneous reaction have been widely reported in humans when treated with HA
fillers (Alijotas& García, 2008; Micheels, 2001; Loewe, et al., 2001). In practical, the injectable
filler should be safe, biocompatible and non-immunogenic (Kablik et al, 2009), non-allergenic,
non-carcinogenic, adverse-effect free and not associated with migration and excessive
inflammatory response following its application (Iannitti, Bingol, Rottigni & Palmieri, 2013 ;
John & price, 2009).
Currently, the cross-linking strategies take into account reduction of the toxic agents, so
there has been an increasing demand for HA-based hydrogels that offer advantages of lower
chemical cross-linkers. However, when an amount of a cross-linker is reduced, it is not easy to
obtain a stiff cross-linked hydrogel. In fact, preparing a cross-linked HA hydrogel with both a
low amount of chemical cross-linker and a high degree of cross-linking is difficult. This field of
study is currently receiving considerable attention, and has become one of the major challenging
issues in hydrogels manufacturing. Therefore, the main objective of our study was to enhance the
HA cross-linking efficiency while maintaining a constant level of the chemical cross-linker. The
cross-linking efficiency is a theoretical term introduced in this study to describe the total strength
of formed hydrogels. It represents the chemical cross-linking raised from the formation of
covalent bonds between HA chains and the cross-linker and the physical cross-links raised from
the polymer entanglements or conformation. We selected 1, 4-butanediol diglycidyl ether
(BDDE) as the chemical cross-linker, because it is currently used in the majority of market-
leading HA hydrogels. Such studies would provide alternative solutions for the enhancement of
cross-linking efficiency without exploiting excessive quantities of BDDE. The cross-linking
efficiency in each formed hydrogel was evaluated by measuring hydrogel’s properties such as in-
vitro degradation rate, swelling ability, morphological and rheological behavior.

AIMS OF STUDY
04
This dissertation is organized into seven chapters; Chapter 1 presents a theoretical
background of relevant information for hyaluronic acid and its application in cosmetic and
medical treatments. Chapter 2 describes the synthesis process applied for producing the HA
hydrogel cross-linked with 1, 4-butanediol diglycidyl ether. It also confirms the occurrence of
chemical modification by comparing the resulting BDDE-HA hydrogel with a native HA
solution. Chapter 3 compares three different analytical methods (chromatography, colorimetry
and gravimetry) for measuring the in-vitro degradation rate of cross-linked hydrogels.
Chapter 4 investigates the influence of reaction time, pH and temperature on cross-
linking efficiency of BDDE-HA hydrogels. Chapters 5 & 6 study the effect of HA initial
concentration and HA molecular weight on BDDE-HA cross-linking efficiency. In Chapter 7,
the mixing approach of HA with the reagent (BDDE) solution was described. Each chapter starts
with an introduction and ends with a conclusion describing the most essential results. The
chapters were subdivided after introduction as following: materials, synthesis, measurements,
results and discussion. If much data (numbers, tables or graphs) were extracted from the
experiments, the results and discussion were separated. Finally, the dissertation was ended with a
summary describing the presented work and references. Appendices were provided for additional
information.

CHAPTER 1: THEORETICAL BACKGROUND
05
CHAPTER 1
1. Theoretical background
1.1 Introduction to hyaluronic acid (HA)
Hyaluronic acid (HA) also known as hyaluronan (Fig.1.1) is a high-molecular
weight, naturally occurring biodegradable polymer. HA is a linear (unbranched) and non-
sulphated glycosaminoglycans (GAG). It is composed of repeating disaccharide units of
N-acetyl-D-glucosamine and D-glucuronic acid chemically linked by alternating
glycosidic bonds β - (1, 4) and β- (1, 3) (Schanté, Zuber, Herlin, & Vandamme, 2011;
Šimkovic et al., 2000 ; Fan, et al, 2006).
Figure 1. 1 Structure of the disaccharide repeating unit in HA
The name of " hyaluronic acid " was derived from two terms: the term "hyalos"
which means glass in the Greek language and the uronic acid. HA is a highly charged
polyanion polymer and it binds with water extensively due to the abundant hydrophilic
carboxyl groups (Allemann & Baumann, 2008; Kablik et al, 2009). Based on X-ray
diffraction and NMR, the molecular structure of HA can be found in different helical
conformations depending on different conditions such as pH, humidity, water content and
temperature. The most common forms are fully extended helix, three-fold helix and four-
fold helix stabilized by hydrogen bonds (Kaufmann, Mohle, Hofmann & Arnold, 1997).

CHAPTER 1: THEORETICAL BACKGROUND
06
In physiological solutions, the HA backbone forms a twisted ribbon structure
called ― coiled structure‖ due to the interactions of hydrogen bonds with the solvent
where the axial hydrogen atoms relatively form a non-polar face whereas the equatorial
side forms the polar face (Fakhari & Berkland, 2013). The molecular weight of HA
depends on the number of disaccharide units present in the chain which is proportional to
the HA molecular weight. The commercial HA is usually supplied as a sodium salt with a
molecular weight 401 Da for its basic unit (Kablik et al, 2009). HA is widely distributed
throughout the human body and it forms a major element in the extracellular matrix,
ECM (Scott,1995; Rhodes, 2007, Zhu, 2010;). It is present in almost all biological fluids
including synovial fluid and the vitreous humor of the eye (Zawko, Suri, Truong, &
Schmidt, 2009). The mean concentration of HA in human body is about 200 mg/kg, so
that a body weighing 60 kg contains about 12.0 g of hyaluronic acid (Romagnoli &
Belmontesi, 2008). The larger amount of HA is found in the skin and it approximately
contains more than 50 % of the total content within the body (Kablik et al, 2009). In
normal state, HA is present as a free polymer, however in some tissues, it is linked to
different glycoproteins or specific cell receptors (Romagnoli & Belmontesi, 2008). The
main function of HA is to create volume and provide lubricants to tissues, consequently
preventing cell damages induced through various physical stresses (Romagnoli &
Belmontesi, 2008). HA shows also inhibitory effects against a range of bacterial and
fungal species as well as antiviral activity (Iannittia, Bingölc, Rottignib & Palmierib,
2013). Moreover, HA is responsible for the regulation of cell adhesion, cell migration and
cell proliferation (Fakhari & Berkland, 2013). It plays also an important role in cartilage
matrix stabilization (Pitarresi et al, 2007). HA was first isolated by an American scientist
Karl Meyer and his assistant in 1934 from the vitreous body of cows’ eyes (Fakhari &
Berkland, 2013 ; Simoni et al, 2002) and Later, it was extracted from bovine vitreous
humor. The current source of HA powder is extracted from rooster comb or by bacterial
bio-fermentation. Efforts have been focused on producing high yields of HA from
genetically modified bacteria (Streptococcus) with low costly methods (Schanté, Zuber,
Herlin, & Vandammea, 2011).

CHAPTER 1: THEORETICAL BACKGROUND
07
1.2 Applications of HA
As reported, commercial HA is biocompatible and it possesses properties similar
of that in human tissues. These properties have allowed HA to be used in different
biomedical applications. In 1942, Endre Balazes was the first man who used HA in a
commercial purpose as a substitute for egg white in bakery products (Fakhari &
Berkland, 2013). However, over last two decades, HA has become a material of great
importance in modern medicine and it has been widely employed in tissue engineering
and cosmetic surgery (Liu et al., 2007 ; Kenne et al., 20). Here, we describe the most
common applications of HA in medicine and cosmetic fields.
1.2.1.1 Medicine
HA-based hydrogels have been widely used in tissue engineering because they
provide three-dimensional scaffolds which allow nutrients and cellular waste to be
diffused through it (Hoffman,2002). Treatment of osteoarthritis is a major biomedical
application of HA, where the viscoelastic properties of synovial fluid decrease as a result
of reduced HA molecular weight and concentration caused by aging (Arrich et al, 2005).
After aging or damage, synovial fluid cannot provide the required viscoelastic response
to various external stimuli allowing the development of cartilages contact and increasing
wear of joint surface, so HA has been accepted as a common therapy for reducing this
pain (Fakhari & Berkland, 2013). On the other hand, Hyaluronic acid has been studied as
an ophthalmic material in eye surgery including corneal transplantation, glaucoma,
cataract surgery and surgery to repair retinal detachment (Ruckmani et al, 2013 ;
Limberg, McCaa, Kissling, & Kaufman, 1987) . HA could promote corneal epithelial,
and improve function and integrity of superficial corneal cells (Yokoi, Komuro, Nishida
& Kinoshita, 1997 ). HA is widely used as an eye lubricant and a viscoelastic to raise
intraocular pressure (Holzer, 2001). Based on HA properties in the intraocular lens and
water swelling, Beek, Jones and Sheardown suggested in their study that HA containing
materials may have significant potential for use in contact lens applications (Beek, Jones
& Sheardown, 2007).

CHAPTER 1: THEORETICAL BACKGROUND
08
Recently, the HA-based hydrogels have been used in drug delivery (Eenschooten
et al., 2012). The HA drug carriers overcome the limitation of other polymeric carriers
which are not biodegradable or do not have potential drug loading. The drugs can be
easily loaded into the matrices of HA-based hydrogels and then released at a rate
dependent on hydrogel properties and in vivo degradation rate. The HA-based hydrogels
can also be tailored to control the release profile of the entrapped therapeutic
macromolecules.
1.1.3.2 Cosmetic
In cosmetic, the HA-based hydrogels have been increasingly used as anti-aging
products. We mentioned in the ― aims of study ― that most of complications associated
with the application of HA-based hydrogels are thought to be caused by the chemical
cross-linkers. It is known that as early as the third decade of life, the soft tissue structures
of the face start gradually to weaken and skin loses its elasticity associated with wrinkles
and thinning of subcutaneous fat (Sadick, Karcher & Palmisano, 2009). The swelling
properties of hyaluronic acid make it an effective agent for use as injectable fillers to
compensate loss of soft-tissues volume. The HA fillers have become very popular in
correcting facial folds and producing a younger facial appearance. They achieve a
substantial tissue augmentation into the affected skin and remain swollen in tissue for
longer time (Robinson & Aasi, 2011). HA fillers with different types and various cross-
linking efficiency are currently available in the market. Physicians select the most
suitable one for skin treatment and in some cases, more than one type can be injected in
layers to achieve substantial results, better elevating and skin visualization. Lips, cheek
and oral region are the most requested areas for tissue augmentation due to their
observable effect by aging process (Sadick, Karcher, & Palmisano, 2009). Full lips,
cheek and perioral region are esthetic features of the younger face and have symbolized
glamour, especially in women. So, elevating these areas by HA fillers, will have a
significant rejuvenation effect (Johl & Burgett, 2006).
Several aspects should be considered when dealing with HA-based dermal fillers
such as: source of HA, HA initial concentration, swelling capacity, stiffness, inclusion of
an anesthetic agent and whether the hydrogel is monophasic (soft continuous matrix) or

CHAPTER 1: THEORETICAL BACKGROUND
09
biphasic (particles suspended in physiological solution) (Wollina and Goldman, 2013).
The clinical performance of HA filler is largely affected by the aforementioned factors.
HA-hydrogel particles are ranged in diameters from 1 micron to 1000 microns and are
usually mixed with native or free HA solution to provide an easey injection (Allemann &
Baumann, 2008; Beasley et al., 2009). The normal range of total HA concentration
(modified + free HA) used in today HA fillers is between 18 mg/ml and 24 mg/ml.
Higher total HA concentration requires larger needle and greater force for injection.
It is worth noting here, that the physicians should consider the needle and depth at
which the material is implanted in order to achieve a good outcome with the HA fillers
(Cirillo et al, 2008 ; Carruthers et al, 2008). Injection procedure is crucial for obtaining
good results, a number of injection have been reported with two common procedures;
linear threading and serial puncture. The linear threading requires the needle to be
injected along the length of wrinkle line or fold, and a thread containing the HA filler is
introduced as the needle is removed. In the serial puncture, multiple injections of fillers
are administrated close together followed by a massage to ensure equal distribution of the
gel throughout the affected area (Sánchez-Carpintero. Candelas & Ruiz-Rodríguez,
2010). Several HA fillers have been approved by the US Food and Drug administration
(FDA) for the correction of facial wrinkles and folds that include Restylane (Medicis;
Scottsdale, Arizona), Hylaform (INAMED Aesthetics) and Juvéderm (INAMED
Aesthetics) (Raghu & Athre, 2007). The Restylane and Juvéderm are bacteria-derived
fillers, however the Hylaform is derived from rooster combs (Narins & Bowman, 2005).
Since the approval of these fillers, the cosmetic market for hyaluronic acid HA-based
dermal fillers is in continuous and rapid growth. Restylane and Perlane are particulate-
based fillers where the particles are formed during the sizing process. These fillers are
widely used for mid -to - deep dermal injection. In contrast, Juvéderm is a non-particulate
and more homogenous filler (Baumann, 2004). It is more indicated for superficial fine
lines and wrinkles.

CHAPTER 1: THEORETICAL BACKGROUND
21
1.3 HA cross-linking
HA has been used in various medical and cosmetic application, however, most of
these applications are not addressed with native HA. As stated before, the native HA has
very limited applications, because it does not remain in human body for prolonged
periods due to its in vivo rapid degradation and poor mechanical properties (Liu et al.,
2007; Jeon et al., 2007 ; Pitarresi et al., 2007). As reported, the half-life of native HA in
the skin is longer than 24 hours (Brown, Laurent, & Fraser, 1991). HA is degraded into
monosaccharide by an enzyme called hyaluronidase (Hyal) (Zhong et al, 1994 ;
Lepperdinger, Fehrer, & Reitinger, 2004 ; Coleman & Grover, 2006). This enzyme
cleaves the internal β-N-acetyl glucosaminidic linkages yielding fragments with N- acetyl
–glucosamine at the reducing terminus and glucuronic acid at the non-reducing end
(Zhong et al, 1994). HA can also be degraded in the organism by CD44 cell surface
receptors and the reactive oxygen species (ROS) (Schante, Zuber, Herlin, & Vandamme,
2011). In fact, HA stability forms a crucial part to its utilization in the clinical application
(Serben, Yang, & Prestwish, 2008). Therefore, HA should be stabilized via cross-linking
methods to ensure a longer residence time within the soft tissue after administration into
the body. These methods are of two main parts: chemical and physical cross-linking.
1.3.1 Chemical cross-linking
Chemical cross-linking is a common method used to improve HA mechanical
behavior and prolong its duration. It involves cross-linking different HA chains by
covalent bonds using a chemical cross-linker. The number of cross-linker molecules that
form double links (reacts with HA at both ends) to the number of HA disaccharides units
is expressed by the degree of cross-linking (Edsman et al., 2012). The degree of cross-
linking plays an important role in commercializing HA products particularly in the
industry of cosmetic. It is essential to evaluate the degree of cross-linking prior to the
clinical administration. A product with a high degree of cross-linking shows slower
degradation rate, good mechanical properties and higher restoration and correction.

CHAPTER 1: THEORETICAL BACKGROUND
20
The degree of cross-linking is sometime used interchangeably with the degree of
modification. However, this is technically incorrect. The degree of modification is the
ratio of cross-linker molecules that form mono- and double links to the number of HA
disaccharides (Kenne et al., 2013). The mono-linked molecules do not form covalent
bonds because they are reacted with the HA chains at one end leaving the other end
pendants. These pendants do not contribute in hydrogel’s strength or resistance against
enzymatic de-polymerization process.The result of chemical cross-linking is a three-
dimensional HA-hydrogel which could retain water within its cross-linked network, but
does not dissolve in water. Chemically or covalently cross-linked hydrogels are stable
materials and show much higher resistant against enzymatic degradation than native HA
due to the formation of bridges and intermolecular bonds between the HA chains and the
cross-linker. As stated before, various chemical cross-linkers have been employed for HA
cross-linking such as carbodiimide, divinyl sulfone (DVS) and 1,4-butanediol diglycidyl
ether (BDDE). The chemical cross-linking usually targets the carboxylic group (- COOH)
or the hydroxyl group (- OH) of the HA chain structure.
1.3.1.1 (- COOH)
The – COOH group of HA can be modified to form ester bond via alkylation or
reaction with epoxides. Esterification by alkylation (Fig. 1.2 A) uses alkyl halides such as
alkyl bromides or iodides. This reaction was described by (Della Valle & Romeo, 1986),
and it was performed at 30 0C for 12h. Later, (Pelletier et al, 2000) described similar
method but with longer reaction time. Alkylation is performed in DMSO which means
that the native HA has to be first converted into its TBA salt. Epoxide is a cyclic ether
with a three-atom ring. It undergoes a ring-opening reaction and forms ester with HA
polymer through the carboxylic group . A one example of this reaction; the reaction of
HA with glycidyl methacrylate to form methacrylated HA as shown in (Fig. 1.2 B)
(Bencherif et al., 2008 ; Leach, Bivens, Patrick & Schmidt, 2003 ; Pata, Barth, Bencherif
& Washburn, 2010 ; Weng, Gouldstone, We & Chen, 2008). This reaction is performed
in water in the presence of excess triethylamine as a catalyst (Schante, Zuber, Herlin, &
Vandamme, 2011).

CHAPTER 1: THEORETICAL BACKGROUND
22
Figure 1. 2 Esterification using alkyl halide (A), the reaction of HA with glycidyl methacrylate to form
methacrylated HA (B) (Schante, Zuber, Herlin, & Vandamme, 2011)
1.3.1.2 (-OH)
Modification targeting (- OH) group in the HA chains is widely employed,
particularly for the development of HA fillers, because it preserves the polyanionic nature
of HA (Allemann & Baumann, 2008 ; Andre, 2004 ; Beasley, Weiss & Weiss, 2009 ;
Falcon & Berg, 2008 ; Gatta et al., 2013; Chug et al., 2011 ; Hwang et al., 2012 ; Ibrahim
et al., 2010 ; Kang et al., 2009 ; Kim et al., 2007 ; Segura et al., 2005 ; Yoon et al., 2011
& Gatta et al., 2013). The chemical reaction between HA and 1,4-butanediol diglycidyl
ether BDDE was first described by (Malson & Lindqvist, 1986), the HA solution was
mixed with BDDE under alkaline conditions and an ether linkage was formed (Fig 1.3).
This reaction involves ―epoxide ring opening‖ process and it is performed in a basic
medium, where the epoxide ring reacts preferentially with the hydroxyl group to form
ether bonds
Figure 1. 3 Ether formation by crosslinking two HA chain with BDDE (Schante, Zuber, Herlin, &
Vandamme, 2011)

CHAPTER 1: THEORETICAL BACKGROUND
23
1.3.2 Physical cross-linking
Currently, there has been an increasing interest on physical cross-linking due to
the ease of synthesis and advantage of not using a chemical cross-linker. Physical cross-
linking is carried out via various physical methods including formation of complex
coacervation and polymer conformations (Hennink & Nostrum, 2002 ; Gulrez, Al-Assaf
& Phillips, 2011). Complex coacervation can be obtained by binding of two oppositely
charged polymer (polyanion + polycation) driven by electrostatic interactions and form
soluble and insoluble complexes (Fig. 1.4). One example of this binding is coacervating
hyaluronic acid with lysozyme (Water et al., 2014) and also binding of polyanionic
xanthan with polycationic chitosan (Esteban & Severian, 2000). Physical cross-linking
can also be obtained through polymer conformations and entanglements. By increasing
chains entanglements of a soluble polymer, the polymer solubility decreases and a 3 D
network composite is formed with an elastic property. Cross-linked hydrogels may also
be prepared in the presence of a strong acid to induce hydrogen bonds, this involves
replacing the sodium in the polymer with the hydrogen in the acid. An example of
hydrogen bonding, is the intermolecular bonding between polyacrylic acid and
polyethylene oxide (Hoffman, 2002 ; Gulrez, Al-Assaf & Phillips, 2011).
Figure 1. 4 Complex coacervation between a polyanion and a polycation (Gulrez, Al-Assaf & Phillips,
2011)
Despite the advantages of physical cross-linking, this method alone is not enough
for the formation of stiff cross-linked hydrogel. The network interactions of physically
cross-linked hydrogels are reversible and can be disrupted by stress or change in physical
conditions (Rosiak & Yoshii, 1999). They do not show a high resistance against
enzymatic degradation and even they do not retain their 3D network for longer time
particularly when they come in contact with aqueous fluids (Amargier et al., 2006).
CHAPTER 1: THEORETICAL BACKGROUND
24
1.4 Cross-linking efficiency
As we stated earlier, the main goal of this work was to enhance cross-linking
efficiency of BDDE-HA hydrogel without increasing BDDE concentration. The cross-
linking efficiency describes the total hydrogel’s strength which includes the chemical and
physical cross-linking occurred within the hydrogel’s network. To achieve this goal, our
hypothesis was set on changing method conditions that yielded less pendants formation,
more covalent bonds between HA and BDDE and more HA entanglements. Evaluation of
cross-linking efficiency requires analysis of hydrogel’s properties including degradation
rate, swelling capacity, surface morphology and rheological behavior. Several analytical
instruments were employed to study these properties such as digital balance, high
performance liquid chromatography (HPLC), UV-Visible spectrophotometer, scanning
electron microscopy (SEM) and rheometer . Other instruments such as Fourier transform
infrared (FTIR), capillary electrophoresis (CE), electro-spray ionization mass
spectrometry (ESI-MS) and nuclear magnetic resonance spectroscopy (NMR) are more
eligible for the confirmation of the occurrence of chemical modification. The Appendix 1
displays an introduction to some analytical instruments employed in this study for the
characterization of HA hydrogels.

CHAPTER 2: CROSS-LINKING HYALURONIC ACID WITH BDDE
25
CHAPTER 2
2. Cross-linking hyaluronic acid with BDDE
2.1 Introduction
HA cross-linking refers to a process in which HA chains are chemically bound
with a chemical cross-linker through one of the HA functional groups including
(- OH, - COOH, - NHCOCH3), in order to improve HA’s mechanical properties and
prolong its residence after administration into the body. Due to the importance of cross-
linked hydrogel versus linear or native HA in biomedical application, researchers have
developed several synthetic routes based on various characteristics sought, to obtain
hydrogels with more desired effect. In our work, we modified a reported method
described by (Malson & Lindqvist, 1986) and later improved by (Piron & Tholin, 2002),
for cross-linking HA chains with 1, 4-butanediol diglycidyl ether BDDE. The reaction
was carried out in strong alkaline conditions to form stable ether bonds (De Boulle et al.,
2013). The epoxide groups of BDDE preferentially react with the hydroxyl groups of
HA, because at high pH range, the deprotonated hydroxyls are more predominant than
both anionic carboxylic group and the amide (Kenne et al., 2013).
2.2 Preparation of cross-linked BDDE-HA hydrogel
2.2.1 Materials
The sodium salt of hyaluronic acid was obtained from Vivatis Pharma (Hamburg,
Germany), with an average molecular weight 1,000,000 Da. For synthesis and
de-polymerization: 1, 4-butanediol diglycidyl ether (BDDE) and hyaluronidase powder
(3000 U/ mg) were purchased from Sigma-Aldrich Co (St. Louis, Missouri, USA). All
other chemicals were of analytical grade, unless otherwise stated.

CHAPTER 2: CROSS-LINKING HYALURONIC ACID WITH BDDE
26
2.2.2 Synthesis
A 2.0 % (v/v) cross-linking reagent solution was prepared by adding 200 µl of
BDDE into 9.80 ml of 0.25M NaOH . About 1.20 g of hyaluronic acid HA powder was
added to the mixture and allowed to mix thoroughly at room temperature for 60 min (pH
13), so the HA concentration was 12 % (w/v). The epoxide ring in BDDE opened to form
ether bonds with the HA hydroxyl groups as described in Fig. 1.3. After the reaction is
complete, the mixture was neutralized by adding an equivalent amount of 0.1M HCl to a
pH of approximately 7.0 and then dialyzed against distilled water for 3 days to remove
un-reacted HA fragments and BDDE residue. The resulting product was a transparent gel
(Fig. 2.1 A). The cross-linked hydrogel was then lyophilized using (Labtech freeze-dryer
LFD 5518 model, Daihan Labtech Co); the sample was first frozen at – 80 oC in an ultra-
low temperature freezer (MDF-U3386S, SANYO Electric Co. Japan) for 4 h to ensure
complete freezing and then sublimed at –50 oC for 24 h under a vacuum of 5 mTorr.
When all free ice was removed, the temperature was raised to 25 oC and the sample was
left for 2 h to remove excess water bound to it (Fig. 2.1 B). Finally, the product was
stored at 8 oC until the characterization studies were carried out. The cross-linked
hydrogel was compared with a native HA polymer to confirm the occurrence of cross-
linking process.
Figure 2. 1 Hydrated BDDE-HA hydrogel (A), Lyophilized BDDE-HA hydrogel (B).

CHAPTER 2: CROSS-LINKING HYALURONIC ACID WITH BDDE
27
2.3 Comparison between native and cross-linked HA
2.3.1 Materials
Samples of native HA and cross-linked BDDE-HA hydrogel, enzyme
hyaluronidase (solid powder) with 3000 U/mg. Ehrlich's reagent, phosphate buffer saline
(PBS) and alkaline solution.
2.3.2 Measurements
The resulting cross-linked hydrogel was compared with the native HA solution to
confirm the occurrence of modification process using four analytical techniques.
2.3.2.1 Fourier-transformed infrared (FT-IR) analysis
Portions from native HA solution and cross-linked BDDE-HA hydrogel were
obtained and characterized using Bruker Tensor 37; Fourier Transform Infrared
Spectroscopy (FT-IR) (Ettlingen, Germany). All spectra were recorded between 4000 and
400 cm-1
with a resolution of 4 cm-1 and the data was manipulated using OPUS software.
2.3.2.2 Capillary electrophoresis (CE)
Equivalent portions from native HA solution and cross-linked BDDE-HA
hydrogel were obtained and dissolved in BTH solution separately. The two extracts were
filtered, degassed and then moved into capillary electrophoresis vials. The analysis was
performed using a Hewlett-Packard CE system (Waldbronn, Germany) at 50 mbar
pressure and 22 kV separation potential for 10 min. Analysis was performed in normal
polarity mode with hydrodynamic injection and the analytes were detected by direct
ultraviolet (UV) absorbance at 194 nm. A buffer solution at 50 mM concentration was
prepared by dissolving 5.0 g sodium tetraborate Na2B4O7 (Mw= 201.22 g/mole) in
distilled water and filled up to 500 ml. The pH was adjusted to 7.4 and measured by a pH
meter.

CHAPTER 2: CROSS-LINKING HYALURONIC ACID WITH BDDE
28
2.3.2.3 Electro-spray ionization mass spectrometry ESI-MS
Known amounts of native HA and cross-linked hydrogel were obtained and
treated with hyaluronidase for 4 h digestion. The resulting solutions were centrifuged and
the supernatant in each container was collected and then diluted 1: 50 in purified water.
Electro-spray ionization mass spectrometry (ESI-MS) measurements were carried out
using the Quattro Premier XE mass spectrometer instrument Q-MS (Waters Corporation,
Manchester, UK). The hydrogels extracts were introduced into the instrument through
direct infusion using a syringe pump and the experimental conditions were set as follow:
capillary voltage 4.0 kV, con voltage (voltage of sampling cone to ionize and direct ions
to the mass analyzer) 30 V, dissolvation temperature 150 0C and source temperature
100 0C. The full scan mass spectra from m/z 200-2000 were acquired in negative
ionization mode with a scan speed of 1 s per scan.
2.3.2.4 Nuclear magnetic resonance spectroscopy (NMR)
Portions from lyophilized native HA and the cross-linked hydrogel were taken
and digested with hyaluronidase solution placed in separate containers. The extracts were
filtered via 45 µm Watmaan paper and then centrifuged at 2000 rpm for 2 min. The
supernatants were removed then re-lyophilized to afford white foam. The 1H NMR
spectra were recorded on a Bruker 600 MHz (Zurich, Switzerland) operating at a
frequency of 600 MHz.
2.3.3 Results and discussion
2.3.3.1 FTIR
The FTIR spectra (Figures 2.2 & 2.3) revealed three characteristic peaks that
confirmed the successful modification of the native HA ; peak 1 at 3343 cm-1
observed in
native HA and cross-linked hydrogel, peak 2 at 2900 cm-1
observed in cross-linked
hydrogel and relatively in native HA. Peak 3 at 1300 cm-1
observed in the cross-linked
hydrogel. Peak 1 was assigned to the hydroxyl group whereas peaks 2 and 3 represented
the C- H stretching and ether linkage respectively. As stated, at high pH values or above
the pKa value of the hydroxyl groups, the hydroxyl groups become almost deprotonated.
CHAPTER 2: CROSS-LINKING HYALURONIC ACID WITH BDDE
29
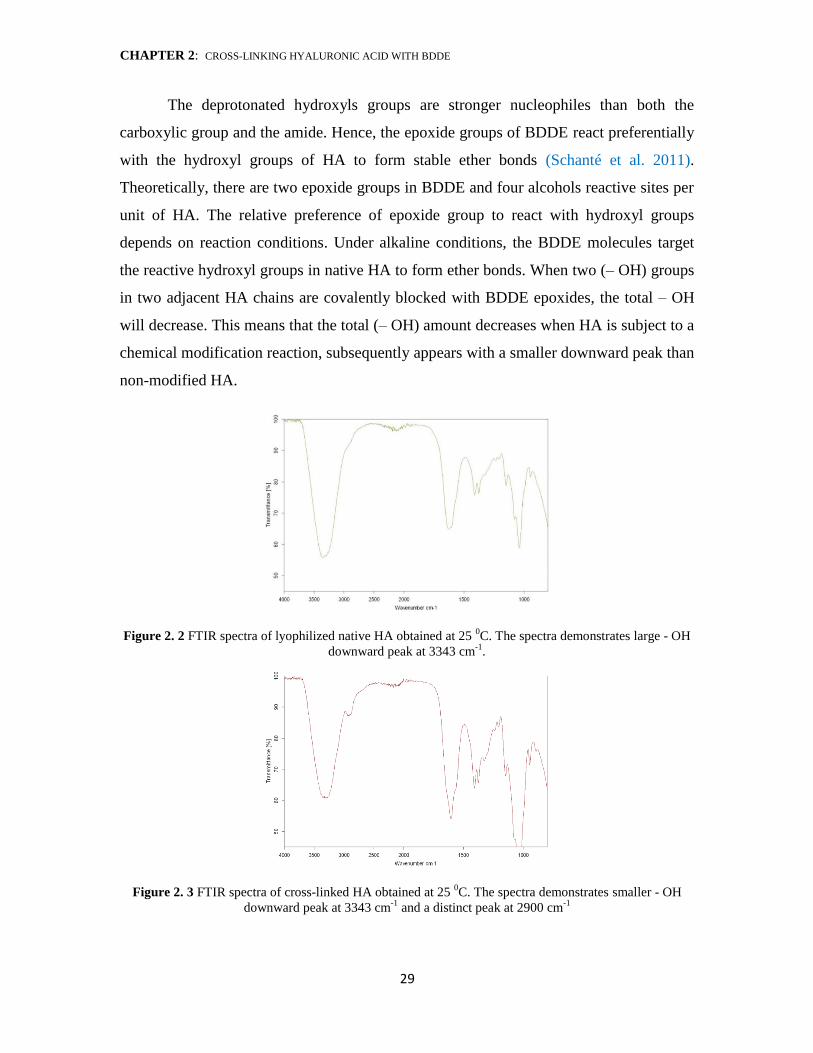
The deprotonated hydroxyls groups are stronger nucleophiles than both the
carboxylic group and the amide. Hence, the epoxide groups of BDDE react preferentially
with the hydroxyl groups of HA to form stable ether bonds (Schanté et al. 2011).
Theoretically, there are two epoxide groups in BDDE and four alcohols reactive sites per
unit of HA. The relative preference of epoxide group to react with hydroxyl groups
depends on reaction conditions. Under alkaline conditions, the BDDE molecules target
the reactive hydroxyl groups in native HA to form ether bonds. When two (– OH) groups
in two adjacent HA chains are covalently blocked with BDDE epoxides, the total – OH
will decrease. This means that the total (– OH) amount decreases when HA is subject to a
chemical modification reaction, subsequently appears with a smaller downward peak than
non-modified HA.
Figure 2. 2 FTIR spectra of lyophilized native HA obtained at 25 0C. The spectra demonstrates large - OH
downward peak at 3343 cm-1
.
Figure 2. 3 FTIR spectra of cross-linked HA obtained at 25 0C. The spectra demonstrates smaller - OH
downward peak at 3343 cm-1
and a distinct peak at 2900 cm-1
CHAPTER 2: CROSS-LINKING HYALURONIC ACID WITH BDDE
31
Finally, the FTIR data confirmed the occurrence of chemical modification with
the BDDE molecules. The hydroxyl band group of native HA was larger than its
counterpart in the cross-linked hydrogel.
2.3.3.2 Capillary electrophoresis (CE)
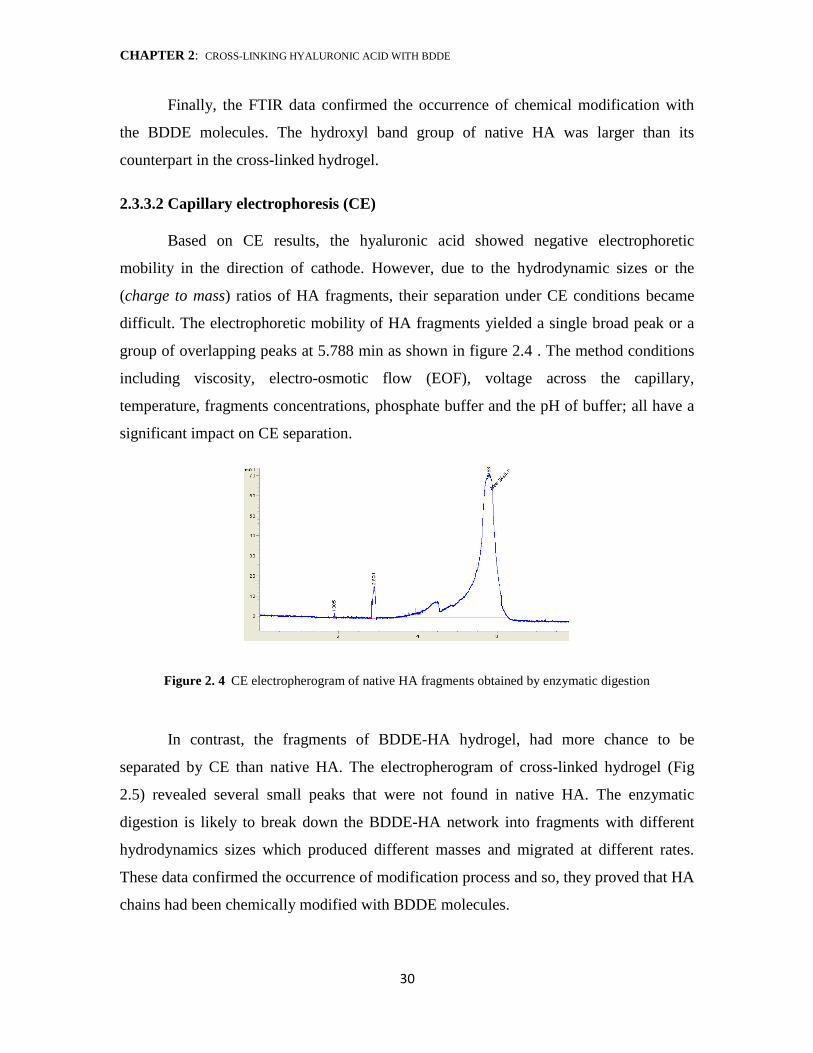
Based on CE results, the hyaluronic acid showed negative electrophoretic
mobility in the direction of cathode. However, due to the hydrodynamic sizes or the
(charge to mass) ratios of HA fragments, their separation under CE conditions became
difficult. The electrophoretic mobility of HA fragments yielded a single broad peak or a
group of overlapping peaks at 5.788 min as shown in figure 2.4 . The method conditions
including viscosity, electro-osmotic flow (EOF), voltage across the capillary,
temperature, fragments concentrations, phosphate buffer and the pH of buffer; all have a
significant impact on CE separation.
Figure 2. 4 CE electropherogram of native HA fragments obtained by enzymatic digestion
In contrast, the fragments of BDDE-HA hydrogel, had more chance to be
separated by CE than native HA. The electropherogram of cross-linked hydrogel (Fig
2.5) revealed several small peaks that were not found in native HA. The enzymatic
digestion is likely to break down the BDDE-HA network into fragments with different
hydrodynamics sizes which produced different masses and migrated at different rates.
These data confirmed the occurrence of modification process and so, they proved that HA
chains had been chemically modified with BDDE molecules.

CHAPTER 2: CROSS-LINKING HYALURONIC ACID WITH BDDE
30
The CE is a powerful technique to separate glycosaminoglycan-derived
oligosaccharides, however, for the quantification of cross-linked HA fragments, it
requires an extensive preparation procedure.
Figure 2. 5 CE electropherogram of cross-linked BDDE-HA fragments obtained by enzymatic digestion
2.3.3.3 ESI-MS
The bovine testicular hyaluronidase was used to digest known quantities of native
HA and cross-linked BDDE-HA hydrogel. Extracts were qualitatively analyzed by
electro-spray ionization mass spectrometry ESI-MS using direct infusion. Fig. 2.6
displays MS spectra of native HA oligomers generated by the enzymatic digestion,
whereas Fig. 2.7 displays the MS spectra of cross-linked BDDE-HA hydrogel generated
under similar conditions. The ESI-MS technique could clearly distinguish the native HA
and cross-linked ion species and relatively exhibited different mapping spectra. The MS
spectrum of cross-linked hydrogel showed no identical peaks with its counterpart
spectrum of HA. The oligosaccharides of cross-linked hydrogel exhibited a different
charge state distribution profile suggesting that the BDDE-HA had undergone a
successful modification. The results showed various oligosaccharide fragments with
different relative intensities and chain length ranged from the basic unit of hyaluronic
acid to a greater than 16-mers. In general, the ions observed in native HA and cross-
linked hydrogel were singly and multiply charged ions corresponding to the disaccharide
oligomer of hyaluronic acid.

CHAPTER 2: CROSS-LINKING HYALURONIC ACID WITH BDDE
32
Figure 2. 6 The ESI-MS profiles of native HA obtained by direct infusion at 4.0 kV capillary voltage
Figure 2. 7 The ESI-MS profiles of cross-linked HA-BDDE hydrogel obtained by direct infusion at 4.0 kV
capillary voltage
According to the data, some small and large peaks that commonly represent the
disaccharide unit of hyaluronic acid are clearly observed in native HA, but not in the
cross-linked hydrogel, particularly at the lower range of MS spectrum. These peaks
confirmed the occurrence of chemical modification. For instance, The mass peak
observed at m/z 396 in native HA spectra is attributed to the disaccharide unit and a water
molecule ([GlcUA – GlcNAc] + H2O ). Also, the peak at m/z 192.8 which further showed a
fragment at m/z 176 after losing a water molecule and the peak at m/z 201.89 appeared in
native HA were assigned for glucoronic acid (GlcA) and N-acetyl-D-glucosamine
(GlcNAc – H2O) respectively.

CHAPTER 2: CROSS-LINKING HYALURONIC ACID WITH BDDE
33
On the other hand, the triply charged peak [ M-3H]2-
at m/z 510.01 and the doubly
charged peak at m/z 575.97 were also observed in native HA but not in the cross-linked
hydrogel. In our experiment, some oligosaccharides were easily defined and they were in
good agreement with the theoretical ion species of HA degradation products. However,
some oligosaccharides were difficult to be assigned due to the fragmentation and
collisional activation which are usually seen during the ESI-MS analysis. The enzyme
cleaves the 1,4-linkages between N-acetyl-D-glucosamine (GlcNAc) and glucoronic acid
(GlcA) yielding oligomers with N-acetyl-D-glucosamine at the reducing terminal and
unsaturated uronic acid (ΔUA) at the non-reducing terminal (even-numbered
oligosaccharides) and fragments with uronic acid UA at both the reducing and non-
reducing terminal (odd-numbered oligosaccharides). Table 2.1 displays fragmentation
pattern of even and odd-numbered oligomers obtained from native HA, while table 2.2
displays fragmentation pattern of even and odd-numbered oligomers obtained from the
cross-linked hydrogels.
Based on the results, most of native HA oligomers were observed at lower mass
range and became more abundant at m/z below 900. This was due to high degradation
rate of native HA which had a very low resistance toward enzymatic digestion. In
contrast, the cross-linked oligomers generally appeared to have higher mass ranges where
BDDE can slow down the enzymatic degradation. However, detailed analysis of cross-
linked oligosaccharides or estimating the total degree of modification by ESI-MS is still
challenging due to the viscoelastic properties and complex mixture of larger
oligosaccharides generated by hyaluronidase . (Kenne et al., 2013). Additionally, we
observed in our method, that the resulting oligomers were greatly influenced by method
conditions and mass spectrometric parameters. For example, any change in cone voltage
or dissolvation temperature produces different fragmentation pattern. The (appendix 2)
demonstrates the MS spectrum of disaccharide unite and the extended range of native and
cross-linked hydrogel up to 2000 m/z .

CHAPTER 2: CROSS-LINKING HYALURONIC ACID WITH BDDE
34
Table 2. 1 Possible oligomers of native HA hydrogel formed after 4h digestion with hyaluronidase and
detected by direct infusion, ESI-MS at 30 v con voltage .
Observed m/z Charge Possible oligomer
192.80 201.89 378.04 396.02 471.89 510.01 575.97 1135.9 1894
-1 -1 -1 -1 -4 -3 -2 -1 -1
GlcA
GlcNAc 2 mer
2 mer + H2O 10 mer
8 mer + H2O 6 mer + H2O
6 mer 10 mer
Table 2. 2 Possible oligomers of cross-linked BDDE-HA hydrogel formed after 4h digestion with
hyaluronidase and detected by direct infusion, ESI-MS at 30 v con voltage .BDDE = mono-linked, BDDE*
= cross-linked
Observed m/z Charge Possible oligomer
571.7
651.53 668.27 703.95 717.49
960 1010.31 1018.08 1077.21
1197 1223.87
1338 1338.9 1428
1515.25 1527.48 1919.9
-3 -3 -2 -3 -4 -2 -3 -3 -3 -1 -2 -1 -2 -2 -2 -2 -1
8-mer-BDDE* 8-mer-2BDDE 6-mer-BDDE* 10-mer-BDDE 14-mer-BDDE
8-mer-2BDDE* 16-mer-BDDE
14-mer-2BDDE* 16-mer-BDDE* 4-mer-2BDDE
13-mer 6-mer-BDDE*
12-mer-2BDDE* 14-mer-BDDE* 16-mer-BDDE
14-mer-2BDDE* 8-mer-2BDDE*
2.3.3.4 NMR
According to the NMR spectra, two interesting peaks were considered; peak (1)
represented the acetyl glucosamine N-CH3 at about 1.9 ppm in native HA and cross-
linked hydrogel.

CHAPTER 2: CROSS-LINKING HYALURONIC ACID WITH BDDE
35
Peak (2) represented the – (CH2) for BDDE at about 1.5 ppm in the cross-linked
hydrogel which suggested chemical modification in HA polymer. Fig. 2.8 shows the
NMR spectra of HA native, while Fig 2.9 represents the spectra of cross-linked hydrogel.
Figure 2. 8 NMR spectra of lyophilized native HA digested fragments obtained at 25 0C.
Figure 2. 9 NMR spectra of lyophilized BDDE- HA digested fragments obtained at 25 0C
Integration of the signal at 1.5 ppm (BDDE) with respect to the signal at 1.9 ppm
(N-CH3) gives an approximation of the total degree of modification occurred within HA
chains. The degree of modification was found to be 3.4%, this value corresponded to the
amount of BDDE linked with HA.

CHAPTER 2: CROSS-LINKING HYALURONIC ACID WITH BDDE
36
In fact, this degree of modification was far less than the theoretical degree of
modification which was supposed to equal 30 % based on molar ratio. This explained that
the amount of BDDE mixed with HA was not completely consumed in the chemical
reaction. NMR is a powerful technique for studying the relationship between the cross-
linker concentration and the degree of modification. It is widely employed to confirm the
occurrence of chemical modification or estimate the total degree of modification. In a
separate work, we validated this relationship by preparing four HA hydrogels cross-
linked with different BDDE concentrations: 0.25%, 0.50%, 0.75% and 1.0% (v/v). The
(appendix 3) concludes the results and show how the degree of modification was
increased with the increase of BDDE concentration.
2.4 Conclusion
In this chapter, a cross-linked BDDE-HA hydrogel was prepared according to a
reported method with a little modification. The cross-linking reaction was performed in a
strong alkaline medium and allowed to stand for 60 min at pH 13 and 25 oC. The cross-
linked hydrogel was compared with a native HA solution using FTIR, CE, ESI-MS and
NMR, the result confirmed the occurrence of cross-linking process. The FTIR proved that
the total amount of (– OH) in the cross-linked hydrogel was less than in native HA. The
native HA had a slight different migration time from the cross-linked hydrogel with less
separated fragments than the cross-linked hydrogel. The ESI-MS could relatively
discriminate the native HA spectrum from the cross-linked HA spectrum. NMR was
more characteristic for confirmation of the modification process by showing a distinctive
peak at 1.5 ppm for BDDE. Furthermore, integration of BDDE signal to the (N-CH3)
signal in the NMR spectra allowed the estimation of the total degree of modification.

CHAPTER 3: EVALUATION OF IN-VITRO DEGRADATION RATE OF CROSS-LINKED BDDE-HA HYDROGEL
37
CHAPTER 3
3. Evaluation of in-vitro degradation rate of cross-linked
BDDE-HA hydrogel.
3.1 Introduction
Evaluation of the degradation rates of cross-linked hydrogels has become one of
most important considerations in the market and forms a key factor to the cross-linking
efficiency. Durability or resistance toward enzymatic reaction can make the hydrogel a
unique material. So, the development of reliable analytical methods for assessing such
ability is fundamental. Although most currently available commercial HA fillers are
cross-linked with BDDE, there are a few of analytical methods described in literature to
follow-up the in-vitro degradation rate. The majority of reported methods included
change in viscosity, change in water content, and colorimetric assay (carbazol reaction)
for the liberated glucuronic acid (Sall & Fe´rard, 2007). These methods are time-
consuming, less accurate and all of them are substantially employed to test the sensitivity
of native HA to the reaction of hyaluronidase. Therefore, prior to working on method
conditions, we dedicated this chapter to compare three different analytical methods
(chromatographic, colorimetric and gravimetric) for the evaluation of in-vitro degradation
rate of HA-based hydrogels.

CHAPTER 3: EVALUATION OF IN-VITRO DEGRADATION RATE OF CROSS-LINKED BDDE-HA HYDROGEL
38
3.2 Development of (chromatographic, colorimetric and
gravimetric) methods to quantify the in-vitro degradation rate
3.2.1 Material
Sodium salt of HA was donated from Vivatis Pharma. BDDE reagent and
hyaluronidase powder (3000 U/ mg) were purchased from Sigma-Aldrich.Ehrlich's
reagent, phosphate buffer saline (PBS) and alkaline solutions were prepared in the
laboratory.
3.2.2 Synthesis
Nine hydrogels X1- X9 were synthesized according to (Malson & Lindqvist, 1986;
Piron & Tholin, 2002) using 1, 4-butanediol diglycidyl ether (BDDE) as a chemical
cross-linker. All cross-linked hydrogels were lyophilized and kept in the fridge until the
in-vitro degradation tests were performed. The hydrogels X1, X2 and X3 were assigned for
HPLC method, X4, X5 and X6 for UV-Visible spectroscopy method and X7, X8 and X9 for
weight loss method.
3.2.3 Measurements
3.2.3.1 Chromatographic method
The lyophilized hydrogels X1, X2 and X3 were swollen in distilled water and left
overnight to reach their equilibrium states. Three samples X1A, X2A, and X3A equivalent
in weight (5.0 g per each) were cut from the swollen hydrogels and placed in separate
containers. Each sample was mixed with 500µl of hyaluronidase BTH solution (specific
activity of 300 units per milliliter) and incubated at 37 0C. After 24h, the reactions were
stopped by boiling for 10 min and then centrifuged at 2000 rpm for 2 min to separate the
extract from the solid part. The three extracts were then diluted with purified water up to
the mark in 100 ml volumetric flasks. Another three samples X1B, X2B, and X3B
equivalent in weight (5.0 g per each) were cut from the swollen hydrogels and kept with
hyaluronidase (BTH) under same conditions until complete digestion had occurred.

CHAPTER 3: EVALUATION OF IN-VITRO DEGRADATION RATE OF CROSS-LINKED BDDE-HA HYDROGEL
39
The contents of NAG in liquid extracts of all samples X1A, X2A, X3A, X1B, X2B,
and X3B were quantified by HPLC (Agilent 1220 infinity, Waldbronn, Germany)
equipped with a built-in auto-sampler and diode-array detector. The stationary phase was
C18 end-capped column (100cm x 2mm) with 5 µm particle size from (knauer, Berlin,
Germany). Different compositions of mobile phase were initially tested to obtain best
signals and robust method. Finally the mobile phase composed of two solutions A: 96%
(water 96% + acetonitrile 4%), B: methanol 4%.
The column was first equilibrated with the mobile phase and the analysis was
performed in isocratic mode with an injection volume of 2 µl and a flow rate of 0.4
ml/min. The wavelength was set up at 195 nm and the run time of the method was 10
min. Quantification was carried out against series of standard solutions prepared by
enzymatic digestion of non-cross-linked hyaluronic acid and treated in the same manner
of cross-linked hydrogels. The concentrations of standards ranged between 20 and 300
µg/ml and they were all prepared in 100 ml volumetric flasks. The degradation rates of
the three hydrogels X1, X2 and X3 were then evaluated by calculating the relative
difference (%) of NAG found in the extracts released after one day enzymatic digestion
(samples A) to the total amount of NAG found in the extracts released after complete
digestion (sample B). Finally, an average degradation rate of the three hydrogels was
obtained with 95% confidence interval.
3.2.3.2 Colorimetric method
A colorimetric method for the quantification of NAG in sugars was developed by
(Morgan & Elson, 1934) who described that the heated medium of NAG could produce
reddish-purple color after addition of acetic acid and p-dimethyl amino- benzaldehyde
acidified with hydrochloric acid (Ehrlish's reagent). They showed that under certain
conditions the NAG found in the extract can be converted into oxazole derivative which
are condensed by Ehrlich's reagent giving the perceptible color. In our work, the greatest
color intensity per 1 ml of NAG solution was achieved when the reaction was carried out
in a solution containing 0.25M Na2CO3 and boiled for 1 min. Boiling for more than 1 min
led to the destruction of glucosamine and produced less color intensity.
CHAPTER 3: EVALUATION OF IN-VITRO DEGRADATION RATE OF CROSS-LINKED BDDE-HA HYDROGEL
41
Regarding the glacial acetic acid, the final color intensity could be developed if
the volume of this solvent was approximately six-fold larger than the volume of NAG
solution. By using this proportion, the method was sensitive and the amount of NAG as
small as 0.001g found in the extract was possible to be detected. The lyophilized
hydrogels X4, X5 and X6 were swollen in distilled water until reached their equilibrium
states. In analogy to the HPLC method, two samples A and B equivalent in weight (5.0 g
per each) were cut from each hydrogel and placed in separate test tubes. Each sample was
treated with 500µl of bovine testicular hyaluronidase BTH (activity of 300 U/ml) at 37C0.
The reactions of samples A were stopped after 24 h, while the reactions of samples B
were left until complete digestion. All liquid extracts were further purified through
centrifugation and then transferred into 10 ml volumetric flasks and diluted up to the
mark.
Nine standard solutions ranging from 20 µg /ml to 400 µg/ml were prepared by
enzymatic digestion of native HA and kept also in 10 ml volumetric flasks. For UV
spectroscopy analysis, 1.0 ml from each standard solution and samples X4A, X5A, X6A,
X4B, X5B, and X6B was withdrawn and mixed with 0.1 ml of 0.25 M sodium carbonate.
Each mixture was boiled for 1 min in a water bath to produce the oxazole derivative.
Approximately 6.0 ml of glacial acetic acid was then added to each mixture followed by
1.0 ml of Ehrlich's reagent. All mixtures were then stirred on a vortex mixer and then
allowed to cool until a violet color developed in each container. The most of colors
reached their maximum intensity in 16-20 min. A plank sample was prepared with the
glacial acetic acid and Ehrlich's reagent.
The content of NAG was then quantified in each sample by a single beam UV-
Visible spectrophotometer (Spekol 1500, Analytik, jena, Germany) and the absorbance
was recorded at 585 nm. Similarly, the degradation rates of the hydrogels X4, X5 and X6
were evaluated by calculating the relative difference (%) of NAG found in samples A
extracts to the total amount of NAG found in samples B extracts. Finally, an average
degradation rate of the three hydrogels was obtained with 95% confidence interval.

CHAPTER 3: EVALUATION OF IN-VITRO DEGRADATION RATE OF CROSS-LINKED BDDE-HA HYDROGEL
40
3.2.3.3 Gravimetric method
The commonly reported method (weight loss method) was employed in our study
to evaluate the degradation rates of the hydrogels X7, X8 and X9. The lyophilized
hydrogels X7, X8 and X9 were swollen in distilled water until reached their equilibrium
states. A sample weighed 5.0 g was cut from each swollen hydrogel and incubated with
hyaluronidase BTH (activity of 300 U/ml) at 37 oC
for 24 h. The degradation rate of each
hydrogel was evaluated due to the change in hydrogel weight before and after enzymatic
incubation and calculated in accordance with the following equation:
Where W0 is the original weight of the swollen hydrogel at equilibrium state and
Wr is the remaining weight after one day enzymatic digestion. An average degradation
rate of the three hydrogels was obtained with 95% confidence interval.
3.2.4 Statistics
Statistical analysis for significance between the three methods (HPLC, UV-
Visible, and Wight loss) was performed by means of Student's t-test, assuming unequal
variance and one-way ANOVA. Value of P < 0.05 was statistically considered
significant.
3.2.5 Results
3.2.5.1 High performance liquid chromatography (HPLC)
The HPLC measurements showed broad peaks for all standard solutions and
samples A and B of the three hydrogels X1, X2 and X3. Fig.3.1 displays representative
chromatograms of NAG for two samples extracts; X1A after one-day enzymatic digestion
and X1B after complete digestion, (all HPLC results are shown in appendix 4). The
chromatograms of standards solutions and the calibration curve are demonstrated in Fig.
3.2 a & b.

CHAPTER 3: EVALUATION OF IN-VITRO DEGRADATION RATE OF CROSS-LINKED BDDE-HA HYDROGEL
42
Figure 3. 1 Chromatograms of (NAG) for: X1 A after one-day enzymatic digestion (a) and X1 B after
complete digestion (b)

CHAPTER 3: EVALUATION OF IN-VITRO DEGRADATION RATE OF CROSS-LINKED BDDE-HA HYDROGEL
43
Figure 3. 2 Chromatograms of standard solutions at 195 nm (a) and the calibration curve of series standard
solutions at 195 nm (b)
The linear equation y= 5.0981x+72.026 was obtained from the calibration curve
where y was the measured absorption and x was the concentration of HA (µg /ml). The
correlation coefficient R2 was 0.9984. The equation was employed to quantify the
amounts of N-acetyl glucosamine NAG in samples A and samples B of X1, X2, and X3.
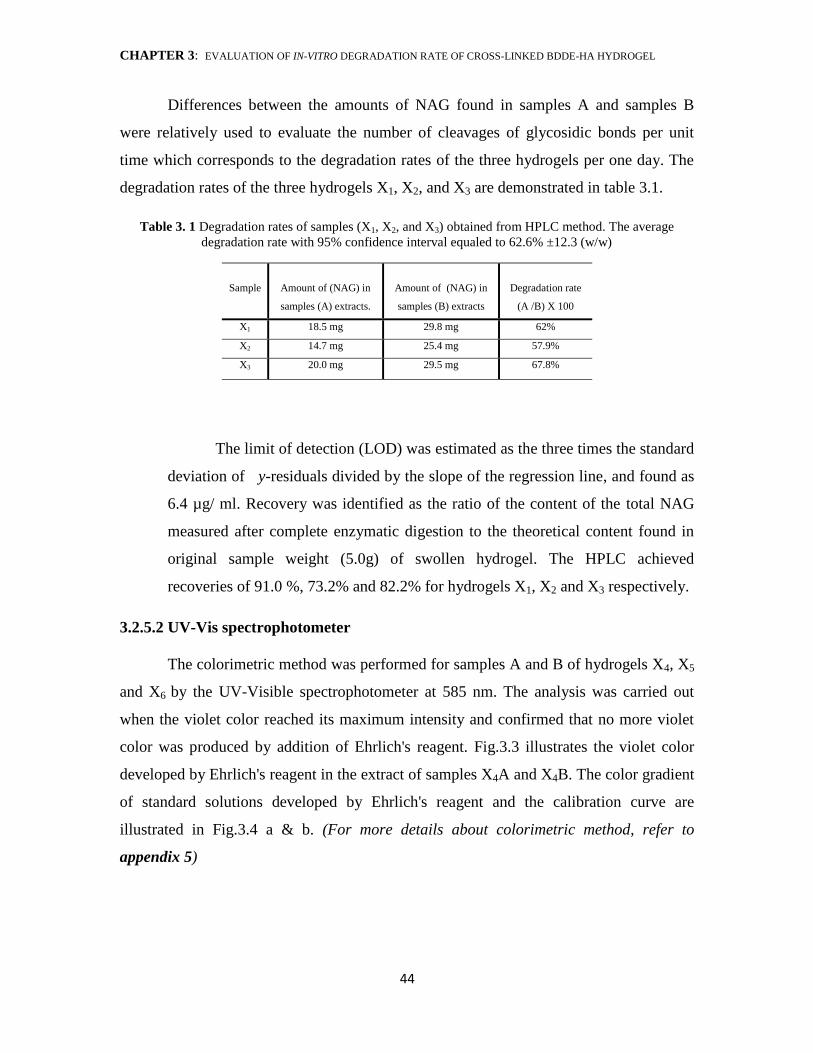
CHAPTER 3: EVALUATION OF IN-VITRO DEGRADATION RATE OF CROSS-LINKED BDDE-HA HYDROGEL
44
Differences between the amounts of NAG found in samples A and samples B
were relatively used to evaluate the number of cleavages of glycosidic bonds per unit
time which corresponds to the degradation rates of the three hydrogels per one day. The
degradation rates of the three hydrogels X1, X2, and X3 are demonstrated in table 3.1.
Table 3. 1 Degradation rates of samples (X1, X2, and X3) obtained from HPLC method. The average
degradation rate with 95% confidence interval equaled to 62.6% ±12.3 (w/w)
Sample
Amount of (NAG) in
samples (A) extracts.
Amount of (NAG) in
samples (B) extracts
Degradation rate
(A /B) X 100
X1 18.5 mg 29.8 mg 62%
X2 14.7 mg 25.4 mg 57.9%
X3 20.0 mg 29.5 mg 67.8%
The limit of detection (LOD) was estimated as the three times the standard
deviation of y-residuals divided by the slope of the regression line, and found as
6.4 µg/ ml. Recovery was identified as the ratio of the content of the total NAG
measured after complete enzymatic digestion to the theoretical content found in
original sample weight (5.0g) of swollen hydrogel. The HPLC achieved
recoveries of 91.0 %, 73.2% and 82.2% for hydrogels X1, X2 and X3 respectively.
3.2.5.2 UV-Vis spectrophotometer
The colorimetric method was performed for samples A and B of hydrogels X4, X5
and X6 by the UV-Visible spectrophotometer at 585 nm. The analysis was carried out
when the violet color reached its maximum intensity and confirmed that no more violet
color was produced by addition of Ehrlich's reagent. Fig.3.3 illustrates the violet color
developed by Ehrlich's reagent in the extract of samples X4A and X4B. The color gradient
of standard solutions developed by Ehrlich's reagent and the calibration curve are
illustrated in Fig.3.4 a & b. (For more details about colorimetric method, refer to
appendix 5)

CHAPTER 3: EVALUATION OF IN-VITRO DEGRADATION RATE OF CROSS-LINKED BDDE-HA HYDROGEL
45
Figure 3. 3 The violet color developed by Ehrlich's reagent in samples: X4 A after one-day enzymatic
digestion (left) and X4 B after complete enzymatic digestion (right)
Figure 3. 4 Color gradient of standards developed by Ehrlich's reagent (a) and the calibration curve of
standards solutions prepared under similar treatment of digestion (b).

CHAPTER 3: EVALUATION OF IN-VITRO DEGRADATION RATE OF CROSS-LINKED BDDE-HA HYDROGEL
46
A linear equation y= 0.001 x-0.0031 was also obtained from the calibration curve
with a correlation coefficient R2of 0.9995. The linear equation was employed to quantify
the amounts of NAG produced after one-day enzymatic digestion in samples A and after
complete digestion in samples B. The degradation rates of the three hydrogels X4, X5 and
X6 were then evaluated by calculating the percentage of NAG in samples A to the total
amounts of NAG in samples B. Table 3.2 demonstrates the degradation rates of X4, X5
and X6 and their average value:
Table 3. 2 Degradation rates of samples X4, X5, and X6 obtained from the colorimetric method.
The average degradation rate with 95% confidence interval equaled to 63..3% ±13.9 (w/w)
Sample
Amount of (NAG) in
samples (A) extracts.
Amount of (NAG) in
samples (B) extracts
Degradation rate
(A /B) X 100
X4 17.8 mg 27.3 mg 65.2 %
X5 16.4 mg 28.7 mg 57.0 %
X6 17.4mg 25.7 mg 67.7 %
The limit of detection was also evaluated in accordance with y-residuals of the
regression line and found to be 5.4 µg/ ml. The method recovery was varied at 75.4% for
X4, 94.2% for X5, and 79.7 % for X6.
3.2.5.3 Weight loss
The degradation rates of hydrogels X7, X8, and X9 were calculated in term of the
percentage of weight loss over one-day enzymatic digestion by hyaluronidase. The results
are shown in table 3.3.
Table 3. 3 Degradation rates of samples X7, X8, and X9 obtained from the weight loss method. The average
degradation rate with 95% confidence interval = 73..4% ±5.7 (w/w)
Sample
Initial
weight
Remaining weight
after one-day
enzymatic digestion
Weight
lost
Degradation rate =
(weight lost) /(Initial
weight) x 100%
X7 5.0 g 1.2 g 3.8 g 76%
X8 5.0 g 1.37 g 3.63 g 72.6%
X9 5.0 g 1.42 g 3.58 g 71.6%

CHAPTER 3: EVALUATION OF IN-VITRO DEGRADATION RATE OF CROSS-LINKED BDDE-HA HYDROGEL
47
3.2.6 Discussion
The chromatographic measurements showed only a single large peak which is
possibly attributed to the variation in hydrodynamic radius of HA fragments. However,
the HPLC method proved its reliability and reproducibility for quantification of the total
amount of N-acetyl glucosamine NAG in cross-linked hydrogels. A nine-point calibration
curve was constructed by plotting peak areas vs. concentrations of standards having
correlation coefficient R2 of 0.998. A linear response was obtained for injections between
20µg/ml to 300 µg/ ml. The average degradation rates obtained from the HPLC method
was 62.6% ±12.3 w/w. Similarly, the colorimetric method was as reproducible as HPLC
method. It could quantify the total amount of N-acetyl glucosamine in the cross-linked
hydrogels with an average degradation rate of 63.3±13.9 w/w. The colorimetric method
showed also a good linearity R2=0.9995 within a wide range concentrations of hyaluronic
acid (20 µg /ml to 400µg/ml). On other hand, the weight loss method showed a higher
degradation rate and a lower confidence interval 73.4% ± 5.7 w/w. This high rate was
probably due to some error associated when sample quantity and balance were
considered. A portion of remaining solid could also be lost during sample treatment
process (e.g. digestion, filtration or drying steps) and that led to a higher degradation rate
value. Fig.3.5 shows a column chart with error bars of the average degradation rates
obtained from the three analytical methods:
Figure 3. 5 Average degradation rates obtained from the three analytical methods with the 95% confidence
interval

CHAPTER 3: EVALUATION OF IN-VITRO DEGRADATION RATE OF CROSS-LINKED BDDE-HA HYDROGEL
48
In general, the 95% confidence intervals around the average degradation rates of
the three methods were large and showed high uncertainly. These results could be due to
the insufficient sample size (n=3) used for each method or to the spatial inhomogeneity of
the network in each hydrogel. Despite the controlled parameters over the course of
synthesis and purification, hydrogels can be subjected to various environmental
conditions or any external stimuli and they always exhibit an inhomogeneous cross-link
density distribution. The irregular distribution of cross-linking density throughout the
hydrogel explains the existence of some regions with more or less rich in cross-linking
density. This factor can dramatically affect the hydrogel strength and its degradation rate.
This behavior is probably interpreted as some samples were cut from a higher polymer
concentration (densely cross-linked region) and some from a lower polymer
concentration (loosely cross-linked region). According to the analysis of one-way
ANOVA test, the degradation rate obtained from the conventional gravimetric method
was significantly different from the degradation rates obtained from the chromatographic
and colorimetric methods (P ˂ 0.05, n=3). Although the colorimetric method does appear
to have a slightly higher average degradation rate than the chromatographic method and
even lower detection limit, a t-test was applied and showed that there was no significant
difference between the rates of the two methods. The large confidence interval of
chromatographic method %R.S.D = 7.27 and colorimetric method % R.S.D of 8.84
compared to the gravimetric method % R.S.D of 3.13 could be explained to the higher
sensitivity of HPLC and UV-Visible spectrophotometer for detecting the NAG groups.
The significant advantage of the HPLC and colorimetric methods developed in our work
was that the two methods worked efficiently with all HA-BDDE fragments generated by
hyaluronidase regardless their sizes or molecular weights. The two methods were also
able to detect very low amount of HA-BDDE fragments obtained after one-day
enzymatic digestion with hyaluronidase. Finally, although that RP-HPLC method proved
its reliability and reproducibility for quantification of NAG in BDDE-HA hydrogels, the
application of chromatographic method in the evaluation of the degradation rate of
hydrogels with various degrees of cross-linking becomes tedious and more challenging,
particularly, if the degradation test is held in different days or intervals.

CHAPTER 3: EVALUATION OF IN-VITRO DEGRADATION RATE OF CROSS-LINKED BDDE-HA HYDROGEL
49
The physicochemical properties of HA and the digestion process could also affect
resolution, separation and retention time. If the stationary phase becomes saturated or
blocked over the course of analysis, that will lead to a variation in the retention time. The
retention time also experiences a drift with increased HA content. As the amount of HA
fragments increases, they stay longer in the column and thus, has a slower retention time.
Due to the silanol groups found in silica or the chemical interaction between the polar
mobile phase and non-polar stationary phase, the native HA and cross-linked HA are
mostly eluted with peak tailing. The strongly acidic silanol groups work as cation-
exchange sites for ionized bases of HA fragments. Chromatograms of this phenomenon
are demonstrated in detail in the (appendix 4). In contrast, the colorimetric method
exhibits simplicity and less time-consuming. In term of cost, the colorimetric method was
also less expensive and did not introduce chemicals with the exception of Ehrlich's
reagent. Therefore, we selected the colorimetric method in our work for the quantification
of the amount of NAG content in the non-digested fraction of all prepared hydrogels. The
results of colorimetric method, standard solutions and recovery are all demonstrated in
(appendix 5).
3.4 Conclusion
Evaluation of HA-BDDE degradation rate becomes a criterion for an appropriate
expression for the extent of cross-linking efficiency. In this chapter, three analytical
methods were developed for the evaluation of HA degradation: HPLC, UV-Visible
spectroscopy and weight loss. The results showed that the chromatographic and
colorimetric methods exhibited good linearity and reproducibility with correlation
coefficients R2of 0.998 and 0.9995 respectively. Recoveries were estimated as an average
of the three measurements which yielded 81.0% for HPLC and 83.1% for UV-Visible
spectroscopy. They also showed good detection limits of 6.4µg/ ml for HPLC and 5.4 µg/
ml for UV-Visible respectively. To sum up, the chromatographic and colorimetric
methods were both reliable for quantification of NAG content. However due to simplicity
and sensitivity of the colorimetric method, we selected the colorimetric method for the
evaluation of in-vitro degradation for all prepared BDDE-HA hydrogels in our study.

CHAPTER 4: REACTION TIME, pH AND TEMPERATURE
51
CHAPTER 4
4. Reaction time, pH and temperature
4.1 Introduction
Due to the chemical and physical structure of HA, it was hypothesized that the
experimental parameters such as reaction time, pH, and temperature, HA initial
concentration, HA molecular and mixing approach might have potential impacts on
increasing chemical and physical interaction (cross-linking efficiency) between HA and
BDDE. Study of the effect of each experimental factor is very important in order to
determine the most influencing factor on cross-linking efficiency. Enhancement of cross-
linking efficiency of HA hydrogel without exploiting further quantities of BDDE needs
sequential studies. The optimum conditions obtained from the former studies are
incorporated in the method conditions of the following studies. In this chapter, we studied
the effect of three significant factors that have a significant correlation with chemical
reaction ; reaction time, pH and temperature.
4.2 Reaction time
4.2.1 Materials
Sodium salt of hyaluronic acid with an average molecular weight 1,000,000 Da.
BDDE, hyaluronidase (solid powder with an activity of 3000 U/mg). Ehrlich's reagent,
phosphate buffer saline (PBS) and alkaline solution.
4.2.2 Synthesis
A total of six BDDE-HA hydrogels were prepared by mixing 1.2 g HA with 200
µl BDDE in 10 ml basic solution (pH 13). The solutions were allowed to mix at room
temperature for different reaction times as shown in table 4.1.

CHAPTER 4: REACTION TIME, pH AND TEMPERATURE
50
When cross-linking process was complete, the solutions were neutralized with
0.1M HCl. As previously described in section 2.2.2, all hydrogels were then purified by
dialysis tubes, lyophilized and then kept at 8 oC until measurements and characterization.
The cross-linking efficiency of each formed hydrogel was estimated by measuring the
in- vitro degradation rate using the colorimetric method and the swelling ratio.
Table 4. 1 BDDE-HA hydrogels prepared at various reaction time
Hydrogel BDDE con HA con pH Tem Time
1 2.0 % (v/v) 12 % (w/v) 13 25 0C 30 min
2 2.0 % (v/v) 12 % (w/v) 13 25 0C 1 h
3 2.0 % (v/v) 12 % (w/v) 13 25 0C 2 h
4 2.0 % (v/v) 12 % (w/v) 13 25 0C 4 h
5 2.0 % (v/v) 12 % (w/v) 13 25 0C 8 h
6 2.0 % (v/v) 12 % (w/v) 13 25 0C 24 h
4.2.3 Measurements
4.2.3.1 In-vitro degradation rate
Five equivalent samples A, B, C, D and E from each prepared hydrogel were cut
and placed in separate test tubes (the total was 30 samples). Each sample was mixed with
500 µl of hyaluronidase (BTH) with an activity of 300 units /ml in 10 ml phosphate buffer
saline (PBS) solution. Samples ―A‖ were kept for one day of treatment whereas samples
― B, C and D ‖ were treated for 2, 3 and 4 days respectively. Samples ―E‖ were left with
hyaluronidase until complete digestion. The enzymatic reaction was then stopped by
heating each test tube in boiling water for 5 min. The resulting extracts were centrifuged
and the supernatants were transferred into 10 ml volumetric flasks and diluted up to the
mark. Approximately 1.0 ml from each filtrate was mixed with 0.1 ml of 0.25 M sodium
carbonate and then boiled for 1 min in a water bath. Amounts 6:1 of glacial acetic acid
and Ehrlich's reagent were added to the filtrates and left until the violet color was
produced and reached its maximum intensity. The in-vitro degradation rate for each
sample was expressed as the % NAG remaining in the non-digested fraction according to
the following equation:

CHAPTER 4: REACTION TIME, pH AND TEMPERATURE
52
Remaining NAG = (CNAG – PNAG) / CNAG x 100% ……………….Eq. 4.1
Where CNAG represents NAG content after complete degradation while PNAG
represents NAG content after first, second, third and fourth day of treatment.
4.2.3.2 Swelling ratio
Swelling measurements were carried out through gravimetric method using
4-decimal point analytical balance from Adam Equipment Inc. (USA). Equivalent
aliquots from cross-linked hydrogels were cut and immersed in distilled water and
phosphate buffer saline (PBS). The samples were allowed to swell until equilibrium state
and then removed, excess of water was removed by absorption paper. The samples were
then re-weighed and the equilibrium weight swelling ratio was calculated as following:
Swelling ratio (g/g) = Ws / Wd ………………………… Eq.4.2
Where Ws is the weight of swollen-sample at equilibrium state and Wd is the weight of
initial lyophilized sample.
4.2.4 Statistics
Each analysis was carried out at least three times and the results were analyzed by
ANOVA single factor and Student's t-test. Significance was accepted with P < 0.05. The
results were expressed as mean ± 95% confidence interval.
4.2.5 Results and discussion
4.2.5.1 In-vitro degradation rate
The (appendix 6.1) summarizes the amount of NAG remaining in the solid parts
of the cross-linked hydrogels after incubating with hyaluronidase for four consecutive
days. The results revealed that the reaction time had a noticeable effect on the
degradation rate of hydrogels prepared at duration less than 2 h. However, hydrogels
prepared at reaction times longer than 2 h showed no significant difference (P > 0.05,
N=3).

CHAPTER 4: REACTION TIME, pH AND TEMPERATURE
53
This meant that, the chemical modification lasting for more than 2 h did not
enhance cross-linking efficiency, and so generated hydrogels with similar resistance
toward enzymatic digestion. Based on these data, we could hypothesize that the cross-
linking reaction between HA chains and BDDE molecules was completed at a time
equaled approximately 2 h. The fast degradation rate observed with the hydrogels
prepared in 30 min and 1 h, particularly on the first two days indicated that their reaction
times were not long enough to construct effective cross-linked networks. Fig. 4.1 shows
the degradation profiles of hydrogels prepared at different reaction times.
Figure 4. 1 Degradation profiles of BDDE-HA hydrogels prepared at different reaction time, plotted as a
function of time with the 95% confidence interval
4.2.5.2 Swelling ratio
Swelling ratio is a fundamental feature characterizing cross-linked HA hydrogel
where it forms one of the most important factor for the biomaterials used in medical
application. The water-absorption ability forms a basic requirement in soft tissue
augmentation and dermal fillers. Regardless of reaction duration, all hydrogels showed a
remarkable affinity towards water. The (appendix 7.1) lists swelling ratios of all cross-
linked hydrogels in distilled water and phosphate buffer saline (PBS).The amount of
water contents absorbed by hydrogels prepared at reaction time (2h, 4h, 8h and 24h) in
distilled water were statistically not different (ANOVA test, P= 0.30, N=3).
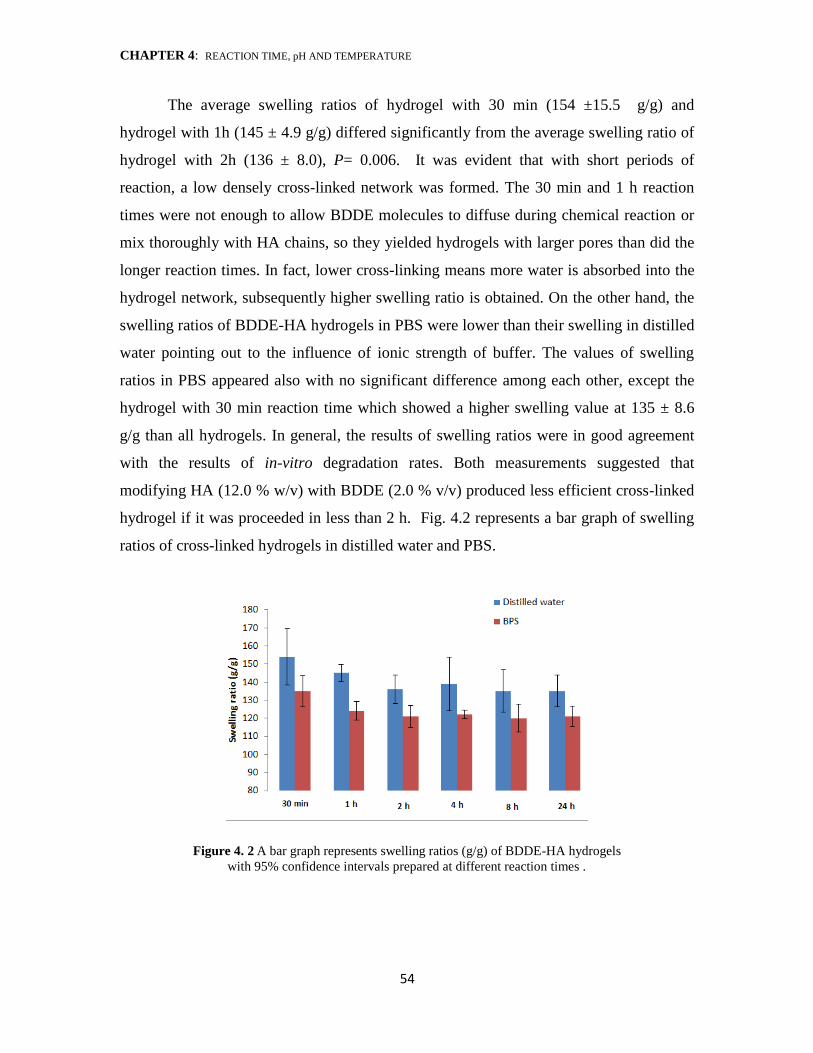
CHAPTER 4: REACTION TIME, pH AND TEMPERATURE
54
The average swelling ratios of hydrogel with 30 min (154 ±15.5 g/g) and
hydrogel with 1h (145 ± 4.9 g/g) differed significantly from the average swelling ratio of
hydrogel with 2h (136 ± 8.0), P= 0.006. It was evident that with short periods of
reaction, a low densely cross-linked network was formed. The 30 min and 1 h reaction
times were not enough to allow BDDE molecules to diffuse during chemical reaction or
mix thoroughly with HA chains, so they yielded hydrogels with larger pores than did the
longer reaction times. In fact, lower cross-linking means more water is absorbed into the
hydrogel network, subsequently higher swelling ratio is obtained. On the other hand, the
swelling ratios of BDDE-HA hydrogels in PBS were lower than their swelling in distilled
water pointing out to the influence of ionic strength of buffer. The values of swelling
ratios in PBS appeared also with no significant difference among each other, except the
hydrogel with 30 min reaction time which showed a higher swelling value at 135 ± 8.6
g/g than all hydrogels. In general, the results of swelling ratios were in good agreement
with the results of in-vitro degradation rates. Both measurements suggested that
modifying HA (12.0 % w/v) with BDDE (2.0 % v/v) produced less efficient cross-linked
hydrogel if it was proceeded in less than 2 h. Fig. 4.2 represents a bar graph of swelling
ratios of cross-linked hydrogels in distilled water and PBS.
Figure 4. 2 A bar graph represents swelling ratios (g/g) of BDDE-HA hydrogels
with 95% confidence intervals prepared at different reaction times .
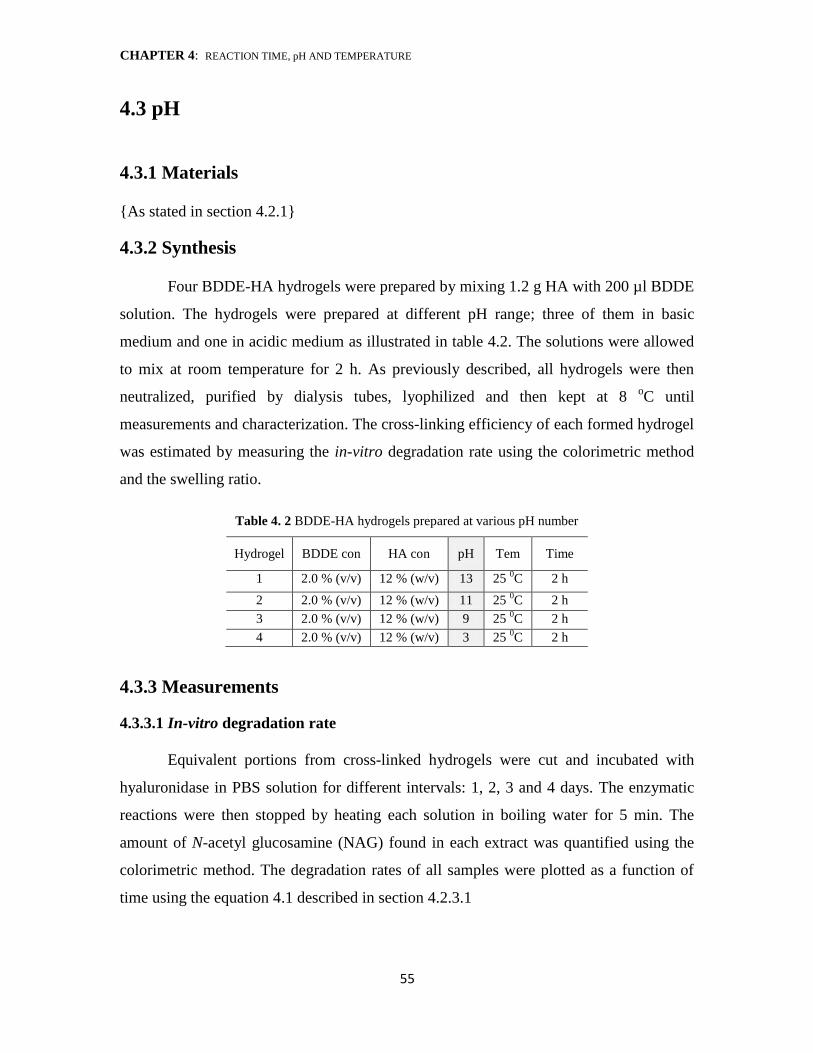
CHAPTER 4: REACTION TIME, pH AND TEMPERATURE
55
4.3 pH
4.3.1 Materials
{As stated in section 4.2.1}
4.3.2 Synthesis
Four BDDE-HA hydrogels were prepared by mixing 1.2 g HA with 200 µl BDDE
solution. The hydrogels were prepared at different pH range; three of them in basic
medium and one in acidic medium as illustrated in table 4.2. The solutions were allowed
to mix at room temperature for 2 h. As previously described, all hydrogels were then
neutralized, purified by dialysis tubes, lyophilized and then kept at 8 oC until
measurements and characterization. The cross-linking efficiency of each formed hydrogel
was estimated by measuring the in-vitro degradation rate using the colorimetric method
and the swelling ratio.
Table 4. 2 BDDE-HA hydrogels prepared at various pH number
Hydrogel BDDE con HA con pH Tem Time
1 2.0 % (v/v) 12 % (w/v) 13 25 0C 2 h
2 2.0 % (v/v) 12 % (w/v) 11 25 0C 2 h
3 2.0 % (v/v) 12 % (w/v) 9 25 0C 2 h
4 2.0 % (v/v) 12 % (w/v) 3 25 0C 2 h
4.3.3 Measurements
4.3.3.1 In-vitro degradation rate
Equivalent portions from cross-linked hydrogels were cut and incubated with
hyaluronidase in PBS solution for different intervals: 1, 2, 3 and 4 days. The enzymatic
reactions were then stopped by heating each solution in boiling water for 5 min. The
amount of N-acetyl glucosamine (NAG) found in each extract was quantified using the
colorimetric method. The degradation rates of all samples were plotted as a function of
time using the equation 4.1 described in section 4.2.3.1

CHAPTER 4: REACTION TIME, pH AND TEMPERATURE
56
4.3.3.2 Swelling ratio
Equivalent portions from cross-linked hydrogels were immersed in distilled water
and phosphate buffer saline (PBS) until equilibrium state. Measurements were carried out
as described in section 4.2.3.2.
4.3.4 Statistics
{As stated in section 4.2.4 }
4.3.5 Results and discussion
4.3.5.1 In-vitro degradation rate
The average amounts of NAG remained in the non-digested parts of cross-linked
hydrogels prepared at different pH numbers are shown in the (appendix 6.2). According
to the results, hydrogel degradability was increased with the decrease of pH with the
exception of hydrogel 4 (pH 3) that showed a higher resistance against enzymatic
digestion than hydrogel 2 (pH 11) or hydrogel 3 (pH 9). The reason beyond this could be
referred to the reactive groups involved in the chemical reaction. At very strong basic
conditions, the cross-linked BDDE-HA hydrogel worked as an inhibitor for the enzyme
attack, because most of hydroxyls or the reactive groups are chemically blocked, thus the
testicular hyaluronidase failed to cleave the ether linkage. On the other hand, the
carboxylic group of glucuronic acid in the HA backbone acts as an activation centre for
hyaluronidase attack. However, this centre could be blocked, if modification reaction was
performed in acedic condition due to the formation of ester bonds between HA chains
and BDDE molecules. Fig. 4.3 displays the degradation profiles of BDDE-HA hydrogels
prepared at different pH medium.

CHAPTER 4: REACTION TIME, pH AND TEMPERATURE
57
Figure 4. 3 Degradation profiles of BDDE-HA hydrogels prepared at different pH number, plotted as a
function of time with the 95% confidence interval
4.3.5.2 Swelling ratio
The (appendix 7.2) demonstrates the swelling ratios of formed hydrogels
prepared at different pH (13, 11, 9 & 3). Based on the results, the pH medium had also a
noticeable influence on swelling ratios of the cross-linked hydrogels. It was shown that
the hydrogel prepared at a very strong basic medium produced a high efficient cross-
linked network, subsequently absorbed less water than those prepared at lower range.
However, the chemical modification occurred at low pH or acidic reaction medium
(pH 3) increased the formation of cross-linked network and relatively exhibited a lower
swelling ability than the chemical modifications occurred at pH 9 or pH 11 reaction
medium. Swelling of hydrogels in PBS provided a further evidence for the influence of
pH in the cross-linking efficiency. Due to the effect of ionic strength, the hydrogels
absorbed lower amounts of water and each hydrogel expanded to a lower extent than its
expansion in distilled water. These data clearly supported the data of in-vitro degradation
rates, the cross-linking efficiency was decreased with the decrease of pH number in the
basic range. Fig 4.4 shows a bar graph for the swelling ratios of formed hydrogels in
distilled water and PBS.
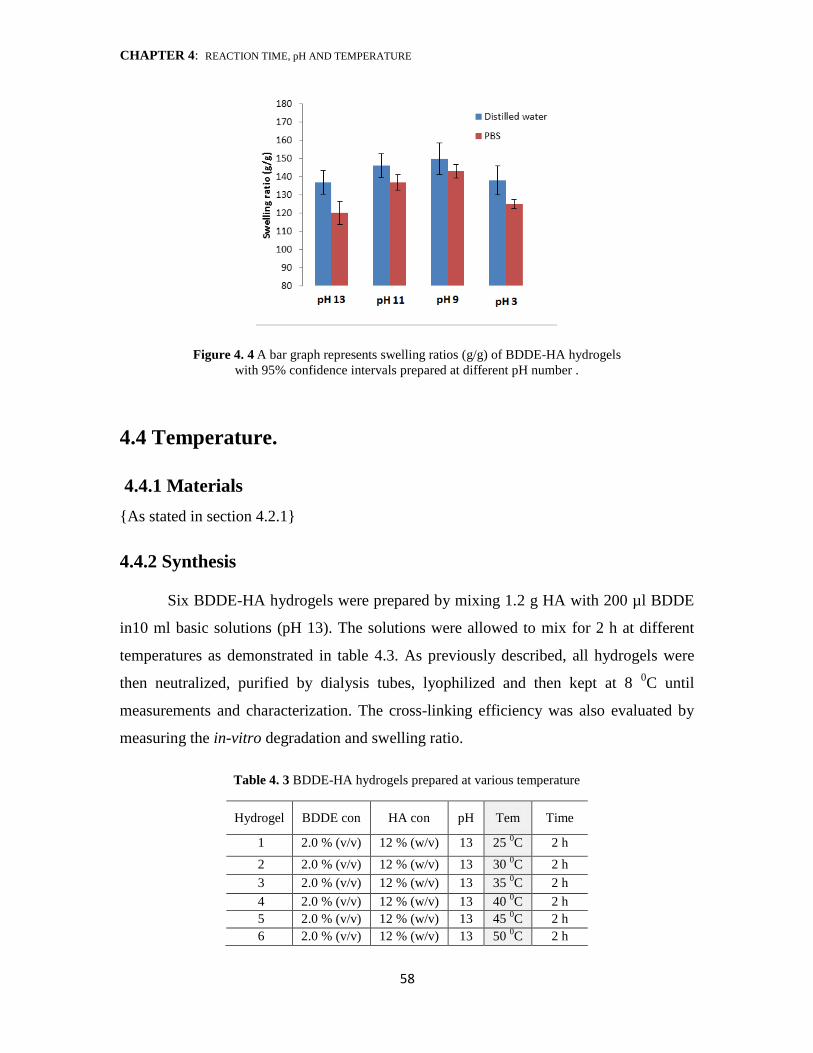
CHAPTER 4: REACTION TIME, pH AND TEMPERATURE
58
Figure 4. 4 A bar graph represents swelling ratios (g/g) of BDDE-HA hydrogels
with 95% confidence intervals prepared at different pH number .
4.4 Temperature.
4.4.1 Materials
{As stated in section 4.2.1}
4.4.2 Synthesis
Six BDDE-HA hydrogels were prepared by mixing 1.2 g HA with 200 µl BDDE
in10 ml basic solutions (pH 13). The solutions were allowed to mix for 2 h at different
temperatures as demonstrated in table 4.3. As previously described, all hydrogels were
then neutralized, purified by dialysis tubes, lyophilized and then kept at 8 0C until
measurements and characterization. The cross-linking efficiency was also evaluated by
measuring the in-vitro degradation and swelling ratio.
Table 4. 3 BDDE-HA hydrogels prepared at various temperature
Hydrogel BDDE con HA con pH Tem Time
1 2.0 % (v/v) 12 % (w/v) 13 25 0C 2 h
2 2.0 % (v/v) 12 % (w/v) 13 30 0C 2 h
3 2.0 % (v/v) 12 % (w/v) 13 35 0C 2 h
4 2.0 % (v/v) 12 % (w/v) 13 40 0C 2 h
5 2.0 % (v/v) 12 % (w/v) 13 45 0C 2 h
6 2.0 % (v/v) 12 % (w/v) 13 50 0C 2 h

CHAPTER 4: REACTION TIME, pH AND TEMPERATURE
59
4.4.3 Measurements
4.4.3.1 In-vitro degradation rate
Equivalent portions from cross-linked hydrogels were cut and incubated with
hyaluronidase solution for different intervals: 1, 2, 3 and 4 days. The enzymatic reactions
were then stopped by heating each solution in boiling water for 5 min. The amount of N-
acetyl glucosamine (NAG) found in each extract was quantified using the colorimetric
method. The degradation rates of all samples were plotted as a function of time using the
equation 4.1 described in section 4.2.3.1
4.4.3.2 Swelling ratio
Equivalent portions from cross-linked hydrogels were immersed in distilled water
and phosphate buffer saline (PBS) until equilibrium state. Measurements were carried out
as described in section 4.2.3.2.
4.4.4 Statistics
{As stated in section 4.2.4 }
4.4.5 Results and discussion
4.4.5.1 In-vitro degradation rate
The effect of temperature on hydrogel’s resistance against enzymatic
decomposition was investigated. Within the entire range of tested temperatures, none of
cross-linked hydrogels showed complete degradation. Generally, the results showed that
the degradation rate was decreased with the increase of temperature from 25 oC to 40
oC
and then increased at 45 oC with no significant difference. The hydrogel prepared at
temperature above 45 oC exhibited lower resistance towards hyaluronidase and appeared
to degrade much faster than hydrogels prepared at lower temperature. The slowest
degradation rate was observed for hydrogel prepared at 40 oC with an average remaining
NAG at 65.9 % ± 4.6 on the first day of incubation followed by the hydrogel prepared at
35 oC which showed an average remaining NAG at 65.2 % ± 4.7.

CHAPTER 4: REACTION TIME, pH AND TEMPERATURE
61
It was noted that the NAG content in the non-digested fraction was increased by
almost 1- 4 % for every 5 oC increase in the temperature from hydrogel 1 to hydrogel 4.
Possible reason for this: by increasing the temperature, the HA chains move faster and
entangle more frequently, subsequently more conformation and entanglements are
formed. The effect of increased temperature may also lead to a more collision between
HA chains and BDDE molecules that enhance the occurrence of chemical modification.
However, this theory does not apply at all reactions, reactions exposed to a very high
temperature (e.g. 45 oC and 50
oC) could form mass agglomerate or lead to irregular
distribution of cross-linking density. The hydrogel scaffold will then show less restriction
towards hyaluronidase invasion. Fig. 4.5 displays a graph showing the degradation
profiles of the hydrogels prepared at different temperature. The (appendix 6.3) illustrates
the remaining NAG amounts of all these hydrogels.
Figure 4. 5 Degradation profiles of BDDE-HA hydrogels prepared at different temperature, plotted as a
function of time with the 95% confidence interval
4.4.5.2 Swelling ratio
The swelling capacity of formed hydrogels was slightly decreased with the
increase of reaction temperature from 25 oC to 45
oC and then showed a rapid decrease at
50 oC. All hydrogels showed a lower water absorption ability in PBS than in distilled
water with more effective ionic strength on hydrogel prepared at 50 oC.

CHAPTER 4: REACTION TIME, pH AND TEMPERATURE
60
In general, the swelling ratios were ranged from a maximum value observed at
139 ± 4.9 g/g in water and 128 ± 3.8 g/g in PBS for the hydrogel 1 and a minimum value
observed at 120 ± 11.7 g/g in water and 112 ± 7.5 g/g in PBS for the hydrogel 6.
Excluding the swelling ratios of hydrogels 5 and 6, the results of swelling ratios were
consistent with the results of degradation rates and confirmed that the cross-linking
efficiency was increasing with the increase of temperature, and thus higher tightness and
strength (lower degradation rate and swelling) were exhibited. As illustrated in the
(appendix 7.3), the swelling ability was decreased by almost 2.0 % corresponding to the
5.0 % increase in the temperature of reaction medium. Moreover, the inconsistent values
observed between the swelling ratio and degradation rate of hydrogels 5 and 6 were not
correlated to the cross-linking efficiency rather than the network collapse or loss of
hydration that probably hardened the polymer matrix. Therefore despite their rapid
degradation, particularly the hydrogel with 50 oC, they showed lower ability of swelling.
Furthermore, the 95% confidence intervals observed around the average swelling ratio of
hydrogel 6 was very large compared to the other hydrogel, this high uncertainty level
reflected some inhomogeneity or rigidity occurred within hydrogel matrix during the
chemical modification. Fig.4.6 demonstrates a bar graph of the swelling ratios of cross-
linked BDDE-HA hydrogels prepared at different temperature.
Figure 4. 6 A bar graph represents swelling ratios (g/g) of BDDE-HA hydrogels
with 95% confidence intervals prepared at different temperature.

CHAPTER 4: REACTION TIME, pH AND TEMPERATURE
62
4.5 Conclusion
A series of HA hydrogels cross-linked with BDDE were prepared at different
reaction time, pH and temperature. The in-vitro degradation profile and swelling ratio
were measured to evaluate the cross-liking efficiency of each cross-linked hydrogel. The
results revealed that by increasing the reaction time from 30 min to 2 h, the cross-linking
efficiency increased (slower degradation rate and lower swelling ability). The chemical
reaction lasted more than 2 h, produced hydrogels with no significant effect on hydrogel
degradation or swelling capacity. The hydrogels prepared at different pH showed also
different cross-linking efficiency. By decreasing the pH from 13 to 9, the cross-linking
efficiency declined. However if the chemical reaction was performed in acidic medium
(pH 3), a more efficient cross-linked network than those obtained with pH 9 and pH 11
was observed. The temperature had also a noticeable effect on cross-linking efficiency of
BDDE-HA hydrogels. Roughly the temperature ranged between 25 0C and 45
0C formed
an ideal heated medium for cross-linking reaction, the 40 0C was probably the most ideal.
Based on above conclusion, we adopted the following method conditions on our
subsequent works: reaction time 2h, pH > 12 and temperature 40 0C.

CHAPTER 5: HA INITIAL CONCENTRATION
63
CHAPTER 5
5. HA initial concentration
5.1 Introduction
As we stated earlier, there has been an increasing demand for HA-based
hydrogels that offer advantages of lower chemical cross-linker. However, synthesis of
hydrogels utilizing both low amount of chemical cross-linker and high efficient cross-link
is complicated and challenging. So in this chapter we aimed to explore the effect of HA
initial concentration on cross-linking efficiency of BDDE-HA hydrogel. HA initial
concentration is different from the total HA concentration expressed by the
manufacturers. The total HA concentration usually includes the initial HA concentration
bound with the cross-linker and free HA solution which is added after chemical
modification to facilitate the extrusion through fine-bore needles (Kablik et al. 2009).
This free HA is easily metabolized and does not remain within hydrogel’s matrix. The
HA initial concentration represents the starting amount of HA powder involved in the gel
formation process.
5.2 HA initial concentration
5.2.1 Materials
{As stated in section 4.2.1}
5.2.2 Synthesis
A total of eight cross-linked BDDE-HA hydrogels were prepared by mixing 0.7,
0.8, 0.9, 1.0, 1.1, 1.2, 1.3, and 1.4 g of HA powder with 10 ml basic solution (0.25M
NaOH) containing 200 µl (2.0 % v/v) of BDDE.

CHAPTER 5: HA INITIAL CONCENTRATION
64
So, the added quantities of HA formed various initial concentrations equaled to
7.0 %, 8.0 %, 9.0 %, 10.0 %, 11.0 %, 12.0 %, 13.0 %, and 14.0 % (w/v) respectively.
Each mixture was allowed to mix thoroughly for 2h at 40 oC and then neutralized by
adding equivalent amounts of 0.1M HCl to a pH of approximately 7.0. As previously
described, all hydrogels were then purified by dialysis tubes, lyophilized and then kept at
8 oC until measurements and characterization. The cross-linking efficiencies of formed
hydrogels were estimated by measuring the in-vitro degradation rate using the
colorimetric method, the swelling ratio using gravimetrical balance, surface morphology
using scanning electron microscope (SEM).
5.2.3 Measurements
5.2.3.1 In-vitro degradation rate
Equivalent portions from cross-linked hydrogels were cut and incubated with
hyaluronidase in PBS solution for different intervals: 1, 2, 3 and 4 days. The enzymatic
reactions were then stopped by heating each solution in boiling water for 5 min. The
amount of N-acetyl glucosamine (NAG) found in each extract was quantified using the
colorimetric method. The degradation rates of all samples were plotted as a function of
time using the equation 4.1 described in section 4.2.3.1.
5.2.3.2 Swelling ratio.
Equivalent portions from cross-linked hydrogels were obtained and immersed in
distilled water and phosphate buffer saline (PBS, pH = 7.4). The samples were left to
reach their equilibrium states and then removed, excess water was gently dried by
absorption paper. Measurements were carried out as described in section 4.2.3.2.
5.2.3.3 Scanning electron microscope (SEM)
The morphologies of cross-linked hydrogels were investigated by scanning
electron microscope (SEM) from JEOL (Tokyo, Japan). Initially, the lyophilized samples
were coated with platinum using an ion sputter prior to visualization process. The SEM
was adjusted to obtain images in the Secondary Electron Imaging (SEI) mode with a
voltage of 10 kV. All images were captured at similar conditions and magnification.

CHAPTER 5: HA INITIAL CONCENTRATION
65
5.2.4 Statistics
{As stated in section 4.2.4 }
5.2.5 Results
5.2.5.1 In-vitro degradation tests
The (Appendix 6.4) displays the values of the in-vitro degradation rates of formed
hydrogels with 95% confidence interval for four days incubating with hyaluronidase. Fig.
5.1 shows a graph comparing their degradation profiles over the period of treatment.
Figure 5. 1 Degradation profiles of BDDE-HA hydrogels prepared at different HA concentrations, plotted
as a function of time with the 95% confidence interval
The results verified that HA initial concentration had a substantial effect on
hydrogel degradation during enzymatic incubation. A noticeable decline in the
degradation rate was observed with the increasing of HA concentration from BDDE-HA
hydrogel prepared at 7.0 % HA initial concentration to the hydrogel prepared at 10.0 %
HA initial concentration. A slight increase in the degradation rate was then observed from
the 10.0 % HA hydrogel to the hydrogel prepared at 14.0 % HA initial concentration.
According to these data, the degradation rate was inversely proportional to the HA initial
concentration to a certain level which was 10.0 % w/v in our experiments, and then
showed a relatively opposite effect.

CHAPTER 5: HA INITIAL CONCENTRATION
66
This meant, that the 10.0 % HA exhibited an ideal level of HA initial
concentration corresponding to 2.0 % (v/v) BDDE solution. Statistically, the degradation
rates of hydrogels containing low HA concentration (7.0 % 8.0 %) and high HA
concentration (13.0 % and 14.0 %) showed a significant difference (p < 0.05, n=3,
ANOVA test) from the degradation rate of the 10.0 % HA hydrogel for four days
incubating with hyaluronidase. However, the degradation rates of hydrogels prepared at
moderate HA initial concentration (9.0 %, 11.0 % and 12.0 % ) did not differ
significantly from the degradation rate of 10.0 % HA hydrogel except on last day for the
11.0 % and 12.0 % HA hydrogels and on the first two days for the 9.0 % HA hydrogel.
As a comparison, the 10.0 % HA hydrogel exhibited much higher resistance against the
action of enzyme than did hydrogels prepared at the lowest (7.0 %) or the highest (14.0
%) HA initial concentration, particularly on the first day of treatment. Approximately
two-third of the 10.0 % HA hydrogel original NAG content (68.4% ± 1.8) remained
unreleased in the dry mass after one day compared to the 7.0 % or 14.0 % HA hydrogels
which showed NAG remaining percentages of approximately (55.5 ± 5.7) and (63.9 ±
2.0) respectively. Furthermore, the 7.0 % and 14.0 % HA hydrogels appeared to have lost
more than 80 % of their NAG contents within the whole period of treatment in
comparison to the 10.0 % HA hydrogel which lost approximately 75 % after similar
period.
5.2.5.2 Swelling ratio
The results of welling ratios are shown in (appendix 7.4) with the 95 %
confidence interval, a bar graph is displayed in Fig 5.2 comparing the swelling ratios of
formed hydrogels in distilled water and phosphate buffer saline (PBS). The results of the
swelling ratios were in good agreement with the results of the in-vitro degradation tests
and the 10.0 % HA-based hydrogel proved the most stable hydrogel. The results
confirmed that the swelling ratios of tested hydrogels in distilled water and PBS were
inversely correlated with the HA initial concentration from the 7.0 % HA hydrogel to the
10.0 % HA hydrogel. Pattern was then changed and the swelling ratio was steadily
increased with the increase of HA concentration until the 14.0 % HA hydrogel.

CHAPTER 5: HA INITIAL CONCENTRATION
67
The hydrogels prepared at low (7.0 % and 8.0 %) and high (13.0 % and 14.0 %)
HA initial concentration differed significantly from the 10.0 % HA hydrogel. The
hydrogels with moderate HA: 9.0 %, 11.0 % and 12.0 % HA swelled to extents close to
that reached by 10.0 % HA hydrogel in distilled water, however, in phosphate buffer
saline (PBS), they showed different water-absorption ability. Generally, the data of
swelling ratios were ranged from maximum values at 137 ± 7.4 g/g in distilled water and
127 ± 6.2 g/g in PBS reached by the 14.0 % HA hydrogel to minimum values at 129 ±
3.2 g/g in distilled water and 116 ± 2.4 g/g in PBS reached by the 10.0 % HA hydrogel.
Figure 5. 2 A bar graph represents swelling ratios (g/g) of BDDE-HA hydrogels
with 95% confidence intervals prepared at different HA concentration
5.2.5.3 Scanning electron microscope (SEM)
The SEM images of the tested hydrogels showed different morphologies and
pores-size distribution. Hydrogels with moderate HA initial concentration exhibited
better network interconnection than hydrogels with low or high HA initial concentrations.
The hydrogels with moderate HA initial concentration appeared with dense surface
structures. In contrast, the low and high HA hydrogels showed less cross-linking density
and appeared with some collapses occurred probably during the freeze-drying process.
The hydrogels with moderate HA had also narrower pores-size distribution.

CHAPTER 5: HA INITIAL CONCENTRATION
68
For instance, the 10.0 % HA hydrogel showed a pores-size distribution ranged in
diameter from less than 50 µm to approximately 300 µm compared to the low or high HA
hydrogels which showed much wider distribution ranges. Furthermore, the hydrogels
with moderate HA were more homogenous and showed more regular porous networks.
Fig.5.3 illustrates SEM surface images of lyophilized hydrogels captured at similar
(x100) magnification parameter using the Secondary Electron Imaging (SEI).
Figure 5. 3 SEM image for lyophilized BDDE-HA hydrogel prepared at 7.0 % HA initial concentration
Figure 5. 4 SEM image for lyophilized BDDE-HA hydrogel prepared at 8.0 % HA initial concentration

CHAPTER 5: HA INITIAL CONCENTRATION
69
Figure 5. 5 SEM image for lyophilized BDDE-HA hydrogel prepared at 9.0 % HA initial concentration
Figure 5. 6 SEM image for lyophilized BDDE-HA hydrogel prepared at 10.0 % HA initial concentration
Figure 5. 7 SEM image for lyophilized BDDE-HA hydrogel prepared at 11.0 % HA initial concentration

CHAPTER 5: HA INITIAL CONCENTRATION
71
Figure 5. 8 SEM image for lyophilized BDDE-HA hydrogel prepared at 12.0 % HA initial concentration
Figure 5. 9 SEM image for lyophilized BDDE-HA hydrogel prepared at 13.0 % HA initial concentration
Figure 5. 10 SEM image for lyophilized BDDE-HA hydrogel prepared at 14.0 % HA initial concentration
CHAPTER 5: HA INITIAL CONCENTRATION
70
5.2.6 Discussion
As mentioned earlier, HA cross-linking is crucial for providing a chemical shield
against decomposition acted by hyaluronidase and producing HA-based hydrogels with
longer residence. The faster release of NAG fragments (low cross-linking efficiency)
observed with the hydrogels of low HA initial concentration was more likely attributed to
the insufficient quantity of HA to form covalent bridges with BDDE molecules. In
contrast, the slower release of NAG fragments (high cross-linking efficiency) with the
moderate HA hydrogels was resulted from an adequate abundance of HA chains within
their network matrices. It was evident, that incorporation of a larger HA content in the
reaction medium resulted in a more exposure of HA chains to BDDE molecules, thus
more covalently ether bonds were formed. The bovine testicular hyaluronidase failed then
to cleave such linkages. By increasing HA concentration, the distance between HA chains
become even shorter and the probability of BDDE molecules to bind with HA chains
becomes larger. This phenomenon could also be assigned to the physical cross-linking
occurred between polymer chains as a resultant of increased HA contents. As stated, HA
is a linear polymer, however, in solution it shows extensive intermolecular hydrogen
bonding that induce distinctive secondary (helical) and tertiary (coiled coil) interactions
(Prestwish et al. 1998; Scott et al. 1989). At high HA concentration, the chains show greater
entanglements and self-association of HA random coils in solution which relatively work
as an enzyme-attack inhibitor. The larger HA concentration, the larger quantity of HA
―monomer unit‖ available in the reaction medium, subsequently higher tendency of HA
chains to entangle. Furthermore, studies suggest that the hydrogel stiffness may be
affected by the HA viscoelasticity; a rheological characteristic depending also on HA
concentration and chains cross-linking (measurements were not carried out in this
chapter). The hydrogen bonding between adjacent chains occur electrostatic repulsion
between the carboxylic groups, subsequently the HA network is stiffened (Fakhari and
Berkland 2013; Necas et al. 2008; Vejlens 1971). Although the occurrence of physical
cross-linking as opposed to the chemical cross-linking is not entirely clear during the
synthetic method, the HA concentration is postulated to play a significant role in the
HA-HA polymer interconnection.

CHAPTER 5: HA INITIAL CONCENTRATION
72
However, if HA initial concentration has exceeded moderate level, the cross-
linking efficiency weakens and the hydrogels start to degrade faster. Possible reason for
this; the excess amount of HA in reaction medium will lack the BDDE molecules and
form viscous aggregates. High HA concentration may restrict reaction movement or
prevent HA powder to disperse thoroughly within the reagent solution. In addition, it may
lead to inhomogeneity or irregular distribution of cross-linking density throughout
hydrogel matrix, subsequently, different densely regions are generated. In our
experiments, the solutions exposed to high HA content (13.0 % and 14.0 % HA) were
more viscous and had slower gelation reaction than those mixed with moderate HA
content. The results of swelling ratios supported the results of in-vitro degradation rates.
All tested hydrogels showed remarkable affinities towards water and swelled to various
extents depending on their cross-linking efficiencies. Due to the effect of ionic strength,
the hydrogels in PBS expanded to lower extents than their expansions in distilled water.
Generally, it has been described that, the increase of cross-linking results in decrease
water content (Cardoso et al. 2014). The cross-linking efficiency usually determines the
overall swelling of cross-linked hydrogel and penetration depth of water into hydrogel
matrix, so it has a significant influence on the equilibrium state between extension and
retraction forces. Comparing to the swelling ratios of low and high HA hydrogels, the
hydrogels prepared at moderate HA initial concentration (9.0 % - 12.0 %) showed a
limitation on the extent to which they could swell due to the large formation of chemical
cross-linkages between HA chains and BDDE molecules, subsequently they could not
preserve a good water up-take ability. Moreover, the larger HA-HA entanglements
occurred in the moderate HA hydrogels were proposed to contribute on the elastic
network retraction force that oppose additional swelling and thus show less swelling
capacity. As shown in SEM images, the moderate HA hydrogels appeared more rigid and
cohesive throughout their surface sections. They showed continuous network structures
with pores being very small and more regularly distributed, these small pores allowed the
polymer matrix to swell to lower ranges.

CHAPTER 5: HA INITIAL CONCENTRATION
73
The hydrogels with low or high HA initial concentration did not show good
morphology and appeared with softer surface microstructures, particularly the low HA
hydrogels. They had weak scaffolds and large pores allowing more water to be absorbed
into the hydrogels matrices, subsequently higher swelling ratios were obtained.
Furthermore, the low and high HA hydrogels were less homogenous and their cross-
linking densities were irregularity distributed, such inhomogeneity weakens the network
structure of cross-linked hydrogel and contributes in the rise of swelling capacity. The
high uncertainty level or wider 95% confidence intervals observed around the average
swelling ratios of the 7.0 % , 13.0 % and 14.0 % HA hydrogels verified this conclusion.
In fact, hydrogels with moderate initial HA concentration were more homogenous and
more thoroughly mixed during gelation process.
5.3 Conclusion
This chapter was aimed to study the potential effect of (HA) initial concentration
on cross-linking efficiency of BDDE-HA hydrogel. The results revealed that the BDDE-
HA hydrogels prepared at moderate-HA initial concentrations (9.0 – 12.0 %) exhibited
higher resistance against enzymatic digestion and lower swelling ratios than those
prepared at either low (7.0 %, 8.0%) or high (13.0% and 14.0 %) HA concentrations. For
four days incubating with hyaluronidase, the 10.0 % HA hydrogel showed the slowest
degradation rate with a significant difference (P < 0.05, t-test) to the degradation rates of
11.0 % and 12.0 % HA hydrogels on the fourth day and to the degradation rate of 9.0 %
HA hydrogel on the first two days. The swelling ratio of 10.0 % HA hydrogel was
significantly different with the swelling ratios of 9.0 %, 11.0 % and 12.0 % HA hydrogels
in phosphate buffer saline PBS. The SEM images showed different morphologies and
pore-size distribution within the entire range of tested HA concentrations. The moderate-
HA hydrogels, however, were more homogeneous and appeared with narrower pore-size
distribution compared to the low and high-HA hydrogels. The effect of HA initial
concentration was further investigated by FTIR which confirmed that the moderate-HA
hydrogels showed greater chemical modifications. In conclusion, the 10.0 % (1.0g ) HA
initial concentration proved to be the idlest concentration level corresponding to the 2.0
% v/v BDDE and it was selected for the up-coming studies.

CHAPTER 6: HA MOLECULAR WEIGHT
74
CHAPTER 6
6. HA molecular weight
6.1 Introduction
The HA molecular weight (Mw) is a principle parameter in the synthesis of HA
hydrogels, because it reflects the number of repeating disaccharide units. As stated, the
HA polymer consists of repeating disaccharides units chemically bonded into a long
chain. The term ― average HA molecular weight‖ is usually used to express this chain
length which describes the relative molecular mass of the basic disaccharide and the
number of disaccharide units connected in the chain. Therefore, the objective of this
chapter was to study of the effect of HA molecular weight on the cross-linking efficiency
of BDDE-HA hydrogels using three types of HA molecular weights Mw (100 kDa, 1000
kDa and 2000 kDa).
6.2 HA molecular weight
6.2.1 Materials
Hyaluronic acid with an average molecular weights (100 kDa, 1000 kDa and 2000
kDa). Hyaluronidase (3000 U/mg), BDDE, Ehrlich's reagent, phosphate buffer saline
(PBS) and alkaline solutions.
6.2.2 Synthesis
Three BDDE-HA hydrogels were prepared by mixing 1.0 g HA with 200 µl
BDDE in 10 ml basic solution (pH 13). The hydrogels were prepared from different types
of HA molecular weight (100 kDa, 1000 kDa and 2000 kDa). The solutions were allowed
to stand at 40 oC for 2 h. When reaction was complete, the hydrogels were neutralized by
0.1M HCl and purified using dialysis tubes.

CHAPTER 6: HA MOLECULAR WEIGHT
75
Finally they were lyophilized and kept at 8 oC for studying purpose. The cross-
linking efficiencies were estimated by measuring the in-vitro degradation rate, the
swelling ratio and rheological behavior.
6.2.3 Measurements
6.2.3.1 In-vitro degradation rate
Equivalent portions from cross-linked hydrogels were cut and incubated with
hyaluronidase solution for different intervals: 1, 2, 3 and 4 days. The enzymatic reactions
were then stopped by heating each solution in boiling water for 5 min. The amount of N-
acetyl glucosamine (NAG) found in each extract was quantified using the colorimetric
method. The degradation rates of all samples were plotted as a function of time using the
equation 4.1 described in section 4.2.3.1.
6.2.3.2 Swelling ratio
Equivalent portions from cross-linked hydrogels were obtained and immersed in
distilled water and phosphate buffer saline (PBS, pH = 7.4). The samples were left to
reach their equilibrium states and then removed, excess water was gently dried by
absorption paper. Measurements were carried out as described in section 4.2.3.2.
6.2.3.3 Rheological properties
By varying HA molecular weight, the cross-linked hydrogels show varied
strength and resistsance towards compression applied from surrounding. So the
measurements of rheological properties of prepared hydrogels will give further evidence
about the relationship between HA molecular weight and cross-linking efficiency. The
rheological measurements were performed on oscillatory shear mode to determine the
elastic modulus G' (storage modulus) and the viscous modulus G'' (loss modulus). The
measurements were carried out using ARES rheometer (TA instruments, USA) equipped
with a plate and plate geometry. Initially strain sweep tests were performed at a constant
frequency over strain amplitude ranged between 0.01-100 % in order to determine the
linear viscoelastic region (LVR).

CHAPTER 6: HA MOLECULAR WEIGHT
76
Small Amplitude Oscillatory Strain (SAOS) tests were then applied to analyze the
storage and loss modulus over a frequency range (0.01-100 s -1
) at a constant strain
selected within the linear viscoelastic region. (Appendix 1.6 describes the principle of
rheometer and the oscillatory strain test)
6.2.4 Statistics
{As stated in section 4.2.4 }
6.2.5 Results and discussion
6.2.5.1 In-vitro degradation rate
The results of in-vitro degradation rate revealed that the percentage of NAG
remaining in the hydrogel prepared with 2000 kDa HA molecular weight was larger than
the NAG remaining in hydrogels prepared with 100 kDa and 1000 kDa HA molecular
weight except on the third day where the hydrogel with 1000 kDa showed almost similar
NAG content of that observed in the solid fraction of hydrogel with 2000 kDa. These data
presented an evidence that the degradation rate was decreased with the increase of HA
molecular weight. Fig 6.1 displays a graph comparing the degradation rates cross-linked
hydrogels prepared at different HA molecular weight. The graph clearly shows the
influence of HA molecular weight on cross-linked hydrogels.
Figure 6. 1 Degradation profiles of cross-linked hydrogels prepared at different HA molecular weight.
They were plotted as a function of time with the 95% confidence interval

CHAPTER 6: HA MOLECULAR WEIGHT
77
The influence of HA molecular weight on hydrogel stiffness could be rationalized
to the number of repeating disaccharide units. Longer chain of HA monomer unit (higher
molecular weight) involved in the chemical reaction promoted a larger number of
hydroxyl groups to form ether bonds with BDDE. They also induced more polymer-
polymer interactions and less pendants formation. Hydrogels with more chemical and
physical interconnection produce less average mesh-width scaffold, subsequently they
show a good ability to resist the attack of hyaluronidase. The (appendix 6.5) describes the
relationship between the HA molecular weight and hydrogels’ degradation rate.
6.2.5.2 Swelling ratio
The swelling ratio (as shown in Fig. 6.2) was decreased when moving from the
hydrogel prepared with 100 kDa HA molecular weight to the hydrogel prepared with1000
KDa HA molecular weight and then showed a slight increase toward hydrogel prepared
with 2000 kDa in distilled water and PBS. These data were relatively inconsistent with
the in-vitro degradation data and showed less dependence on HA molecular weight. We
stated previously that the hydrogel degradation and swelling ability were largely
correlated with the cross-linking efficiency. The hydrogel synthesized at a high efficient
cross-link showed a slower degradation rate and a lower swelling ability due to the
hydrogel’s stiffness. This inconsistency can probably be assigned to the physical structure
formed in response to the different HA molecular weights or to the number of repeating
disaccharide units rather than the chemical linkage occurred between the BDDE
molecules and – OH groups. Despite the lower average pores-size exhibited by the
hydrogel with a higher HA molecular weight, the longer HA chains had more hydrophilic
sites attached to the hydrogel scaffold, and so more water was supposed to be absorbed.
This probably explained why the hydrogel of 2000 kDa HA molecular weight did not
show a lower swelling ratio in distilled water and PBS than hydrogel of 1000 kDa. In
addition, the BDDE-HA hydrogel with a longer HA chain (2000 kDa) had probably some
free HA fragments that were not released during the dialysis or purifying process. These
trapped fragments did not form a limitation on the extent to which the hydrogel could
swell, instead they contributed in the overall swelling and preserved a good water up-take
ability. The results of swelling ratio are displayed in (appendix 7.5).

CHAPTER 6: HA MOLECULAR WEIGHT
78
Figure 6. 2 A bar graph represents swelling ratios (g/g) of hydrogels prepared at different HA molecular
weight with the 95% confidence intervals
6.2.5.3 Rheological measurements
The results of rheological measurements proved that the moduli G' and G'' were
increased with the increase of HA molecular weight and became less dependent on the
angular frequency. The storage modulus G' of hydrogel with the highest HA molecular
weight is predominant over the loss modulus G'' during the course of Small Amplitude
Oscillatory Strain (SAOS) test. So, it shows a better viscoelastic property. It is important
to note that the applied shear forces of all oscillation frequency tests felled within the
linear viscoelastic range and that produced consistent data. Results of rheology were in
good agreement with the results of in-vitro degradation rate. Figures (6.3- 6.6)
demonstrate graphs presenting the rheological behavior (storage modulus, loss modulus)
of native HA and cross-linked hydrogels prepared at various HA molecular weight.
Figure 6. 3Storage modulus G' and Loss modulus G'' (Pa) versus angular frequency in the range
(0.01-100 s-1
) for native HA
0.0010.01
0.11
10100
100010000
0.01 0.1 1 10 100
Mo
du
lus
(Pa)
ω (rad/s)
Storage modulus
Loss modulus

CHAPTER 6: HA MOLECULAR WEIGHT
79
Figure 6. 4 Storage modulus G' and Loss modulus G'' (Pa) versus angular frequency in the range
(0.01-100 s-1
) for cross-linked hydrogel prepared at 100,000 Da HA molecular weight
Figure 6. 5Storage modulus G' and Loss modulus G'' (Pa) versus angular frequency in the range
(0.01-100 s-1
) for cross-linked hydrogel prepared at 1000,000 Da HA molecular weight
Figure 6. 6Storage modulus G' and Loss modulus G'' (Pa) versus angular frequency in the range
(0.01-100 s-1
) for cross-linked hydrogel prepared at 2000,000 Da HA molecular weight
1
10
100
1000
10000
100000
0.01 0.1 1 10 100
Mo
du
lus
(Pa)
ω (rad/s)
Storage modulus
Loss modulus
1
10
100
1000
10000
0.01 0.1 1 10 100
Mo
du
lus
(Pa)
ω (rad/s)
Storage modulus
Loss modulus
1
10
100
1000
10000
100000
0.01 0.1 1 10 100
Mo
du
lus
(Pa)
ω (rad/s)
Storage modulus
Loss modulus
CHAPTER 6: HA MOLECULAR WEIGHT
81
Over the course of oscillation test, the native HA did not demonstrate a
viscoelastic property. At lower frequency value, it showed a viscous behavior and at a
very high frequency, it turned into elastic. As shown in figure 6.3, the native HA was a
highly frequency- dependent, because both moduli G' and G'' varied significantly with the
frequency between 0.01 ω (rad/s) and 100 ω (rad/s). In contrast, the cross-linked
hydrogels were not frequency-dependent and showed viscoelastic properties where the
storage modulus was predominant over the whole range of tested frequency. However,
the cross-linked hydrogels experienced dehydrations when the measurements were
carried out at a very low frequency rate particularly the hydrogel with 2000 kDa. Based
on the analysis, the rheological behavior of the hydrogels prepared at 100 kDa (Fig. 6.4)
and 1000 kDa (Fig. 6.5) is relatively similar. On the other hand, The hydrogel prepared at
2000 kDa HA molecular weight (Fig. 6.6) was the stiffest according to enzymatic
degradation test and revealed a higher ability to restore deformation when pressure was
applied. The 2000 kDa hydrogel exhibited the highest G' value (476 Pa) at 1.0 frequency
in comparison to the hydrogel of 100 kDa (80.6 Pa) and the hydrogel of 1000 kDa (99.0
Pa).
By increasing the HA molecular weight, the number of substituted monomers to
the total number of HA monomers is increased and so a larger cross-linked network is
constructed. If the stoichiometric ratio between BDDE and HA is taken into account,
increasing the length of HA chains will lead to the formation of more covalent bonds
between HA and BDDE. The native and cross-linked hydrogels were also evaluated for
their dynamic viscosity in a steady shear mode at 25 oC. All hydrogels showed a shear-
thinning property; the shear viscosity decreased over the course of frequency sweep test
(Fig. 6.7). This property confirmed the crucial role of HA molecular weight on cross-
linking efficiency, because the formed hydrogels showed different shear-thinning
response. The (appendix 8) displays all Excel data of native and cross-linked BDDE-HA
hydrogels.
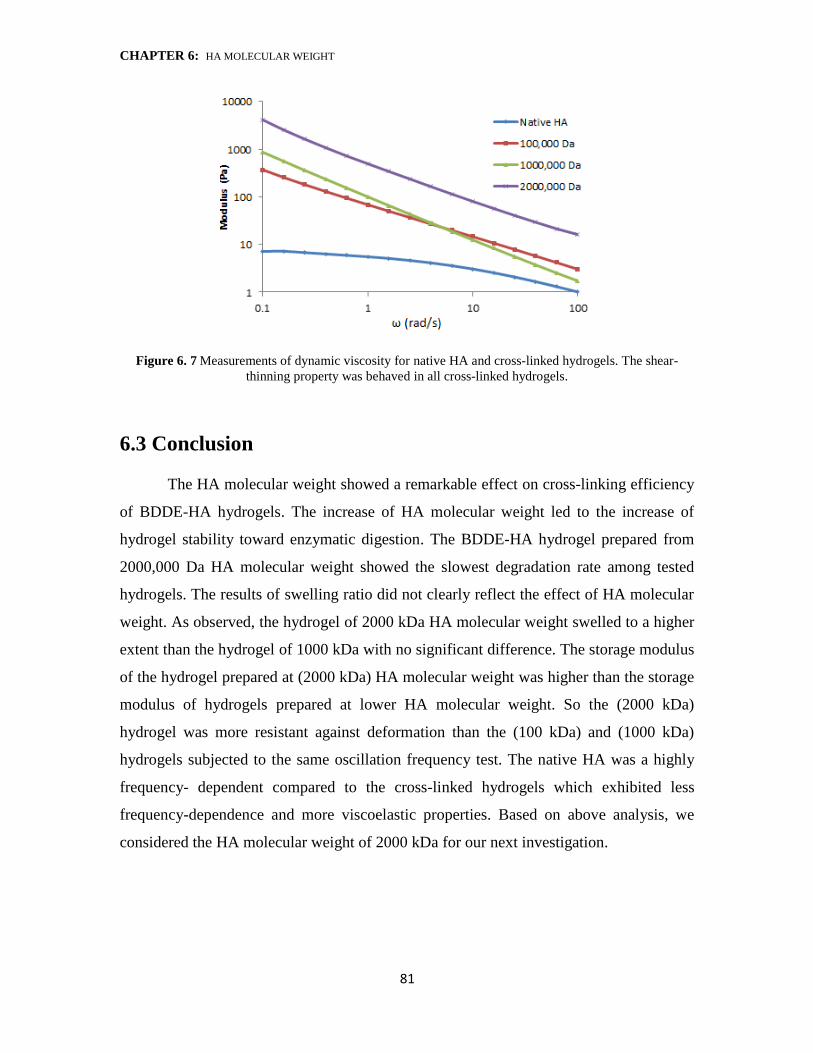
CHAPTER 6: HA MOLECULAR WEIGHT
80
Figure 6. 7 Measurements of dynamic viscosity for native HA and cross-linked hydrogels. The shear-
thinning property was behaved in all cross-linked hydrogels.
6.3 Conclusion
The HA molecular weight showed a remarkable effect on cross-linking efficiency
of BDDE-HA hydrogels. The increase of HA molecular weight led to the increase of
hydrogel stability toward enzymatic digestion. The BDDE-HA hydrogel prepared from
2000,000 Da HA molecular weight showed the slowest degradation rate among tested
hydrogels. The results of swelling ratio did not clearly reflect the effect of HA molecular
weight. As observed, the hydrogel of 2000 kDa HA molecular weight swelled to a higher
extent than the hydrogel of 1000 kDa with no significant difference. The storage modulus
of the hydrogel prepared at (2000 kDa) HA molecular weight was higher than the storage
modulus of hydrogels prepared at lower HA molecular weight. So the (2000 kDa)
hydrogel was more resistant against deformation than the (100 kDa) and (1000 kDa)
hydrogels subjected to the same oscillation frequency test. The native HA was a highly
frequency- dependent compared to the cross-linked hydrogels which exhibited less
frequency-dependence and more viscoelastic properties. Based on above analysis, we
considered the HA molecular weight of 2000 kDa for our next investigation.

CHAPTER 7: MIXING APPROACH
82
CHAPTER 7
7. Mixing approach
7.1 Introduction
Mixing approach is a very important factor, particularly for heterogeneous
reactions to limit mass loss or minimize impurity-uptake. Mixing of reaction components
may be slow or fast to achieve complete blending or it may require a powered mixer or a
hand mixing. Moreover, thorough mixing is critical to produce a homogenized hydrogel
and increase the yields of physical cross-linking. Such conditions will have a significant
impact on hydrogel properties including stability, swelling and modulus because they
represent the way that HA powder is mixed with the BDDE solution. In this chapter we
studied the effect of two mixing approaches: the large-batch mixing approach and the
small-batches mixing approach. So, two cross-linked BDDE-HA hydrogels were
synthesized: (hydrogel 1), by mixing the reaction quantities in one container; and
(hydrogel 2), by dividing the reaction quantity into smaller batches at various HA/BDDE
ratios. The results were compared with a native HA solution.
7.2 Mixing approach
7.2.1 Materials
Hyaluronic acid with an average molecular weight 2000 kDa. Hyaluronidase
(3000 U/mg), BDDE, Ehrlich's reagent, phosphate buffer saline (PBS) and alkaline
solutions.
7.2.2 Synthesis
Two cross-linking reagent solutions were prepared by adding 200 µl of 1,4 –
butandiol diglycidyl ether (BDDE) into 9.8 ml of 0.25M NaOH, (pH 13).

CHAPTER 7: MIXING APPROACH
83
1.0 gram of HA powder was added to one reagent solution and mixed thoroughly
at 40 oC for 2 h and then neutralized with 0.1M HCl to a pH of approximately 7.0. The
resulted hydrogel was labeled with ―hydrogel 1” and the mixing approach was suggested
to be called ― the large-batch mixing approach‖. Similar HA quantity was divided into
smaller batches at different weights; 300 mg, 250 mg, 200 mg, 150 mg and 100 mg.
Each batch was mixed with 2.0 ml of the second reagent solution in separate containers
for 30 min at room temperature. All batches were then combined in one reaction
container and left under continuous mixing at 40 oC for 90 min. The combined mixture
was then neutralized with 0.1M HCl to a pH of approximately 7.0. The resulted hydrogel
was labeled with ― hydrogel 2 ‖ and the mixing approach was suggested to be called ―
the small-batches mixing approach‖. Both solutions were then dialyzed for 2 days against
distilled water to remove BDDE residue and non-reacted HA fragments. Finally the
cross-linked hydrogels were lyophilized and kept at 8 oC until the characterization studies
were carried out. The cross-linking efficiencies were estimated by measuring the in-vitro
degradation rate using the colorimetric method, the swelling ratio using gravimetrical
balance, surface morphology using scanning electron microscope (SEM) and modulus
using rheometer. All hydrogels were analyzed by Fourier-transformed infrared (FTIR)
and nuclear magnetic resonance spectroscopy (NMR) to confirm the occurrence of
modification between HA chains and BDDE molecules. For a comparison purpose, the
cross-linked hydrogels were compared with a native HA polymer.
7.2.3 Measurements
7.2.3.1 In-vitro degradation rate
Equivalent portions from cross-linked hydrogels were cut and incubated with
hyaluronidase in PBS solution for different intervals: 1, 2, 3 and 4 days. The enzymatic
reactions were then stopped by heating each solution in boiling water for 5 min. The
amount of N-acetyl glucosamine (NAG) found in each extract was quantified using the
colorimetric method. The degradation rates of all samples were plotted as a function of
time using the equation 4.1 described in section 4.2.3.1
CHAPTER 7: MIXING APPROACH
84
7.2.3.2 Swelling ratio
Equivalent portions from cross-linked hydrogels were immersed in distilled water
and phosphate buffer saline (PBS) until equilibrium state. Measurements were carried out
as described in section 4.2.3.2.
7.2.3.3 Scanning Electron Microscope SEM
The morphologies of prepared hydrogels were visualized by scanning electron
microscope (SEM) from JEOL (Tokyo, Japan). The lyophilized samples were first coated
with platinum using an ion sputter and then imaged with SEI mode at 10 Kv.
7.2.3.4 Rheological measurements
Rheological measurements were carried out using ARES rheometer (TA
instruments, USA) equipped with a plate and plate geometry. Initially a strain sweep test
was performed to determine the linear viscoelastic region (LVR) and then an oscillatory
test was applied to determine the storage and loss modulus over a frequency range
(0.01-100 s -1
) at a constant strain.
7.2.3.5 Fourier-transformed infrared (FT-IR) analysis
Portions from native HA and cross-linked hydrogels were obtained and
characterized using Bruker Tensor 37 Fourier Transform Infrared Spectroscopy FT-IR
(Ettlingen, Germany). All spectra were recorded between 4000 and 400 cm-1
with a
resolution of 4 cm-1
and the data was manipulated using OPUS software.
7.2.3.6 NMR spectroscopy
Known samples of native and cross-linked hydrogels were mixed with bovine
testicular hyaluronidase (BTH) enzyme solution until complete digestion. The extracts
were centrifuged at 2000 rpm for 2 min and then lyophilized. The samples were then
dissolved in D2O and transferred into NMR tubes. The 1H NMR spectroscopy was carried
out on a Bruker 600 MHz (Zurich, Switzerland) instrument operating at a frequency of
600 MHz. The spectra were acquired by Bruker Topspin 3.2 software.

CHAPTER 7: MIXING APPROACH
85
7.2.4 Statistics
{As stated in section 4.2.4 }
7.2.5 Results and discussion
7.2.5.1 In-vitro degradation test
Although HA hydrogels can be degraded by bovine testicular hyaluronidase
(BTH) enzyme, the cross-linked polymer matrix can slow down enzymatic invasion and
increase duration of hydrogel residence. Fig. 7.1 represents degradation profiles of native
and cross-linked hydrogels for four consecutive days of treatment. As stated, the
degradation rates were evaluated by determining the % NAG remaining in the non-
digested fractions as a function of incubation time with the hyaluronidase.
Figure 7. 1 Degradation profiles of native and cross-linked BDDE-HA hydrogels 1 & 2 prepared at
different mixing approaches. Results are expressed as mean ± 95% confidence represented by the error bars
(n=3).
Based on results, the native HA solution and hydrogels 1 and 2 showed different
sensitivities towards enzyme activity, and it was observed that almost 90% of native HA
was lost in the first day of incubation with hyaluronidase compared to hydrogels 1 and 2,
which showed a much higher stability towards enzymatic digestion and lost
approximately 26 % and 24 % respectively of their original content of NAG after a
similar duration.

CHAPTER 7: MIXING APPROACH
86
Although hydrogels 1 and 2 did not exhibit a significant difference (p > 0.05, t-
test, n=3) towards hyaluronidase on the first and second days of incubation, they showed
different degradation on subsequent days. Hydrogel 1 degraded faster than hydrogel 2 on
the third and fourth days, indicating that the polymer matrix of hydrogel 1was relatively
affected by the mixing approach. Hydrogel 2, overall, presented a higher resistance to
enzyme, and approximately one-fourth of its original content of NAG remained after the
course of treatment. In contrast, the remaining NAG of hydrogel 1 was less by almost
5.0%. These data reveal that the mixing approach is critical and leads to a different
degradation profile in cross-linked hydrogels. The small-batches mixing approach
showed a better blending of hydrogel components and seemed to produce a more
homogenized cross-linked matrix.
Although, the two solutions were mixed for the same period, the small-batches
mixing approach allowed HA powder to disperse into the reagent solution in lower
volumes, and different HA / BDDE molar ratios that led to a better movement of solution
components. Each separate mixing step added a distinct feature to the total mixture, so
the small HA batches in hydrogel 2 had a greater chance to bind with BDDE molecules
than did the single lump in hydrogel 1. In addition, the small-batches mixing may play a
crucial role in keeping HA chains close together and form more HA entanglement and
conformation. The HA chains in the hydrogel 2 composite became shorter than those in
hydrogel 1, thus strengthening the overall network. This highly cross-linked network
served as an inhibitor for the enzyme attack. All degradation rate values with uncertainty
intervals are demonstrated in (appendix 6.6).

CHAPTER 7: MIXING APPROACH
87
7.2.5.2 Swelling measurements
Figure 7. 2 Swelling ratios of cross-liked BDDE-HA hydrogels 1 & 2
The swelling ratios of the cross-linked hydrogels 1 and 2 in distilled water and
phosphate buffer saline are demonstrated in Fig. 7.2. Native HA was excluded because it
showed solubility and did not form a well-defined three-dimensional scaffold. The results
of swelling ratio measurements were in good agreement with the results of the in-vitro
degradation rate. Hydrogels 1 and 2 reached their equilibrium states at different water-
absorption capacity explaining the relative effect of mixing methodology on hydrogel
swelling properties. Swelling ratios of hydrogels 1 and 2 in distilled water showed a
significant difference and reached to maximum average values at 135 ± 7.2 g/g and 130
± 3.8 g/g respectively. However, their swelling ratios in phosphate buffer saline (PBS)
showed no significant difference with average values at 127 ± 10.8 g/g for hydrogel 1
and 123 ± 5.2 g/g for hydrogel 2. On the other hand, it was observed that the extent to
which the cross-linked hydrogels swelled in PBS was less than their swelling in distilled
water pointing out to the influence of ionic strength of buffer. The (appendix 7.6)
displays the swelling ratio of cross-linked hydrogels prepared at different mixing
approach. Based on these findings, a slight change in BDDE-HA synthesis process
including mixing process can alter the chemical and physical properties of HA hydrogels.

CHAPTER 7: MIXING APPROACH
88
This can be plausibly attributed to the fact that hydrogel 2 formed more physical
entanglements and covalent bonds with BDDE than hydrogel 1 that kept the polymer
chains in close proximity and limited its possibility for swelling. It is also noteworthy
mentioning that incorporation of various HA contents with a fixed level of cross-linking
reagent solution (as happened with hydrogel 2) resulted in various exposures of HA
chains to BDDE molecules. This mixing enhanced formation of efficient cross-links and
led to a more densely cross-linked network, so the hydrogel became stiffer and
subsequently showed a lower swelling ratio. The hydrogel 2 cross-linking efficiency was
also verified by the narrower 95% confidence interval (n=3) observed around the
average swelling ratios and degradation rates of hydrogel 2 compared to hydrogel 1. The
wide 95% confidence interval usually reflects inhomogeneity and irregular distribution of
BDDE molecules in the reaction mixture forming rich and poor cross-linking density
regions throughout the hydrogel scaffold and that may explain the slight increase in the
uncertainty level of hydrogel 1.
Based on hydrogel degradation and swelling capacity, it is necessary to highlight
that these two significant factors depend basically on the degree of cross-linking which is
of great relevance to in-vivo hydrogel profile. Despite differences between in-vivo and
in-vitro conditions, measurements of the in-vitro hydrogel degradation rate and swelling
ratio are observed to be substantial. It is of large benefit to predict in-vivo performance of
cross-linked hydrogel from in-vitro data. The slower degradation rate of a studied
hydrogel expresses tighter structure, slower erosion rate and better mechanical integrity,
thus it exhibits more robust behavior necessary for tissue growth and long-lasting effect.
On the other hand, the modified hydrogels are highly water-swollen that can swell in
water under biological conditions but do not dissolve in it (Zhu and Marchant, 2011).
This high swelling expresses several features such as low surface tension with
surrounding biological fluids or low mechanical irritation to surrounding tissues and
excellent nutrients diffusion into the gel and cellular waste removal out of the gel (Jeon et
al., 2007). The ability of molecules to diffuse into and out of swollen hydrogels, enable
the use of hydrogels in a variety of biomedical applications including skin augmentation,
regenerative medicine and recently as delivery vehicles of bioactive substances (Satish et
al., 2006).

CHAPTER 7: MIXING APPROACH
89
Drugs can be easily incorporated into swollen hydrogel matrix and then injected
to the defect site. So fundamental measurements of hydrogel degradation and swelling
ability have become crucial, particularly for drugs diffusion tended to be released in the
living body through matrix swelling or matrix erosion. The mechanism of drug release in
matrix swelling occurs when diffusion of drug is faster than hydrogel swelling while in
surface matrix erosion, the release occurs when the rate of enzymatic degradation is much
faster than the transport of enzyme into the hydrogel (Zarzycki et al., 2010). The success
of a tissue engineering approach is also dependent on the properties of scaffolding
hydrogel (Park et al., 2009), so carrying out such measurements could provide valuable
means of assessing hydrogel erosion and structural integrity outside the organism and
thus it helps developing a tailored scaffold that mimics tissue of native extracellular
matrix. A study showed that the in-vivo erosion of selected hydrogels that degraded by
hydrolytic or enzymatic degradation linearly correlated with the in-vitro erosion (Artzi et
al., 2012).
This correlation enables successful predication of material erosion that can be
extended to monitor material stabilization, cell viability and scaffold fate in tissue-
engineering formulations. Based on such work, a significant advance in the design of
artificial matrices has been made from a simple scaffold to a more complex dynamic 3-
dimensional network that supports cell growth, facilitates nutrient transfer and provides
appropriate mechanical and chemical characteristics (Geckil et al., 2010 ). Furthermore,
the in-vitro degradation measurements allow producing materials with a controllable
degradation which is necessary for the in-vivo application. For instance, materials with a
degradation time of 25-day is suitable for burn and skin excision, and with an 8-week
degradation time is suitable for diabetic ulcer or pressure ulcer (Xu et al., 2009).
However, a specific set of physiological conditions need to be established in-vitro to
attain in-vivo correlation because the in-vivo erosion profile is more complex and it is
site-dependent (Artzi et al., 2012).

CHAPTER 7: MIXING APPROACH
91
7.2.5.3 SEM
Although SEM cannot confirm the presence of ether bond in the cross-linked
hydrogel, it offers unique information about porosity and scaffold interconnection. Fig.
7.3 shows SEM surface images of native HA and cross-linked hydrogels, all images were
obtained at identical magnification conditions (x100, x500, SEI and 10kv). In our results,
the SEM images demonstrated differences in the hydrogel’s microstructure. It was
obvious that the cross-linking process produced a scaffold with larger density and lower
pore sizes. The images of native HA showed a very thin layer and open pores with some
collapse that probably occurred during the freeze-drying process . In contrast, hydrogels 1
and 2 showed rigidity and cross-linked composites. The SEM images of cross-linked
hydrogels exhibited almost identical matrices with relative different porous structures
where hydrogel 2 appeared denser and showed smaller pores size in comparison with
hydrogel 1.

CHAPTER 7: MIXING APPROACH
90
Figure 7. 3 Morphological structure imaged by SEM using SEI mode (10 Kv) at x100 and x 500 for
lyophilized native HA (A & B), hydrogel 1 (C & D), and hydrogel 2 (E & F)

CHAPTER 7: MIXING APPROACH
92
7.2.5.4 Rheological measurements
Figure 7. 4 Storage modulus G' and Loss modulus G'' (Pa) versus angular frequency in the range (0.01-100
s-1
) for hydrogel 1 prepared by large-batch mixing approach
Figure 7. 5 Storage modulus G' and Loss modulus G'' (Pa) versus angular frequency in the range (0.01-100
s-1
) for hydrogel 2 prepared by small-batches mixing approach
Figures 7.4 and 7.5 show the modulus graphs of cross-linked BDDE-HA
hydrogels prepared at different mixing approaches. Both hydrogels experienced a solvent
dehydration at lower frequency. The analysis of rheological data (appendix 8) revealed
that the modulus did not exhibit a noticeable difference between the two hydrogels.
1
10
100
1000
10000
0.01 0.1 1 10 100
Mo
du
lus
(Pa)
ω (rad/s)
Storage modulus
Loss modulus
Complex viscosity
1
10
100
1000
10000
0.01 0.1 1 10 100
Mo
du
lus
(Pa)
Storage modulus
Loss modulus
Complex viscosity
ω (rad/s)
CHAPTER 7: MIXING APPROACH
93
It was shown that the storage and loss modulus increased slowly with the
increase of angular frequency, this indicated that both hydrogels were not frequency-
dependent. The elastic modulus was always higher than the viscous modulus over the
whole range of analysis and the two hydrogels showed a shear-thinning and a viscoelastic
property. However, the high storage value observed with the hydrogel 2 reflected its
restitution ability after deformation and relaxation stress. These data confirmed that the
small-batches mixing approach promoted the cross-linking reaction and formed a better
cross-lined network than the large-batch mixing approach.
7.2.5.5 FTIR and NMR
The chemical modification of HA with BDDE was confirmed by FTIR and 1H
NMR analysis (Fig. 7.6). The difference in the FTIR and NMR spectra between native
HA and BDDE-HA hydrogels confirmed that a chemical modification occurred to the
native HA structure. As stated in chapter 2, spectra of FTIR shows three characteristic
peaks: peak 1 at 3343 cm-1
observed in native and cross-linked hydrogel; peak 2 at 2900
cm-1
observed in cross-linked hydrogels and relatively in native HA; peak 3 at 1300 cm-1
observed in the cross-linked hydrogels. Peak 1 was assigned to the hydroxyl group,
whereas peaks 2 and 3 represented the C-H stretching and ether linkage. The peak 1
corresponding to the hydroxyl group appeared with a higher intensity in native HA than
its counterpart peaks in cross-linked hydrogels.
This noticeable decrease explained that under alkaline conditions, the cross-
linking reaction targeted one of the reactive hydroxyl groups in native HA and by
increasing the modification process, the total amount of (–OH) decreased. In terms of the
mixing approach, the BDDE molecule blocked a larger amount of (–OH) groups in
hydrogel 2 and more ether bonds were formed in comparison to hydrogel 1. This finding
was consistent with previous analysis and confirmed the efficiency of the small-batches
mixing approach. NMR results revealed a distinctive signal at 1.5 ppm in the cross-linked
BDDE-HA hydrogels which is absent in native HA. This peak represents the (-CH2-)
group of the BDDE molecule.

CHAPTER 7: MIXING APPROACH
94
The peak at about 1.9 ppm which appeared in native HA and cross-linked
hydrogels could be assigned to the acetyl glucosamine. As we explained in chapter 2,
Integration of the signal at 1.5 ppm with regard to the acetyl glucosamine at 1.9 ppm
gives the number of BDDE molecules linked to HA chains which explains the total
degree of modification occurred in the formed hydrogel. Based on NMR data, the degree
of modification of hydrogels 1 and 2 equaled to about 14% and 24 % respectively.
Commercially available injectable dermal fillers usually exhibit a wide range of degree of
modification depending on purpose of implantation. For instance, lower-modification
hydrogels may be better suited for less-dynamic wrinkles such as lips or periorbital
region, high-modified HA hydrogels are probably better suited to areas where correction
is very important such as nasolabial folds and marionette lines (Kablik et al, 2009).
Examples of HA-based fillers with low HA modification (less than 10 %) include
Juvederm and Restylane (Edsman et al, 2012 ) and products with high HA modification
include Hylaform, and Prevelle that show a degree of modification reaching to 23 %
(Kablik et al, 2009).
The NMR data also supported the previous measurements presenting further
evidence for the occurrence of modification and proved that hydrogel 2 underwent a
higher degree of modification when compared to hydrogel 1. However, it is important to
note that the obtained values of the degree of modification were far less than the
theoretical degree of modification according to molar ratio of HA and BDDE involved in
the chemical reaction, this means that a large portion of BDDE molecules was not bound
with HA chains particularly in hydrogel 1.

CHAPTER 7: MIXING APPROACH
95
Figure 7. 6 FTIR and 1H NMR spectra for native HA ( A & B), hydrogel 1 (C & D) and hydrogel 2
( E & F)

CHAPTER 7: MIXING APPROACH
96
The difference between the degrees of modification of hydrogels 1 and 2 was
significantly large (p = 0.004), which was not clearly observed in the in-vitro degradation
rates and swelling measurements. This was probably due to the formation of pendant
groups along with the efficient cross-links in hydrogel 2. As we explained in chapter 1,
pendant modification does not contribute to hydrogel stability and does not produce a
covalently cross-linked network. During the cross-linking reaction, the BDDE reacts with
HA chains at both ends forming the double-linked molecules. However, some portion of
BDDE reacts with HA at one end leaving the other end pendent (mono-linked) or reacted
with water/hydroxide (Kenne et al. 2013). The mechanism of this interaction is mainly
dependent on reaction conditions or relative tendency of epoxides binding with the
hydroxyl groups of HA. The data of NMR describe the total change happened in
hydrogel modification which includes both mono-linked BDDE molecules and those
involved in the actual cross-linkages. Overall, the small-batches mixing approach
produced higher yields of physical and chemical cross-links than the large-batch mixing
approach. Despite the similarities in some results and the formation of pendant, we could
demonstrate that the cross-linked BDDE-HA hydrogel prepared through the small-
batches mixing approach showed a higher strength and stability against the action of
hyaluronidase than the hydrogel prepared by the large-batch mixing approach.
7.3 Conclusion
In this work, we studied the influence of mixing approach on two cross-linked
BDDE-HA hydrogels prepared by two different mixing approaches; the large-batch
mixing approach in which the hydrogel quantities were all mixed as a single lump in one
container (hydrogel 1), and the small-batches mixing approach in which the hydrogel
quantities were divided into smaller batches, mixed separately at various HA/BDDE
ratios then combined in one reaction mixture (hydrogel 2). The result showed that the
cross-linking reaction was mixing process-dependent. Degradation tests proved that, in
relation to hydrogel 1, hydrogel 2 was more stable, and exhibited a higher resistance
toward hyaluronidase activity.

CHAPTER 7: MIXING APPROACH
97
The swelling ratio of hydrogel 1 was significantly higher than that of hydrogel 2
in distilled water; however, in phosphate buffer saline, both hydrogels showed no
significant difference. SEM images demonstrated that hydrogel 2 composite showed a
denser network structure and smaller pore-size than hydrogel 1. In comparison to native
HA, the occurrence of chemical modification in the cross-linked hydrogels was
confirmed by FTIR and NMR distinctive peaks. These peaks also provided evidence that
hydrogel 2 exhibited a higher degree of modification than hydrogel 1. In conclusion, the
small-batches mixing approach proved to be more effective than large-batch mixing in
promoting HA-HA entanglement and increasing the probability of BDDE molecules for
binding with HA chains.

SUMMARY AND OUTLOOK
98
SUMMARY AND OUTLOOK
The main objective of our study was to enhance the cross-linking efficiency of
HA hydrogels cross-linked with 1, 4-butanediol diglycidyl ether BDDE via studying
method conditions including reaction time, pH, temperature, HA concentration, HA
molecular weight and mixing approach. Based on hydrogel’s properties (e.g. in-vitro
degradation rate, swelling ability, morphological and rheological behavior) resulting from
each cross-linking process, the cross-linking efficiency was evaluated. The results
revealed that there was a noticeable correlation between method conditions and cross-
linking efficiency. The BDDE-HA hydrogels synthesized at a reaction time equaled or
longer than 2 h showed slower degradation rates and lower swelling ratios than those
synthesized at shorter time. The two-hour interval was subsequently determined as a
minimum reaction time required for cross-linking 1.2 g HA powder with 200 µl BDDE.
The resistance towards enzymatic degradation and swelling ability demonstrated by the
BDDE-HA hydrogel prepared at pH 13 confirmed the potential impact of strong alkaline
medium on cross-linking efficiency of HA.
The temperature was also an effective parameter, the 40 oC was determined as an
ideal heated medium to carry out the HA chemical modification because it produced the
stiffest hydrogel against enzymatic destruction. The BDDE-HA hydrogel prepared at 10.0
% HA initial concentration proved to be the idlest concentration level corresponding to
the 2.0 % v/v BDDE. On the other side, the two millions Da (HA) molecular weight
formed a more stable cross-linked network towards hyaluronidase compared to the
hydrogels prepared at one million Da or 100 kDa. However, the swelling ratio of two
millions Da (HA) hydrogel was slightly larger than the swelling ratio of one million Da
hydrogel in both water and PBS. Furthermore, mixing approach showed a remarkable
influence on BDDE-HA cross-linked network. The small-batches mixing approach
produced a more homogenized cross-linked texture than the large-batch mixing.

SUMMARY AND OUTLOOK
99
Based on the above summary, we hypothesize that, the method with the new
optimum conditions can relatively enhance the cross-linking efficiency of BDDE-HA
hydrogel to a certain degree while the BDDE content is possible to be kept constant. The
desirability and suitability of cross-linked hydrogels as a dermal filler or scaffolding
materials are largely correlated with longevity. Preparation of a rigid HA hydrogel in the
absence of BDDE is challenging. The chemical cross-linker usually forms a major
constituent in HA modification and a greater contributor in the increase of cross-linking
efficiency. In spite of the fact that the physical crosslinking has recently gained a
considerable attention, the physical cross-linking alone cannot exhibit a significant
resistant against depolymerization. Therefore, more studies are required in this area
particularly for the formation of physically cross-linked hydrogels by either HA-HA
interaction or hybrid networks in which HA is combined with other biopolymers. An
alternative approach could be the use of physical cross-linking strategy with a minimum
quantity of the chemical cross-linker in order to produce a rigid hydrogel with a low
potential of hazards and adverse reactions. However, more studies are required to
evaluate the amounts of BDDE to be activated in order to cross-link larger amounts of
HA chains and to not form pendants or dangling chains. We may recommend here a
development of a chromatographic method using high performance liquid
chromatography to monitor the BDDE residue in the solution after the synthetic reaction.
Pendant or dangling chains are probably formed when BDDE molecule is
physically restricted from one side to reach HA chain or the epoxide rings are not active
enough to open and react with HA chain. To avoid pendants, we also recommend to
investigate how HA chains can be made close enough to reach each other and to reach the
cross-linker molecules. Study of the effect of di- or tri-valent counter ions on cross-
linking efficiency is also recommended. For instance, cross-linking of hyaluronic acid
with BDDE in the presence of a multivalent ion of opposite charge (e.g. CaCl2 or MgCl2)
is worthwhile. These ions will lead to an interaction between anionic groups on HA
(COO -) with the positive charge of the metal ( Ca
+ , Mg
+ ), subsequently the distances
between HA strands become shorter.
ACKNOWLEDGMENT
011
ACKNOWLEDGMENT
I would like to express my deepest thanks and appreciation to my supervisor
Prof. Dr. Dr. Reinhard Neubert who provided me the opportunity to carry out this project
with him. I am really grateful to his continuous help and support that enabled me to
complete my work on time. His vision, knowledge and experience have all kept me
motivated always and looked forward to increase my interest in this area of study. My
deepest appreciation is also expressed to my co- supervisor Prof. Ahmed Al-Harrasi who
gave me knowledge and support, particularly when I held a part of my project at Nizwa
University. I also gratefully acknowledge Dr. yahya mrestani for his advice and guidance,
especially when I settled in Germany. A special thanks goes to Dr. Klaus Schröter at the
Institute of Physics for his technical support and rheological measurements. I would like
also to thank Ms. Manuela Woigk who assisted in the preparation of HPLC work. I
would like also to acknowledge Mr. Khamis Omair Al Riyami for SEM work and Mr.
Muhammed Adil and Ahmed Al-Abri for NMR analysis. Furthermore, all colleagues and
friends who assisted me in my research are gratefully acknowledged. I also would like to
appreciate Vivatis Pharma (Hamburg, Germany) who kindly donated the sodium salt of
hyaluronic acid. Finally, I have to appreciate may parents, wife and whole family for
their large encouragement and support.

REFERENCES
010
REFERENCES
Akdamar, H., Sariözlü, N., Özcan, A., Ersöz, A., Denizli, A., Say, R. (2009). Separation and purification
of hyaluronic acid imprinted microbeads. Materials Science and Engineering, C29,1404-1408.
Alijotas-Reig, J., García-Giménez, V. (2008). Delayed immune-mediated adverse effects related to
hyaluronic acid and acryl hydrogel dermal fillers: clinical findings, long-term follow-up and review of the
literature. Journal of the European Academy of Dermatology and Venereology, 22,150-61.
Alkrad, J., Merstani, Y., Neubert, R. (2002). New approaches for quantifying hyaluronic acid in
Pharmaceutical semisolid formulation using HPLC and CZE. Journal of pharmaceutical and Biomedical
Analysis, 30, 913-919.
Allemann, I.B., Baumann, L.(2008). Hyaluronic acid gel (Juvederm) preparations in the treatment of facial
wrinkles and folds. Clinical Interventions in Aging, 3(4), 629-634.
Amargier, C., Marchacl, P., Payan, E., Netter, P., Dellacheri, E. (2006). New physically and chemically
cross-linked hyaluronate (HA)-based hydrogels for cartilage repair. Journal of Biomedical Material
Research, 76 A, 416-424.
Andre, P. (2004). Hyaluronic acid and its use as a ―rejuvenation‖ agent in cosmetic dermatology. Seminars
in Cutaneous Medicine and Surgery, 23, 218–222.
Argin-Soysal, S., Kofinas, P., Martin Lo, Y. (2009). Effect of complexation conditions on xanthan-
chitosan polyelecrolyte complex gels. Food Hydrocolloids, 23, 202-209.
Arrich, J., Pirbauer, F., Mad, P., Schmid, D., Klaushofer, k., Mullner, M. (2005). Intra-articular hyaluronic
acid for treatment of osteoarthritis of the knee systematic review and meta-analysis. Canadian Medical
Association Journal, 172-1039.
Artzi, N., Oliva, N., Puron, C., Shitreet, S., Artzi, S., Ramos, A., Groothuis, A., Sahagian, G., Edelman, E.
(2012). In vivo and in vitro tracking of erosion in biodegradable materials using non-invasive fluorescence
imaging. Natural Materials, 10 (9), 704-709.
Athre, R. (2007). Facial filler agents. Operative Techniques in Otolaryngology, 18 : 243-247.
Barbucci, R., Leone, G., Chiumiento, A., Di Cocco, M., D’Orazio, G., Gianferri, R., Delfini, M. (2006).
Low-and high-resolution nuclear magnetic resonance (NMR) characterization of hyaluronan-based native
and sulfated hydrogels. Carbohydrate Research, 341, 1848-1858.
Baumann, L. (2004). Replacing dermal constituents lost through aging with dermal fillers. Seminars in
Cutaneous Medicine and Surgery, 23,160-166.

REFERENCES
012
Beasley, K. L., Weiss, M. A., Weiss, R. A. (2009). Hyaluronic acid fillers: A comprehensive review. Facial
Plastic Surgery, 25, 86–94.
Bencherif, S., Srinivasan, A., Horkay, F., Hollinger, J., Matyjaszewski, K., Washburn, N. (2008). Influence
of the degree of methacrylation on hyaluronic acid hydrogels properties. Biomaterials, 29 (12), 1739–1749.
Berkó, S., Maroda, M., Bondár, M., Erós, G., Hartmann, P., Szentner, K., Szabó-Révész, P., Kemény, L.,
Borbély, J., Csányi, E. (2013). Advantages of cross-linked versus linear hyaluronic acid for semisolid skin
delivery systems. European Polymer Journal, 49, 2511-2517.
Bingol, A.O., Dogan, A. (2012). Physical properties of hyaluronic acid fillers and their relevance for
clinical performance. MÄC Magazin für ästhetische Chirurgie, 2112 (6), 6-12.
Boogaard, P.J., Denneman, M.A., Van Sittert, N.J. (2000). Dermal penetration and metabolism of five
glycidyl ethers in human, rat and mouse skin. Xenobiotica, 5, 469-83.
Borrell, M., Leslie, D., Tezel, A. (2011). Lift capabilities of hyaluronic acid fillers. Journal of Cosmetic
and Laser Therapy, 13, 21-27.
Brandt. F., Cazzaniga, A. (2008). Hyaluronic acid gel fillers in the management of facial aging. Clinical
Interventions in Aging, 3 (1), 153-159.
Brown, T. J., Laurent, U. B. G. & Fraser, J. R. E. (1991). Turnover of hyaluronan in synovial joints:
Elimination of labelled hyaluronan from the knee joint of the rabbit. Experimental Physiology, 76(1), 125–
134.
Caillard, R., Remondetto, GE., Mateescu, MA., Subirade, M. (2008). Characterization of amino cross-
linked soy protein hydrogels. Journal of Food Science, 73(5), C283-291.
Cardoso, D.A., Ulset, A.S., Bender, J., Jansen, J.A., Christensen, B.E., Leeuwen-burgh, S.C. (2014).
Effects of physical and chemical treatments on the molecular weight and degradation of alginate–
hydroxyapatite composites. Macromolecular Bioscience, 14(6) , 872–880.
Carruthers, J.D., Glogau, R.G., Blitzer, A., et al. (2008). Advances in facial rejuvenation: Botulinum
toxin type a, hyaluronic acid dermal fillers, and combination therapies—consensus recommendations.
Plastic and Reconstructive Surgery, 121(Suppl), 5S-30S.
Chung, C. W., Kang, J. Y., Yoon, I. S., Hwang, H. D., Balakrishnan, P., Cho, H. J., et al. (2011).
Interpenetrating polymer network (IPN) scaffolds of sodium hyaluronate and sodium alginate for
chondrocyte culture. Colloids and Surfaces B: Biointerfaces, 88, 711–716.
Cirillo, P., Benci, M., Bartoletti, E., et al. (2008). Proposed guidelines for use of dermal and subdermal
fillers. Giornale Italiano Di Dermatologia E Venereologia, 143, 187-193.
Clark, C.P. (2007). Animal-based hyaluronic acid fillers: scientific and technical considerations. Plastic
and Reconstructive Surgery, 120 (Suppl), 27S-32S.
REFERENCES
013
Collins, M. N. Birkinshaw, C. (2007). Comparison of the effectiveness of four different crosslinking agents
with hyaluronic acid hydrogel films for tissue-culture applications. Journal of Applied Polymer Science,
104(5), 3183–3191.
Davidenko, N., Campbell, J.J., Thian, E.S., Watson, C.J., Cameron, R.E. (2010). Collagen-hyaluronic acid
scaffolds for adipose tissue engineering. Acta Biomaterialia, 6, 3957-3968.
De Boulle, K., Glogau, R., Kono, T., Nathan, M., Tezel, A., Roca-Martinez, J.X., Paliwal, S.,
Stroumpoulis, D. (2013). A Review of the Metabolism of 1,4-Butanediol Diglycidyl Ether–Cross-linked
Hyaluronic Acid Dermal Fillers. Dermatologic Surgery, 12, 1758-66.
Della Valle, F., Romeo, A. (1986). US4851521.
Edsman, K., Nord, L., Ohrlund, A., Larkner, H., Kennf., A. (2012). Gel properties of hyaluronic acid
dermal fillers. Dermatologic Surgery, 38, 1170-1179.
Eenschooten, C., Vaccaro, A., Delie, F., Guillaumie, F., TA,mmeraas, K., Kontogeorgis, G. M., et al.
(2012). Novel self-associative and multiphasic nanostructured soft carriers based on amphiphilic hyaluronic
acid derivatives. Carbohydrate Polymers,
87(1), 444–451.
Esposito, E., Menegatti, E., Cortesi, R. (2005). Hyaluronan-based microspheres as tools for drug delivery:
A comparative study. International Journal of Pharmaceutics, 288(1), 35–49.
Esteban, C. Severian, D. (2000) Polyionic hydrogels based on xanthan and chitosan for stabilising and
controlled release of vitamins, Vol. WO0004086 (A1) (ed. U. United States Patent), Kemestrie Inc [CA],
USA.
Fakhari, A., Berkland, C. (2013). Applications and emerging trends of hyaluronic acid in tissue
engineering as a dermal filler and in osteoarthritis treatment. Acta Biomaterialia, 9, 7081-7092.
Falcone, S. J., Berg, R. A. (2008). Crosslinked hyaluronic acid dermal fillers: A comparison of rheological
properties. Journal of Biomedical Materials Research, 87A, 264–271.
Fan, H.B., Hu, Y.Y., Qin, L., Li, X.S., Wu, H., Lv, R. (2006). Porous gelatin–chondroitin–hyaluronate tri-
copolymer scaffold containing microspheres loaded with TGF-b1 induces differentiation of mesenchymal
stem cells in vivo for enhancing cartilage repair. Journal of Biomedical Materials Research, (77A),785–94.
Ferretti, M., Marra, K.G., Kobayashi, K., Defail, A.J., Chu, C.R.(2006). Controlled in vivo degradation of
genipin crosslinked polyethylene glycol hydrogels within osteochondral defects. Tissue Engineering, 12
(9), 2657–63.
Frazier, S., Roodhouse, K., Hourcade, D., Zhang, L. (2008). The Quantification of Glycosaminoglycans: A
Comparison of HPLC, Carbazole, and Alcian Blue Methods. Open Glycoscience, (1), 31-39.

REFERENCES
014
Gatta, A., Schiraldi, C., Papa, A., D’Agostino, A., Cammarota, M., Rosa, A., Rosa, M. (2013).
Hyaluronan scaffolds via diglycidyl ether cross-linking: Toward improvements in composition and
performance. Carbohydrate Polymers, 96, 536– 544.
Gatta, A., Schiraldi, C., Papa, A., Rosa, M. (2011 ). Comparative analysis of commercial dermal fillers
based on cross-linked hyaluronan: Physical characterization and in vitro enzymatic degradation. Polymer
Degradation and Stability, 96, 630-636.
Geckil, H., Xu, F., Zhang, X., Moon, S. Demirci, U. (2010). Engineering hydrogels as extracellular matrix
mimics. Nanomedicine, 5 (3), 469-484.
Grimshaw, J., Kane, A., Trocha-Grimshaw, J., Douglas, A., Chakravarthy, U., Archer, D. (1994).
Quantitative analysis of hyaluronan in vitreous humor using capillary electrophoresis. Electrophoresis,
(15), 936–940.
Guarise, C., Pavan, M., Pirrone, L., Renier, D. (2012). SEC determination of cross-link efficiency in
hyaluronan fillers. Carbohydrate Polymers, 88, 428-434.
Gulrez, S., Al-Assaf, S., Phillips, G. (2011). Hydrogels: Methods of Preparation, Characterisation and
Applications, Progress in Molecular and Environmental Bioengineering - From Analysis and Modeling to
Technology Applications, Prof. Angelo Carpi (Ed.), ISBN: 978-953-307-268-5.
Hennink, W.E., van Nostrum, C.F. (2012). Novel crosslinking methods to design hydrogels. Advanced
Drug Delivery Reviews, 64, 223-236.
Hoffman, A.S. (2002). Hydrogels for biomedical applications. Advanced Drug Delivery Reviews, 43,3-12.
Holzer, M.P., Tetz, M.R., Auffarth, G.U., Welt, R., & Vo¨ lcker, H. (2001). Effect of healon 5 and 4 other
viscoelastic substances on intraocular pressure and endothelium after cataract surgery. Journal of Cataract
and Refractive Surgery, 27, 213–8.
Huang-Lee, L.L.H., Nimmi, M. (1994). Crosslinked CNB-activated hyaluronan-collagen matrices: effects
on fibroblast contraction. Matrix Biology, 14,147–57.
Huin-Amargier, C., Marchal, P., Payan, E., Netter, P., Dellacherie, E. (2006). New physically and
chemically crosslinked hyaluronate (HA)-based hydrogels for cartilage repair. Journal of Biomedical
Materials Research Part A, 76(2), 416–424.
Hwang, H. D., Cho, H. J., Balakrishnan, P., Chung, C. W., Kang, J. Y., Yoon, I. S., et al. (2012). Cross-
linked hyaluronic acid-based flexible cell delivery system: Application for chondrogenic differentiation.
Colloids and Surfaces B: Biointerfaces, 91, 106–113.
Iannitti, T., Bingol, A., Rottigni, V., Palmieri, B. (2013). Biocompatibility and rheological properties of a
new highly viscoelastic hyaluronic acid in a rat model for biomaterial implants and first – in – man clinical
investigation in esthetic and restorative medicine. International Journal of Pharmaceutics, in press.
REFERENCES
015
Iannitti, T., Bingölc, Ö. A., Rottignib, V., Palmierib, B. (2013). A new highly viscoelastic hyaluronic acid
gel: rheological properties, biocompatibility and clinical investigation in esthetic and restorative surgery.
International Journal of Pharmaceutics, 456, 583-592.
Ibrahim, S., Kang, Q. K., Ramamurthi, A. (2010). The impact of hyaluronic acid oligomer content on
physical, mechanical, and biological properties of divinyl sulfone-crosslinked hyaluronic acid hydrogels.
Journal of Biomedical Materials Research, 94A, 355–370.
Jafari, B., Rafie, F., Davaran, S. (2011). Preparation and Characterization of a Novel Smart Polymeric
Hydrogel for drug delivery of insulin. BioImpacts, 1(2), 135-143.
Jannson, P., Kenne, L., Lindberg, B. (1975). Structure of extracellular polysaccharide from Xanthomonas
campestris. Carbohydrate Research, 45, 275–282.
Jeon, O., Song, S., Lee, K., Park, M., Lee, S., Hahn, S., Kim, S., Kim, B. (2007). Mechanical properties
and degradation behaviors of hyaluronic acid hydrogels cross-linked at various cross-linking densities.
Carbohydrate Polymers, 70, 251–257.
Johl, S.S., Burgett, R.A. (2006). Dermal filler agents: a practical review. Current Opinion in
Opthalmology,17, 471-9.
John, H.E., Price, R.D., 2009. Perspectives in the selection of hyaluronic acid fillers for facial wrinkles and
aging skin. Patient Preference and Adherence, 3, 225–230.
Kablik, J., Monheit, G., Yu, L., P.H.D., Chang, G., Gershkovich, J. (2009). Comparative physical
properties of hyaluronic acid dermal fillers. Dermatology Surgery, 35, 302-312.
Kandasamy, R., Shaikh, S., Khalil, P., Muneera, M.S. & Thusleem, O.A. (2013). Determination of sodium
hyaluronate in pharmaceutical formulations byHPLC–UV. Journal of Pharmaceutical Analysis, 3(5), 324–
329.
Kang, J. Y., Chung, C. W., Sung, J. H., Park, B. S., Choi, J. Y., Lee, S. J., et al. (2009). Novel porous
matrix of hyaluronic acid for the three-dimensional culture of chondrocytes. International Journal of
Pharmaceutics, 369, 114–120.
Kaufmann, J., Mohle, K., Hofmann, H., Arnold, K. (1998). Molecular dynamics study of hyaluronic acid
in water. Journal of molecular structure (Theochem), 422, 109-121.
Kenne, L., Gohil, S., Nilsson, E., Karlsson, A., Ericsson, D., Kenne, A., Nord, L. (2013). Modification and
cross-linking parameters in hyaluronic acid hydrogels- Definitions and analytical methods. Carbohydrate
Polymers, 91, 410– 418.
Kim, J. K., Lee, J. S., Jung, H. J., Cho, J. H., Heo, J. I., Chang, Y. H. (2007). Preparation and properties of
collagen/modified hyaluronic acid hydrogel for biomedical application. Journal of Nanoscience and
Nanotechnology, 7,3852–3856.
REFERENCES
016
Kim, I.L., Mauck, R.L., Burdick, J.A. (2011). Hydrogel design for cartilage tissue engineering: a case
study with hyaluronic acid. Biomaterials, 32, 8771–82.
Kupiec, T. (2004). Quality-Control Analytical Methods: High Performance Liquid Chromatography.
International Journal of Pharmaceutical Compounding, 8-3, 223-227.
Lai, J. (2014). Relationship between structure and cytocompatibility of divinyl Sulfone cross-linked
hyaluronic acid. Carbohydrate Polymers, 101, 203-212.
Lai, J. (2012). Solvent Composition is Critical for Carbodiimide Cross-Linking of Hyaluronic Acid as an
Ophthalmic Biomaterial. Materials, 5, 1986-2002.
Leach, J., Bivens, K., Patrick, C., Jr., Schmidt, C. (2003). Photocrosslinked hyaluronic acid hydrogels:
Natural, biodegradable tissue engineering scaffolds. Biotechnology and Bioengineering, 82(5), 578–589.
Lee, F., Chung, J.E., Kurisawa, M, (2009). An injectable hyaluronic acid-tyramine hydrogel system for
protein delivery. Journal of Control Release, 134 (3), 186-193.
Lepperdinger, G., Fehrer, C., Reitinger, S. (2004). Biodegradation of hyaluronan. InH. G. Garg, & C. A.
Hales (Eds.), Chemistry and biology of hyaluronan (pp. 71–82).Oxford: Elsevier Ltd.
Limberg, M.B., McCaa, C., Kissling, G.E., Kaufman, H.E. (1987). Topical application of hyaluronic acid
and chondroitin sulfate in the treatment of dry eyes. American Journal of Ophthalmology,103,194–7.
Linhardt, R.J., Liu, J., Han, X.J. (1993). Mapping and sequencing of oligosaccharides by electrophoresis.
Trends in Glycoscience and Glycotechnology, (5), 181–192.
Linhardt, R.J., Pervin, A. (1996). Separation of acidic carbohydrates by capillary electrophoresis. Journal
of Chromatography,(720), 323–335.
Liu, L., Liu, D., Wang, M., Du, G., Chen, J. (2007). Preparation and characterization of sponge-like
composites by cross-linking hyaluronic acid and carboxymethy lcellulose sodium with adipicdi hydrazide.
European Polymer Journal, 43, 2672–2681.
Loewe, N.J., Maxwell, A., Loewe, P., Duick, M.G., Shan, K. (2001). Hyaluronic acid skin fillers: adverse
reactions and skin testing. Journal of the American Academy of Dermatology, 45, 930-3.
Luo Y, Kirker KR, Prestwich GD (2000) Cross-linked hyaluronic acid hydrogel films: new biomaterials
for drug delivery. Journal of Control Release 69 : 169–84.
Malson, T., Lindqvist, B. (1986). Gels of crosslinked hyaluronic acid for use as a vitreous humor
substitute.WO1986000079.
Manna, F., Dentini, M., Desideri, P., De Pita, O., Mortilla, E., Maras, B. (1999). Comparative chemical
evaluation of two commercially available derivatives of hyaluronic acid (Hylaform from rooster combs and
Restylane from streptococcus) used for soft tissue augmentation. Journal of the European Academy of
Dermatology and Venereology, 13, 183-192.

REFERENCES
017
Mao, W., Thanawiroon, C., Linhardt, R. (2002). Capillary electrophoresis for the analysis of
glycosaminoglycans and glycosaminoglycan- derived oligosaccharides. Biomedical Chromatography, (16)
77-94.
Masters KS, Shah DN, Leinwand LA, Anseth KS (2005) Crosslinked hyaluronan scaffolds as a
biologically active carrier for valvular interstitial cells. Biomaterials 26: 2517–25.
Medscape Dermatology. (2008). Dermal Fillers: Focus on Hyaluronic Acid.
www.medscape.org/viewarticle
Medvedovici, A., Farca, A., David, V. (2009). Derivatization reactions in liquid chromatography for drug
assaying in biological fluids. Advances in chromatography,47, 283–314.
Mellergaard, M., Larsen, M., Malle, B. (2011). Rheological properties of cross-linked hyaluronic acid for
dermal fillers. Annual Transaction of The Nordic Rheology Society, 19.
Micheels, P. (2001). Human anti-hyaluronic acid antibodies. Is it possible?. Dermatologic Surgery, 27,185-
91.
Nakagawa, Y., Nakasako, S., Ohta, S., Ito, T. (2015). A biocompatible calcium salt of hyaluronic acid
grafted with polyacrylic acid. Carbohydrate Polymers, 117, 43-53.
Narins, R.S., Bowman, P.H. (2005). Injectable skin fillers. Clin Plast Surg, 32, 151-162.
Necas, J., Bartosikova, L, Brauner, P., Kolar, J. (2008). Hyaluronic acid (hyaluronan): a review. Journal of
Veterinary Medicine, 53, 397–411
Nimni, M.E., Cheung, D., Strates, B., Kodama, M., & Sheikh, K. (1987). Chemically modified collagen: a
natural biomaterial for tissue replacement. Journal of Biomedical Materials Research, 21,741–71.
Palumbo, F. S., Pitarresi, G., Mandracchia, D., Tripodo, G., Giammona, G. (2006). Carbohydrate
Polymers, 66, 379–385. Pouyani, T., Harbison, G. S., & Prestwich, G. D. (1994). Journal of the American
Chemical Society, 116(17), 7515–7522.
Park, H., Guo, X., Temenoff, J., Tabata, Y., Caplan, A., Kasper, F., Mikos, A. (2009). Effect of swelling
ratio of injectable hydrogel composites on chondrogenic differentiation of encapsulated rabbit marrow
mesenchymal stem cells in vitro. Biomacromolecules, 10(3), 541-546.
Pastorini, E., Rotini, R., Guardigli, M., Vecchiotti, S., Persiani, S., Trisolino, G., Antonioli, D., Rovati,
L.C., Roda, A. (2009). Development and validation of a HPLC–ES-MS/MS method for the determination
of glucosamine in human synovial fluid. Journal of Pharmaceutical and Biomedical Analysis, 50, 1009–
1014.
Pelletier, S., Hubert, P., Lapicque, F., Payan, E., Dellacherie, E. (2000). Amphiphili derivatives of sodium
alginate and hyaluronate: Synthesis and physico-chemical properties of aqueous dilute solutions.
Carbohydrate Polymers, 43(4), 343–349.

REFERENCES
018
Piron, E., Tholin, R., 2002. WO2002006350.
Pitarresi, G., Palumbo, F.S., Tripodo, G. Cavallaro, G., & Giammona, G. (2007). Preparation and
characterization of new hydrogels based on hyaluronic acid and α, β–polyaspartylhydrazide. European
Polymer Journal, 43, 3953-3962.
Prata, J., Barth, T., Bencherif, S., Washburn, N. (2010). Complex fluids based on methacrylated
hyaluronic acid. Biomacromolecules, 11(3), 769–775.
Prestwich, G., Marecak, D., Marecek, J., Vercruysse, K., Ziebell, M., (1998). Controlled chemical
modification of hyaluronic acid: synthesis, applications, and biodegradation of hydrazide derivatives.
Journal of Controlled Release, 53, 93–103.
Raghu, S., Athre, MD. (2007). Facial filler agents. Operative Techniques in Otolaryngology, 18, 243-247.
Reddy, K., Karunakaran, K. (2013). Purification and charactriation of hyaluronic acid produced by
Streptococcus zooepidemicus strain 35237. Journal of BioScience and Biotechnology, 2(3), 173-179.
Reissig, J.L., Strominger, J.L., Leloir, L.F. (1995). A modified colorimetric method for the estimation of
N-acetylamino sugars. Journal of Biological Chemistry, 217, 959-996.
Rhodes, J.M., Simons, M. (2007). The extracellular matrix and blood vessel formation; not just a scaffold.
Journal of Cellular and Molecular Medicine, 11,176-205.
Robinson, D., Aasi, S.(2011).Cosmetic concerns and management strategies to combat aging. Maturitas,
70, 256-260.
Rosiak, J. M. & Yoshii, F. (1999) Hydrogels and their medical applications. Nuclear Instruments and
Methods in Physics Research B 151, 56-64.
Romagnoli, M., Belmontesi, M. (2008). Hyaluronic acid-based fillers: theory and practice. Clinics in
Dermatology, 26, 123-159.
Ruckmani, K., Shaikh, S., Khalil, P., Muneera, M., Thusleem, O.A. (2013). Determination of sodium
hyaluronate in pharmaceutical formulation by HPLC-UV. Journal of Pharmaceutical Analysis, 3 (5), 324-
329.
Sadick, N., Karcher, C., Palmisano, L. (2009). Cosmetic dermatology of the aging face. Clinics in
Dermatology, 27, S3-S12.
Sánchez-Carpintero. Candelas, D., Ruiz-Rodríguez, R. (2010). Dermal Fillers: Types, Indications, and
Complications. Actas Dermo-Sifiliográficas, 101(5), 381–393.
REFERENCES
019
Satish, C.S., Satish, K.P., Shivakumar, H.G. (2006). Hydrogels as controlled drug delivery system:
synthesis, crosslinking, water and drug transport mechanism. Indian Journal of Pharmaceutical Sciences, 68
(2), 133-140.
Schanté, C., Zuber, G., Herlin, C., Vandamme, T. (2012). Improvement of hyaluronic acid enzymatic
stability by the grafting ofamino-acids. Carbohydrate Polymer, 87, 2211-2216.
Schante, C., Zuber, G., Herlin, C., Vandamme, T. (2011). Chemical modification of hyaluronic acid for the
syenthesis of derivatives for a broad range of biomedical application. Carbohydrate polymers, 85, 469-489.
Schanté, C., Zuber, G., Herlin, C.,Vandamme, T. (2011). Synthesis of N-alanyl-hyaluronamide with high
degree of substitution for enhanced resistance to hyaluronidase-mediated digestion. Carbohydrate
Polymers, 86, 747-752.
Scott, J.E. (1995). Extracellular matrix, supramolecular organization and shape. Journal of Anatomy,187,
259-69.
Scott, J.E. (1989). Secondary structures in hyaluronan solutions: chemical and biological implications.
Ciba Foundation J, 143, 6–20.
Segura, T., Anderson, B. C., Chung, P. H., Webber, R. E., Shull, K. R., Shea, L. D. (2005). Crosslinked
hyaluronic acid hydrogels: A strategy to functionalize and pattern. Biomaterials, 26, 359–371.
Serban, M., Yang, G., Prestwich, G. (2008). Synthesis, characterization and chondroprotective properties
of a hyaluronan thioethyl ether derivative. Biomaterials, 29, 1388-1399.
Sherman, L. (May2004). Rheometers : Which type is right for you?. Plastic Technology.
www.ptonline.com/articles/rheometers-which-type-is-right-for-you
Šimkovic, I., Hricov ni, M., Šolt s, ., Mendichi, R., Cosentino, C. (2000). Preparation of water-
soluble/insoluble derivatives of hyaluronic acid by cross-linking with epichlorohydrin in aqueous
NaOH/NH4OH solution. Carbohydrate Polymers, 41, 9–14.
Sung, H.W., Huang, R.N., Huang, L.L.H., Tsai, C.C., Chiu, C.T. (1998). Feasibility study of a natural
crosslinking reagent for biological tissue fixation. Journal of Biomedical Materials Research, (42), 560–7.
Tan, H., Chu, C., Payane., K., Marra., K. (2009). Injectable in situ forming biodegradable chitosan-
hyaluronic acid based hydrogels for cartilage tissue engineering. Biomaterials, 2499-2506.
Vejlens, L. (1971). Glycosaminoglycans of human bone tissue. Calcified Tissue International, 7, 175–90.
Verpaele, A., & Strand, A. (2006). Restylane Sub Q, a non-animal stabilized hyaluronic acid gel for soft
tissue augmentation of the mid- and lower face. Aesthetic Surgery, 26,10-17.
Water, J., Schack, M., Velazquez-Campoy, A., Maltesen, M., Van de Weert, M,. Jorgensen, L. (2014).
Complex coacervates of hyaluronic acid and lysozyme: Effect on protein structure and physical stability.
European Journal of Pharmaceutics and Biopharmaceutics, 88, 325-331.
REFERENCES
001
Weng, L., Gouldstone, A., Wu, Y., Chen, W. (2008). Mechanically strong double network
photocrosslinked hydrogels from N,N-dimethylacrylamide and glycidyl methacrylated hyaluronan.
Biomaterials, 29(14), 2153–2163.
Wollina, U., Goldman., A. (2013). Dermal fillers: Facts and controversies. Clinics in Dermatology, 31,
731-736.
Wong, R., Ashton, M., Dodou, K. (2015). Effect of crosslinking agent concentration on the properties of
unmedicated hydrogels. Pharmaceutics, 7, 305-319.
Xu, S., Li, J., He, A., Liu, W., Jiang, X., Zheng, J., Han, C., Hsiao, B., Chu, B., Fang, D. (2009). Chemical
cross-linking and biophysical properties of electrospun hyaluronic acid based ultra-thin fibrous membranes.
Polymer, 50, 3762-3769.
Yamanlar, S., Sant, S., Boudou, T., Picart, C., Khademhosseini, A. (2011). Surface functionalization of
hyaluronic acid hydrogels by polyelectrolyte multilayer films. Biomaterials, 32, 5590–9.
Yokoi, N., Komuro, A., Nishida, K., Kinoshita, S. (1997). Effectiveness of hyaluronan on corneal epithelial
barrier function in dry eye. British Journal of Ophthalmology, 81, 533–6.
Yoon, I. S., Chung, C. W., Sung, J. H., Cho, H. J., Kim, J. S., Shim, W. S., et al. (2011). Proliferation and
chondrogenic differentiation of human adipose-derived mesenchymal stem cells in porous hyaluronic acid
scaffold. Journal of Bioscience and Bioengineering, 112(4), 402–408.
Zarzycki, R., Modrzejewska, Z., Nawrotek, K. (2010). Drug release from hydrogel matrices. Ecological
chemistry and engineering, 17 (2), 117-136.
Zawko, S., Suri, S., Truong, Q., Schmidt, C. (2009). Photopatterned anisotropic swelling of dual-
crosslinked hyaluronic acid hydrogels. Acta. Biomaterialia, 5, 14–22.
Zhao, X. (2000). Process for the production of multiple cross-linked hyaluronic acid derivatives.
WO/2000/046253.
Zhong, S.P., Campoccia, D., Doherty, P.J., Williams, R.L., Benedetti, L., Williams, D.F. (1994).
Biodegradation of hyaluronic acid derivatives by hyaluronidase. Biomaterials, 15, 359- 365.
Zhu, J., Marchant, R. (2011). Design properties of hydrogel tissue-engineering scaffolds. Expert Review
of Medical Devices, 8(5), 607-626.
Zhu, J. (2010). Bioactive modification of poly(ethylene glycol) hydrogels for tissue engineering.
Biomaterials, 31, 4639-4.

APPENDICES
000
APPENDICES
Appendix 1: Introduction to the analytical instruments
employed for the characterization of HA hydrogels
1.1 Fourier transform infrared (FTIR)
FTIR spectroscopy is a powerful method for identification of functional groups of
molecules by evaluating the transition between vibrational states of bonds within the
molecule (Reddy & Karunakaran, 2013). When sample is introduced into the FTIR
spectrometer, some radiation is absorbed by the sample and some of it is passed through,
the resulting spectrum represents a molecular fingerprint of the sample. Therefore, it is
mainly used to confirm the occurrence of cross-linking bonds rather than quantitative
analysis. With FTIR measurements, HA sample does not require a tedious preparation
method and the spectra may be recorded between 4000-400 cm-1
(2.5-25 µm). A typical
FTIR spectrum of HA solution shows three main peaks corresponding to the presence of
C-H stretching, O-H stretching and C-O-C stretching. All these peaks present a
characteristic spectrum and could differentiate the native HA and cross-linked HA
hydrogel (Pitarresi et al., 2007).
1.2 Nuclear magnetic resonance spectroscopy (NMR)
NMR spectrometry is a common method used to confirm the presence of
crosslinking and to determine the total change of chemical modification occurred within
HA polymer. The pretreatment of samples is essential, because dissolution of cross-
linked HA hydrogels in NMR solvents becomes challenge. The NMR spectrum of native
HA dissolved in D2O shows broad signals due to the high viscosity of HA solution
(Schante, Zuber, Herlin, & Vandamme, 2011).

APPENDICES
002
Dissolution of cross-linked hydrogels has also been reported in DMSO-d6/D2O
mixture ( Palumbo et al., 2006 ; Guarise, Pavan, Pirrone & Renier, 2012). (Appendix 1.2
A) shows a typical 1H NMR spectra comparing native HA and cross-linked BDDE-HA
hydrogel carried out by (Guarise, Pavan, Pirrone & Renier, 2012). In the cross-linked
HA, a signal appearing at 1.8 ppm attributed to N-CH3 of HA and also a peak at
approximately 1.5 ppm which represents the – (CH2)2 of BDDE. However, in the native
HA, there is no peak appearing at 1.5 ppm, these data confirmed that the HA hydrogel
had been modified with BDDE molecules.
Appendix 1.2 A NMR spectra of native HA (lower) and BDD-HA (higher) (Guarise, Pavan, Pirrone &
Renier, (2012)
1.3 Capillary electrophoreses (CE)
Capillary electrophoreses (CE) is a high resolution analytical technique that has
been widely used for the analysis of disaccharide compositional molecules particularly
glycosaminoglycans (GAGs) in the biological samples (Linhardt , Liu & Han, 1993). CE
has a different mechanism of analysis and it is used to separate ions according to their
electrophoretic mobility under the influence of an applied voltage across a field that the
ions exist. The ions of opposite charge to electrodes on either end of the voltage migrate
toward that electrode in a narrow capillary tube which is made of fused silica and
provides a flat flow due to electroosmotic flow. At a high voltage, ions that are positively
charged migrate toward the negatively charged electrode (the cathode) and the negative
ions migrate to the positively charged electrode (the anode).

APPENDICES
003
The rate of migration of each single ion is based on its quantity of charge
compared to its relative hydrodynamic size. Electrophoretic mobility is the term used to
describe ions affinity for its opposite electrode. The rate of migration is directly
proportional to the applied voltage. If the sample contains neutral and ionic analytes, the
electroosmotic flow drives all species from the injector to the detector through the
capillary eluting first the positive species followed by the neutral and later the negative
(Linhardt & Pervin, 1996). On the other hand, if two ions have same size, the one with
greater charge moves faster and for ions with the same charge, the smaller size migrates
first due to its less friction. A typical capillary electrophoresis system consists of a
voltage power supply , a capillary tube, a sample introduction system and a detector. Two
different analysis mode are applied for the analysis of GAGs which are normal polarity
mode and reversed polarity mode. The normal polarity mode as shown in (appendix. 1.3
A) is the most common analysis mode by which the sample is injected at the anode and
detected at the cathode.
Appendix 1.3 A Diagram showing capillary electrophorises separation mechanism of neutral and charged
species by normal polarity mode (Wenjun, Thanawiroon & Linhardt, 2002)
Hyaluronic acid can be identified and detected by CE following various reported
methods. The one which is well-established, is that when hyaluronic acid is analyzed in
normal polarity mode and detected by direct UV detection at wavelength 185-214 nm.
The HA oligomers migrate at a buffer of phosphate borate, pH 9.0 containing sodium
dodecyl sulfate. Identification and separation of hyaluronic acid from synovial fluid and
vitreous humor can be analyzed by this method.

APPENDICES
004
The migration of HA, however, is affected by the interaction with proteins, but
adding sodium dodecyl sulfate may decrease such interaction (Grimshaw et al., 1994).
Despite the ability of CE for oligosaccharides separation, a well-designed and efficient
method for quantification of cross-linked BDDE-HA fragments by the CE has not yet
been established. So, we used it as a confirmation tool for the occurrence of cross-linking
reaction in the cross-linked BDDE-HA hydrogels when compared with native HA.
1.4 High performance liquid chromatography (HPLC)
HPLC is a separation technique used to separate mixtures into their components
based on their molecular structures. HPLC is better than normal column chromatography
for oligosaccharides separation, because the solvent is allowed to drip through the
column under a high pressure force than under gravity. So, it is widely employed for the
evaluation of in-vitro degradation rate of HA hydrogels and also to confirm the
occurrence of cross-linking process. HPLC involves a stationary phase (commonly
column filled with non-polar silica) and a mobile phase (polar solvent) carrying the
components of the mixture. A stronger interaction is displayed between the solvent and
the polar components, thus they will travel through the column more quickly than less
polarity-components (Kupiec, 2004). Different chromatographic methods have been
developed for quantification of HA content in pharmaceutical formulations or to separate
HA oligosaccharides following a digestion procedure. Determination of HA
oligosaccharides by HPLC is a challenge and is largely influenced by method conditions
(e.g. mobile phase, pH and the concentration of buffer) which affect sensitivity, linearity,
accuracy and retention time. Therefore, for the development of a robust HPLC method,
different compositions of the mobile phase have to be tested to reduce the overlapping
and to obtain best signal response for HA fragments. Some HPLC methods were
established with post-chromatographic derivatization reactions. However, the HA
products obtained with this process are not stable and have a short half-life due to the
possible spontaneous intermolecular rearrangement (Medvedovici, Farca, & David,
2009). A novel chromatographic method with no pre-analytical derivatization step for
HA analysis was developed by (Pastorini et al., 2009).

APPENDICES
005
The method was set for the determination of glucosamine in human synovial by
HPLC coupled with electro-spray tandem mass spectrometry. The analyte was separated
using 10 mM acetic acid in water with ammonia and acetonitrile under isocratic elution at
0.3 ml/min flow rate. On the other hand, the analysis of HA components by HPLC
coupled with UV detector has also become a challenge. This problem, fortunately, was
overcome by developing a size- exclusion liquid chromatography (SEC) with UV
detection using variable wavelength set at 205 nm (Ruckmani et al., 2013). The method
was performed on an isocratic mode with a mobile phase consisting of buffer 0.05 M
potassium dihydrogen phosphate and the pH was adjusted at 7.0. In our study, we applied
HPLC for the quantification of N-acetyl glucosamine (NAG) remaining in the cross-
linked BDDE-HA hydrogel after a specific treatment with the enzyme ― hyaluronidase ―.
High (NAG) content in the tested extract indicated faster degradation rate and lower
cross-linking efficiency.
1.5 The scanning electron microscope (SEM)
The scanning electron microscope (SEM) is a microscope that uses electrons to
create a magnified image for advanced characterization of polymers. The electrons are
generated at the top of microscope and then directed down the column toward the sample.
Secondary electrons are then emitted that contain information about sample surface
composition. In this study, we used the SEM to characterize the morphology (form and
structure) of native HA and cross-linked BDDE-HA hydrogels (Esposito et al., 2005).
The cross-linked hydrogels display different porous structure and cohesively as a result of
the degree of cross-linking. The SEM images of native HA show some collapse within
their substrate structures and wider pores-size comparing to the cross-linked hydrogels
synthesized at high degrees of cross-linking (Gatta et al., 2013).
1.6 Rheometer
Rheometer is a mechanical spectrometer used to measure deformation and flow of
materials under applied force. The Measurement includes various physical properties
such as: viscosity, shear stress, storage modulus (G') and loss modulus (G'').

APPENDICES
006
The storage modulus measures the stored energy representing the elastic portion
in viscoelastic materials, whereas the loss modulus measures the energy dissipated as
heat representing the viscous portion in viscoelastic materials. Rheometer provides also
an effective indication about critical gel point, the point when the material changes from
a viscoelastic liquid to a viscoelastic solid during cross-linking reaction. The rheometers
are of two types: rotational that work with controlled stress or strain and extensional that
work with extensional stress or strain. Most measurements of HA cross-linked hydrogels
are performed on a rotational rheometer using a parallel geometry at controlled
temperature of 25 oC. The rotational rheometer operates in continuous rotation and
oscillations mode. It consists of a motor, optical encoder and torque-sensing mechanism.
There are three types of stress attachments: cone and plate, plate and plate, or concentric
cylinder (Sherman, 2004). The viscosity of HA solution varies with the shear rate , so it is
classified as a share rate – dependent material (Bingol & Dogan, 2012). Rheology has
become a differentiating factor for cross-linked hydrogels, because it reflects the
viscoelastic property. The native HA solution shows a different behavior than cross-
linked HA when subjected to a frequency sweep test; the native HA behaves viscous at
the lower frequency range , while at the higher range, it behaves elastic. However, the
moduli of cross-linked hydrogels do not vary significantly with the frequency and show
almost similar viscoelastic properties over the testing range (Mellergaard, Larsen &
Malle, 2011).
This phenomenon is referred to the Maxwell-type behavior and single relaxation
time, the storage G' and loss G'' modulus in cross-linked hydrogels are independent of
oscillation frequency (Omari et al., 2006 ; Gulrez, Al-Assaf & Phillips, 2011).
Determinations of storage and loss moduli are usually carried out by Small Amplitude
Oscillatory Strain (SAOS) measurements over a frequency range of (0.01-100 s -1) at a
constant strain (appendix 1.6 A). However, a strain sweep test should initially be
performed at a constant frequency over a strain amplitude ranged from 0.01-100% in
order to determine the linear viscoelastic region (LVR) (Borrell, Leslie & Tezel, 2011).
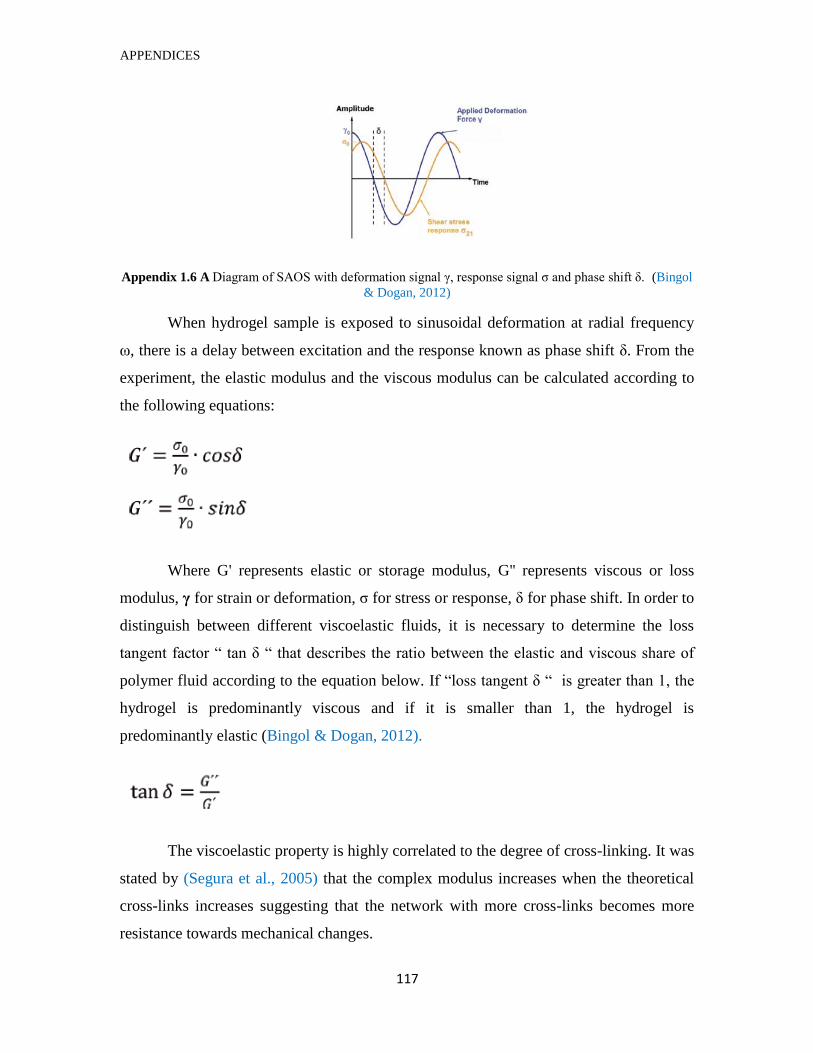
APPENDICES
007
Appendix 1.6 A Diagram of SAOS with deformation signal γ, response signal σ and phase shift δ. (Bingol
& Dogan, 2012)
When hydrogel sample is exposed to sinusoidal deformation at radial frequency
ω, there is a delay between excitation and the response known as phase shift δ. From the
experiment, the elastic modulus and the viscous modulus can be calculated according to
the following equations:
Where G' represents elastic or storage modulus, G'' represents viscous or loss
modulus, γ for strain or deformation, σ for stress or response, δ for phase shift. In order to
distinguish between different viscoelastic fluids, it is necessary to determine the loss
tangent factor ― tan δ ― that describes the ratio between the elastic and viscous share of
polymer fluid according to the equation below. If ―loss tangent δ ― is greater than 1, the
hydrogel is predominantly viscous and if it is smaller than 1, the hydrogel is
predominantly elastic (Bingol & Dogan, 2012).
The viscoelastic property is highly correlated to the degree of cross-linking. It was
stated by (Segura et al., 2005) that the complex modulus increases when the theoretical
cross-links increases suggesting that the network with more cross-links becomes more
resistance towards mechanical changes.

APPENDICES
008
Appendix 2: ESI-Mass spectrometry analysis
2.1 The MS spectrum of disaccharide unit of HA
Appendix 2. 1 A ESI-MS spectra of native HA showing the base peak of the disaccharide unit at m/z 378
with a singly charged negative ion [M-H]-

APPENDICES
009
Appendix 2. 1 B ESI-MS spectra of native HA showing the peaks of the glucoronic acid (GlcA) at m/z
192.8 and N-acetyl-D-glucosamine (GlcNAc – H2O) at m/z 201.89
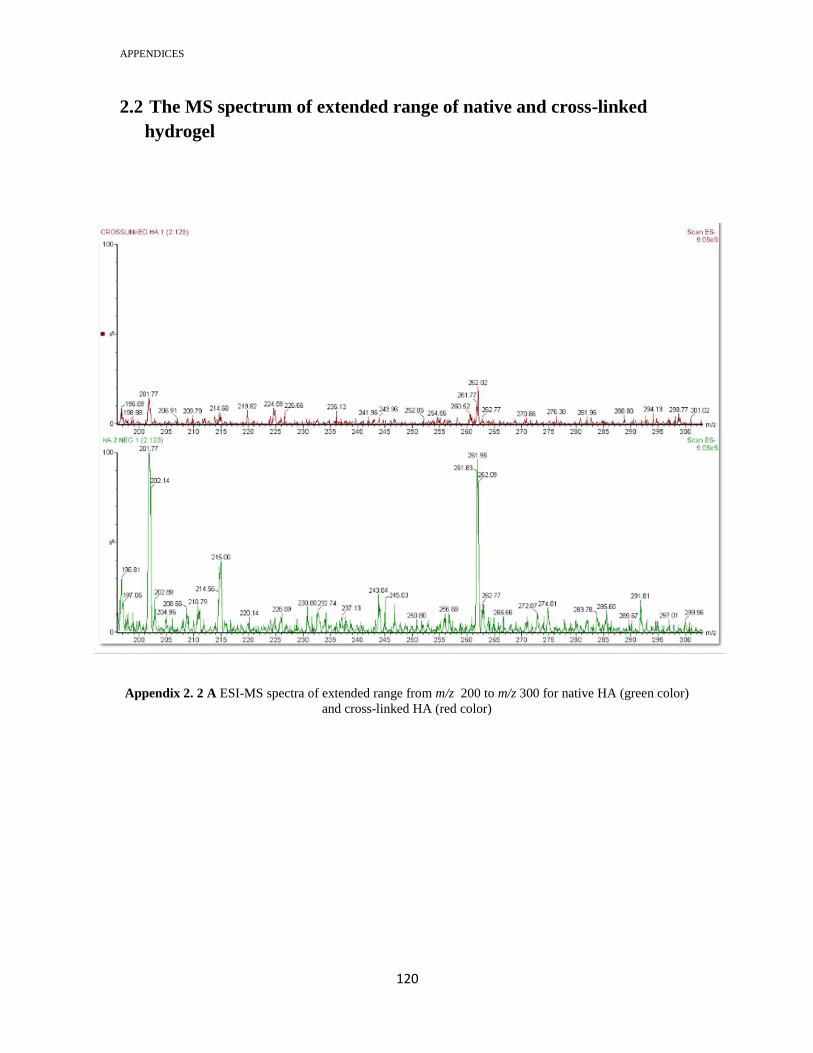
APPENDICES
021
2.2 The MS spectrum of extended range of native and cross-linked
hydrogel
Appendix 2. 2 A ESI-MS spectra of extended range from m/z 200 to m/z 300 for native HA (green color)
and cross-linked HA (red color)
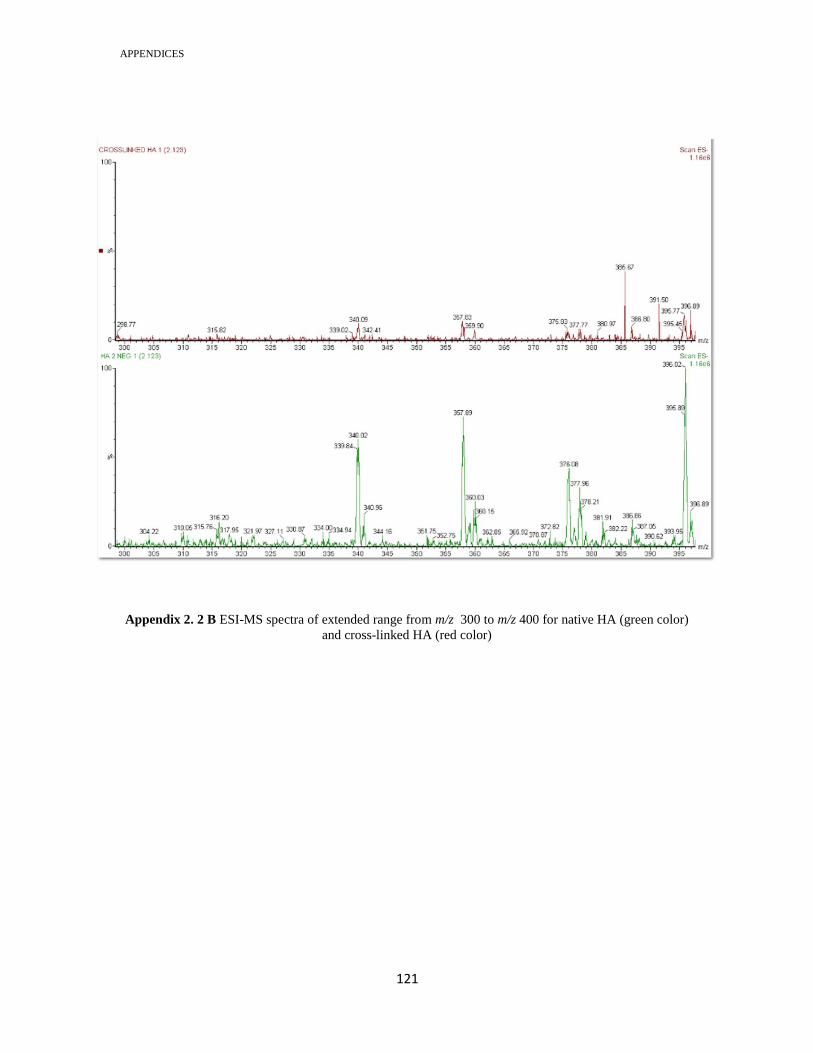
APPENDICES
020
Appendix 2. 2 B ESI-MS spectra of extended range from m/z 300 to m/z 400 for native HA (green color)
and cross-linked HA (red color)

APPENDICES
022
Appendix 2. 2 C ESI-MS spectra of extended range from m/z 400 to m/z 500 for native HA (green color)
and cross-linked HA (red color)

APPENDICES
023
Appendix 2. 2 D ESI-MS spectra of extended range from m/z 500 to m/z 600 for native HA (green color)
and cross-linked HA (red color)

APPENDICES
024
Appendix 2. 2 E ESI-MS spectra of extended range from m/z 600 to m/z 700 for native HA (green color)
and cross-linked HA (red color)

APPENDICES
025
Appendix 2. 2 F ESI-MS spectra of extended range from m/z 700 to m/z 800 for native HA (green color)
and cross-linked HA (red color)

APPENDICES
026
Appendix 2. 2 G ESI-MS spectra of extended range from m/z 800 to m/z 900 for native HA (green color)
and cross-linked HA (red color)
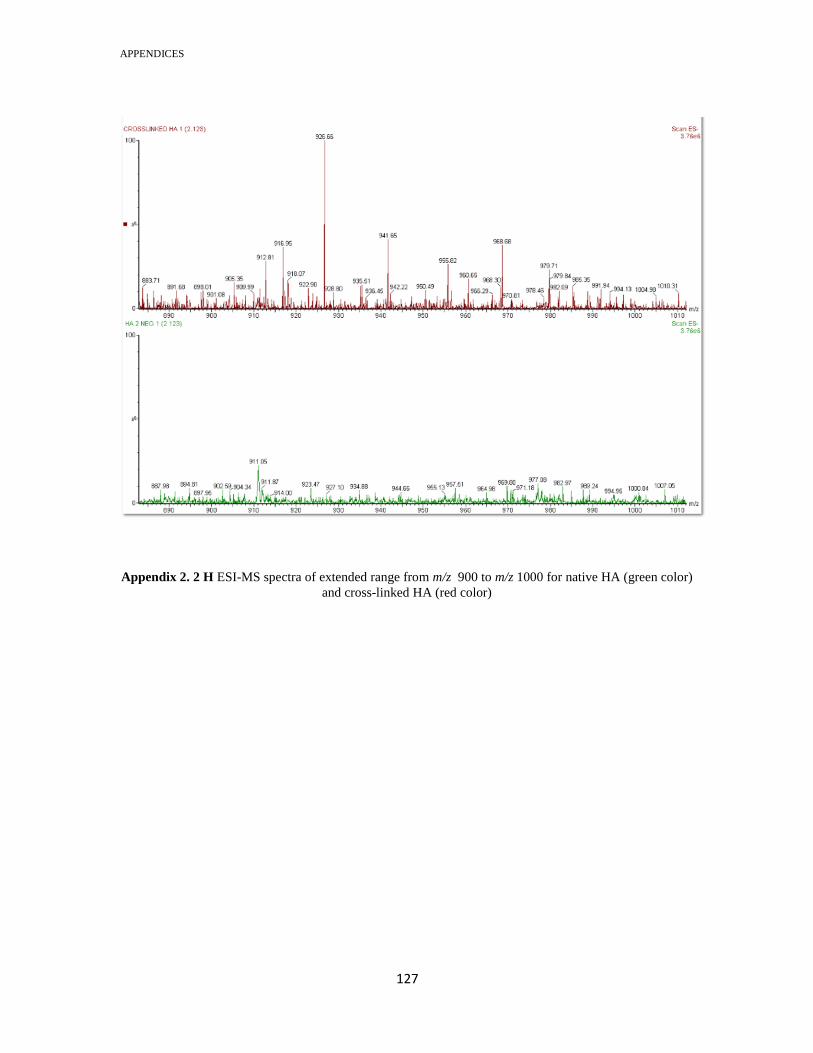
APPENDICES
027
Appendix 2. 2 H ESI-MS spectra of extended range from m/z 900 to m/z 1000 for native HA (green color)
and cross-linked HA (red color)

APPENDICES
028
Appendix 2. 2 I ESI-MS spectra of extended range from m/z 1000 to m/z 1100 for native HA (green color)
and cross-linked HA (red color)

APPENDICES
029
Appendix 2. 2 J ESI-MS spectra of extended range from m/z 1100 to m/z 1200 for native HA (green color)
and cross-linked HA (red color)

APPENDICES
031
Appendix 2. 2 K ESI-MS spectra of extended range from m/z 1200 to m/z 1300 for native HA (green
color) and cross-linked HA (red color)

APPENDICES
030
Appendix 2. 2 L ESI-MS spectra of extended range from m/z 1300 to m/z 1400 for native HA (green
color) and cross-linked HA (red color)

APPENDICES
032
Appendix 2. 2 M ESI-MS spectra of extended range from m/z 1400 to m/z 1500 for native HA (green
color) and cross-linked HA (red color)

APPENDICES
033
Appendix 2. 2 N ESI-MS spectra of extended range from m/z 1500 to m/z 1600 for native HA (green
color) and cross-linked HA (red color)

APPENDICES
034
Appendix 2. 2 O ESI-MS spectra of extended range from m/z 1600 to m/z 1700 for native HA (green
color) and cross-linked HA (red color)

APPENDICES
035
Appendix 2. 2 P ESI-MS spectra of extended range from m/z 1700 to m/z 1800 for native HA (green
color) and cross-linked HA (red color)

APPENDICES
036
Appendix 2. 2 Q ESI-MS spectra of extended range from m/z 1800 to m/z 1900 for native HA (green
color) and cross-linked HA (red color)

APPENDICES
037
Appendix 2. 2 R ESI-MS spectra of extended range from m/z 1900 to m/z 2000 for native HA (green
color) and cross-linked HA (red color)
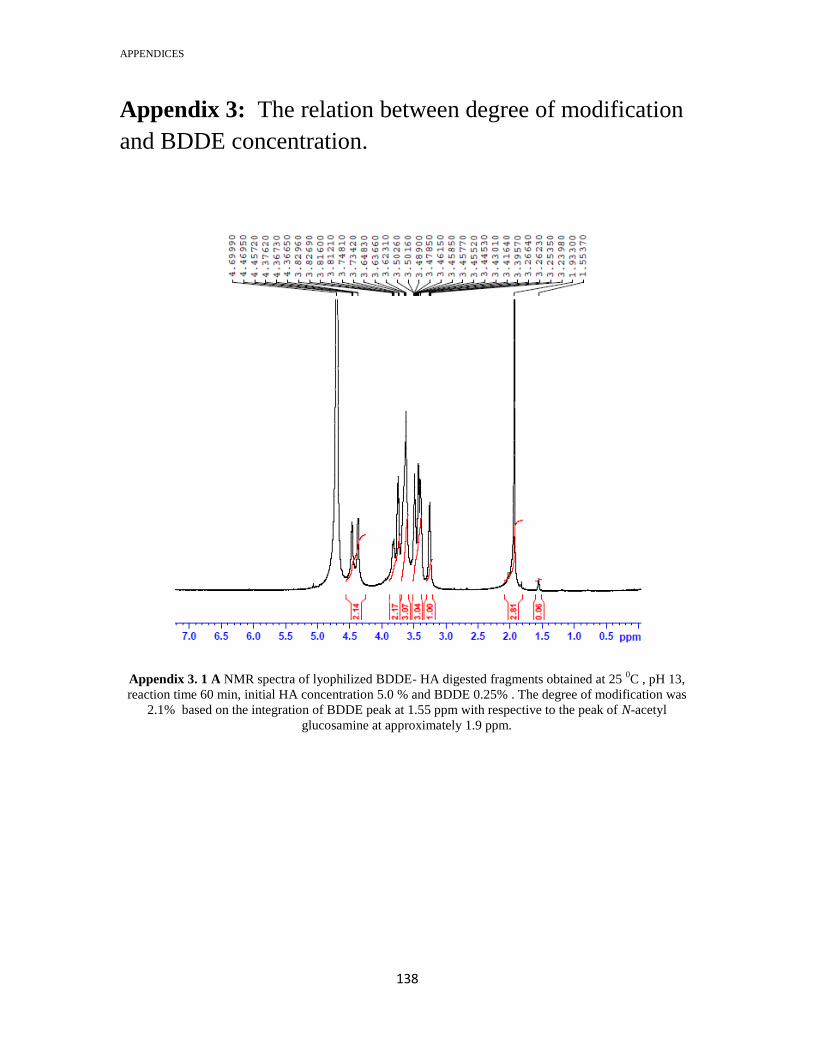
APPENDICES
038
Appendix 3: The relation between degree of modification
and BDDE concentration.
Appendix 3. 1 A NMR spectra of lyophilized BDDE- HA digested fragments obtained at 25 0C , pH 13,
reaction time 60 min, initial HA concentration 5.0 % and BDDE 0.25% . The degree of modification was
2.1% based on the integration of BDDE peak at 1.55 ppm with respective to the peak of N-acetyl
glucosamine at approximately 1.9 ppm.
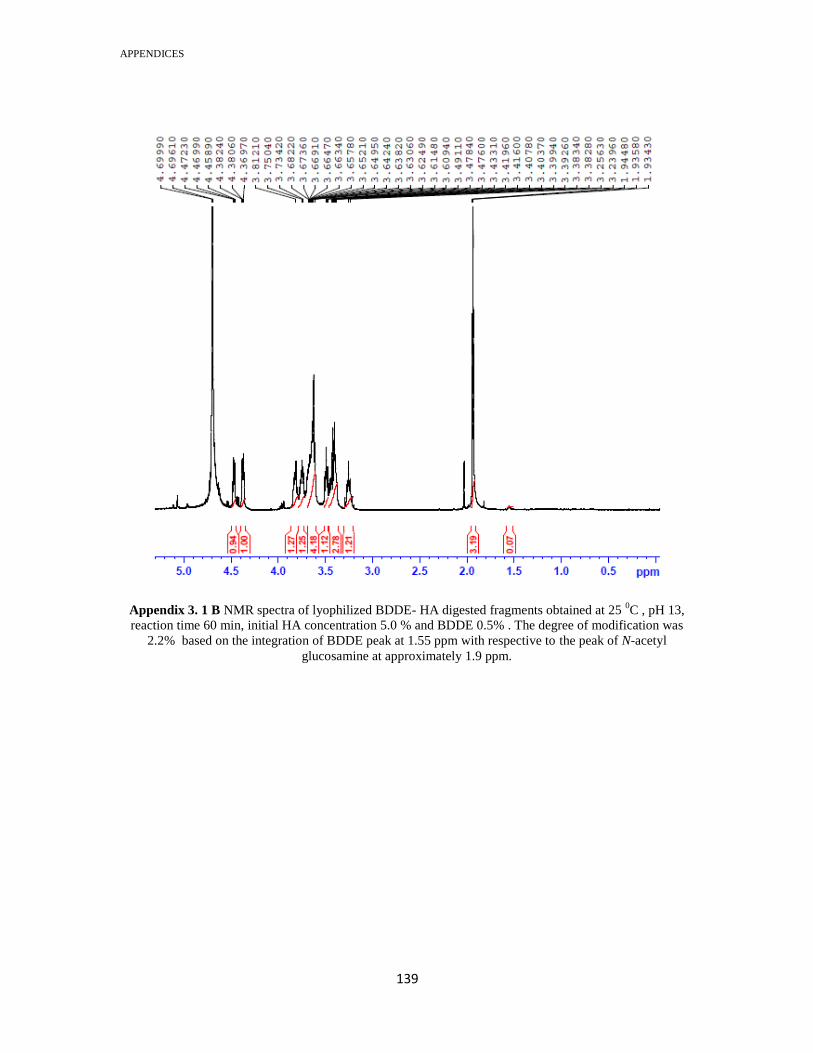
APPENDICES
039
Appendix 3. 1 B NMR spectra of lyophilized BDDE- HA digested fragments obtained at 25 0C , pH 13,
reaction time 60 min, initial HA concentration 5.0 % and BDDE 0.5% . The degree of modification was
2.2% based on the integration of BDDE peak at 1.55 ppm with respective to the peak of N-acetyl
glucosamine at approximately 1.9 ppm.

APPENDICES
041
Appendix 3. 1 C NMR spectra of lyophilized BDDE- HA digested fragments obtained at 25 0C , pH 13,
reaction time 60 min, initial HA concentration 5.0 % and BDDE 0.75% . The degree of modification was
3.6% based on the integration of BDDE peak at 1.55 ppm with respective to the peak of N-acetyl
glucosamine at approximately 1.9 ppm.

APPENDICES
040
Appendix 3. 1 D NMR spectra of lyophilized BDDE- HA digested fragments obtained at 25 0C , pH 13,
reaction time 60 min, initial HA concentration 5.0 % and BDDE 1.0 % . The degree of modification was
4.7% based on the integration of BDDE peak at 1.55 ppm with respective to the peak of N-acetyl
glucosamine at approximately 1.9 ppm.

APPENDICES
042
Appendix 4: Chromatographic analysis
4.1 How HPLC is able to discriminate native HA from cross-
linked BDDE-HA hydrogel.
Materials
Samples of native HA and cross-linked BDDE-HA hydrogel, enzyme
hyaluronidase (solid powder) with 3000 U/mg. Ehrlich's reagent, phosphate buffer saline
(PBS) and alkaline solution.
Measurements
Equivalent portions from lyophilized native HA and cross-linked BDDE-HA were
obtained and digested with hyaluronidase solution until complete degradation. The
extracts were filtered using 45 µm Watmaan filtration paper. Each extract was analyzed
by a reverse-phase HPLC (Agilent 1220 infinity, Waldbronn, Germany) and detected by
a built-in diode-array detector. The stationary phase was C18 end-capped column (100
cm x 2mm) with 5 µm particle size from (knauer, Berlin, Germany) and the mobile phase
was composed of two solutions: A: 96% (water 96% + acetonitrile 4%), B: methanol 4%.
The method was performed on an isocratic mode and optimized with an injection volume
of 2 µl, flow rate of 0.4 ml/min and run time of 10 min. The detection was achieved at
195 nm.
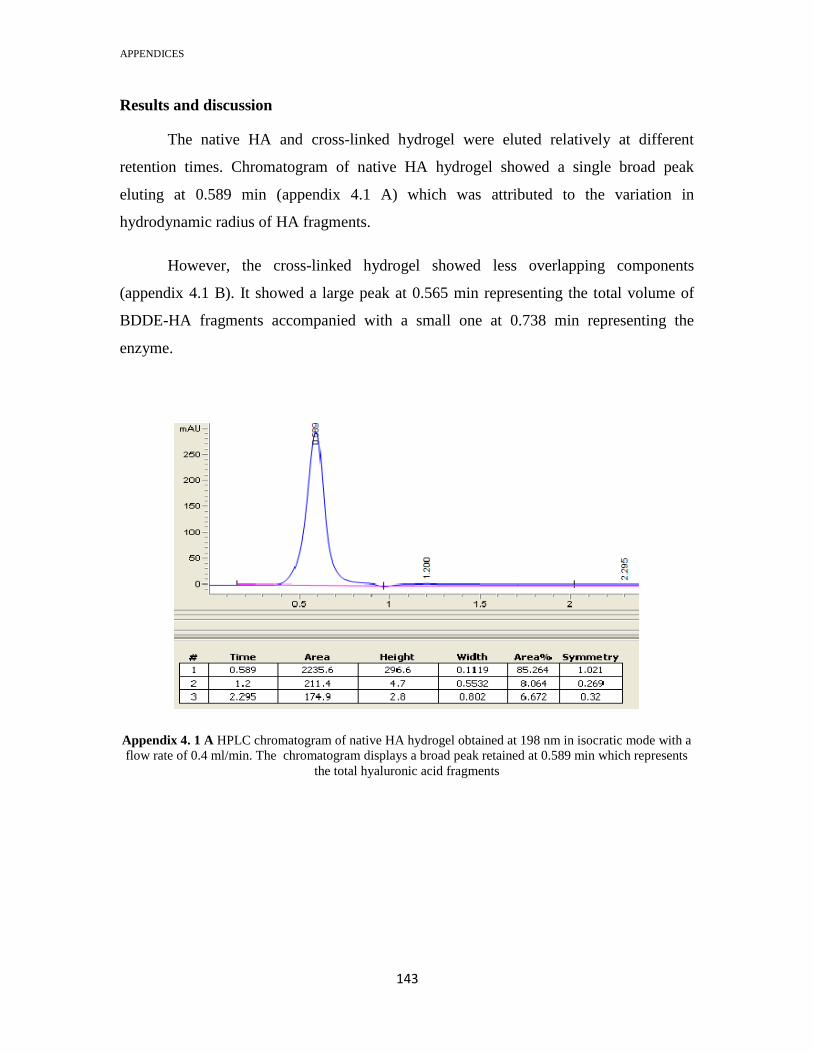
APPENDICES
043
Results and discussion
The native HA and cross-linked hydrogel were eluted relatively at different
retention times. Chromatogram of native HA hydrogel showed a single broad peak
eluting at 0.589 min (appendix 4.1 A) which was attributed to the variation in
hydrodynamic radius of HA fragments.
However, the cross-linked hydrogel showed less overlapping components
(appendix 4.1 B). It showed a large peak at 0.565 min representing the total volume of
BDDE-HA fragments accompanied with a small one at 0.738 min representing the
enzyme.
Appendix 4. 1 A HPLC chromatogram of native HA hydrogel obtained at 198 nm in isocratic mode with a
flow rate of 0.4 ml/min. The chromatogram displays a broad peak retained at 0.589 min which represents
the total hyaluronic acid fragments
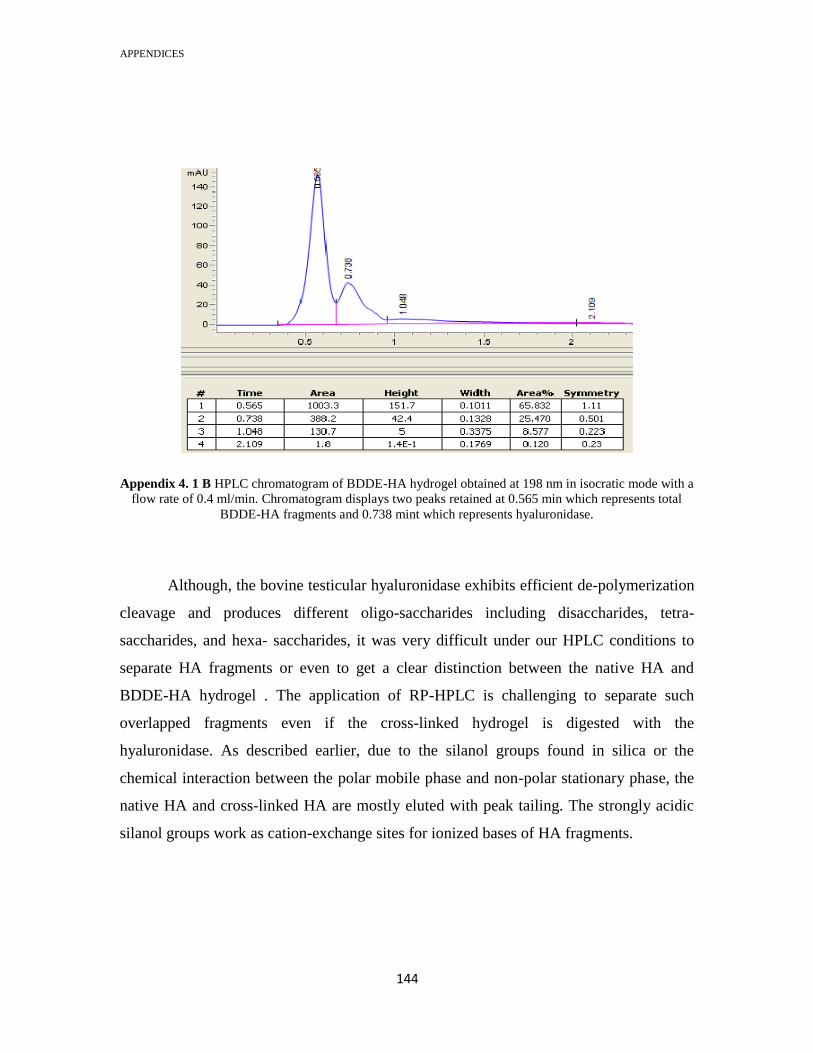
APPENDICES
044
Appendix 4. 1 B HPLC chromatogram of BDDE-HA hydrogel obtained at 198 nm in isocratic mode with a
flow rate of 0.4 ml/min. Chromatogram displays two peaks retained at 0.565 min which represents total
BDDE-HA fragments and 0.738 mint which represents hyaluronidase.
Although, the bovine testicular hyaluronidase exhibits efficient de-polymerization
cleavage and produces different oligo-saccharides including disaccharides, tetra-
saccharides, and hexa- saccharides, it was very difficult under our HPLC conditions to
separate HA fragments or even to get a clear distinction between the native HA and
BDDE-HA hydrogel . The application of RP-HPLC is challenging to separate such
overlapped fragments even if the cross-linked hydrogel is digested with the
hyaluronidase. As described earlier, due to the silanol groups found in silica or the
chemical interaction between the polar mobile phase and non-polar stationary phase, the
native HA and cross-linked HA are mostly eluted with peak tailing. The strongly acidic
silanol groups work as cation-exchange sites for ionized bases of HA fragments.

APPENDICES
045
On the other hand, hyaluronic acid (HA) and hyaluronidase (HAase) have closely
related structures, subsequently two overlapped peaks may be observed. If HA
concentration is higher than (HAase), the (HAase) peak disappear. In contrast, if HA
concentration is lower than (HAase), the (HAase) peak can suppress HA peak. This
phenomenon is clearly observed in the next section (appendix 4.2). The physicochemical
properties of HA and the digestion process could also affect resolution , separation and
retention time. If the stationary phase becomes saturated or blocked over the course of
analysis, that will lead to a variation in the retention time. The retention time also
experiences a drift with increased HA content. This phenomenon is apparently correlated
to the hydrodynamic radius and quantities of HA fragments found in the extract. As the
amount of HA fragments increases like in native HA, it stays longer in the column and
thus, has a slower retention time. .

APPENDICES
046
4.2 Evaluation of in vitro degradation rate of cross-linked
BDDE by HPLC.
4.2.1. Preparation of standard solutions
20 µg /ml
20 µg /ml
20 µg /ml

APPENDICES
047
40 µg /ml
40 µg /ml
40 µg /ml

APPENDICES
048
60 µg /ml
60 µg /ml
60 µg /ml

APPENDICES
049
80 µg /ml
80 µg /ml
80 µg /ml

APPENDICES
051
100 µg /ml
100 µg /ml
100 µg /ml

APPENDICES
050
150 µg /ml
150 µg /ml
150 µg /ml

APPENDICES
052
200 µg /ml
200 µg /ml
200 µg /ml

APPENDICES
053
250 µg /ml
250 µg /ml
250 µg /ml

APPENDICES
054
300 µg /ml
300 µg /ml
300 µg /ml

APPENDICES
055
4.2.2. Samples
X1 A After one- day digestion
X1 B After complete digestion

APPENDICES
056
X2 A After one- day digestion
X2 B After complete digestion
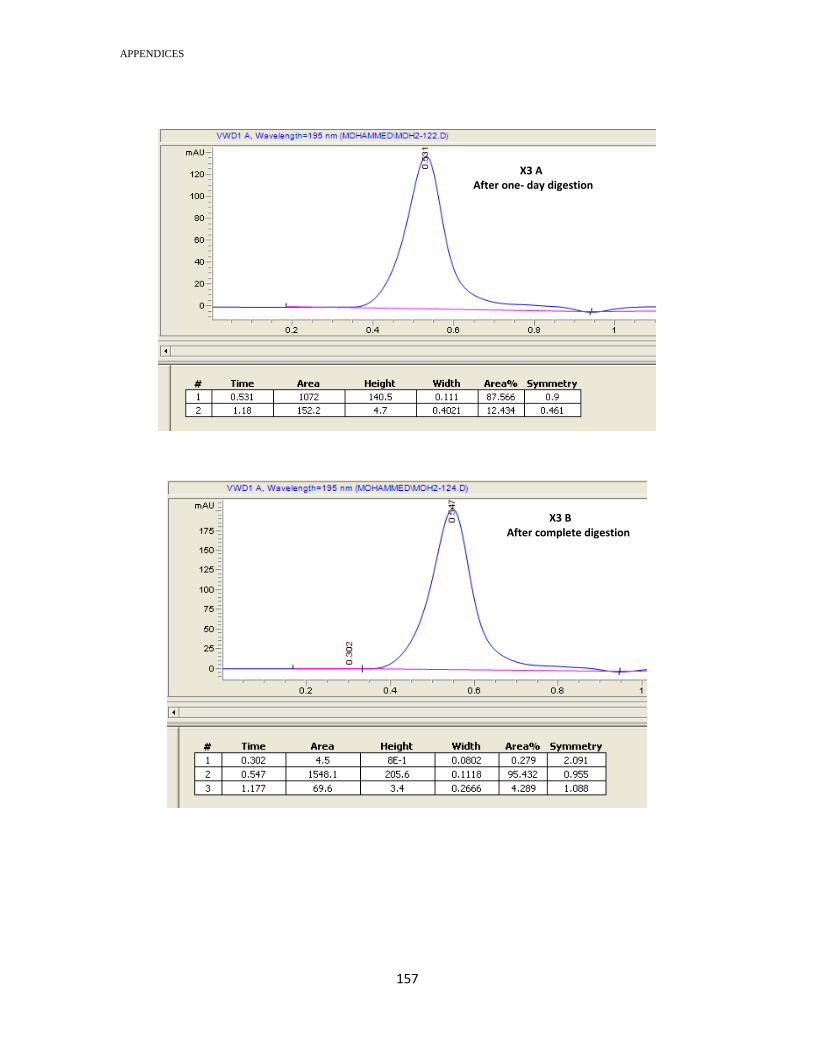
APPENDICES
057
X3 A After one- day digestion
X3 B After complete digestion
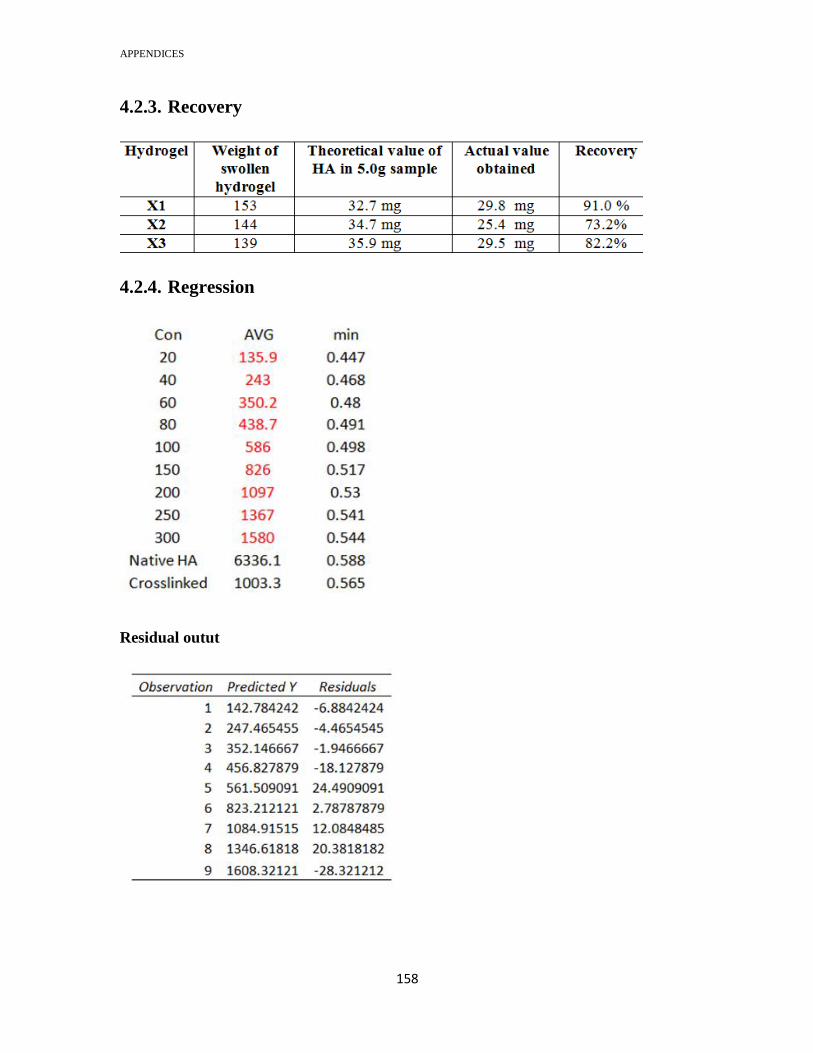
APPENDICES
058
4.2.3. Recovery
4.2.4. Regression
Residual outut
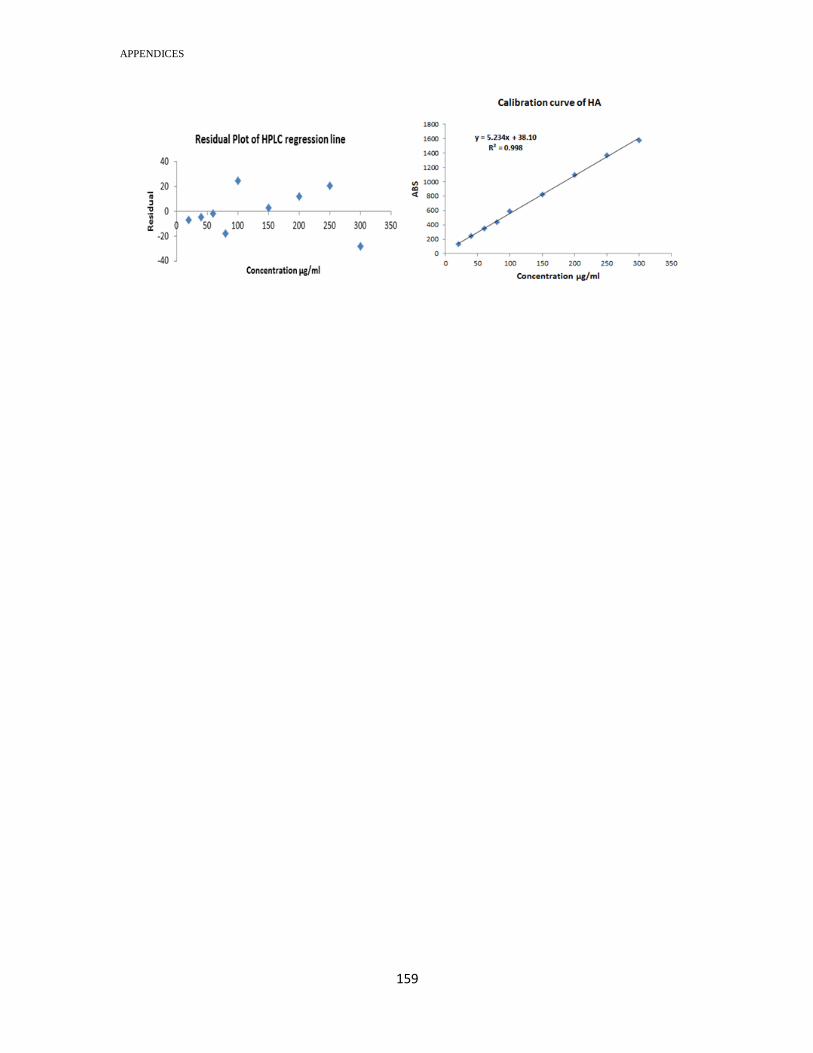
APPENDICES
059
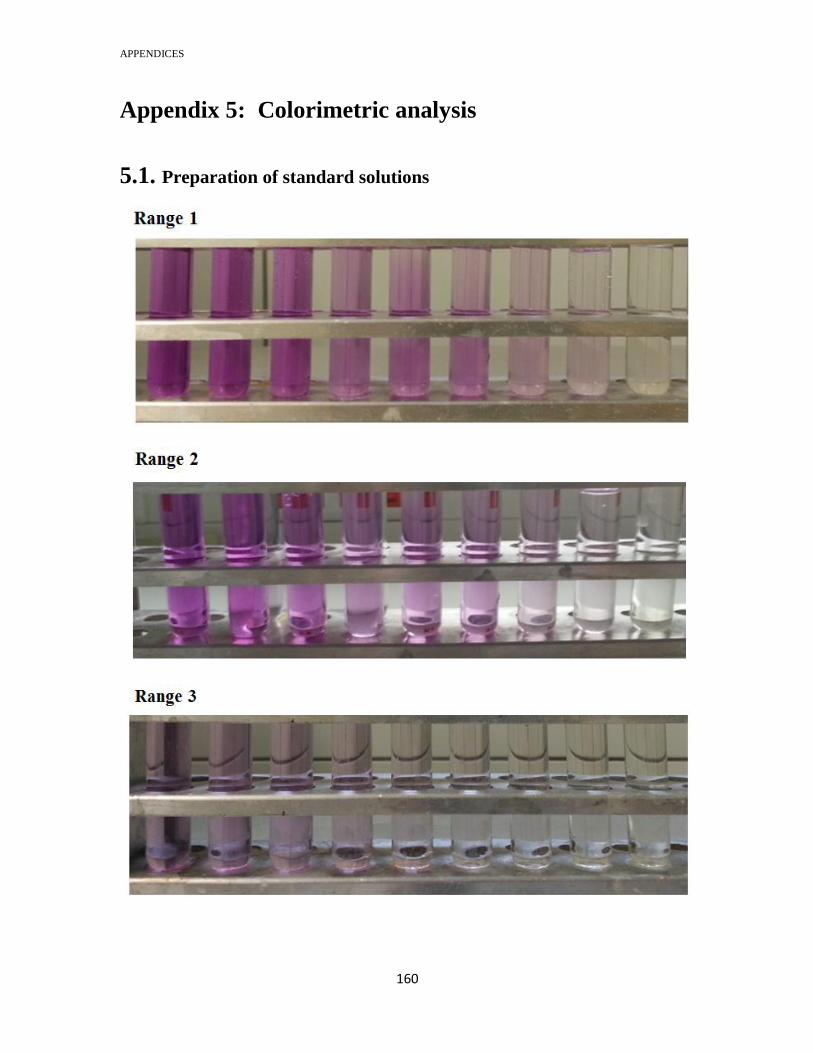
APPENDICES
061
Appendix 5: Colorimetric analysis
5.1. Preparation of standard solutions

APPENDICES
060
5.2. Samples

APPENDICES
062
5.3. Recovery
Hydrogel Weight of
swollen
hydrogel
Theoretical value of
HA in 5.0g sample
Actual value
obtained
Recovery
X4 138 36.2 mg 27.3 mg 75.4%
X5 164 30.48 mg 28.7 mg 94.2%
X6 155 32.25 mg 25.7 mg 79.7 %
5.4. Regression

APPENDICES
063

APPENDICES
064
Appendix 6: Results of the in-vitro degradation rate
Appendix 6.1 Average remaining NAG (%) of BDDE-HA hydrogels prepared at different reaction time
Day 30 min 1 h 2 h 4 h 8 h 24h
0
1
2
3
4
100
49.1 ± 5.9
28.3± 1.8
18.3± 2.2
8.3 ± 6.7
100
63.9± 5.1
30.7 ± 2.7
21.0 ± 6.6
10.5 ± 4.5
100
66.7± 6.2
39.7± 5.2
31.3± 1.4
17.3 ±1.4
100
65.4 ±4.8
42.2± 4.5
30.8± 6.1
18.3 ±3.5
100
62.9± 5.6
40.5 ±4.6
28.7± 3.4
16.1 ±2
100
66.3± 2.4
41.2 ±3.9
31.2 ±3.1
16.3 ±1.3
Appendix 6.2 Average remaining NAG (%) of BDDE-HA hydrogels
prepared at different pH number
Day pH 13 pH 11 pH 9 pH 3
0
1
2
3
4
100
66 ± 3.1
40.3 ± 2.4
29.6 ± 1.8
18.4 ± 2.7
100
51.1 ± 4
31.1± 5.9
20.4 ± 2.1
9.8 ± 1.8
100
46.5± 1.8
25.4± 6.6
14.7± 3.8
7.1 ±3.1
100
55.9 ±5.3
33.6± 6.9
19.8± 5.2
10 ±3.3
Appendix 6.3 Average remaining NAG (%) of BDDE-HA hydrogels
prepared at different temperature
Day 25 O
C 30 O
C 35 O
C 40 O
C 45 O
C 50 O
C
0
1
2
3
4
100
63.6± 3.2
39.8± 2.3
29.1± 1.9
19.0 ± 0.6
100
64.7 ±1.0
41.6± 2.7
31.8 ±2.9
21.5± 1.9
100
65.2± 4.7
42± 4.5
32.6± 2.6
17.9± 1.5
100
65.9± 4.6
40.9± 0.3
33.3 ±1.7
22.3± 3
100
63.3± 2.6
39.9± 3.7
32.3± 5.6
19.5± 2.0
100
48.8± 5.5
29.5± 4.7
18.3± 2.1
7.3 ±2.2

APPENDICES
065
Appendix 6.4 Average remaining NAG (%) of BDDE-HA hydrogels
prepared at different HA concentration.
Day
7.0 % HA
8.0 % HA
9.0 % HA
10.0 % HA
0
1
2
3
4
100
55.5± 5.7
33.4± 1.7
23.1± 2.8
15.9± 5.4
100
58.9± 2.5
35.9± 2.7
26.9± 3.0
18.6± 3.1
100
62.5± 3.4
37.9± 2.0
31.3± 4.6
23.6± 3.8
100
68.4± 1.8
42.9± 1.3
34.2± 2.0
25.1± 1.9
Day
11.0 % HA
12.0 % HA
13.0 % HA
14.0 % HA
0
1
2
3
4
100
66.6± 3.7
41.4± 2.1
32.5± 3.4
22.4± 2.2
100
65.7± 6.3
41.0± 5.5
34.4± 4.0
21.4± 4.9
100
64.7± 2.9
38.9± 3.7
30.5± 4.2
21.9± 2.9
100
63.9± 2.0
38.5± 3.5
31.3± 2.1
19.5± 2.6
Appendix 6.5 Average remaining NAG % of native HA and cross-linked BDDE-HA hydrogels prepared at various
HA molecular weight
Appendix 6.6 Average remaining NAG % of native HA and cross-linked BDDE-HA hydrogels prepared at different
mixing approaches
Day Native HA Hydrogel 1 Hydrogel 2
0
1
2
3
4
100
11.7± 6.1
0.00
0.00
0.00
100
73.4 ± 3.5
45.7 ± 4.6
34.0 ± 6.0
23.8 ± 2.9
100
75.6 ± 0.9
49.0 ± 4.9
39.2 ± 2.9
28.5 ± 2.0
Day 100 kDa 1000 kDa 2000 kDa
0
1
2
3
4
100
61 ± 7.2
34.1 ± 6.9
23.3 ± 5.3
13.8 ± 4.2
100
66.3 ± 7.5
42.6 ± 4.2
33.4 ± 4.2
23.5 ± 3.0
100
71.3± 3.9
46.1 ± 2.9
34.6 ± 2.0
26.5 ± 3.6
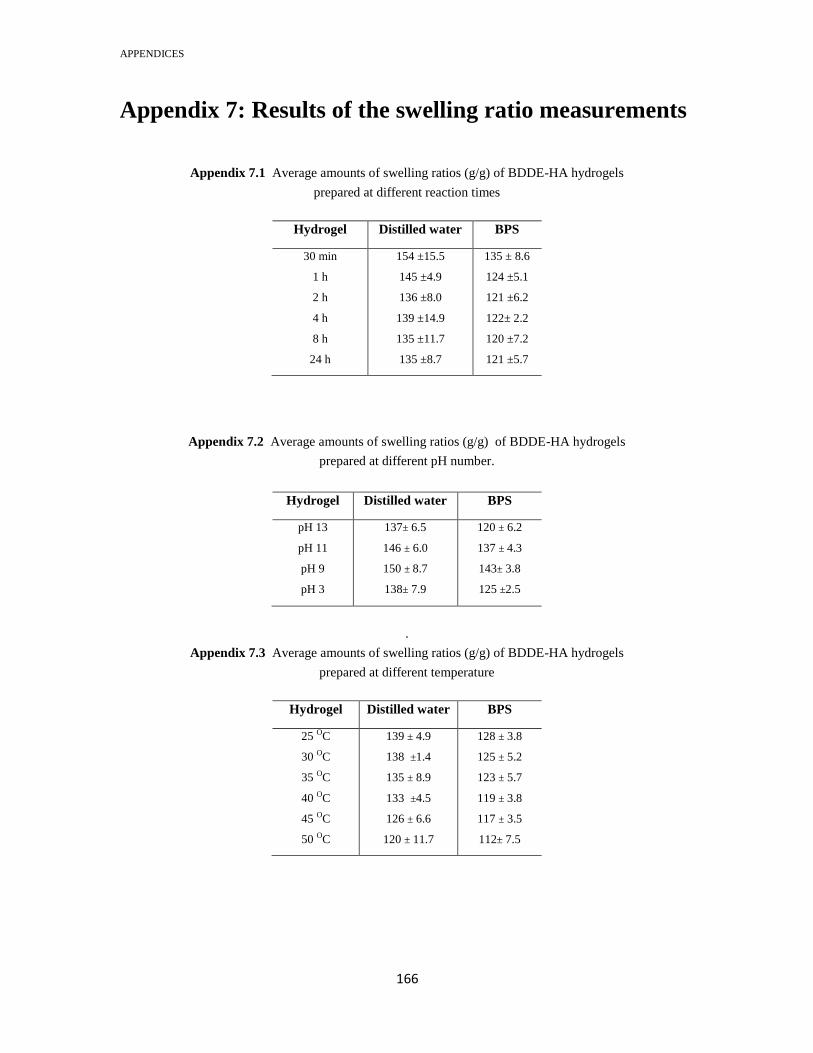
APPENDICES
066
Appendix 7: Results of the swelling ratio measurements
Appendix 7.1 Average amounts of swelling ratios (g/g) of BDDE-HA hydrogels
prepared at different reaction times
Hydrogel Distilled water BPS
30 min
1 h
2 h
4 h
8 h
24 h
154 ±15.5
145 ±4.9
136 ±8.0
139 ±14.9
135 ±11.7
135 ±8.7
135 ± 8.6
124 ±5.1
121 ±6.2
122± 2.2
120 ±7.2
121 ±5.7
Appendix 7.2 Average amounts of swelling ratios (g/g) of BDDE-HA hydrogels
prepared at different pH number.
Hydrogel Distilled water BPS
pH 13
pH 11
pH 9
pH 3
137± 6.5
146 ± 6.0
150 ± 8.7
138± 7.9
120 ± 6.2
137 ± 4.3
143± 3.8
125 ±2.5
.
Appendix 7.3 Average amounts of swelling ratios (g/g) of BDDE-HA hydrogels
prepared at different temperature
Hydrogel Distilled water BPS
25 OC
30 OC
35 OC
40 OC
45 OC
50 OC
139 ± 4.9
138 ±1.4
135 ± 8.9
133 ±4.5
126 ± 6.6
120 ± 11.7
128 ± 3.8
125 ± 5.2
123 ± 5.7
119 ± 3.8
117 ± 3.5
112± 7.5

APPENDICES
067
Appendix 7.4 Average amounts of swelling ratios (g/g) of BDDE-HA hydrogels
prepared at different HA concentrations.
Medium
7.0 % HA
8.0 % HA
9.0 % HA
10.0 % HA
Distilled water
PBS
135 ± 6.5
124 ± 4.3
134 ± 2.8
122 ± 2.4
132 ± 5.1
120 ± 3.8
129 ± 3.2
116 ± 2.4
Medium
11.0 % HA
12.0 % HA
13.0 % HA
14.0 % HA
Distilled water
PBS
131 ± 6.5
117 ± 1.4
132 ± 7.9
119 ± 3.8
136 ± 6.2
121 ± 5.0
137 ± 7.4
127 ± 6.2
Appendix 7.5 Swelling ratios (g/g) of hydrogels prepared by different HA molecular weight in distilled water and PBS
Hydrogel Distilled water BPS
100 kDa
1000 kDa
2000 kDa
142 ± 8.9
130 ± 6.2
133 ± 7.4
131 ± 6.2
119 ± 5.7
125 ± 3.7
Appendix 7.6 Swelling ratios (g/g) of hydrogels 1 and 2 prepared by different mixing approaches in distilled water
and PBS
Hydrogel Distilled water BPS
Hydrogel 1
Hydrogel 2
135 ± 7.2
130 ± 3.8
127 ± 10.8
123± 5.2

APPENDICES
068
Appendix 8: Excel data for the rheological measurements
Appendix 8.1: Rheological data for native HA

APPENDICES
069
Appendix 8.2: Rheological data for BDDE-HA hydrogel prepared with 100,000 Da
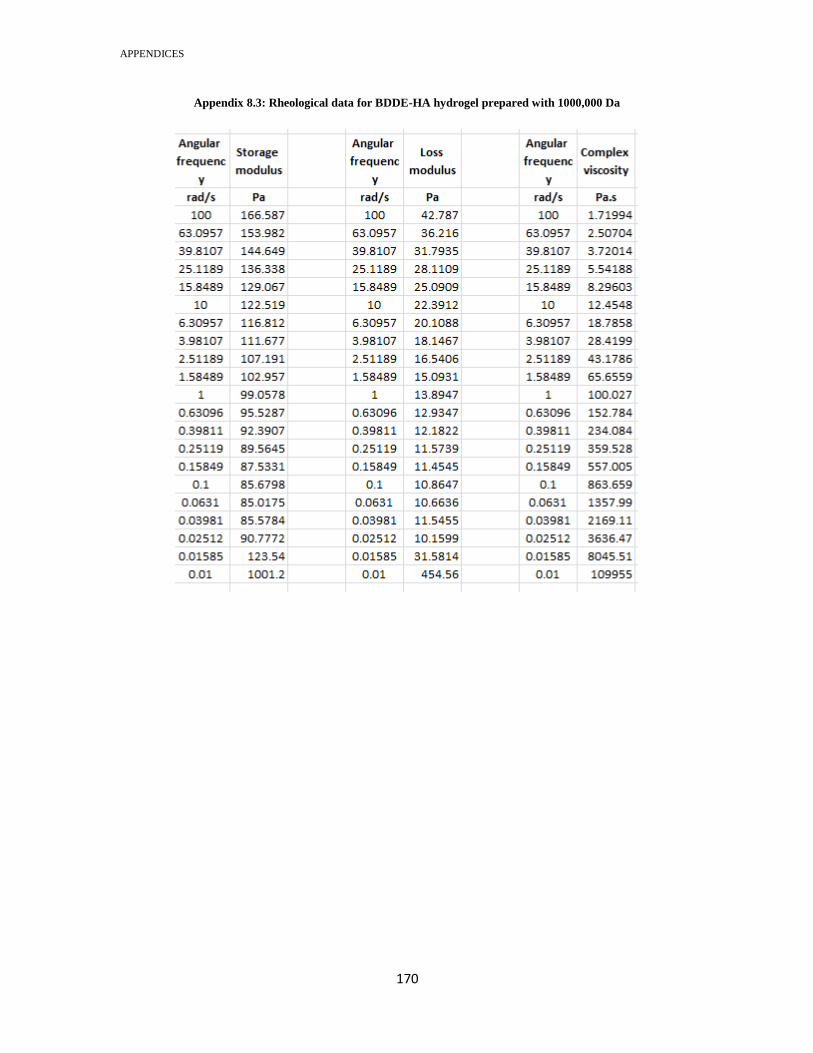
APPENDICES
071
Appendix 8.3: Rheological data for BDDE-HA hydrogel prepared with 1000,000 Da
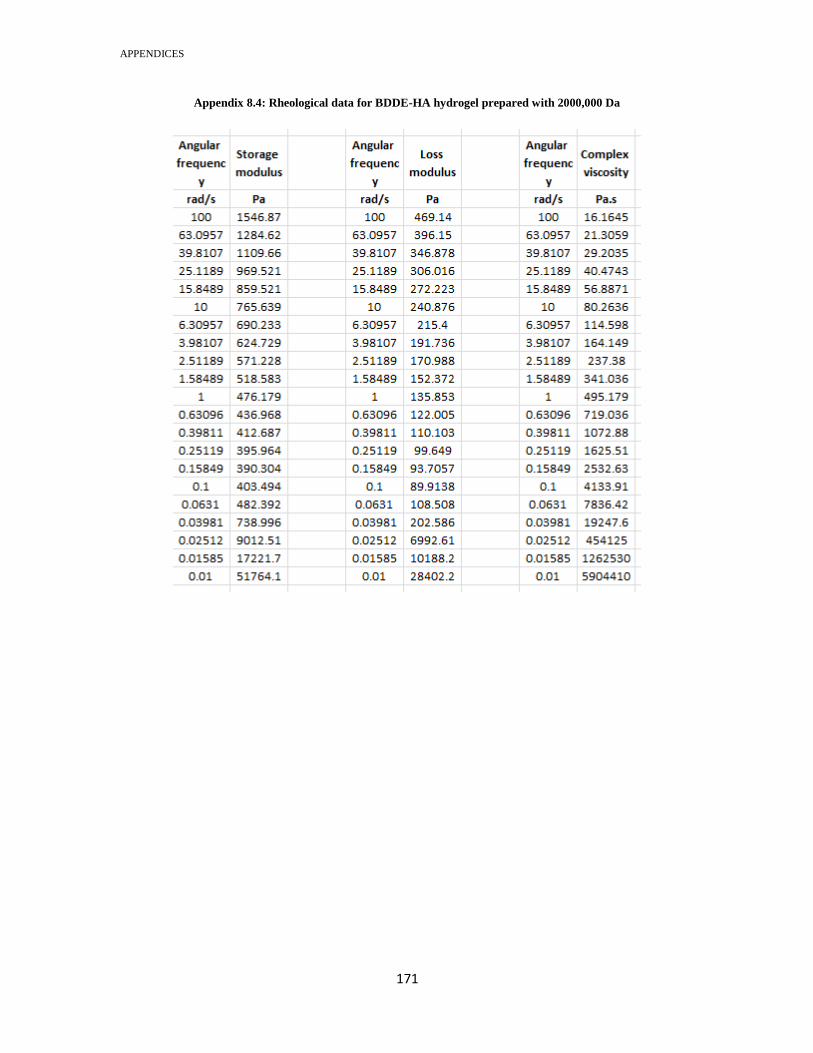
APPENDICES
070
Appendix 8.4: Rheological data for BDDE-HA hydrogel prepared with 2000,000 Da

APPENDICES
072
Appendix 8.5: Rheological data for BDDE-HA hydrogel prepared with large-batch mixing approach

APPENDICES
073
Appendix 8.6: Rheological data for BDDE-HA hydrogel prepared with small-batchs mixing approach

APPENDICES
074
Appendix 9: Images for different hydrogel samples
obtained in our work
9.1. Lyophilized-hydrogel appearance
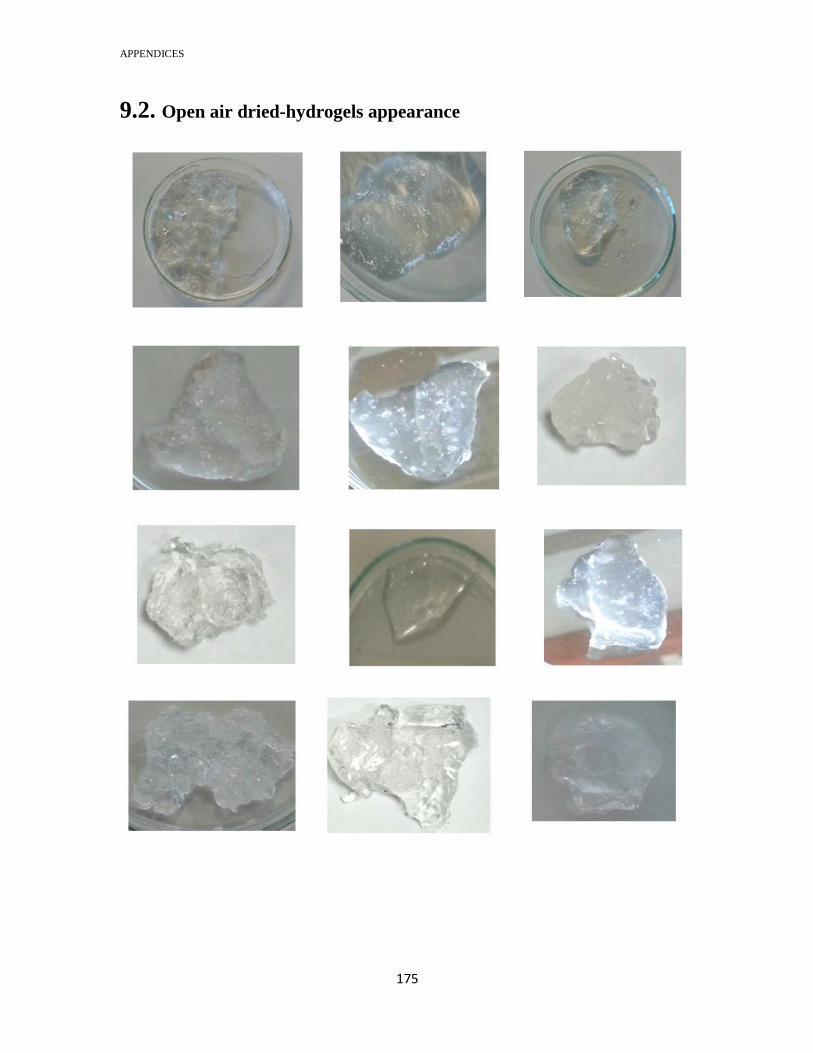
APPENDICES
075
9.2. Open air dried-hydrogels appearance

APPENDICES
076
9.3. Swelling and purification
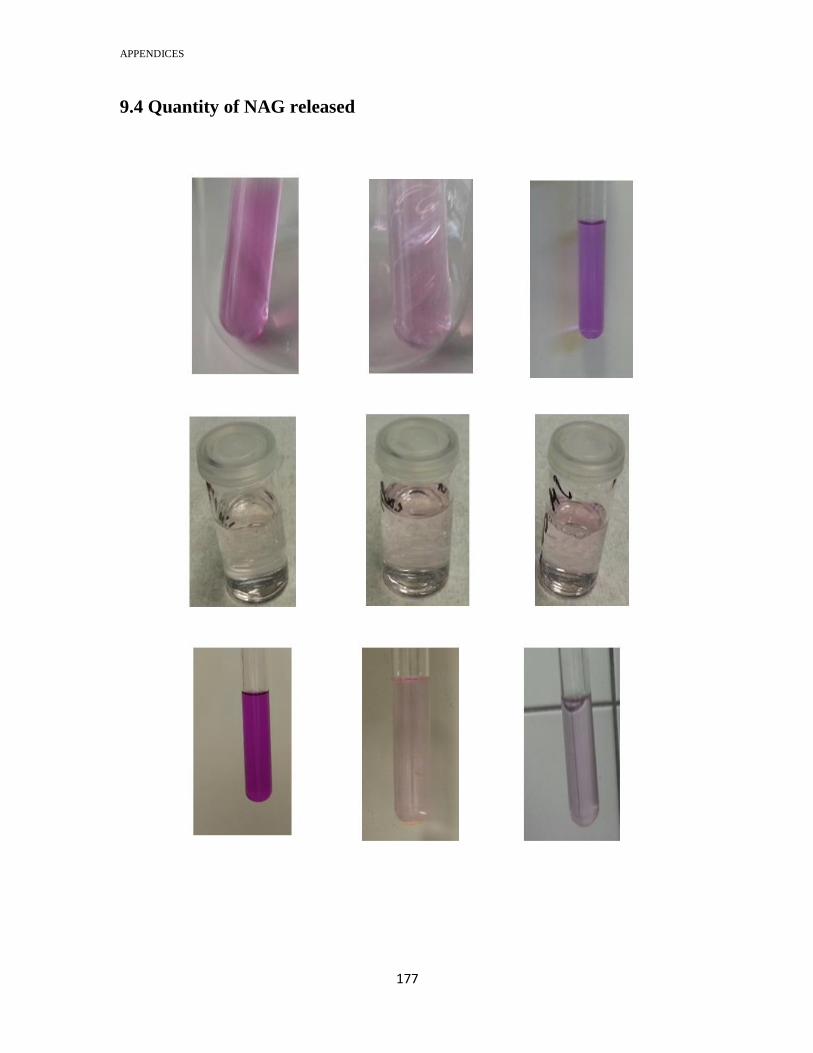
APPENDICES
077
9.4 Quantity of NAG released

DECLARATION
078
ERKLÄRUNG/ DECLARATION
Hiermit erkläre ich entsprechend der Promotionsordnung der Naturwissenschaftlichen
Fakultät I (Biowissenschaften) der Martin-Luther-Universität Halle-Wittenberg, dass ich
die Ergebnisse der vorliegenden Dissertationsarbeit:
Enhancement of cross-linking efficiency of hyaluronic acid-based hydrogels cross-
linked with 1, 4-butanediol diglycidyl ether
“A comparative evaluation of different method conditions”
am Institut für Pharmazie selbständig und ohne fremde Hilfe erarbeitet und verfasst habe
und dass ich alle Informationen in dieser Arbeit und alle beschriebenen Materialien
ordnungsgemäß zitiert habe. Ich habe mich zu keinem früheren Zeitpunkt um den
Doktortitel an einer anderen Einrichtung beworben. Weiterhin habe ich die vorliegende
Arbeit bisher keiner anderen Prüfungsbehörde vorgelegt.
I hereby certify according to the doctoral regulations of faculty 1 of Natural Science –
Biological Science at Martin Luther University of Halle-Wittenberg that this dissertation:
Enhancement of cross-linking efficiency of hyaluronic acid-based hydrogels cross-
linked with 1, 4-butanediol diglycidyl ether
“A comparative evaluation of different method conditions”
is entirely my own work and it was written by me without external help. All material
presented in this thesis including appendices has not been taken from the work of others
except the work that is cited and referenced within the text. This work also has not been
previously submitted for a degree to any other University or Institution. Any
contributions made by the others are acknowledged in this dissertation.

PUBLICATION
079
PUBLICATIONS
CURRICULUM VITAE
081
CURRICULUM VITAE
Personal information
Name Mohammed Abdullah AL-Sibani
Nationality Omani
Date of Birth 28.6.1971
Marital status Married
Address Nizwa, AL Dhakilia Governorate, Sultanate of Oman
Education
1986-1989
General Education Diploma
Abu Abida School, Oman
1989-1993
BSC Science Education- Chemistry,
Sultan Qaboos University, Oman
2007-2008
MSc Analytical chemistry
University of Huddersfield, UK
Job title
1993-1999/ Chemistry Teacher, Ministry of Education, Oman
2000-2009/ Chemistry curriculum Officer, Ministry of Education, Oman
2010-Present/ Analysis and Application Technician, DARIS Centre for Scientific
Research and Technology Development, University of Nizwa, Oman

CURRICULUM VITAE
080
Professional development
1/6-1/8/92 Petroleum analysis, Oman petroleum development company, Oman (training)
4/6-6/8/93 Petroleum analysis, Oman petroleum development company, Oman (training)
Oct, 1994 Conducting lab experiments from simple materials, SQU, Oman (workshop)
Jan 2001 Learning outside school, Saudi (workshop)
Apr, 2002 Technology and science, Kuwait (conference)
May, 2003 Curriculum strategies, Lebanon (workshop)
Dec, 2004 Intellectual property, Oman (workshop)
Dec, 2005 Skills of the trainer, Oman (workshop)
April 2005 Gaps between scientists and science teachers, Egypt (conference)
Jun, 2006 Environmental forum, Japan (conference)
May, 2008 Science and supervision, USA (conference)
Mar, 2009 Science books and publishers, Germany (workshop)
Jun , 2012 Peak Scientific- Nitrogen generator workshop, Dubai (workshop)
Sept, 2012 Optimization of pesticide analysis by ESI LC-MS/MS, Oman (workshop)
Oct, 2012 GC-MS installation, Oman (workshop)
Nov, 2012 Writing peer review paper, Oman (conference)
April, 2016 Food safety conference, Oman (conference)
Mohammed Al-Sibani