enhancement of coffee quality through the …
TRANSCRIPT
ENHANCEMENT OF COFFEE QUALITY THROUGH THE PREVENTION OF MOULD FORMATION
GCP/INT/743/CFC
STORAGE AND DEFECTS
KENYA STORAGE

Kenya – 1 year storage (2004-2005) page2/17
A – PROTOCOL
MYCOLOGY OF COFFEE BEAN DEFECTS
1. BACKGROUND
The means of separating certain physical defects of coffee beans are available and widely applied. If evidence of correlation between OTA producer development and these classes were to be established a ready means of eliminating some contamination from production would follow, though this strategy is not prevention.
2. OBJECTIVES
The experiment tests the hypothesis that fungal communities and average levels of OTA contamination are different among some defect classess as compared with sound beans.
3. OVERVIEW OF EXPERIMENT
The procedure compares sound coffee of a batch to its out-sorted defects for wet processed coffee and for mbuni coffee. It will describe the distribution of the fungal community in the overall batch to reveal any preferential occurrence that can be attributed to visible features.
Two batches of wet processed coffee are sampled from each of three selected sources and two batches of mbuni coffee are sampled from each of three sources. One batch from each of the sources is sorted into the main classes. The proportion of each defect is noted and OTA and mould analyses are carried out on samples from each defect class. The beans collected from different sources serve as replicate treatments.
The second batch of coffee from each source is clearly labeled and put into a coffee storage facility for 1 year, after which it is sorted and analysed as for the first batch.
4. METHODS
4.1. Sampling and processing of the samples
Collect 2 batches of 100 kg of green beans produced by wet processing from each of 3 coffee factories: two from the cooperative sector and one from the large estate sector. The coffee must be from the current harvest season and must be properly dried (less than 11% moisture db). Bag and clearly label one batch of coffee from each source and put these into storage. Sort the remaining batches of coffee, by hand, into the main defect classes and sound beans. Weigh and record the individual weights of each category. Immediately seal them in plastic bags and set aside for equilibration and Aw measurement (on the following morning) as described in section 4.2. After Aw measurement, conduct mycological analysis on subsamples from each of the three replicates of each category of beans according to the procedure outlined in Section 4.3. OTA content of each of the three replicates of the bean categories should be determiined according to the procedure outlined in Section 4.4.
Retain residual samples for re-checking if necessary. The same procedure should be followed for green beans coming from mbuni.
4.2 Measurement of water activity
Immediately after sorting and before mycological analysis, seal about 50g of each of the seven defects from the batch in plastic bags. Allow the samples to equilibrate overnight. In the morning, introduce the Aw probe into each bag with as little disruption to the air in the bag as possible. Note the Aw after 10min and check at about 12 and 15min and so on to assess whether equilibrium has been reached and the reading is steady. Record the temperature at which the measurement was taken. The beans used in this analysis can be returned to the experimental unit. This may be useful in cases where a small amount of a particular defect has been found.
4.3 Mycological analysis Randomly select somewhat more than 100 beans from each of the bean categories. Commit them to i analysis as described in the mycological handbook setting up 14 plates of seven beans per plate or 98 beans. From the defect class “broken beans” select the larger broken beans for this purpose.
4.4. OTA analysis Remove two 500g samples from each of the categories of beans coming from each of the three farms (if this amount of coffee is not available for any category of defect, divide what is available into 2 samples). These samples should be clearly labelled and packed in plastic bags to be sent to CIRAD for analysis. Ensure that the moisture content of the beans is less than 11% db.

Kenya – 1 year storage (2004-2005) page3/17
B – MAIN CONCLUSIONS 1. STORAGE
1.1. Coffee from Estate sector (Azania estate) 1.1.1. Parchment P3
• No significant differences have been shown between samples before and after 1 year storage.
• Dominant taxa observed on beans is composed of Penicillium, Fusarium, yellow and black Aspergillii before storage whereas only black Aspergillii have been observed after one year of storage.
1.1.2. Mbuni
• No significant differences have been shown between samples before and after 1 year storage for weight of defects, total infection rates and OTA
• Increase of infection by ochre group and decrease of Aw during storage.
• Dominant taxa observed on beans is composed of Penicillium, Fusarium, yellow and black Aspergillii before storage whereas only black Aspergillii have been observed after one year of storage
1.2. Coffee from Cooperative sector
1.2.1. Parchment P3 (Kirura FCS and Gathiruini FCS) a) Kirura
• No significant differences shown before and after storage for weight of defects, total infection rates and OTA contamination
• Increase of Aw and infection by ochre group during storage
• Total infection: black Aspergillus group predominant before storage is replaced by yellow and green Aspergillus after storage for the observed sample.
b) Gathiruini
• No significant differences shown before and after storage
• Total infection: Fusarium have been replaced by black Aspergillus after storage 1.2.2. Mbuni (Kiambu FCS and Barikongo FCS)
a) Barikongo
• No significant differences shown before and after storage for weight of defects, total infection rates, infection by ochre group and OTA contamination
• Increase of water activity after storage
• Dominant taxa are similar before and after storage
b) Kiambu
• No significant differences shown before and after storage for weight of defects, total infection rates, infection by ochre group and OTA contamination
• Increase of water activity after storage
• Dominant taxa are similar before and after storage 2. DEFECTS AND OTA CONTAMINATION
2.1. P3
• Diseased beans contribute for more 70% of the total OTA contamination in coffee from Farmers Cooperative Societies whereas the impact of diseased beans is negligible with estate sector
2.2. Mbuni
• Diseased beans and foxy beans contribute for more 70% of the total OTA contamination in coffee from Farmers Cooperative Societies whereas the impact of the same defects is negligible with estate sector.

Kenya – 1 year storage (2004-2005) page4/17
C - DATA
1. ESTATE 1.1. P3 / Lights Source: Azania (Thika) Date of collection: 14 April 2004 . Region of origin: UM3 Date of milling: 20 april 2004 Date of sorting before storage: may 2004 - Storage of beans after milling Date of sorting/analysis after storage: 14/19 April 2005
Before storage
Classification Weight
(kg) % of total % of beans AW oC
% infection
Dominant taxa
%Ochre infection
Ref/Lab (CIRAD)
OTA µg/kg
Black beans 0,9 0,9 1,0 0,565 23,8 27 Penicillium 4 2697/04 3,16
Diseased beans 6,8 6,8 7,4 0,562 23,7 30 Fusarium 6 2696/04 0,50
Foxy beans 0 - - - - -
Hulled ears 5,8 5,8 6,3 0,559 23,5 32 Penicillium 5
Insect damaged beans 1,0 1 1,1 0,564 23,7 22 Yellow asp 8 2695/04 0,02
Stinkers 0 - - - - -
Sound beans 77,2 77,2 84,2 0,537 24,5 14 Black Asp 7
Sub-total 91,7 91,7 100,0
Husks
Pods and dust 8,3 8,3 Sweepings
Total 100,0
After storage
Classification Weight
(kg) % of total % of beans Aw Û&
% Infection
Dominant taxa
% Ochre infection
Ref/Lab (CIRAD)
OTA µg/kg
Black beans 0,76 0,8 0,89 0,555 22,7 86 Black Asp 27 1265/05 traces
Diseased beans 9,7 10,0 11,32 0,555 22,2 52 Black Asp 10 1263/05 traces
Foxy beans 0,3 0,3 0,35 0,543 23,1 68 Black Asp 6 1266/05 traces
Hulled ears 6,6 6,8 7,70 0,538 22,6 7 Green Asp 1 1267/05 traces
Insect damaged beans 1,5 1,5 1,75 0,558 22,3 79 Black Asp 34 1264/05 traces
Stinkers 0,06 0,1 0,07 0,553 23,7 51 Black Asp 4
Sound beans 66,8 68,9 77,93 0,541 22,4 22 Black Asp +Fusarium
2 1262/05 traces
Sub-total 85,72 88,4 100,00
Husks 0,26 0,26 0,54 24,6
Pods 10,9 11,24 0,548 23,3
Sweepings 0,12 0,12 0,581 24,1
Total 97,000
Statistical analysis
Weight of defects Aw
Variation df Sum Squares Mean Squares F Variation df Sum Squares Mean Squares F
Storage 1 95,238 95,238 0,095 Storage 1 0,0002058 0,00021 2,210
Residual 10 10021,030 1002,103 Residual 10 0,0009312 0,00009
Total 11 10116,268 total 11 0,001137
Before = After Before = After
Total infection Infection by ochre group
Variation df Sum Squares Mean Squares F Variation df Sum Squares Mean Squares F
Storage 1 2148,810 2148,810 4,074 Storage 1 105,000 105,000 1,006
Residual 10 5274,857 527,486 Residual 10 1044,000 104,400
Total 11 7423,667 total 11 1149,000
Before = After Before = After
Statistical analysis regarding OTA contents is not possible

Kenya – 1 year storage (2004-2005) page5/17
• No significant differences shown before and after storage.
• Total infection: though there is not significant differences regarding infection rates, dominant taxa has shift to black Aspergillus group during storage.
0,000,501,001,502,002,503,003,50
ppb o
f O
TA
Bla
ck
Dis
ea
se
d
Foxy
Hulle
d e
ars
Inse
ct d
am
ag
ed
Stin
ke
rs
Sound
Before storage
After storage
Before storageAfter storage
OTA
contents
(ppb)
05
101520253035
% o
f in
fection
Bla
ck
Dis
ea
se
d
Foxy
Hulle
d e
ars
Inse
ct d
am
ag
ed
Stin
ke
rs
Sound
Before storage
After storage
Before storageAfter storage
Infection
by class of
beans
(ochre)
0
0,1
0,2
0,3
0,4
0,5
0,6
Aw
Bla
ck
Dis
ea
se
d
Foxy
Hulle
d e
ars
Inse
ct d
am
ag
ed
Stin
ke
rs
Sound
Before storage
After storage
Before storageAfter storage
Water
Activity
01020304050607080
% o
f d
efe
cts
Bla
ck
Dis
ea
se
d
Foxy
Hulle
d e
ars
Inse
ct d
am
ag
ed
Stin
ke
rs
Sound
Hu
sks
Pods
Sw
eepin
gs
Before storage
After storage
Before storageAfter storage
Breakdown
by class of
defects
0,0
20,0
40,0
60,0
80,0
100,0
% o
f w
eig
ht
Bla
ck
Dis
ea
se
d
Foxy
Hulle
d e
ars
Inse
ct d
am
ag
ed
Stin
ke
rs
Sound
Before storage
After storage
Before storageAfter storage
Breakdown
by class of
beans
0
20
40
60
80
100%
of in
fection
Bla
ck
Dis
ea
se
d
Foxy
Hulle
d e
ars
Inse
ct d
am
ag
ed
Stin
ke
rs
Sound
Before storage
After storage
Before storageAfter storage
Total
infection by
class of
beans

Kenya – 1 year storage (2004-2005) page6/17
1.2. Mbuni Source: Azania Estate (Thika) Date of collection: 6 April 2004 Region of origin: Um3 Date of milling: 7 april 2004 - Storage in beans after milling Date of sorting before storage: may 2004 Date of sorting/analysis after storage: 4/13 April 2005.
Before storage
Classification Weight
kg %of total
% of beans
AW °C %
infection Dominant
taxa %Ochre infection
Ref/Lab OTA µg/kg
Black beans 2,7 2,7 3,0 0,622 21,2 92 Fusarium 2 2700/04 0,20
Diseased beans 20,7 20,7 23,1 0,610 21,3 78 Fusarium 0 2699/04 <0,02
Foxy beans 1,55 1,55 1,7 0,627 21,3 97 Cy 2 2702/04 0,23
Hulled ears 2,1 2,1 2,3 0,624 21,2 37 Black Asp 5 - NA
Insect damage 0,88 8,8 1,0 0,639 21,2 94 Black Asp 8 2698/04 0,02
Stinkers 1,1 1,1 1,2 0,643 21,7 87 Cy 2 2701/04 0,10
sound beans 60,7 60,7 67,6 0,594 22,2 78 Black Asp 0 2703/04 traces
Sub total 89,728 89,7 100,0
Husk
Pods and dust 10,27 10,3 N/A N/A
Sweeepings
Total 100 200,0
After storage Bean
Classification Weight
kg % of total
% of beans
Aw Û& % Infect. Dominant
taxa % Ochre infection
Ref/Lab OTA µg/kg
Black 6,490 6,7 7,4 0,558 24 40 Black Asp 9 1259/05 0,1
Diseased 28,700 29,8 32,8 0,533 23,3 80 Black Asp 5 1256/05 traces
Foxy 0,690 0,7 0,8 0,556 23,5 76 Black Asp 9 1260/05 traces
Hulled ears 2,920 3,0 3,3 0,559 23,6 56 Penicillium 3 1261/05 0,1
Insect damage 1,000 1,0 1,1 0,565 23,4 95 Black Asp 23 1257/05 0,1
Stinker 1,000 1,0 1,1 0,569 23,4 66 Black Asp 12 1258/05 4,4
Sound 46,600 48,3 53,3 0,542 23,7 52 Black Asp 3 1255/05 traces
Sub total 87,4 90,6 100,0
Husks 0,690 0,7 0,574 23,7
Pods 7,850 8,1 0,569 23,3
Sweepings 0,510 0,5 0,586 24
Total 96,450 100,0 100,0
Statistical analysis Weight of defects Aw
Variation df Sum Squares Mean Squares F Variation df Sum Squares Mean Squares F
Storage 1 0,481 0,481 0,001 Storage 1 0,016 0,016 73,396
Residual 10 6130,857 510,905 Residual 12 0,003 0,000
total 11 6131,338 total 13 0,019
Before = After Before > After
Total infection Infection by ochre group
Variation df Sum Squares Mean Squares F Variation df Sum Squares Mean Squares F
Storage 1 686,000 686,000 1,774 Storage 1 144,643 144,643 5,071
Residual 12 4641,429 386,786 Residual 12 342,286 28,524
total 13 5327,429 total 13 486,929
Before = After Before > After
OTA
Variation df Sum Squares Mean Squares F
Storage 1 0,0614 0,0614 0,083
Residual 10 7,3663 0,7366
total 11 7,4277
Before = After
note Transformation for OTA data:
X →log(X), traces → log(0,01), <0,02 → log(0,015)
Kenya – 1 year storage (2004-2005) page7/17
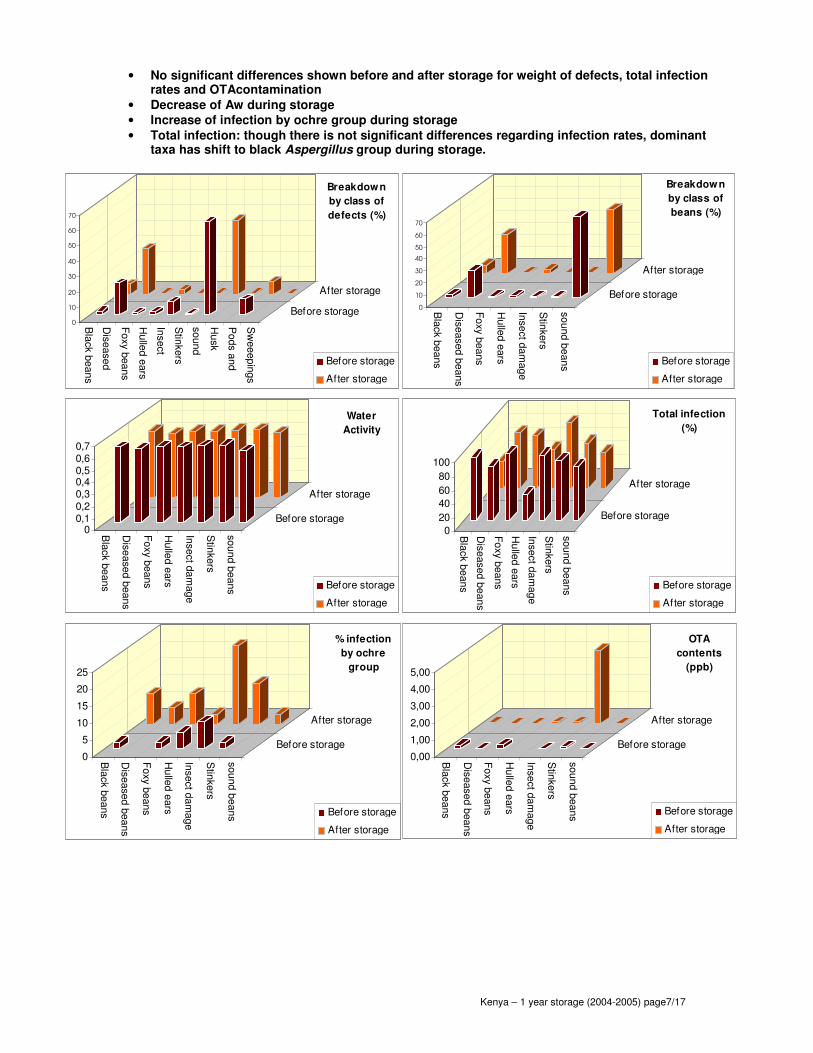
• No significant differences shown before and after storage for weight of defects, total infection rates and OTAcontamination
• Decrease of Aw during storage
• Increase of infection by ochre group during storage
• Total infection: though there is not significant differences regarding infection rates, dominant taxa has shift to black Aspergillus group during storage.
2. Farmers Cooperative Societies (FCS)
0
10
20
30
40
50
60
70
Bla
ck b
eans
Dis
ea
se
d
Foxy b
eans
Hulle
d e
ars
Inse
ct
Stin
ke
rs
sound
Hu
sk
Pods a
nd
Sw
eeepin
gs
Before storage
After storage
Before storage
After storage
Breakdown
by class of
defects (%)
0
10
20
30
40
50
60
70
Bla
ck b
eans
Dis
eased b
eans
Foxy b
eans
Hulle
d e
ars
Inse
ct d
am
ag
e
Stin
ke
rs
sound b
eans
Before storage
After storage
Before storage
After storage
Breakdown
by class of
beans (%)
00,10,20,30,40,50,60,7
Bla
ck b
eans
Dis
eased b
eans
Foxy b
eans
Hulle
d e
ars
Inse
ct d
am
ag
e
Stin
ke
rs
sound b
eans
Before storage
After storage
Before storage
After storage
Water
Activity
0
20
40
60
80
100
Bla
ck b
eans
Dis
eased b
eans
Foxy b
eans
Hulle
d e
ars
Inse
ct d
am
ag
e
Stin
ke
rs
sound b
eans
Before storage
After storage
Before storage
After storage
Total infection
(%)
0,00
1,00
2,00
3,00
4,00
5,00
Bla
ck b
eans
Dis
eased b
eans
Foxy b
eans
Hulle
d e
ars
Inse
ct d
am
ag
e
Stin
ke
rs
sound b
eans
Before storage
After storage
Before storage
After storage
OTA
contents
(ppb)
0
5
10
15
20
25
Bla
ck b
eans
Dis
eased b
eans
Foxy b
eans
Hulle
d e
ars
Inse
ct d
am
ag
e
Stin
ke
rs
sound b
eans
Before storage
After storage
Before storage
After storage
% infection
by ochre
group
Kenya – 1 year storage (2004-2005) page8/17
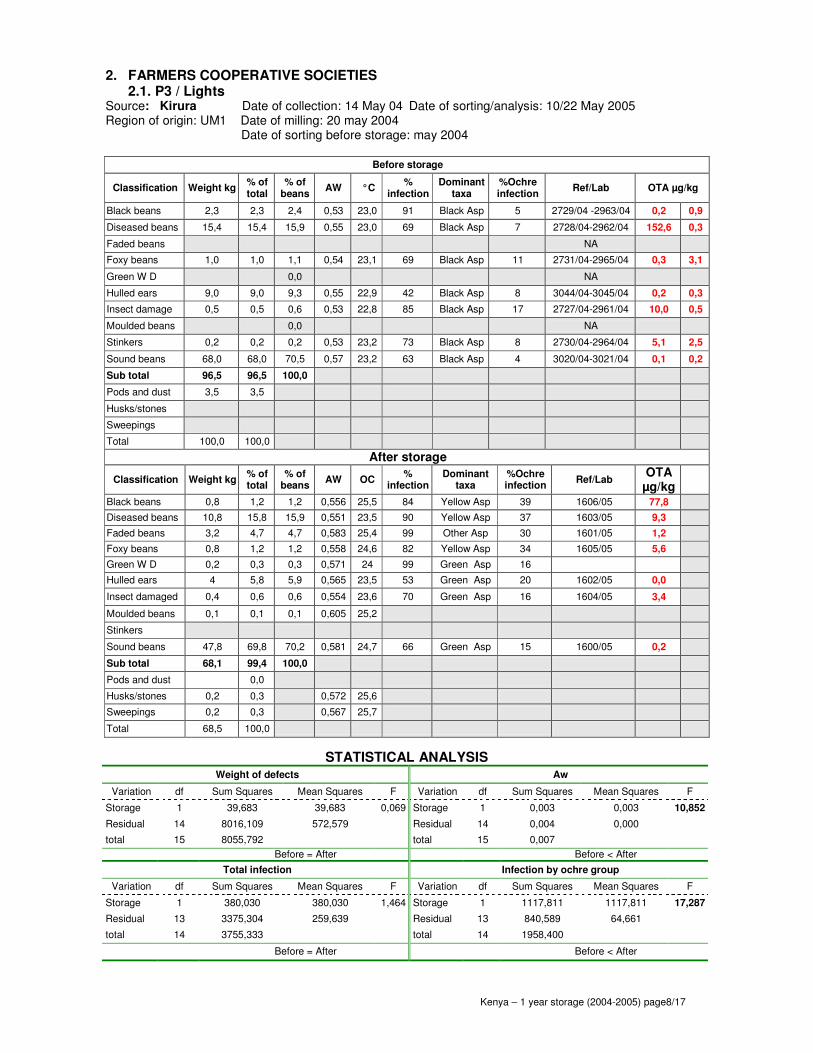
2. FARMERS COOPERATIVE SOCIETIES 2.1. P3 / Lights
Source: Kirura Date of collection: 14 May 04 Date of sorting/analysis: 10/22 May 2005 Region of origin: UM1 Date of milling: 20 may 2004 Date of sorting before storage: may 2004
Before storage
Classification Weight kg % of total
% of beans
AW °C %
infection Dominant
taxa %Ochre infection
Ref/Lab OTA µg/kg
Black beans 2,3 2,3 2,4 0,53 23,0 91 Black Asp 5 2729/04 -2963/04 0,2 0,9
Diseased beans 15,4 15,4 15,9 0,55 23,0 69 Black Asp 7 2728/04-2962/04 152,6 0,3
Faded beans NA
Foxy beans 1,0 1,0 1,1 0,54 23,1 69 Black Asp 11 2731/04-2965/04 0,3 3,1
Green W D 0,0 NA
Hulled ears 9,0 9,0 9,3 0,55 22,9 42 Black Asp 8 3044/04-3045/04 0,2 0,3
Insect damage 0,5 0,5 0,6 0,53 22,8 85 Black Asp 17 2727/04-2961/04 10,0 0,5
Moulded beans 0,0 NA
Stinkers 0,2 0,2 0,2 0,53 23,2 73 Black Asp 8 2730/04-2964/04 5,1 2,5
Sound beans 68,0 68,0 70,5 0,57 23,2 63 Black Asp 4 3020/04-3021/04 0,1 0,2
Sub total 96,5 96,5 100,0
Pods and dust 3,5 3,5
Husks/stones
Sweepings
Total 100,0 100,0
After storage
Classification Weight kg % of total
% of beans
AW OC %
infection Dominant
taxa %Ochre infection
Ref/Lab OTA
µg/kg
Black beans 0,8 1,2 1,2 0,556 25,5 84 Yellow Asp 39 1606/05 77,8 Diseased beans 10,8 15,8 15,9 0,551 23,5 90 Yellow Asp 37 1603/05 9,3 Faded beans 3,2 4,7 4,7 0,583 25,4 99 Other Asp 30 1601/05 1,2 Foxy beans 0,8 1,2 1,2 0,558 24,6 82 Yellow Asp 34 1605/05 5,6 Green W D 0,2 0,3 0,3 0,571 24 99 Green Asp 16 Hulled ears 4 5,8 5,9 0,565 23,5 53 Green Asp 20 1602/05 0,0
Insect damaged 0,4 0,6 0,6 0,554 23,6 70 Green Asp 16 1604/05 3,4
Moulded beans 0,1 0,1 0,1 0,605 25,2
Stinkers
Sound beans 47,8 69,8 70,2 0,581 24,7 66 Green Asp 15 1600/05 0,2
Sub total 68,1 99,4 100,0
Pods and dust 0,0 Husks/stones 0,2 0,3 0,572 25,6 Sweepings 0,2 0,3 0,567 25,7
Total 68,5 100,0
STATISTICAL ANALYSIS Weight of defects Aw
Variation df Sum Squares Mean Squares F Variation df Sum Squares Mean Squares F
Storage 1 39,683 39,683 0,069 Storage 1 0,003 0,003 10,852
Residual 14 8016,109 572,579 Residual 14 0,004 0,000
total 15 8055,792 total 15 0,007
Before = After Before < After
Total infection Infection by ochre group
Variation df Sum Squares Mean Squares F Variation df Sum Squares Mean Squares F
Storage 1 380,030 380,030 1,464 Storage 1 1117,811 1117,811 17,287
Residual 13 3375,304 259,639 Residual 13 840,589 64,661
total 14 3755,333 total 14 1958,400
Before = After Before < After

Kenya – 1 year storage (2004-2005) page9/17
OTA
Variations df Sum Squares Mean Squares F
stockage 1 0,206 0,206 0,092
residuelle 13 29,120 2,240
total 14 29,326
Before = After
• No significant differences shown before and after storage for weight of defects, total infection rates and OTA contamination
• Increase of Aw and infection by ochre group during storage
• Total infection: black Aspergillus group predominant before storage is replaced by yellow and green Aspergillus after storage for the observed sample.
0,0
10,0
20,0
30,0
40,0
50,0
60,0
70,0
% o
f defe
cts
Bla
ck
Dis
ea
se
d
Faded B
Foxy
Gre
en
W D
Hu
lled
ea
rs
Inse
ct d
am
ag
ed
Mo
uld
ed
be
an
s
Stin
ke
rs
Sound
Po
ds a
nd
du
st
Hu
sks/s
ton
es
Sw
ee
pin
gs
Before storage
After storage
Before storage
After storage
Breakdown by
class of
defects
0,0
10,0
20,0
30,0
40,0
50,0
60,0
70,0
80,0
% o
f defe
cts
Bla
ck
Dis
eased
Faded B
Foxy
Gre
en
W D
Hulle
d e
ars
Insect d
am
aged
Mould
ed b
eans
Stin
ke
rs
Sound
Before storage
After storage
Before storage
After storage
Breakdown by
class of beans
0,480
0,500
0,520
0,540
0,560
0,580
0,600
0,620
Bla
ck
Dis
eased
Faded B
Foxy
Gre
en
W D
Hulle
d e
ars
Insect d
am
aged
Mould
ed b
eans
Stin
ke
rs
Sound
Before storage
After storage
Before storage
After storage
Water Activity
0
20
40
60
80
100
Bla
ck
Dis
eased
Faded B
Foxy
Gre
en
W D
Hulle
d e
ars
Insect d
am
aged
Mould
ed b
eans
Stin
ke
rs
Sound
Before storage
After storage
Before storage
After storage
% total
infection rates
0
5
10
15
20
25
30
35
40B
lack
Dis
eased
Faded B
Foxy
Gre
en
W D
Hulle
d e
ars
Insect d
am
aged
Mould
ed b
eans
Stin
ke
rs
Sound
Before storage
After storage
Before storage
After storage
% infection by
ochre group
0,0
10,0
20,0
30,0
40,0
50,0
60,0
70,0
80,0
Bla
ck
Dis
eased
Faded B
Foxy
Gre
en
W D
Hulle
d e
ars
Insect d
am
aged
Mould
ed b
eans
Stin
ke
rs
Sound
Before storage
After storage
Before storage
After storage
OTA contents
(ppb)

Kenya – 1 year storage (2004-2005) page10/17
Source: Gathiruini Date of collection: 14 May 04 Date of sorting/analysis: 10/22 May 2005 Region of origin: UM1 Date of milling: 20 may 2004 Date of sorting before storage: may 2004
Before storage
Classification Weight
kg % of total
% of beans
AW oC %
infection Dominant
taxa %Ochre infection
Ref/Lab OTA µg/kg
Black beans 1,26 1,3 1,3 0,51 22,5 85 Yellow Asp 29 2734/04-2968/04 3,9 4,5
Diseased beans 6,76 6,8 6,8 0,52 22,3 93 Black Asp 23 2733/04-2967/04 2,3 130,0
Foxy beans 0,20 0,2 0,2 0,51 22,7 81 Black Asp 16 2736/04-2970/04 5,0 11,6
Green W D B
Hulled ears 11,04 11,0 11,2 0,52 22,3 40 Unknown 7 3046/04-3047/04 0,5 0,5
Insect damage 0,46 0,5 0,5 0,51 22,3 92 Fusarium 23 2732/04-2966/04 499,3 75,1
Stinkers 0,01 0,0 0,0 N/A 2735/04-2969/04 1,5 3,5
Sound beans 79,00 79,0 80,0 0,53 22,7 66 Fusarium 17 3022/04-3023/04 0,2 0,1
Sub total 98,7 98,7 100,0
Pods and dust 1,27 1,3 N/A N/A
Husks/stones
Sweepings
Total 100,0 100,0
After storage
Classification Weight
kg % of total
% of beans
AW oC %
infection Dominant
taxa %Ochre infection
Ref/Lab OTA µg/kg
Black B 0,6 0,7 0,7 0,556 23,2 99 Yellow Asp 30 1608/05 131,5
Diseased 6,5 7,7 7,8 0,52 22,5 49 Black Asp 3 1609/05 40,2
Foxy b 0,3 0,4 0,4 0,544 23,5 67 Black Asp 7 1613/05 49,4
Green W D B 0,2 0,2 0,2 0,539 23,4 65 Yellow Asp 16 1610/05 5,1
Hulled ears 6,11 7,2 7,3 0,515 22,4 22 Green Asp 3 1607/05 1,7
Insect 0,2 0,2 0,2 0,536 22,8 72 Black Asp 11 1611/05 2,4
Stinkers
Sound 69,89 82,4 83,4 0,493 23,7 35 Black Asp 2 1612/05 0,7
Sub total 83,8 98,8 100,0
Pods and dust
Husks/stones 0,8 0,9 0,533 24,2
Sweepings 0,2 0,2 0,561 23,6
Total 84,8 100
STATISTICAL ANALYSIS Weight of defects Aw
Variation df Sum Squares Mean Squares F Variation df Sum Squares Mean Squares F
Storage 1 254,815 254,815 3,127 Storage 1 0,001 0,001 2,327
Residual 11 896,262 81,478 Residual 11 0,003 0,000
total 12 1151,077 total 12 0,004
before = after before = after
Total infection Infection by ochre group
Variation df Sum Squares Mean Squares F Variation df Sum Squares Mean Squares F
Storage 1 1016,529 1016,529 1,877 Storage 1 254,815 254,815 3,127
Residual 11 5958,548 541,686 Residual 11 896,262 81,478
total 12 6975,077 total 12 1151,077
before = after before = after
OTA
Variation df Sum Squares Mean Squares F
Storage 1 0,181 0,181 0,173 Residual 12 12,574 1,048 total 13 12,755
Before = After

Kenya – 1 year storage (2004-2005) page11/17
• No significant differences shown before and after storage
• Total infection: Fusarium have been replaced by Black Aspergillus after storage
0
5
10
15
20
25
30
Bla
ck b
eans
Dis
eased b
eans
Foxy b
eans
Gre
en
W D
B
Hulle
d e
ars
Inse
ct d
am
ag
e
Stin
ke
rs
Sound b
eans
Before storage
After storage
Before storageAfter storage
Infection
rates by
ochre (%)
0,0
20,0
40,0
60,0
80,0
100,0
% o
f d
efe
cts
Bla
ck
Dis
ea
se
d
Foxy
Gre
en
W D
Hulle
d e
ars
Inse
ct
Stin
ke
rs
Sound
Pods a
nd
Hu
sks/s
ton
Sw
eepin
gs
Before storage
After storage
Before storageAfter storage
Breakdown
by class of
defects
0,0
20,0
40,0
60,0
80,0
100,0
% o
f d
efe
cts
Bla
ck b
eans
Dis
eased b
eans
Foxy b
eans
Gre
en
W D
B
Hulle
d e
ars
Inse
ct d
am
ag
e
Stin
ke
rs
Sound b
eans
Before storage
After storage
Before storageAfter storage
Breakdown
by class of
beans
0,46
0,48
0,50
0,52
0,54
0,56
Bla
ck b
eans
Dis
eased b
eans
Foxy b
eans
Gre
en
W D
B
Hulle
d e
ars
Inse
ct d
am
ag
e
Stin
ke
rs
Sound b
eans
Before storage
After storage
Before storageAfter storage
Water
Activity
0
20
40
60
80
100
Bla
ck b
eans
Dis
eased b
eans
Foxy b
eans
Gre
en
W D
B
Hulle
d e
ars
Inse
ct d
am
ag
e
Stin
ke
rs
Sound b
eans
Before storage
After storage
Before storageAfter storage
Total
infection
rates (%)
0,0
50,0
100,0
150,0
200,0
250,0
300,0
Bla
ck b
eans
Dis
eased b
eans
Foxy b
eans
Gre
en
W D
B
Hulle
d e
ars
Inse
ct d
am
ag
e
Stin
ke
rs
Sound b
eans
Before storage
After storage
Before storageAfter storage
OTA
contents
(ppb)

Kenya – 1 year storage (2004-2005) page12/17
2.2. Mbuni Source: Barikongo/FCS Date of collection: 19 May 04 Region of origin: UM2 Date of sorting/analysis: 20 may 2004 Storage in beans for 1 year Date of sorting/analysis: 23 May – 1 June 05
Before storage
Classification Weight
kg % of total
% of beans
AW oC %
infection Dominant
taxa % Ochre infection
Ref/Lab OTA µg/kg
OTA µg/kg
Black beans 7,54 7,5 8,0 0,528 22,8 88 Yellow Asp 43 2739/04-2973/04 2,2 0,3
Diseased beans 21,90 21,9 23,3 0,536 22,6 92 Black Asp 21 2738/04-2972/04 2,3 0,4
Faded beans
Foxy beans 1,22 1,2 1,3 0,542 23,1 88 Black Asp 18 2741/04-2975/04 28,1 169,5
Green W D B
Hulled ears 0,40 0,4 0,4 0,550 22,6 81 Black Asp 14 3048/04-3049/04 1,7 0,6
Insect damage 1,02 1,0 1,1 0,533 22,4 92 Black Asp 35 2737/04-2971/04 2,7 10,9
Stinkers 0,34 0,3 0,4 0,555 23,0 89 Black Asp 20 2740/04-2974/04 3,7 1,3
Sound beans 61,60 61,6 65,5 0,525 23,4 91 Black Asp 10 3024/04-3025/04 0,2 0,4
Sub total 94,0 94,0 100,0
Pods and dust 5,98 6,0 Sweepings
Total 100,00 100,00
After storage
Classification Weight
kg % of total
% of beans
AW °C %
infection Dominant
taxa % Ochre infection
Ref/Lab OTA µg/kg
Black B 4,40 4,5 4,5 0,575 22,5 86 Green Asp 6 2149/05 1,6 Diseased 14,10 14,5 14,6 0,582 22,3 77 Black Asp 63 2146/05 82,0
Faded beans 0,10 0,1 0,1 0,59 23,0
Foxy b 2,16 2,2 2,2 0,59 22,5 87 Black Asp 5 2148/05 7,4
Green W D B 1,90 2,0 2,0 0,587 22,7 93 Black Asp 12 2150/05 1,0
Hulled ears 3,00 3,1 3,1 0,573 22 97 Black Asp 2 2145/05 29,6
Insect 0,53 0,5 0,5 0,585 22,2 100 Black Asp 11 2147/05 0,4
Stinkers 0,13 0,1 0,1 0,587 22,3 94 Black Asp 4 2144/05 32,1
Sound 70,50 72,7 72,8 0,573 22,8 90 Black Asp 64 2143/05 1,5
Sub total 96,82 99,8 100,0
Pods 0,08 0,1 0,579 23,1
Sweepings 0,10 0,1 0,587 23,5
Total 97,00 100,00
STATISTICAL ANALYSIS
Weight of defects Aw
Variation df Sum Squares Mean Squares F Variation df Sum Squares Mean Squares F
Storage 1 39,683 39,683 0,070 Storage 1 0,008 0,008 93,524
Residual 13 7916,565 565,469 Residual 14 0,001 0,000
total 14 7956,247 total 15 0,009
Before = After Before < After
Total infection Infection by ochre group
Variation df Sum Squares Mean Squares F Variation df Sum Squares Mean Squares F
Storage 1 11,905 11,905 0,341 Storage 1 16,858 16,858 0,038
Residual 13 453,429 34,879 Residual 13 5756,875 442,837
total 14 465,333 total 14 5773,733
Before = After Before = After
OTA Variation df Sum Squares Mean Squares F
Storage 5 0,299 0,060 0,054
Residual 8 8,861 1,108
total 13 9,160 Before = After

Kenya – 1 year storage (2004-2005) page13/17
• No significant differences shown before and after storage for weight of defects, total infection rates, infection by ochre group and OTA contamination
• Increase of water activity after storage
• Dominant taxa are similar before and after storage
0,0
20,0
40,0
60,0
80,0
Bla
ck
Dis
ea
se
d
Faded
Foxy
Gre
en
W D
Hulle
d e
ars
Inse
ct
Stin
ke
rs
Sound
Pods a
nd
Sw
eepin
gs
Before storage
After storage
Before storage
After storage
Breakdown
by class of
defects (%)
0,0
20,0
40,0
60,0
80,0
Bla
ck b
eans
Dis
eased b
eans
Faded b
eans
Foxy b
eans
Gre
en
W D
B
Hulle
d e
ars
Inse
ct d
am
ag
e
Stin
ke
rs
Sound b
eans
Before storage
After storage
Before storage
After storage
Breakdown
by class of
beans (%)
0,480
0,500
0,520
0,540
0,560
0,580
0,600
Bla
ck b
eans
Dis
eased b
eans
Faded b
eans
Foxy b
eans
Gre
en
W D
B
Hulle
d e
ars
Inse
ct d
am
ag
e
Stin
ke
rs
Sound b
eans
Before storage
After storage
Before storage
After storage
Water Activity
0
20
40
60
80
100
Bla
ck b
eans
Dis
eased b
eans
Faded b
eans
Foxy b
eans
Gre
en
W D
B
Hulle
d e
ars
Inse
ct d
am
ag
e
Stin
ke
rs
Sound b
eans
Before storage
After storage
Before storage
After storage
Total infection
rates (%)
0
10
20
30
40
50
60
70
Bla
ck b
eans
Dis
eased b
eans
Faded b
eans
Foxy b
eans
Gre
en
W D
B
Hulle
d e
ars
Inse
ct d
am
ag
e
Stin
ke
rs
Sound b
eans
Before storage
After storage
Before storage
After storage
% Infection by
ochre group
0,0
20,0
40,0
60,0
80,0
100,0
Bla
ck b
eans
Dis
eased b
eans
Faded b
eans
Foxy b
eans
Gre
en
W D
B
Hulle
d e
ars
Inse
ct d
am
ag
e
Stin
ke
rs
Sound b
eans
Before storage
After storage
Before storage
After storage
OTA contents
(ppb)

Kenya – 1 year storage (2004-2005) page14/17
Source: Kaimbu Date of collection: 28 May 04
Region of origin: UM2 Date of sorting before storage: june 2004 Date of milling: june 2004 Date of sorting/analysis: 24 May – 27 June 05
Before storage
Classification Weight
kg % of total
% of beans
AW oC %
infection Dominant
taxa %Ochre infection
Ref/Lab OTA µg/kg
OTA µg/kg
Black beans 7,16 7,2 7,3 0,54 21,1 100 Yellow Asp 57 2744/04-2978/04 0,6 3,5
Diseased beans 17,72 17,7 18,0 0,54 21,4 98 Black Asp 24 2743/04-2977/04 1,2 146,0
Faded beans
Foxy beans 1,56 1,6 1,6 0,56 22,4 100 Black Asp 6 2745/04-2979/04 727,0 241,9
Green W D B
Hulled ears 7,14 7,1 7,3 0,56 21,1 85 Black Asp 12 3050/04-3051/04 0,5 0,6
Insect damage 1,22 1,2 1,2 0,55 20,5 97 Black Asp 22 2742/04-2976/04 21,4 0,9
Stinkers 0,26 0,3 0,3 0,54 21,1 100 Black Asp 29
Sound beans 63,30 63,3 64,4 0,55 22,4 100 Black Asp 27 3026/04-3027/04 0,9 0,2
Sub total 98,36 98,4 100,0
Pods and dust 1,64 1,6 N/A N/A
Sweepings
Total 100,00 100,00
After storage
Classification Weight
kg % of total
% of beans
AW oC %
infection Dominant
taxa %Ochre infection
Ref/Lab OTA µg/kg
Black Beans 6,03 6,2 6,2 0,603 21,2 90,0 Black Asp 14,0 2157/05 0,9
Diseased beans 15,44 15,8 15,9 0,608 20 93,0 Black Asp 4,0 2154/05 11,5
Faded 0,2 0,2 0,2 Black Asp 5,0
Foxy beans 2,04 2,1 2,1 0,624 20,4 83,0 Black Asp 4,0 2156/05 420,8
Green W D B 1,75 1,8 1,8 0,617 20,3 87,0 Black Asp 8,0 2158/05 46,9
Hulled ears 6,89 7,0 7,1 0,616 20,3 74,0 Black Asp 5,0 2153/05 0,7
Insect 1,2 1,2 1,2 0,62 20 100,0 Black Asp 1,0 2155/05 6,1
Stinkers 0,31 0,3 0,3 0,63 20,7 98,0 Black Asp 0,0 2152/05 2,5
Sound beans 63,4 64,8 65,2 0,6 20,7 92,0 Black Asp 4,0 2151/05 1,3
Sub total 97,3 99,4 100,0
Pods 0,19 0,2 0,632 21,3 Black Asp
Sweepings 0,37 0,4 0,644 20,7
Total 97,82 100,0
STATISTICAL ANALYSIS
Weight of defects Aw
Variation df Sum Squares Mean Squares F Variation df Sum Squares Mean Squares F
Storage 1 39,683 39,683 0,084 Storage 1 0,0162 0,0162 180,980
Residual 14 6635,471 473,962 Residual 13 0,0012 0,000090
total 15 6675,153097 total 14 0,017374
Before = After Before < After
Total infection Infection by ochre group
Variation df Sum Squares Mean Squares F Variation df Sum Squares Mean Squares F
Storage 1 211,001 211,001 4,090 Storage 1 1620,321 1620,321 13,208
Residual 13 670,732 51,595 Residual 14 1717,429 122,673
total 14 881,7333333 total 15 3337,750
Before = After Before ≠ After
OTA
Variation df Sum Squares Mean Squares F
Storage 5 0,021 0,004 0,002
Residual 6 13,704 2,284
total 11 13,725
Before = After
Kenya – 1 year storage (2004-2005) page15/17
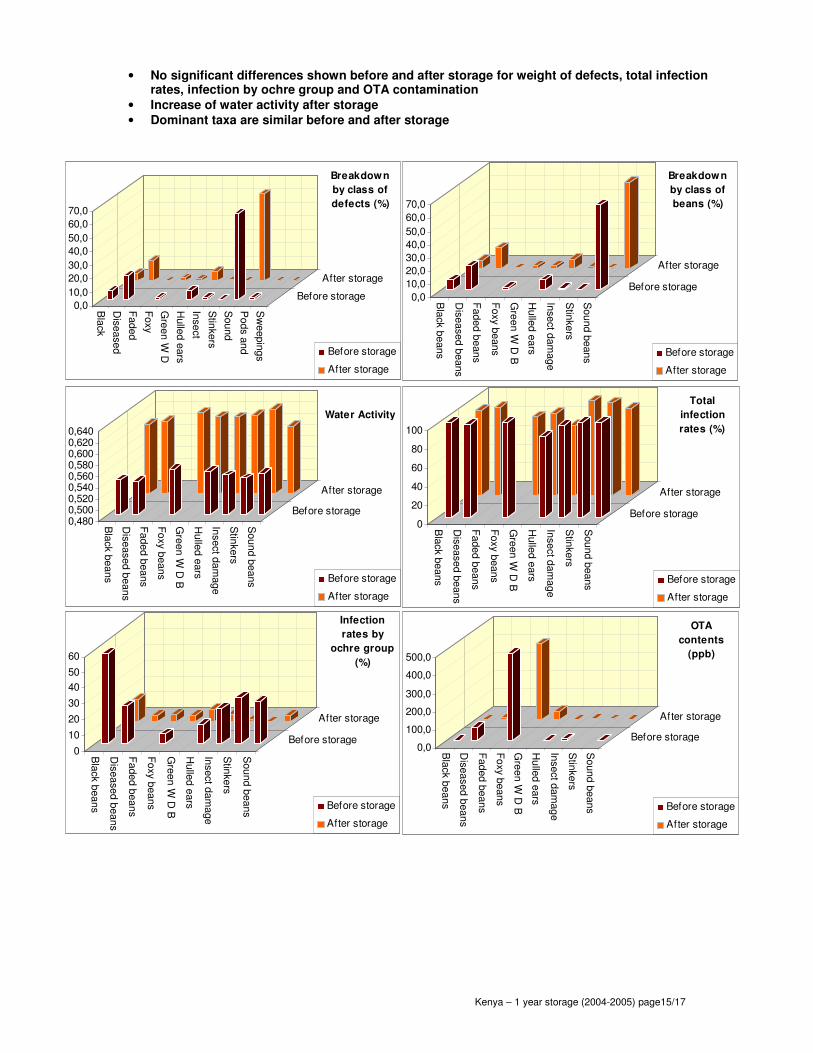
• No significant differences shown before and after storage for weight of defects, total infection rates, infection by ochre group and OTA contamination
• Increase of water activity after storage
• Dominant taxa are similar before and after storage
0,0
10,0
20,0
30,0
40,0
50,0
60,0
70,0
Bla
ck
Dis
ea
se
d
Faded
Foxy
Gre
en
W D
Hulle
d e
ars
Inse
ct
Stin
ke
rs
Sound
Pods a
nd
Sw
eepin
gs
Before storage
After storage
Before storage
After storage
Breakdown
by class of
defects (%)
0,0
10,0
20,0
30,0
40,0
50,0
60,0
70,0
Bla
ck b
eans
Dis
eased b
eans
Faded b
eans
Foxy b
eans
Gre
en
W D
B
Hulle
d e
ars
Inse
ct d
am
ag
e
Stin
ke
rs
Sound b
eans
Before storage
After storage
Before storage
After storage
Breakdown
by class of
beans (%)
0,4800,5000,5200,5400,5600,5800,6000,6200,640
Bla
ck b
eans
Dis
eased b
eans
Faded b
eans
Foxy b
eans
Gre
en
W D
B
Hulle
d e
ars
Inse
ct d
am
ag
e
Stin
ke
rs
Sound b
eans
Before storage
After storage
Before storage
After storage
Water Activity
0
20
40
60
80
100
Bla
ck b
eans
Dis
eased b
eans
Faded b
eans
Foxy b
eans
Gre
en
W D
B
Hulle
d e
ars
Inse
ct d
am
ag
e
Stin
ke
rs
Sound b
eans
Before storage
After storage
Before storage
After storage
Total
infection
rates (%)
0
10
20
30
40
50
60
Bla
ck b
eans
Dis
eased b
eans
Faded b
eans
Foxy b
eans
Gre
en
W D
B
Hulle
d e
ars
Inse
ct d
am
ag
e
Stin
ke
rs
Sound b
eans
Before storage
After storage
Before storage
After storage
Infection
rates by
ochre group
(%)
0,0
100,0
200,0
300,0
400,0
500,0
Bla
ck b
eans
Dis
eased b
eans
Faded b
eans
Foxy b
eans
Gre
en
W D
B
Hulle
d e
ars
Inse
ct d
am
ag
e
Stin
ke
rs
Sound b
eans
Before storage
After storage
Before storage
After storage
OTA
contents
(ppb)

Kenya – 1 year storage (2004-2005) page16/17
D – OTA CONTAMINATION AND DEFECTS
1. P3
Before storage After storage
Azania P3 kg OTA (ppb)
OTA % OTA Azania P3 kg OTA (ppb)
OTA % OTA
Black 1,0 3,16 3,10 45,3 Black 0,89 traces 0,00 0,9
Diseased 7,4 0,50 3,73 54,5 Diseased 11,32 traces 0,01 11,3
Foxy 0,00 Foxy 0,35 traces 0,00 0,4
Hulled ears 6,3 0,00 Hulled ears 7,70 traces 0,01 7,7
Insect damaged 1,1 <0,02 0,02 0,2 Insect damaged 1,75 traces 0,00 1,8
Stinkers Stinkers 0,07 0,00 0,0
Sound 84,2 Sound 77,93 traces 0,08 78,0
Total 100,0 6,85 0,1 Total 100,0 0,10 0,0
Before storage After storage
Kirura P3 OTA (ppb) mean OTA % OTA Kirura P3 kg OTA (ppb)
OTA % OTA
Black beans 2,4 0,2 0,9 0,6 1,31 0,1 Black 1,2 77,8 91,42 34,0
Diseased beans 15,9 152,6 0,3 76,5 1218,95 98,4 Diseased beans 15,9 9,3 148,04 55,1
Faded beans 0,0 Faded B 4,7 1,2 5,42
Foxy beans 1,1 0,3 3,1 1,7 1,83 0,1 Foxy 1,2 5,6 6,54 2,4
Green W D 0,0 Green W D 0,3
Hulled ears 9,3 0,2 0,3 0,3 2,33 0,2 Hulled ears 5,9 0,0
Insect damage 0,6 10,0 0,5 5,3 2,94 0,2 Insect damaged 0,6 3,4 2,00 0,7
Moulded beans 0,0 Moulded beans 0,1
Stinkers 0,2 5,1 2,5 3,8 0,87 0,1 Stinkers
Sound beans 70,5 0,1 0,2 0,2 10,57 0,9 Sound 70,2 0,2 15,08 5,62
Total 100,0 1238,80 12,4 Total 100,0 268,50 2,7
Before storage After storage
Gathiruini P3 OTA (ppb) mean OTA % OTA Gathiruini P3 kg OTA (ppb)
OTA % OTA
Black beans 1,3 3,9 4,5 4,2 5,33 0,9 Black beans 0,7 131,5 94,12 18,9
Diseased beans 6,8 2,3 130,0 66,1 452,79 74,4 Diseased beans 7,8 40,2 311,88 62,7
Foxy beans 0,2 5,0 11,6 8,3 1,68 0,3 Foxy beans 0,4 49,4 17,68 3,6
Green W D B 0,0 Green W D B 0,2 5,1 1,21 0,2
Hulled ears 11,2 0,5 0,5 0,5 5,55 0,9 Hulled ears 7,3 1,7 12,37 2,5
Insect damage 0,5 499,3 75,1 287,2 133,79 22,0 Insect damage 0,2 2,4 0,57 0,1
Stinkers 0,0 1,5 3,5 2,5 0,03 0,0 Stinkers
Sound beans 80,0 0,2 0,1 0,1 9,64 1,6 Sound beans 83,4 0,7 59,47 12,0
Total 100,0 608,80 6,1 Total 100,0 497,30 5,0
0,010,020,030,040,050,060,070,080,090,0
100,0
Bla
ck b
eans
Dis
eased b
eans
Faded b
eans
Foxy b
eans
Gre
en
W D
Hulle
d e
ars
Inse
ct
da
ma
ge
Mould
ed b
eans
Stin
ke
rs
Sound b
eans
Kirura before
Kirura after
Gathiruini before
Gathiruni after
Kirura before Kirura after
Gathiruini before Gathiruni after
Weighted
contamination by
class of defects
(%)

Kenya – 1 year storage (2004-2005) page17/17
2. Mbuni
Before storage After storage
Azania Mbuni kg OTA (ppb) OTA % OTA Azania Mbuni kg OTA (ppb) OTA % OTA
Black beans 3,0 0,20 0,59 38,2 Black beans 7,4 0,1 0,56 9,2
Diseased beans 23,1 <0,02 0,35 22,5 Diseased beans 32,8 traces 0,03 0,5
Foxy beans 1,7 0,23 0,39 25,7 Foxy beans 0,8 traces 0,00 0,0
Hulled ears 2,3 Hulled ears 3,3 0,1 0,37 6,0
Insect damage 1,0 <0,02 0,01 1,0 Insect damage 1,1 0,1 0,14 2,3
Stinkers 1,2 0,10 0,13 8,3 Stinkers 1,1 4,4 4,98 81,1
sound beans 67,6 traces 0,07 4,4 sound beans 53,3 traces 0,05 0,9
Total 100,0 1,54 0,0 Total 100,0 6,14 0,1
Before storage After storage
Kiambu Mbuni OTA (ppb) mean OTA % OTA Kiambu Mbuni kg OTA (ppb) OTA % OTA
Black beans 7,3 0,6 3,5 2,0 14,62 0,7 Black B 6,2 0,9 5,49 0,4
Diseased beans 18,0 1,2 146,0 73,6 1326,30 61,4 Diseased 15,9 11,5 182,32 14,6
Faded beans Faded 0,2
Foxy beans 1,6 727,0 241,9 484,4 768,32 35,6 Foxy beans 2,1 420,8 882,70 70,5
Green W D B Green W D B 1,8 46,9 84,35 6,7
Hulled ears 7,3 0,5 0,6 0,5 3,80 0,2 Hulled ears 7,1 0,7 5,27 0,4
Insect damage 1,2 21,4 0,9 11,2 13,85 0,6 Insect 1,2 6,1 7,47 0,6
Stinkers 0,3 Stinkers 0,3 2,5 0,80 0,1
Sound beans 64,4 0,9 0,2 0,5 32,46 1,5 Sound 65,2 1,3 84,43 6,7
Total 100,0 2159,35 21,6 Total 100,0 1252,83 12,5
Before storage After storage
Barikongo Mbuni OTA (ppb) mean OTA % OTA Barikongo Mbuni kg OTA (ppb) OTA % OTA
Black beans 8,0 2,2 0,3 1,3 10,16 5,1 Black B 4,5 1,6 7,14 0,5
Diseased beans 23,3 2,3 0,4 1,3 30,50 15,4 Diseased 14,6 82,0 1193,70 83,9
Faded beans Faded beans 0,1
Foxy beans 1,3 28,1 169,5 98,8 128,17 64,7 Foxy b 2,2 7,4 16,49 1,2
Green W D B Green W D B 2,0 1,0 2,02 0,1
Hulled ears 0,4 1,7 0,6 1,2 0,49 0,2 Hulled ears 3,1 29,6 91,81 6,5
Insect damage 1,1 2,7 10,9 6,8 7,37 3,7 Insect 0,5 0,4 0,20 0,0
Stinkers 0,4 3,7 1,3 2,5 0,92 0,5 Stinkers 0,1 32,1 4,31 0,3
Sound beans 65,5 0,2 0,4 0,3 20,53 10,4 Sound 72,8 1,5 106,60 7,5
Total 100,0 198,14 2,0 Total 100,0 1422,27 14,2
0,0
10,0
20,0
30,0
40,0
50,0
60,0
70,0
80,0
90,0
Bla
ck b
eans
Dis
eased b
eans
Faded b
eans
Foxy b
eans
Gre
en
W D
B
Hulle
d e
ars
Insect dam
age
Stin
ke
rs
Sound b
eans
Kiambu before
Kiambu after
Barikongo before
Barikong after
Kiambu before Kiambu after
Barikongo before Barikong after
Weighted
contamination by
class of defects
(%)