enhanced production of alkaline proteases by bacillus sphaericus using fed-batch culture
TRANSCRIPT
Process Biochemistry 39 (2004) 1093–1101
Enhanced production of alkaline proteases byBacillus sphaericus using fed-batch culture
Jasvir Singh, R.M. Vohra, D.K. Sahoo∗
Biochemical Engineering Research and Process Development Center, Institute of Microbial Technology,Sector-39 A, Chandigarh, India
Received 9 July 2002; received in revised form 22 April 2003; accepted 8 June 2003
Abstract
Bacillus sphaericus, an obligate alkalophile, overproduces extracellular alkaline proteases. Kinetics of growth and protease production bythis organism were analyzed to identify parameters that control protease synthesis. Results showed protease production to be both growth andnon-growth associated although a major portion of the enzyme was secreted in post exponential phases. The initial concentration of glucoseand nitrogen sources significantly affected cell growth and enzyme secretion. Fed-batch cultures were performed to maximize protease activityin a bioreactor. By using suitable feeding strategies, the protease activity and its productivity in a fed-batch process was increased by 44% overthat in batch process, primarily due to the longer maintenance of increased rates of growth and enzyme production by providing continuousand controlled supply of additional substrate and nutrients.© 2003 Elsevier Ltd. All rights reserved.
Keywords: Bacillus sphaericus; Alkaline protease; Kinetic analysis; Fed-batch culture
1. Introduction
Alkaline proteases are one of the most widely studiedgroups of enzymes because of their use in many industrialapplications such as in food, pharmaceutical, leather and de-tergent industries. Bacteria of the genusBacillus are activeproducers of extracellular alkaline proteases. During a searchfor novel enzymes, an alkalophilicBacillus sphaericus wasisolated from Himalayan soils[1]. Alkaline proteases fromthis organism showed chlorine compatibility in addition toits potential as an additive in laundry detergents and in re-covering silver from used X-ray film. Two novel extracel-luar proteases were purified to homogeneity from cell freeculture filtrate and the major protease (98% of total proteaseactivity) was found to be a serine protease[2]. However,B.sphaericus has been generally studied because of its abilityto produce a protein parasporal body, which is highly toxic,if eaten by susceptible mosquito larvae[3] and there arevery few reports on production of alkaline proteases fromthis organism[4]. The biosynthesis of serine proteases bythis organism was found to be dependent on the nature of
∗ Corresponding author.E-mail address: [email protected] (D.K. Sahoo).
nitrogen source in the medium. A combination of yeast ex-tract, biopeptone and glucose (as carbon source) producedbest results[5].
Industrial fermentation is moving away from traditionaland largely empirical operation towards knowledge basedand better-controlled process. The rational design and opti-mization of the latter requires the understanding of produc-tion kinetics. Although, there have been a number of studieson protease production byBacillus species, little informa-tion on kinetic analysis of the protease production processis available in literature[6–9]. The aim of this study wasto analyze the kinetics of protease production process andidentify parameters that control protease synthesis. The in-formation was used to design a fed-batch process to enhancethe production of the enzyme.
2. Materials and methods
2.1. Materials
Biopeptone, a combination of mixed peptones derivedfrom fresh meat and milk proteins, was obtained fromHIMEDIA, Mumbai, India. Azocasein was purchased from
0032-9592/$ – see front matter © 2003 Elsevier Ltd. All rights reserved.doi:10.1016/S0032-9592(03)00217-6

1094 J. Singh et al. / Process Biochemistry 39 (2004) 1093–1101
Sigma (St. Louis, MO) and other chemicals were of analyt-ical grade or highest grade available.
2.2. Culture conditions
An obligate alkalophilicB. sphaericus, isolated from al-kaline Himalayan soils of India, was employed in this study[1]. The medium for pre-inoculum, inoculum as well as en-zyme production consisted of glucose (10.0 g l−1), biopep-tone (5.0 g l−1), yeast extract (5.0 g l−1), KH2PO4 (1.0 gl−1), MgSO4·7H2O (0.2 g l−1) and Na2CO3 (10.0 g l−1). Asolution of Na2CO3 was sterilized separately and then addedto the medium. Pre-inocula were developed by transferringfreshly grown cells from a skim milk agar plate into 250ml flasks, each containing 50 ml of medium and incubatingthe flasks at 30◦C and 200 rpm on a rotary shaker. 10 mlof this pre-inoculum was used to inoculate each of 500 mlflasks containing 100 ml medium and the flasks were incu-bated an a rotary shaker at 200 rpm and 30◦C for 12 h toserve as inoculum for the fermenter. A 7 l Chemap fermenter(Chemap AG, Switzerland) with 5 l working volume wasused in this investigation. The initial pH of the medium wasadjusted to 10.0 with sterile Na2CO3 solution and was notcontrolled during the course of fermentation. Temperaturewas controlled at 30◦C and air flow rate (5 l min−1) andagitation speed (300 rpm) were kept constant during batchand fed-batch stages.
Fig. 1. Batch production of alkaline proteases byB. sphaericus. The fermentation medium contained glucose (10.0 g l−1), yeast extract (5.0 g l−1),biopeptone (5.0 g l−1), KH2PO4 (1.0 g l−1), MgSO4·7H2O (0.2 g l−1) and Na2CO3 (10.0 g l−1). The temperature of the fermenter was controlled at30◦C and air flow rate and agitation rate were maintained at 1 vvm and 300 rpm, respectively.
2.3. Assays
The cell dry weight (CDW) was determined after centrifu-gation of a known amount of fermented broth and washingthe pellets twice followed by drying the washed pellets at95◦C till constant weight. Extracellular proteolytic activityon azocasein was estimated as described previously[1] andtotal reducing sugars were determined by DNS method[10].
3. Results and discussion
3.1. Production of alkaline protease in batch reactor
The results of a batch protease production byB. sphaeri-cus are presented inFig. 1. Cell growth started immediatelyafter inoculation of the bioreactor where as the secretion ofprotease could be observed only after 3 h. This might bedue to a requirement of a critical cell mass level for startingprotease synthesis. Exponential growth was observed fora short period (3–6 h), followed by a decelerating growthphase and subsequently, the culture entered stationaryphase. However, the existence of different phases of growthand product formation need to be confirmed from appro-priate kinetic parameters estimated by kinetic analysis ofthe fermentation process. Such kinetic analysis would alsohelp in process design and scale up. Following the initial 3h, protease production increased with increase in cell mass
J. Singh et al. / Process Biochemistry 39 (2004) 1093–1101 1095
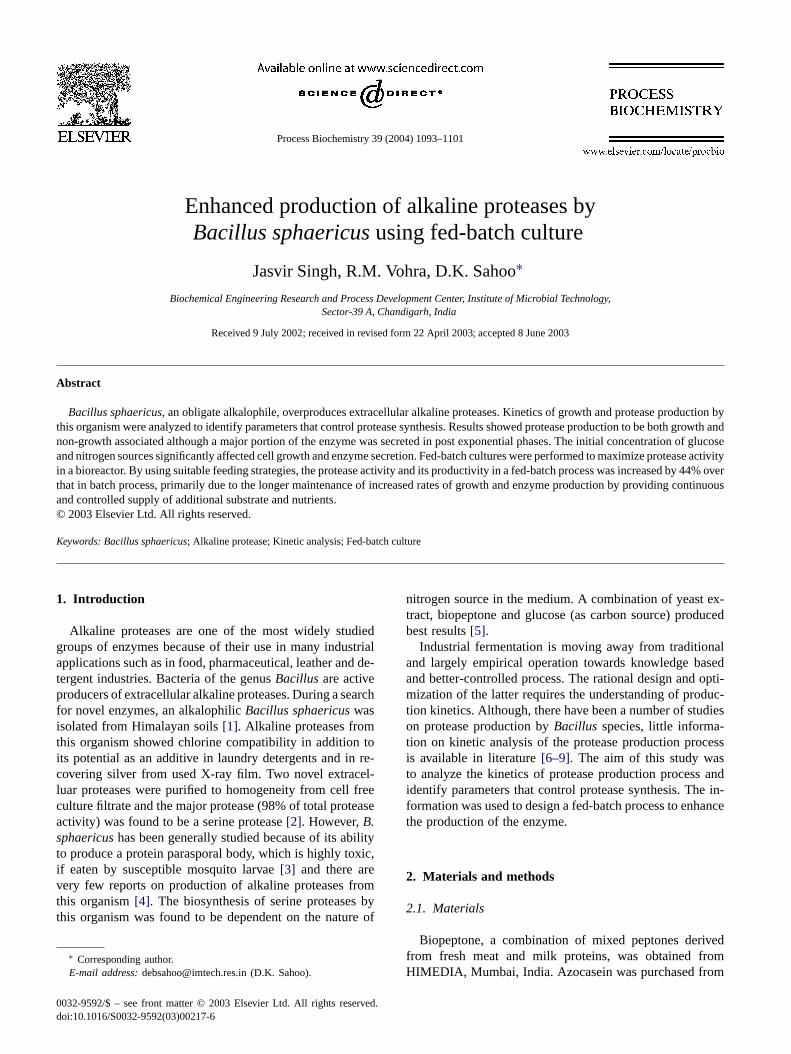
Fig. 2. Rate profiles of growth (dX/dt), protease formation (dP/dt) and glucose utilization (dS/dt) in a batch process. The experimental conditions aredescribed inFig. 1.
and seemed to be growth associated. Maximum cell growthwas obtained at 10 h. However, maximum protease activitywas secreted during the decelerating growth phase and sub-sequent stationary phase signifying non-growth associatedproduction phase. Although the highest protease activity of680 000 U ml−1 was secreted at 30 h, the fermentation timeof 24 h, yielding enzyme activity of 670 000 U ml−1 with aproductivity of 27 917 U l−1 h−1, was considered to be op-timum. The medium pH declined from 10.0 to 9.05 in 6 hthat seemed to be the end of exponential growth phase andthen, pH started to rise again till it reached 9.55 at 30 h. Thisdecline of medium pH might be due to the result of acid pro-duction from glucose utilization during growth phase andonce growth rate reduced, pH started to rise. This pH trendduring fermentation was found to be a good indicator of thestate (start or end) of protease production. A rise in culturepH due to production of free amino acid during protease fer-mentation has been reported before[7,11]. Cellular growthwas also accompanied by glucose utilization and a fall indissolved oxygen (DO) concentration. A sharp rise in DOwas observed when the culture reached stationary phase andthe glucose left at the end of exponential phase was utilizedduring post exponential protease production.
On plotting the rate of cell growth (dX/dt), protease pro-duction (dP/dt) and glucose utilization (dS/dt) as a functionof fermentation time, as presented inFig. 2, it was observedthat the enzyme production rate was lagging behind growthrate by 2–3 h in reaching its peak and maximum dP/dtwas obtained in post-exponential growth phase. Increase indX/dt and dP/dt was accompanied by an increase in sub-strate utilization rate (dS/dt) and the peak of growth ratecoincided with the peak of substrate utilization rate. Glu-cose uptake (dS/dt) and enzyme secretion (dP/dt) continuedeven when growth rate (dX/dt) reached zero. Protease secre-tion rate (dP/dt) became zero when substrate consumption
ceased (dS/dt= 0). This supported our earlier observationthat glucose is required for post growth enzyme synthesis.
3.2. Kinetic analysis of batch alkaline proteasefermentation
The kinetics of protease synthesis byB. sphaericus wasanalyzed using a model proposed by Kono and Asai[13,14].Previously, this model has been used for kinetic analysisof a number of fermentation processes including lacticacid, sorbose, citric acid, novobiocin, glycerol and animalcell cultures[13–16]. It is an unstructured model approachwhere cells as a whole are treated as biocatalysts whose con-centration increase with cell growth and activity, and couldchange during the course of the process. The growth of thiscatalyst could be controlled by manipulation of physicaland chemical parameters like temperature, pH, substrateconcentration, oxygen supply etc. This model consideredcell growth to be made up of lag phase, transition phase,exponential phase, post-exponential phase, stationary phaseand death phase and a concept of critical cell concentration,defined as the concentration beyond which exponentialgrowth was not possible, was also introduced. Since a majorportion of alkaline protease production takes place in postexponential growth phase, this approach becomes even morerelevant.
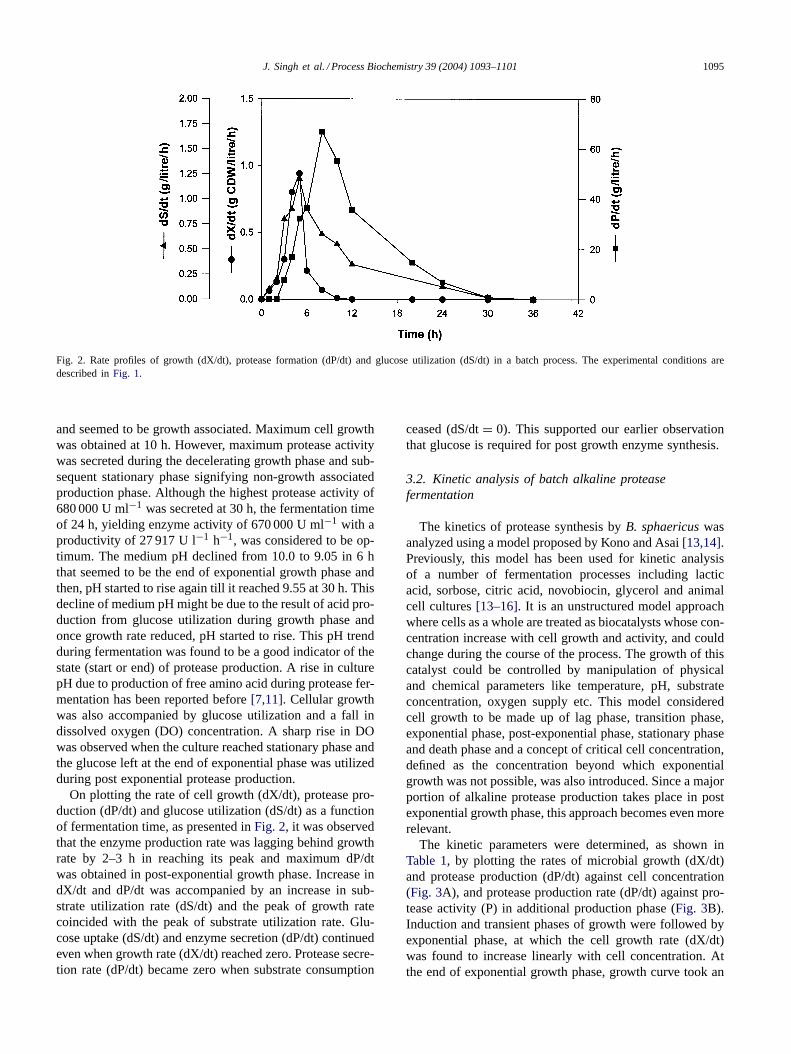
The kinetic parameters were determined, as shown inTable 1, by plotting the rates of microbial growth (dX/dt)and protease production (dP/dt) against cell concentration(Fig. 3A), and protease production rate (dP/dt) against pro-tease activity (P) in additional production phase (Fig. 3B).Induction and transient phases of growth were followed byexponential phase, at which the cell growth rate (dX/dt)was found to increase linearly with cell concentration. Atthe end of exponential growth phase, growth curve took an
1096 J. Singh et al. / Process Biochemistry 39 (2004) 1093–1101
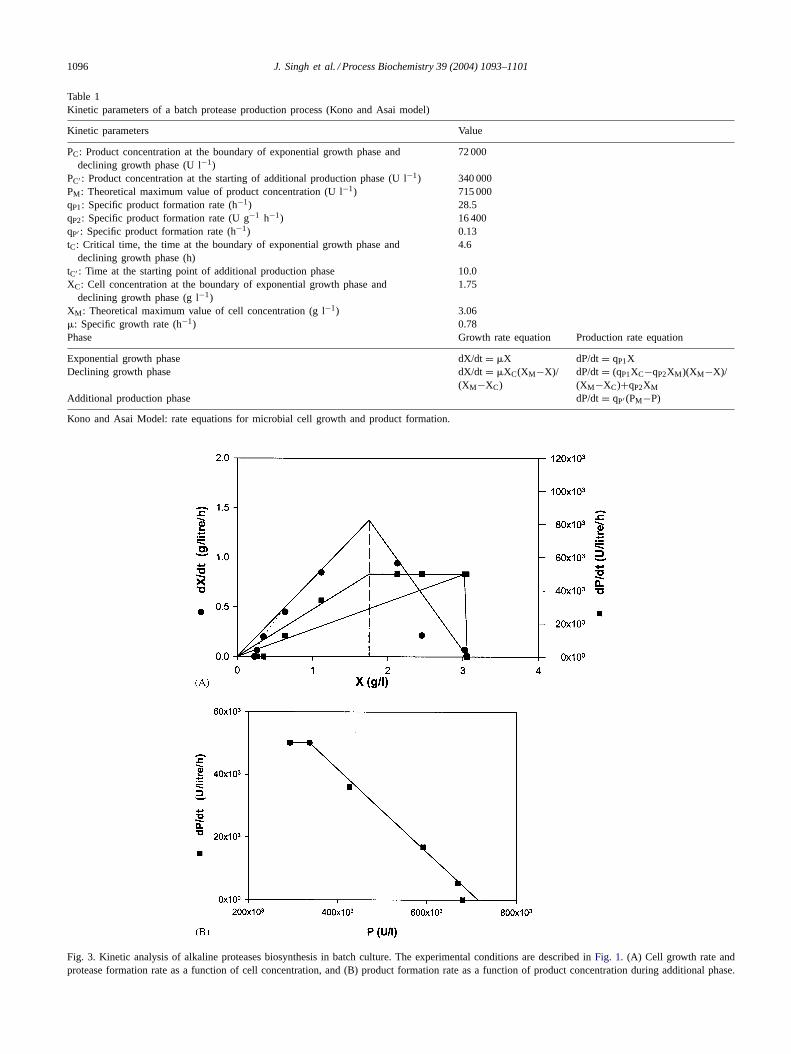
Table 1Kinetic parameters of a batch protease production process (Kono and Asai model)
Kinetic parameters Value
PC: Product concentration at the boundary of exponential growth phase anddeclining growth phase (U l−1)
72 000
PC′ : Product concentration at the starting of additional production phase (U l−1) 340 000PM: Theoretical maximum value of product concentration (U l−1) 715 000qP1: Specific product formation rate (h−1) 28.5qP2: Specific product formation rate (U g−1 h−1) 16 400qP′ : Specific product formation rate (h−1) 0.13tC: Critical time, the time at the boundary of exponential growth phase and
declining growth phase (h)4.6
tC′ : Time at the starting point of additional production phase 10.0XC: Cell concentration at the boundary of exponential growth phase and
declining growth phase (g l−1)1.75
XM: Theoretical maximum value of cell concentration (g l−1) 3.06�: Specific growth rate (h−1) 0.78Phase Growth rate equation Production rate equation
Exponential growth phase dX/dt= �X dP/dt= qP1XDeclining growth phase dX/dt= �XC(XM−X)/
(XM−XC)dP/dt= (qP1XC−qP2XM)(XM−X)/(XM−XC)+qP2XM
Additional production phase dP/dt= qP′ (PM−P)
Kono and Asai Model: rate equations for microbial cell growth and product formation.
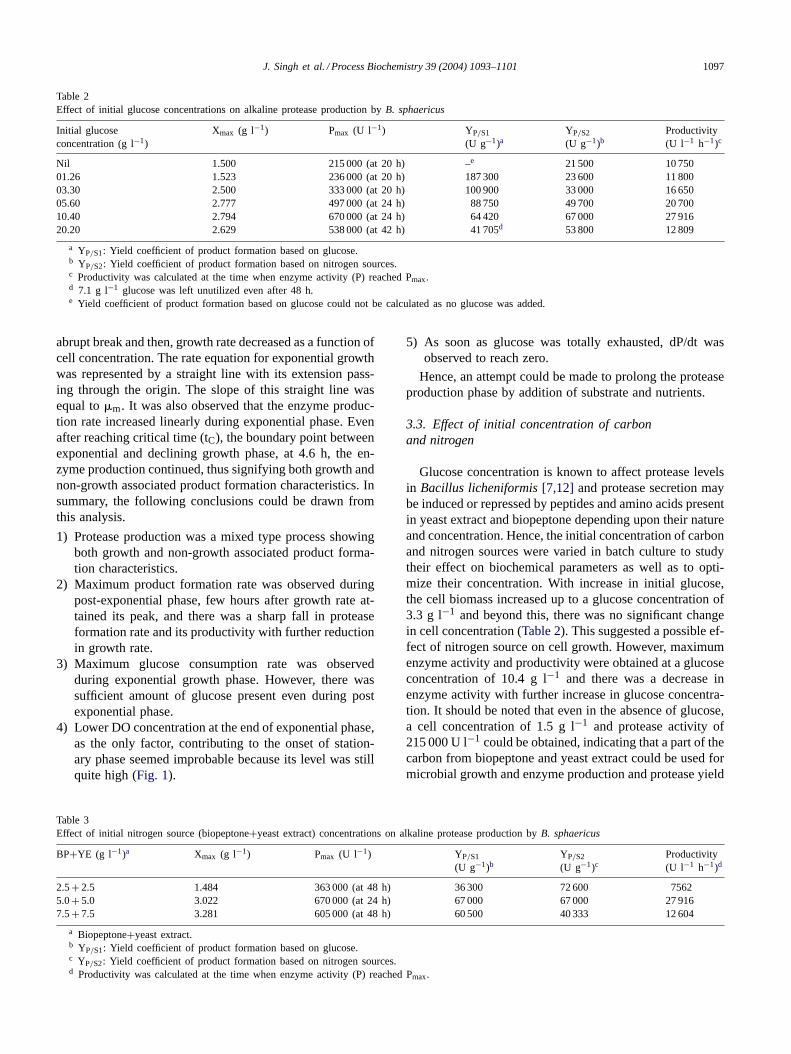
Fig. 3. Kinetic analysis of alkaline proteases biosynthesis in batch culture. The experimental conditions are described inFig. 1. (A) Cell growth rate andprotease formation rate as a function of cell concentration, and (B) product formation rate as a function of product concentration during additionalphase.
J. Singh et al. / Process Biochemistry 39 (2004) 1093–1101 1097
Table 2Effect of initial glucose concentrations on alkaline protease production byB. sphaericus
Initial glucoseconcentration (g l−1)
Xmax (g l−1) Pmax (U l−1) YP/S1
(U g−1)aYP/S2
(U g−1)bProductivity(U l−1 h−1)c
Nil 1.500 215 000 (at 20 h) –e 21 500 10 75001.26 1.523 236 000 (at 20 h) 187 300 23 600 11 80003.30 2.500 333 000 (at 20 h) 100 900 33 000 16 65005.60 2.777 497 000 (at 24 h) 88 750 49 700 20 70010.40 2.794 670 000 (at 24 h) 64 420 67 000 27 91620.20 2.629 538 000 (at 42 h) 41 705d 53 800 12 809
a YP/S1: Yield coefficient of product formation based on glucose.b YP/S2: Yield coefficient of product formation based on nitrogen sources.c Productivity was calculated at the time when enzyme activity (P) reached Pmax.d 7.1 g l−1 glucose was left unutilized even after 48 h.e Yield coefficient of product formation based on glucose could not be calculated as no glucose was added.
abrupt break and then, growth rate decreased as a function ofcell concentration. The rate equation for exponential growthwas represented by a straight line with its extension pass-ing through the origin. The slope of this straight line wasequal to�m. It was also observed that the enzyme produc-tion rate increased linearly during exponential phase. Evenafter reaching critical time (tC), the boundary point betweenexponential and declining growth phase, at 4.6 h, the en-zyme production continued, thus signifying both growth andnon-growth associated product formation characteristics. Insummary, the following conclusions could be drawn fromthis analysis.
1) Protease production was a mixed type process showingboth growth and non-growth associated product forma-tion characteristics.
2) Maximum product formation rate was observed duringpost-exponential phase, few hours after growth rate at-tained its peak, and there was a sharp fall in proteaseformation rate and its productivity with further reductionin growth rate.
3) Maximum glucose consumption rate was observedduring exponential growth phase. However, there wassufficient amount of glucose present even during postexponential phase.
4) Lower DO concentration at the end of exponential phase,as the only factor, contributing to the onset of station-ary phase seemed improbable because its level was stillquite high (Fig. 1).
Table 3Effect of initial nitrogen source (biopeptone+yeast extract) concentrations on alkaline protease production byB. sphaericus
BP+YE (g l−1)a Xmax (g l−1) Pmax (U l−1) YP/S1
(U g−1)bYP/S2
(U g−1)cProductivity(U l−1 h−1)d
2.5+ 2.5 1.484 363 000 (at 48 h) 36 300 72 600 75625.0+ 5.0 3.022 670 000 (at 24 h) 67 000 67 000 27 9167.5+ 7.5 3.281 605 000 (at 48 h) 60 500 40 333 12 604
a Biopeptone+yeast extract.b YP/S1: Yield coefficient of product formation based on glucose.c YP/S2: Yield coefficient of product formation based on nitrogen sources.d Productivity was calculated at the time when enzyme activity (P) reached Pmax.
5) As soon as glucose was totally exhausted, dP/dt wasobserved to reach zero.
Hence, an attempt could be made to prolong the proteaseproduction phase by addition of substrate and nutrients.
3.3. Effect of initial concentration of carbonand nitrogen
Glucose concentration is known to affect protease levelsin Bacillus licheniformis [7,12] and protease secretion maybe induced or repressed by peptides and amino acids presentin yeast extract and biopeptone depending upon their natureand concentration. Hence, the initial concentration of carbonand nitrogen sources were varied in batch culture to studytheir effect on biochemical parameters as well as to opti-mize their concentration. With increase in initial glucose,the cell biomass increased up to a glucose concentration of3.3 g l−1 and beyond this, there was no significant changein cell concentration (Table 2). This suggested a possible ef-fect of nitrogen source on cell growth. However, maximumenzyme activity and productivity were obtained at a glucoseconcentration of 10.4 g l−1 and there was a decrease inenzyme activity with further increase in glucose concentra-tion. It should be noted that even in the absence of glucose,a cell concentration of 1.5 g l−1 and protease activity of215 000 U l−1 could be obtained, indicating that a part of thecarbon from biopeptone and yeast extract could be used formicrobial growth and enzyme production and protease yield

1098 J. Singh et al. / Process Biochemistry 39 (2004) 1093–1101
Table 4Cell growth and protease production for various fed-batch conditionsa
Serialnumber
Feed medium Xmax (g l−1) Pmax (U l−1) YP/S1
(U g−1)cYP/S2
(U g−1)dProductivity(U l−1 h−1)e
Glucose (g) BP+YE (g) Salts (g)b Volume (ml)
1 (Batch) – – – – 3.022 (at 8 h) 670 000 (at 24 h) 67 000 67 000 27 9162 5 50 6 500 4.581 (at 16 h) 968 000 (at 24 h) 96 800 53 240 40 3333 25 50 6 500 4.666 (at 24 h) 992 000 (at 30 h) 72 743 54 560 33 0664 50 50 6 500 5.016 (at 30 h) 1 028 000 (at 42 h) 56 540 56 540 24 4765 – 50 6 500 4.284 (at 12 h) 765 000 (at 24 h) 84 150 42 075 31 8756 5 50 – 500 4.188 (at 12 h) 830 000 (at 24 h) 82 995 45 650 34 5837 10 100 12 1000 5.885 (at 20 h) 1 048 000 (at 24 h) 104 796 41 916 43 6668 5 50 6 250 4.994 (at 16 h) 854 000 (at 24 h) 81 516 44 835 35 583
a Medium for batch fermentation as well as initial batch stage of fed-batch fermentation contained glucose (50 g), biopeptone+yeast extract (50 g)and salts (6 g).
b KH2PO4+MgSO4·7H2O (in the ratio of 5:1).c YP/S1: Yield coefficient of product formation based on glucose at enzyme activity, Pmax.d YP/S2: Yield coefficient of product formation based on nitrogen source at enzyme activity, Pmax.e Productivity was calculated at the time when enzyme activity (P) reached Pmax.
coefficient, YP/S1 (based on glucose) was found to decreasewith increase in initial glucose concentration.
Maximum protease activity was obtained with an ini-tial nitrogen source concentration of 10 g l−1 (Table 3).Although cell growth increased with increase in nitrogen,YP/S2 (based on nitrogen) was reduced at higher concentra-tion of nitrogen. Cell growth did not show a proportionateincrease with increase in nitrogen source from 10 to 15g l−1. This might be due to either limitation of carbonsource or growth inhibition by nitrogen source. Since a
Fig. 4. Profiles of cell concentration, protease activity, pH, glucose concentration and DO level in a fed-batch culture (serial number 3,Table 4). Themedium containing glucose (10.0 g l−1), yeast extract (5.0 g l−1), biopeptone (5.0 g l−1), KH2PO4 (1.0 g l−1), MgSO4·7H2O (0.2 g l−1) and Na2CO3
(10.0 g l−1) was used for the batch as well as initial batch stage of fed-batch fermentations and the medium, as indicated in serial number 2 (Table 4)was used as feed during fed-batch operation. The temperature of the fermenter was controlled at 30◦C and air flow rate (1 vvm) and agitation rate (300rpm) were kept constant during batch and fed-batch stages.
glucose concentration of 3.3 g l−1 produced 90% of cellgrowth as that of 10.4 g glucose l−1 (as shown earlier),the carbon source, as the only factor, contributing to thisgrowth limitation was ruled out. Hence, it could be assumedthat the inhibition of both carbon and nitrogen sourceswas a major factor responsible for relatively low cellconcentration and enzyme activity at high concentrationsof substrate and nutrients, and fed batch culture strategywas thought to be an alternative to get higher proteaseactivity.
J. Singh et al. / Process Biochemistry 39 (2004) 1093–1101 1099
3.4. Fed-batch studies
Feeding of substrate and nutrients was employed to over-come their inhibition and a set of experiments, as shown inTable 4, were carried out by feeding different combinationof medium components in order to optimize feed mediumcomposition. 5 l of medium was used for initial batch cul-ture and feeding (at a constant rate of 90 ml h−1) was startedafter 6 h offermenter inoculation using a pre-calibrated peri-staltic pump.
It could be concluded, from the results of serial num-ber 2–4 (Table 4), that excess glucose feeding extended fer-mentation time and lowered productivity, and yield of pro-teases (based on glucose uptake). Although maximum en-zyme activity was obtained by feeding 50 g of glucose, it alsoresulted in lower productivity and increased process time.Maximum productivity (among serial number 2–4,Table 4)was obtained by feeding 5 g of glucose along with other
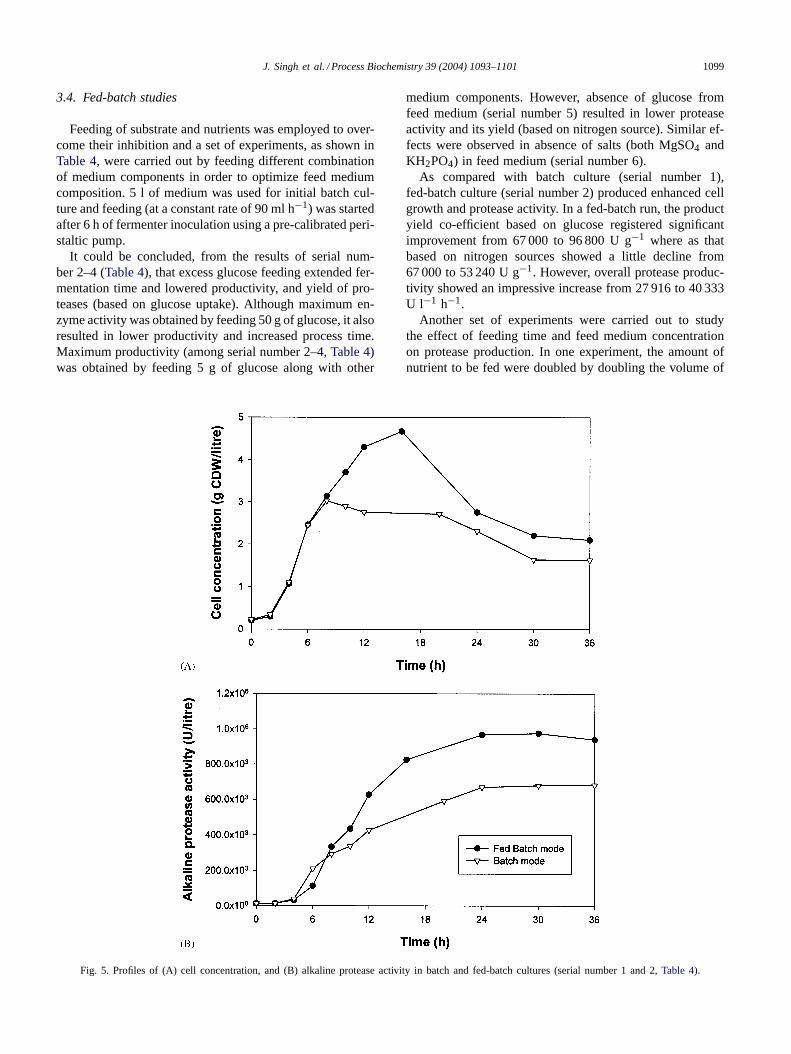
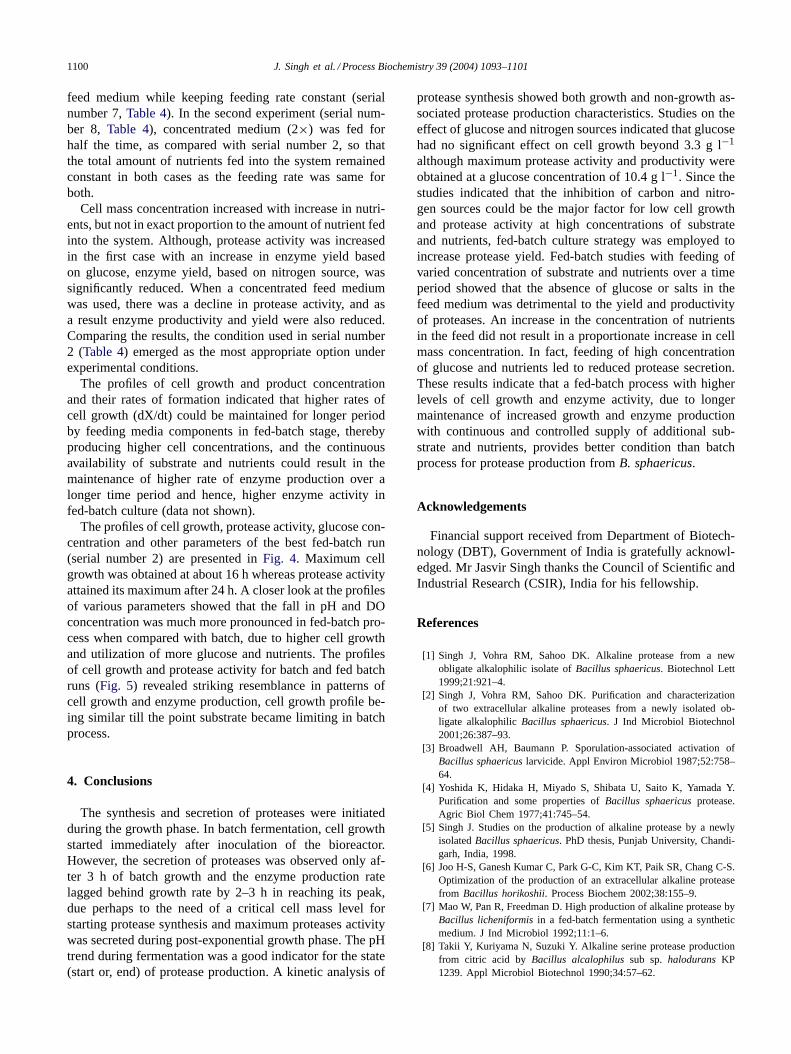
Fig. 5. Profiles of (A) cell concentration, and (B) alkaline protease activity in batch and fed-batch cultures (serial number 1 and 2,Table 4).
medium components. However, absence of glucose fromfeed medium (serial number 5) resulted in lower proteaseactivity and its yield (based on nitrogen source). Similar ef-fects were observed in absence of salts (both MgSO4 andKH2PO4) in feed medium (serial number 6).
As compared with batch culture (serial number 1),fed-batch culture (serial number 2) produced enhanced cellgrowth and protease activity. In a fed-batch run, the productyield co-efficient based on glucose registered significantimprovement from 67 000 to 96 800 U g−1 where as thatbased on nitrogen sources showed a little decline from67 000 to 53 240 U g−1. However, overall protease produc-tivity showed an impressive increase from 27 916 to 40 333U l−1 h−1.
Another set of experiments were carried out to studythe effect of feeding time and feed medium concentrationon protease production. In one experiment, the amount ofnutrient to be fed were doubled by doubling the volume of
1100 J. Singh et al. / Process Biochemistry 39 (2004) 1093–1101
feed medium while keeping feeding rate constant (serialnumber 7,Table 4). In the second experiment (serial num-ber 8, Table 4), concentrated medium (2×) was fed forhalf the time, as compared with serial number 2, so thatthe total amount of nutrients fed into the system remainedconstant in both cases as the feeding rate was same forboth.
Cell mass concentration increased with increase in nutri-ents, but not in exact proportion to the amount of nutrient fedinto the system. Although, protease activity was increasedin the first case with an increase in enzyme yield basedon glucose, enzyme yield, based on nitrogen source, wassignificantly reduced. When a concentrated feed mediumwas used, there was a decline in protease activity, and asa result enzyme productivity and yield were also reduced.Comparing the results, the condition used in serial number2 (Table 4) emerged as the most appropriate option underexperimental conditions.
The profiles of cell growth and product concentrationand their rates of formation indicated that higher rates ofcell growth (dX/dt) could be maintained for longer periodby feeding media components in fed-batch stage, therebyproducing higher cell concentrations, and the continuousavailability of substrate and nutrients could result in themaintenance of higher rate of enzyme production over alonger time period and hence, higher enzyme activity infed-batch culture (data not shown).
The profiles of cell growth, protease activity, glucose con-centration and other parameters of the best fed-batch run(serial number 2) are presented inFig. 4. Maximum cellgrowth was obtained at about 16 h whereas protease activityattained its maximum after 24 h. A closer look at the profilesof various parameters showed that the fall in pH and DOconcentration was much more pronounced in fed-batch pro-cess when compared with batch, due to higher cell growthand utilization of more glucose and nutrients. The profilesof cell growth and protease activity for batch and fed batchruns (Fig. 5) revealed striking resemblance in patterns ofcell growth and enzyme production, cell growth profile be-ing similar till the point substrate became limiting in batchprocess.
4. Conclusions
The synthesis and secretion of proteases were initiatedduring the growth phase. In batch fermentation, cell growthstarted immediately after inoculation of the bioreactor.However, the secretion of proteases was observed only af-ter 3 h of batch growth and the enzyme production ratelagged behind growth rate by 2–3 h in reaching its peak,due perhaps to the need of a critical cell mass level forstarting protease synthesis and maximum proteases activitywas secreted during post-exponential growth phase. The pHtrend during fermentation was a good indicator for the state(start or, end) of protease production. A kinetic analysis of
protease synthesis showed both growth and non-growth as-sociated protease production characteristics. Studies on theeffect of glucose and nitrogen sources indicated that glucosehad no significant effect on cell growth beyond 3.3 g l−1
although maximum protease activity and productivity wereobtained at a glucose concentration of 10.4 g l−1. Since thestudies indicated that the inhibition of carbon and nitro-gen sources could be the major factor for low cell growthand protease activity at high concentrations of substrateand nutrients, fed-batch culture strategy was employed toincrease protease yield. Fed-batch studies with feeding ofvaried concentration of substrate and nutrients over a timeperiod showed that the absence of glucose or salts in thefeed medium was detrimental to the yield and productivityof proteases. An increase in the concentration of nutrientsin the feed did not result in a proportionate increase in cellmass concentration. In fact, feeding of high concentrationof glucose and nutrients led to reduced protease secretion.These results indicate that a fed-batch process with higherlevels of cell growth and enzyme activity, due to longermaintenance of increased growth and enzyme productionwith continuous and controlled supply of additional sub-strate and nutrients, provides better condition than batchprocess for protease production fromB. sphaericus.
Acknowledgements
Financial support received from Department of Biotech-nology (DBT), Government of India is gratefully acknowl-edged. Mr Jasvir Singh thanks the Council of Scientific andIndustrial Research (CSIR), India for his fellowship.
References
[1] Singh J, Vohra RM, Sahoo DK. Alkaline protease from a newobligate alkalophilic isolate ofBacillus sphaericus. Biotechnol Lett1999;21:921–4.
[2] Singh J, Vohra RM, Sahoo DK. Purification and characterizationof two extracellular alkaline proteases from a newly isolated ob-ligate alkalophilicBacillus sphaericus. J Ind Microbiol Biotechnol2001;26:387–93.
[3] Broadwell AH, Baumann P. Sporulation-associated activation ofBacillus sphaericus larvicide. Appl Environ Microbiol 1987;52:758–64.
[4] Yoshida K, Hidaka H, Miyado S, Shibata U, Saito K, Yamada Y.Purification and some properties ofBacillus sphaericus protease.Agric Biol Chem 1977;41:745–54.
[5] Singh J. Studies on the production of alkaline protease by a newlyisolatedBacillus sphaericus. PhD thesis, Punjab University, Chandi-garh, India, 1998.
[6] Joo H-S, Ganesh Kumar C, Park G-C, Kim KT, Paik SR, Chang C-S.Optimization of the production of an extracellular alkaline proteasefrom Bacillus horikoshii. Process Biochem 2002;38:155–9.
[7] Mao W, Pan R, Freedman D. High production of alkaline protease byBacillus licheniformis in a fed-batch fermentation using a syntheticmedium. J Ind Microbiol 1992;11:1–6.
[8] Takii Y, Kuriyama N, Suzuki Y. Alkaline serine protease productionfrom citric acid by Bacillus alcalophilus sub sp.halodurans KP1239. Appl Microbiol Biotechnol 1990;34:57–62.

J. Singh et al. / Process Biochemistry 39 (2004) 1093–1101 1101
[9] Puri S, Beg QK, Gupta R. Optimization of alkaline protease pro-duction from Bacillus sp. by response surface methodology. CurrMicrobiol 2002;44:286–90.
[10] Summers JB, Somers GI. Laboratory experiments in biological chem-istry. New York: Academic press, 1954.
[11] Gibb GD, Ordaz DE, Strohl WR. Overproduction of extracellularprotease activity byStreptomyces C5-A13 in fed-batch fermentation.Appl Microbiol Biotechnol 1989;31:119–24.
[12] Hanlon GW, Hodges NA, Russel AD. The influence of glucose,ammonium and magnesium availability on the production of pro-tease and bacitracin byBacillus licheniformis. J Gen Microbiol1982;128:845–51.
[13] Kono T. Kinetics of microbial cell growth. Biotechnol Bioeng1968;10:105–31.
[14] Kono T, Asai T. Kinetics of fermentation processes. BiotechnolBioeng 1969;11:293–321.
[15] Sahoo DK, Agarwal GP. Effect of oxygen transfer on glycerol biosyn-thesis by an osmophilic yeastCandida magnoliae I2B. BiotechnolBioeng 2002;78:545–55.
[16] Schügerl K. Bioreaction engineering. Willey: Aarau, Switzerland;1987, p. 164–224.