english magzin pages - world banksiteresources.worldbank.org/afghanistanextn/resources/...provincial...
TRANSCRIPT


1

2
3
EXECUTIVE SUMMARY
Afghanistan faces a severe problem of poor nutrition and food insecurity. Chronic malnutrition among Afghan children is one of the highest in the world. More than half (54%) of Afghan children under age five are stunted (chronically malnourished) and over a third (34%) are underweight. Around 72 percent of children (under age 5) suffer from the deficiency of key micro-nutrients (such as iron and iodine). These poor nutritional outcomes are closely linked to the state of food security in the country. More than a quarter (29 percent) of Afghan population cannot meet its calorie requirement, that is, it consumes less than 2100 calories per day. Twenty percent of the population consumes a diet that lacks adequate dietary diversity, thus affecting their micro-nutrient intake. Moreover, the problem of food insecurity compounds in lean seasons (for example during the spring season) when 33 percent of the population suffers from calorie deficiency and 24 percent from poor diet.
This report investigates the status of food insecurity in Afghanistan with a focus on mapping provincial differences and an emphasis on understanding the impact of rising food prices on key measures of food security. It synthesizes findings from analysis of rising food prices and their impact on different measures of food access and utilization (such as calorie intake, protein consumption and the quality of diet) in Afghanistan. The findings are based on the analysis of data from the National Risk and Vulnerability Assessment (NRVA) 2007/08, a sample of over 20,000 households from all 34 provinces of Afghanistan. This analytical work is an integral part of the on-going collaboration between the Government of Afghanistan and the World Bank in the domain of poverty and vulnerability assessment. It aims to further the understanding of household wellbeing and vulnerability from the standpoint of food security and complements the earlier work presented in “Poverty Status in Afghanistan: A Profile based on National Risk and Vulnerability Assessment (NRVA 2007/08)” and in the companion piece on sub-national development statistics—“Afghanistan Provincial Briefs”.
For the purposes of the empirical analysis in this report, three measures of household food security are used: per capita daily caloric intake; protein intake; and, household dietary diversity. The first measure—per capita daily caloric intake—is a measure of access to food and is calculated by converting daily food quantities into kilocalories. The proportion of population whose daily calorie intake falls below 2100 calories are considered calorie deficient. The second measure of food security looks at per capita protein intake from different food sources. Protein deficiency rate refers to the percentage of population whose daily intake of protein is less than 50 grams. Finally, household dietary diversity is based on food consumption score (FCS). It looks at the count of various food groups consumed by the household. The food groups include staples, pulses, vegetables, fruit, meat/fish, milk/dairy, sugar, and oil/fat. Poor dietary diversity (also known as borderline and poor food consumption) shows the percentage of population whose scores are equal to or less than 42. Each of these measures provides different dimensions of food insecurity and different insights into potential policy responses.

4
Overall, the report documents much variation in food security outcomes across geographic and economic groups in Afghanistan (Table 1). Food insecurity appears to be more pronounced in rural parts where about 80 percent of the country’s population resides. For example, calorie deficiency affects 30 percent of the population in rural areas compared to 24 percent in urban areas. Food security outcomes are also associated with the terrain characteristics, with the prevalence of food insecurity being generally higher in mountains and plateaus of Afghanistan Across economic groups, as expected the poor are more food insecure. For example, more than half of the poor (54 percent) are calorie deficient compared to only 16 percent of their non-poor counterparts. Moreover, around 69 percent of the poor are food insecure in at least one of the three dimensions—calorie intake, protein intake, and dietary diversity.
Table 1: Food Security Outcomes in Afghanistan in 2007-2008
All Rural-Urban Terrain Type Poor/Non-Poor
Urban Rural Plain Plateau Mountain
Non-Poor
Poor
Calorie Deficiency (%) 29 24 30 24 31 33 16 54
Protein Deficiency (%) 17 17 17 15 18 20 8 35
Poor Dietary Diversity (%)
20 14 22 16 26 21 14 32
Note: Percent of population with each outcome. Source: Authors’ calculation based on NRVA 2007-2008
Food security outcomes vary considerably across provinces, reflecting the diversity of economic and social conditions across the country. Calorie deficiency varies from less than 15 percent in the provinces of Parwan, Nangarhar, Sar-i-Pul and Jawzjan to more than 60 percent in Badakhshan and Laghman. Protein deficiency is also much higher than the national average in Badakhshan and Laghman, 46 and 57 percent respectively, while the provinces of Sar-i-Pul, Jawzjan, Helmand, and Nimroz are relatively better off in terms of protein intake (with less than 4 percent of their population facing protein deficiency). Dietary diversity also varies considerably across province, from a low of less than 3 percent (Wardak, Zabul, Nimroz, Helmand, Kandahar, Farah) to a high of more than 60 percent (Ghor, Sar-i-Pul, Samangan).
Several key findings emerge from the analysis of rising food prices on food security. The OLS regression estimates which look at the average impact (at the national level) show that with the

5
doubling of wheat flour prices, food consumption drops by 43 percent. However, the price response is smaller for calorie intake (18%) and dietary diversity (19%). This suggests that households in Afghanistan trade-off quality for quantity of calories consumed. As additional evidence of this trade-off, the regression estimates show that the price increases are associated with changes in the composition of food consumption, namely decreases in dietary diversity and a movement towards the consumption of cheaper, staple foods.
Further analysis shows that there are large differences in the behavioral response of households to rising wheat flour price, depending on their relative food security status. Better-off households (those on the 75th percentile of the distribution of real food consumption) experience the largest percentage declines in real food consumption for a given increase in wheat flour prices—over twice as large as those at the 25th percentile (poor households). Similarly, the better off in terms of caloric intake experience larger percentage declines in caloric intake for a given increase in wheat flour prices. Households at the bottom of the caloric intake distribution experience relatively little decline in their intake due to rising prices. Such households live near subsistence levels and are forced to make adjustments to the quality of their diets in order to maintain their energy levels. Therefore, these poor households (at the 25th percentile of the dietary diversity) make the largest changes to the quality of their diets—their reduction is more than 50 percent larger than those at the higher end.
The findings have several implications for policy. First, given large differences in food security outcomes at the sub-national level (for example, across provinces), better targeting is crucial to increase the effectiveness of food security programs. For example, provinces that are poor in overall terms may not be equally poor in terms of calorie intake and the diversity of diet. In fact, many provinces that perform well on calorie intake (for example, Ghor and Sar-i-Pul) are worse-off in terms of dietary diversity. Similarly, provinces that do not produce surplus grain may not necessarily be calorie deficient. For example, Daikuni, Nuristan, and Bamyan are in fact experiencing lower levels of calorie deficiency (less than 30 percent) compared to Ghazni, Balkh, Laghman and Badadshan where the calorie deficiency rate is in excess of 50 percent. This sort of province-specific detail can provide input to discussions on the placement of grain silos, as well as help inform the development of grain dissemination strategies in times of need. More generally, the large differences in food security outcomes at the provincial level underscore both the complexity of, and need for, better targeting to inform policy choices.
Second, the empirical evidence highlights that if policy makers focus exclusively on adverse effects on caloric intake in the event of a price shock, they miss an important part of the big picture. While poorer households do cut back somewhat on calories, they absorb much more of the shock by reducing dietary quality, for example, by reducing the consumption of meat. Therefore, the government’s on-going efforts to ensure adequate supply of staple foods during the time of crisis can only address part of the challenge. The high degree of micro-nutrient deficiency among children in general and high potential for this problem to compound during

6
times of food crisis (through decreased diet quality of the poor) suggest that complementary efforts are also equally crucial to address micro-nutrient deficiency (such as through the fortification of staples and vitamin distributions). To this end, devising new initiatives as well as increasing the outreach and targeting of existing programs (for example, WFP’s micro-nutrient enriched food for children and wheat flour fortification initiative) would help achieve better food security outcomes. For example, increased efforts are needed to boost the uptake of fortified wheat flour in rural areas where the poor diet is affecting a much larger proportion of the population. At present, the consumption of fortified wheat is estimated to be mainly concentrated in urban regions.
Finally, given that poor nutrition and food insecurity affect a sizeable proportion of the Afghan population year-round but more so during bad times (e.g. lean months of spring season or during food price shocks), there is genuine need for a scaled-up and well-targeted safety nets program in Afghanistan. Currently, the government is implementing a few state sponsored safety nets programs but they have limited outreach. Other initiatives such as conditional in-kind and cash transfers to the vulnerable groups under the WFP led programs are implemented as part of relief and recovery efforts and have varying degrees of outreach and effectiveness. Lessons learned from these experiences can be used to devise a comprehensive safety net program that is well targeted, reliable and sufficient in scale.

7
I. INTRODUCTION
Food insecurity and poor nutrition affect a large part of the Afghan population.1 Afghanistan has one of the highest stunting rates in the world. More than half (54%) of Afghan children under age five are stunted (chronically malnourished) and over a third (34%) are underweight.2 More than two-thirds (72%) of children also suffer from iodine and iron deficiency. These poor nutritional outcomes are closely linked to poor access and utilization of food in Afghanistan. According to the NRVA 2007/2008, nearly a third of Afghan population (29 percent) suffers from calorie deficiency—population whose calorie consumption is less than 2,100 calories per capita. Twenty percent of the population consumes a diet that lacks adequate dietary diversity, thus affecting the balance and diversity of micronutrient intake. The problem of food insecurity compounds in leaner seasons, for example in spring, when 33 percent of the population suffers from calorie deficiency and 24 percent from poor diet.
This report discusses the challenge of food security in Afghanistan focusing on two key aspects: provincial differences in food security outcomes; and, the impact of rising food prices on food security outcomes and the coping mechanisms of Afghan people. It synthesizes findings from analyses on the impact of rising food prices on different measures of food access and utilization in Afghanistan, with a particular focus on understanding the impacts and behavioral response of the poor.3 The findings in this report are based on the data from the National Risk and Vulnerability Assessment (NRVA) 2007/08, a sample of over 20,000 households from all 34 provinces of Afghanistan, conducted over a 13-month period. The NRVA 2007/2008 is the first nationally-representative household survey in Afghanistan4 designed to account for seasonal variations in consumption and other measures of wellbeing.5
This analytical work is an integral part of the on-going collaboration between the Government of Afghanistan and the World Bank in the domain of poverty and vulnerability analysis. Building on the earlier work presented in “Poverty Status in Afghanistan: A Profile based on National
1 According to the Economic Research Service (Food Security Assessment, 2008-2009), in 2008, Afghanistan had a nutrition gap – the difference between available food and food needed to support a 2,100 per capita calorie intake – of 1,999 thousand tons. Only North Korea was estimated to have a larger nutrition gap in that year. 2 World Bank. Afghanistan Nutrition (http://siteresources.worldbank.org/SOUTHASIAEXT/Resources/223546-1171488994713/3455847-1232124140958/5748939-1234285802791/AfghanistanNutrition.pdf) 3 For more details, see D’Souza and Jolliffe (2010): Rising Food Prices and Coping Strategies: Household-level Evidence from Afghanistan , and D’Souza and Jolliffe (2011): Food Security and Wheat Prices in Afghanistan: A Distribution-sensitive Analysis of Household-level Impacts. 4 While census data does not exist for Afghanistan, the pre-cursor to the census, a national household listing was undertaken from 2003 to 2005 by the Central Statistics Organization. This listing forms the basis for the current official population estimates and also serves as the sampling frame for the NRVA 2007/08. 5 The NRVA 2007/08 is the third round of the survey; fieldwork took place from August 2007 to September 2008. The first two rounds (2003, 2005) were conducted during a single season, leading to seasonally-biased estimates, e.g., poverty estimates during or immediately after harvest will be lower than during lean periods. The NRVA 2007/08 was implicitly stratified over time during the year-long fieldwork so that estimates of wellbeing could account for seasonal variations.

8
Risk and Vulnerability Assessment (NRVA 2007/08)” and in the companion piece on sub-national development statistics—“Afghanistan Provincial Briefs”, this reports aims to further the understanding of household wellbeing and vulnerability in Afghanistan from the perspective of food security. The report notes high levels of provincial variation in food security outcomes, which for the most part, go hand in hand with poverty. It also shows that rising food prices have had a significant and adverse impact on the food security and vulnerability of households in Afghanistan, with both short term and long term implications for the wellbeing of households.
The document is organized into four main sections. The first section introduces Afghanistan’s development context followed by a description of the food security measures. The second section presents a profile of food security in Afghanistan, with a special focus on mapping provincial variations in the outcomes. The third part presents key findings of the two empirical papers with the aim of providing quantitative estimates of the impact of rising food prices on the various measures of food security. It also provides evidence of differing impacts of rising food prices on different population groups, and on their coping responses. The final section summarizes key policy messages that emerge from the discussions presented in the main report.
AFGHANISTAN: DEVELOPMENT AND FOOD SECURITY CONTEXT
Over the past decade, the Afghan economy has experienced strong growth, with real GDP growth averaging approximately 10.8 percent per year between 2003 and 2009. But after decades of war and political instability, landlocked Afghanistan remains one of the world’s least developed nations and one of the poorest countries in its region. The IMF (2009) estimates that gross domestic product (GDP) per capita was $350 in 2007 and $457 in 2008 (current US$).6 Based on the broader set of development indicators used in the UNDP human development index (e.g., health, education, living standards), Afghanistan ranks 181st out of 182 countries.7 And, UNICEF (2009, p. 11) reports that Afghanistan has the highest prevalence of stunting in the world among children under five years old.
The Afghan economy is largely based on agriculture; major crops include wheat, rice, maize, barley, vegetables, fruits, and nuts. Approximately 70 percent of cultivated crop area is devoted to wheat and about 15 percent is devoted to rice, barley and maize (Chabot and Dorosh, 2007). Wheat is both a major production crop and the main staple of the Afghan diet, with wheat flour contributing 57 percent to the total caloric content of the average bundle of food items of the relatively poor (i.e., the 20th to 50th percentile of the total consumption distribution, which is the basis for the official Government of Afghanistan poverty line).
6 In a country like Afghanistan though, where the drug economy is large, the official National Income Accounting data are likely to significantly understate GDP. UNODC (2008) estimates that in 2007 the farm gate value of opium cultivation was US$1 billion, but this dropped to US$730 million in 2008. The potential export value in 2007 of opium, morphine and heroin (at border prices in neighboring countries) was $4 billion (or, in per capita terms, about $160). 7 UNDP (2009)

9
The availability of cereals in Afghanistan (particularly wheat which accounts for 77 percent of total cereal production) depends on both local production and imports. Table 2 shows that local production of cereals met nearly three-fourths of the total national demand during 2004-2008. But due to large fluctuations in weather and insecurity, wheat and other grain crop production remains highly volatile and the country is dependent on its trading partners and food aid to meet any shortfalls.8 Pakistan is the major supplier of wheat (mostly in the form of flour) due to close historical ties and a shared 1,600 kilometer border; estimates of Pakistan’s share of the Afghan wheat and flour import market range from 59 percent (Chabot and Dorosh, 2007) to 79 percent (Maletta, 2004).
Table 2: Cereal Production in Afghanistan, 2004–08 (thousands of tons)
2004 2005 2006 2007 2008 2004–08
(Av.)
Total Cereal Production 3,057 5,243 4,447 5,443 3,860 4,410
Total Demand 5,717 5,866 6,018 6,175 6,500 6,055
Demand-Supply Gap 2,660 623 1,571 732 2,640 1,645
Self-Sufficiency Rate (%) 53 89 74 88 59 73
Wheat Production 2,293 4,266 3,363 4,343 2,767 3,406
Wheat as percent of Total Cereal Production 75 81 76 80 72 77
Source: World Bank (2010)9
Food aid, although small in relation to other sources of food, still constitutes a vital part of the on-going national efforts to overcome food insecurity in Afghanistan.10 During 2005-2009, more than 1.12 million metric tons of food aid was delivered to Afghanistan to provide emergency food relief and nutritional support to vulnerable and acutely food insecure households, including those whose livelihoods were disrupted by conflict and protracted drought conditions (Table3).
8 Afghan wheat production has been estimated to be over five times as variable as Pakistan’s production. (Persaud, 2010) 9 For details, see World Bank (2010): Food Price Increases in South Asia: National Responses and Regional Dimensions (Table A1) 10 For example, wheat received through aid accounted for 31 percent of total wheat imports during 2000-2004. In overall terms, commercial imports accounted for 19 percent of total wheat availability in Afghanistan, while wheat aid contributed another 8 percent. For more details, see World Bank (2005): Enhancing Food Security in Afghanistan: Private Market and Public Policy Options.

10
More than three-fourths of this overall food aid comprised cereals, chiefly wheat and wheat flour (accounting for 99 percent of the total cereal volume). Table 3 shows that both cereal and overall food aid came in more quantities during the times of crises (such as after the start of the 2001 war) which also coincided with the second half of the 1999-2002 drought in Afghanistan. Food aid went up again during the drought year of 2008.
Table 3: Food Aid to Afghanistan 2001-200911
2000 2001 2002 2003 2004 2005 2006 2007 2008 2009
Food Aid, total (‘000, MT)
210 277 562 227 234 208 163 225 320 210
Food Aid-cereals (‘000, MT)
201 258 466 174 172 132 122 160 273 162
Development Food Aid 4 9 38 41 65 67 53 49 70 102
($ Million)
Source: WFP (Food Aid Information System) and OECD (DAC2a Disbursements)
A large part of the overall food aid to Afghanistan is channeled through the World Food Program (WFP), which in turn distributes the aid through a variety of programmatic outlets, including General Food Distribution for relief (GFD), Food for Work (FFW), Food for Education (FFE), Food for Training (FFT) and Health and Nutrition initiatives12 (see Annex 1 for details of these programs). In addition to providing caloric support, some of these activities (for example, micro-nutrient enriched biscuits under FFE and wheat fortification) also aim to address micro-nutrient deficiencies in the country. All these WFP-led activities are programmed and implemented under the overarching framework of Protracted Relief and Recovery Operations (PRRO). WFP collaborates with various government agencies and NGOs partners in implementing the PRRO. Over the years, these food aid operations have benefited a large number of vulnerable families, including schoolchildren, illiterate persons, returning refugees, internally displaced persons and disabled people (Table 4). 11 Food aid is expressed in grain-equivalent units. The series on Development Food Aid (in dollar terms) is taken from OECD-DAC statistics on food aid disbursements. Development food aid primarily involves direct transfers from the donor countries, which in many cases would imply a subcomponent of the overall volumetric food aid presented in other rows. 12World Food Program’s International Food Aid Information System (INTERFAIS) does not give the breakdown of food aid by food delivery channel/implementing agency. Statistics from Food Aid Convention’s Food Aid Operations Report 2008-09 (which covers food aid from major donors like Australia, Canada, European Union, Japan, and USA) suggests that around 75 percent of FAC total aid to Afghanistan (in volumetric terms) was channeled through WFP.

11
Table 4: Number of Recipients/Beneficiaries by Program Activities (in, thousands)13
2006 2007 2008 2009 2010
Relief General Food Support (GFD) 1,138 765 1,240 1,400 1,800
Food for Work (FFW) 271 642 859 4,400 1,500
Food for Education (FFE) 1,972 2,203 2,228 2,800 1,600
Food for Training (FFT) 55 75 150 180 140
TB Patients 25 22 22 20 20
Source: WFP (2009): Evaluation of Afghanistan-PRRO104270 and WFP Website
In addition to working with the WFP and many other donors (such as the Humanitarian Office of the European Commission and the USDA) in providing food support, the government has considered establishing a Strategic Grain Reserve (SGR).14 If this proposal were to move forward, the analysis in this report would lend support to the provision of aid during times of economic distress caused by natural and man-made disasters through the targeting of the transitory food insecure (i.e. those who are at the risk of being food insecure during bad times).
MEASURES OF FOOD SECURITY
“Food security exists when all people, at all times, have physical and economic access to sufficient, safe and nutritious food that meets their dietary needs and food preferences for an active and healthy life” (Food and Agricultural Organization, 2008, p. 1). It includes four main factors: availability, access, utilization, and stability. Availability refers to the physical existence of food, which relates to production, stocks and trade. Access refers to a household’s ability to obtain food, which depends on income, prices, and market access. Utilization refers to an individual’s ability to process nutrients and energy from food, which depends on many factors including dietary diversity and nutrient absorption, intra-household allocation of food, and hygienic preparation. Stability refers to the stability of the other three factors over time. (Food and Agricultural Organization, 2008)
The empirical analysis in this report uses three measures of household food security: per capita daily caloric intake, protein intake, and household dietary diversity. The first measure relates to access to food and the last two relate to the utilization of food. In addition, the value of per capita monthly food consumption (a key factor used in the assessment of poverty) is also used as an
13 The figures for 2009 and 2010 are taken from http://www.wfp.org/countries/Afghanistan/Operations (accessed on Feb24 & March 03, 2011). These figures may not be strictly comparable with those from the earlier years 14 MAIL 2009: Strategic Grain Reserve: Infrastructure for Food Security (Concept Paper)

12
indicator of food security in analyzing the impact of rising food prices. This additional measure—a core component of poverty measurement—is used to strengthen the analysis of food security.
The first measure, calorie deficiency rate, is calculated by taking the proportion of population whose daily calorie intake falls below 2100 calories. In calculating daily calorie intake, the FAO Food Composition Tables for the Near East have been used to convert daily food quantities into kilocalories that are then divided by the effective household size to get per capita daily caloric intake (in kilocalories).15 The effective number of household members incorporates guests eating meals within the home.16
There is evidence though that caloric intake is not a sufficient indicator of nutritional status (e.g. Deaton & Dreze, 2009), so the report examines other indicators, namely protein deficiency, dietary diversity, and overall food consumption. Protein deficiency rate is an important measure of quality of food intake. It refers to the percentage of population whose daily consumption of protein (from different food sources) is less than 50 grams. For the empirical analysis, protein intake is calculated by dividing weekly total household protein intake (from both animal and vegetable sources) by seven days and by the effective household size.
To measure household dietary diversity, the report uses food consumption score (FCS) developed by the World Food Programme (WFP). The dietary diversity is a weighted sum of the frequencies with which households consume foods within eight food groups over the previous week.17 The food groups include staples, pulses, vegetables, fruit, meat/fish, milk/dairy, sugar, and oil/fat. Higher scores denote a more varied diet and are suggestive of a higher quality diet with potential for higher micronutrient intake. Poor dietary diversity (also known as borderline and poor food consumption) shows the percentage of population whose food consumption scores are equal to or less than 42.
Finally, the value of monthly food consumption is used as an additional measure of food security. This measure is constructed by adding the value of food items purchased from the market as well as those produced and consumed at home.18 Since not all food items were available in all district markets at all times of the year, missing prices were imputed first, which
15 Spices, water, and ‘other’ foods do not contribute to total calories. USDA sources were used for a few items that were not available in the FAO tables. 16 Some studies use household size to calculate per capita amounts. In Afghanistan the custom of sharing meals with guests makes it important to account for guests eating meals from the household cooking pot. The effective household size also incorporates information on household members eating outside the home. Other studies use equivalency scales to account for differences in consumption of adults and children when calculating measures of wellbeing. We opt to include variables for household composition directly into the regression model in order to control for such differences. 17 Weights for the food groups range from 0.5 to 4 based on nutrient density. Condiments receive zero nutritional weight. Frequencies are truncated at 7 for each food group. The measure ranges from 0 to 112. 18 Households are asked for the quantity of foods consumed over the past seven days; these quantities are multiplied by 4.2 to get monthly values.

13
were then used to value those items that households may have been producing at home, as well as goods that households may have obtained from more distant markets.19 The value of expenditure on food away from home is included in the calculation of the value of food consumption.20 Finally, nominal values were converted to real values using a consumer food price index.21
II. PROFILE OF FOOD SECURITY
Food insecurity affects a sizable proportion of Afghan population. According to the NRVA 2007/2008, nearly a third (29 percent) of Afghan population cannot meet its daily calorie requirement of 2100 calories. The problem of calorie deficiency compounds in bad times (for example, during the spring season) when an additional four percent of the population becomes calorie deficient.22 Lower quality of diet is another key dimension of food insecurity in Afghanistan. Twenty percent of the population consumes a diet that lacks adequate dietary diversity, implying a lower quality diet with relatively limited potential for micronutrient intake. Protein deficiency is also significant as 17 percent of the population consumes less than the threshold of 50 grams of protein per day (Table 1). Like calorie deficiency, protein deficiency and poor diet vary across seasons, affecting a much larger proportion of the population during the spring and summer seasons.
Food insecurity is higher in rural areas. Food insecurity appears to be more pronounced in rural parts where about 80 percent of the country’s population resides. Figure 1 shows that calorie deficiency affects 30 percent of the population in rural areas compared to 24 percent in urban parts of the country. Dietary diversity is also considerably lower in rural areas. Twenty-one percent of the rural population is affected by poor dietary diversity compared to 14 percent of their urban counterparts. The only exception is protein deficiency which affects an equal proportion of population in both rural and urban parts of Afghanistan. Still, given the high percentage of rural population in Afghanistan, the absolute number of people affected by protein deficiency as well as other dimensions of poor food security is much larger in rural areas (Figure1).
19 The imputation process filled in missing values using the first feasible methodology according to the following order: 1) median of the 20 nearest neighbors (weighted by inverse distance); 2) province median of that month; 3) national median of that month; 4) median price of 20 neighboring districts of the quarter (weighted by inverse distance); 5) province median of that quarter; and 6) national median of that quarter. Price adjustment has also been made for domestic and imported rice and wheat. As survey includes questions on the percentages of imported wheat and rice the household consumes, these responses have been used to calculate price averages for domestic and imported varieties separately, given large differences in price and quality. 20 Expenditure on food away from home accounts for approximately 2 percent of household food expenditure. 21 This is based on a Laspeyres price index estimated by quarter for each region using the district price data. Real consumption is relative to the chosen base: urban areas in the Central region in quarter one; the capital, Kabul, is located in the Central region. 22 Spring/summer 2008 also coincided with the period of rising food prices, thus adding to the usual seasonal effects.

14
Figure 1
Source: Authors’ calculation based on NRVA 2007/2008
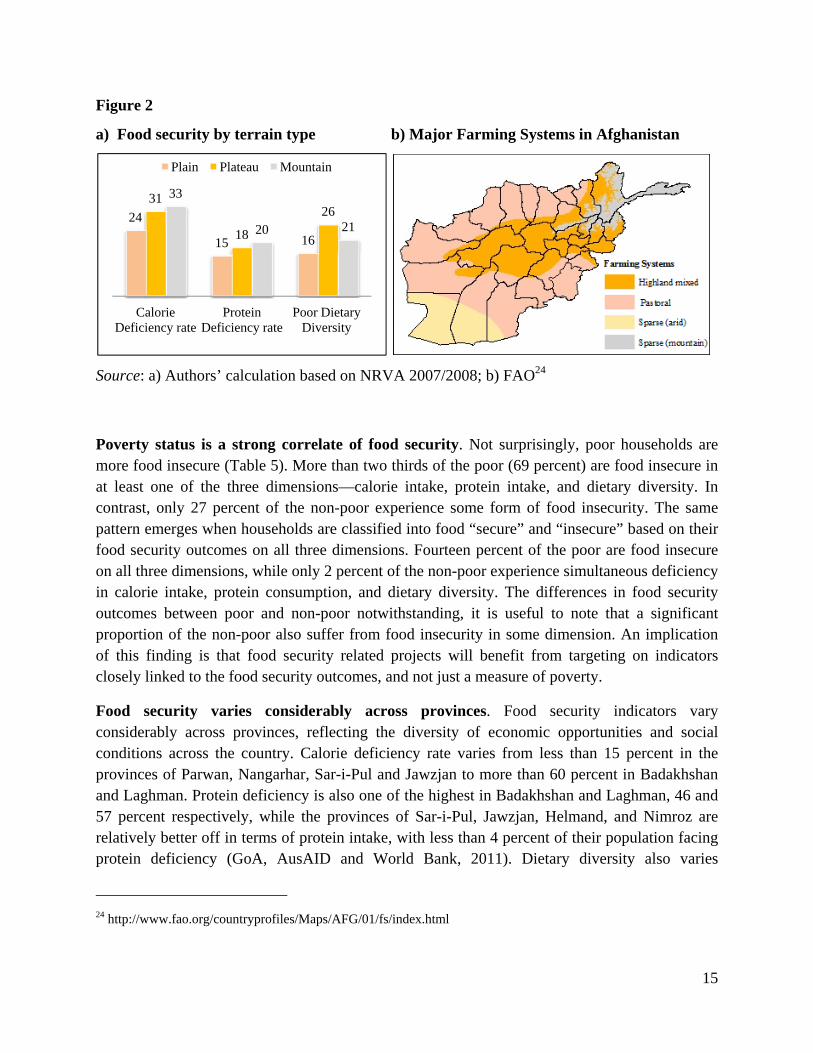
Food security outcomes are closely associated with terrain characteristics. The prevalence of food insecurity is generally higher in mountains and plateaus of Afghanistan. Figure 2 (a) shows that people residing in mountainous regions of Afghanistan experience much higher calorie and protein deficiency compared to those living in lowlands. Similarly, the population residing in the plateaus also experience higher food insecurity outcomes vis-à-vis their counterparts who live in the plains. Terrain characteristics affect food security outcomes by impacting access to markets, transportation costs, and livelihood opportunities. Figure 2 (b) shows the diversity of farming systems in Afghanistan, largely shaped by the geographic characteristics of the country. These diverse farming systems have a direct bearing on household access to food. Highland mixed is the dominant farming system in the central mountains and foothills where principal sources of livelihoods are mixed farming (livestock, horticulture, cereal) and seasonal migration. Sparse (mountain) farming system in the northeast implies high dependence on livestock and the associated dairy products. The same is the case with sparse (arid) farming regions. In pastoral regions, livestock, irrigated cropping and migration are the principal sources of livelihoods.23 Another dimension that interacts with the altitudes and terrain type is the cropping intensity, with low lying regions (particularly those with better access to water) producing two crops in a year compared to altitudinous areas where shorter growing season permits only one major crop.
23 It is worth mentioning that there is large variation within these major farming systems. For instance, within the pastoral system, Turkestan plains in the northern region largely depend on irrigated agriculture with heavy reliance on producing grains. For details, see FEWSNET/USAID(2011): Livelihoods Zoning “Plus” Activity in Afghanistan.
24.4
17.314.4
30.4
17.421.5
Calorie Deficiency rate
Protein Deficiency rate
Poor Dietary Diversity
Food Security by Residence(Percent of Population)
Urban Rural
1.2 0.9 0.7
6.1
3.54.3
Calorie Deficiency rate
Protein Deficiency rate
Poor Dietary Diversity
Food Security by Residence (No of People, Millions)
Urban Rural
15
Figure 2
a) Food security by terrain type b) Major Farming Systems in Afghanistan
Source: a) Authors’ calculation based on NRVA 2007/2008; b) FAO24
Poverty status is a strong correlate of food security. Not surprisingly, poor households are more food insecure (Table 5). More than two thirds of the poor (69 percent) are food insecure in at least one of the three dimensions—calorie intake, protein intake, and dietary diversity. In contrast, only 27 percent of the non-poor experience some form of food insecurity. The same pattern emerges when households are classified into food “secure” and “insecure” based on their food security outcomes on all three dimensions. Fourteen percent of the poor are food insecure on all three dimensions, while only 2 percent of the non-poor experience simultaneous deficiency in calorie intake, protein consumption, and dietary diversity. The differences in food security outcomes between poor and non-poor notwithstanding, it is useful to note that a significant proportion of the non-poor also suffer from food insecurity in some dimension. An implication of this finding is that food security related projects will benefit from targeting on indicators closely linked to the food security outcomes, and not just a measure of poverty.
Food security varies considerably across provinces. Food security indicators vary considerably across provinces, reflecting the diversity of economic opportunities and social conditions across the country. Calorie deficiency rate varies from less than 15 percent in the provinces of Parwan, Nangarhar, Sar-i-Pul and Jawzjan to more than 60 percent in Badakhshan and Laghman. Protein deficiency is also one of the highest in Badakhshan and Laghman, 46 and 57 percent respectively, while the provinces of Sar-i-Pul, Jawzjan, Helmand, and Nimroz are relatively better off in terms of protein intake, with less than 4 percent of their population facing protein deficiency (GoA, AusAID and World Bank, 2011). Dietary diversity also varies
24 http://www.fao.org/countryprofiles/Maps/AFG/01/fs/index.html
24
15 16
31
18
2633
20 21
Calorie Deficiency rate
Protein Deficiency rate
Poor Dietary Diversity
Plain Plateau Mountain

16
considerably across province, from a low of less than 3 percent (Wardak, Zabul, Nimroz, Helmand, Kandahar, Farah) to a high of more than 60 percent (Ghor, Sar-i-Pul, Samangan).
Table 5: Food Security Measures by Poor and Non Poor (percent of population, 2007/08)
Calorie Deficiency
rate
Protein Deficiency
rate
Poor Dietary Diversity
Food Insecure (At least in one
dimension)
Food Insecure (All three
dimensions)
Non Poor 15.6 7.8 13.5 26.6 2.3
Poor 53.7 34.7 31.8 68.8 13.7
All 29.2 17.4 20.1 41.7 6.3
Source: Authors’ calculations based on NRVA 2007/2008
Prevalence of calorie deficiency varies broadly in tandem with poverty. Figure 3 and Figure 4 map the prevalence of poverty and calorie deficiency across provinces. These maps show a broadly similar pattern. For example, in Balkh, Ghazni, Paktya, Khost, Laghman, Badakshan, and Logar, high prevalence of poverty (ranging from 60 to 80 percent) has coincided with similarly high levels of calorie deficiency (ranging from 50 to 80 percent) (GoA, AusAID and World Bank, 2011). On the other hand, Zabul, Kandahar, Hilmand in the Southwest region and Farah and Herat in the West region have experienced relatively low levels of poverty (less than 40 percent) and calorie deficiency (less than 30 percent). Yet there are some notable exceptions, particularly in the West Central region (for example, Ghor and Daikundi) where the calorie deficiency rate was relatively low (19-20 percent) in contrast with their relatively high levels of poverty (43-44 percent). One possible explanation is that poor households in these provinces opt for higher consumption of cheaper calories (such as those from grains).25 This trade-off is explored in the next section of this report.
25 Another potential explanation for these contrasting outcomes could be relatively high share of food expenditure in some of these provinces, which directly translates into higher calorie intake. For example, Ghor, where calorie intake is higher in relation to poverty, is among the top six provinces in terms of its per capita food expenditure share (68 percent). On the other hand, Ghazni which features as one of the least poor but highly calorie deficient province is among the bottom four provinces in terms of its food expenditure share (51 percent).

17
Figure 3: Poverty Rate by Province
Figure 4: Calorie Deficiency by Province
18
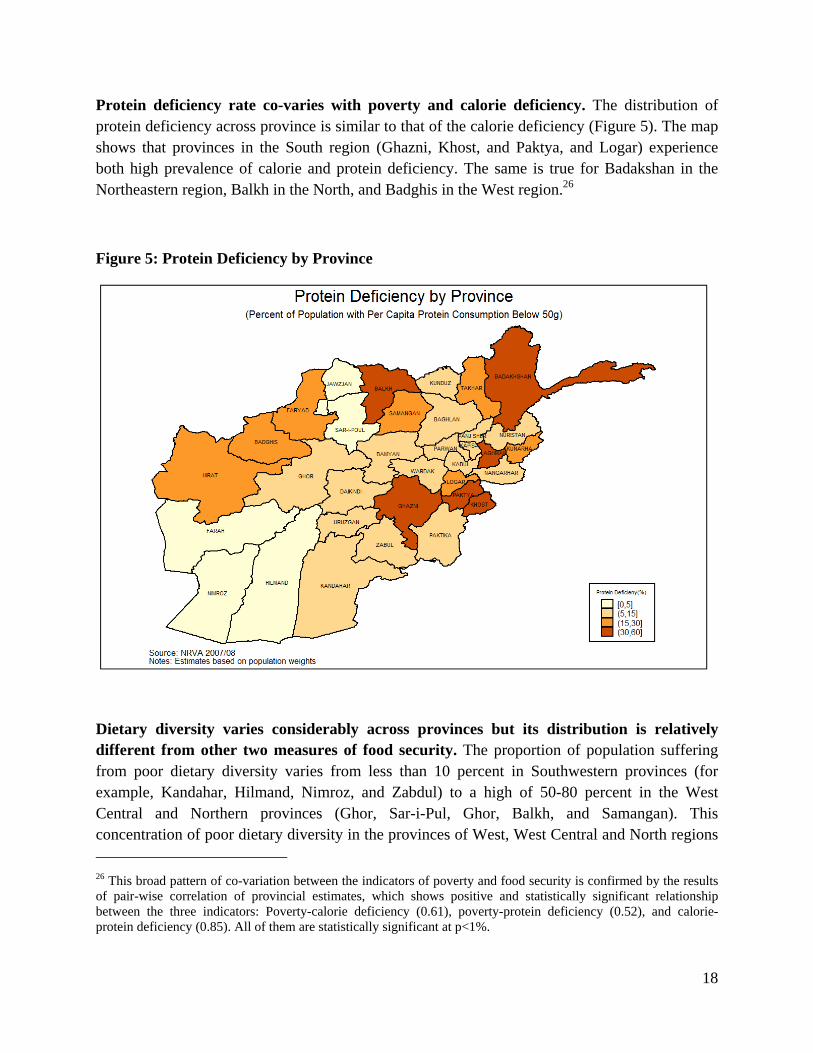
Protein deficiency rate co-varies with poverty and calorie deficiency. The distribution of protein deficiency across province is similar to that of the calorie deficiency (Figure 5). The map shows that provinces in the South region (Ghazni, Khost, and Paktya, and Logar) experience both high prevalence of calorie and protein deficiency. The same is true for Badakshan in the Northeastern region, Balkh in the North, and Badghis in the West region.26
Figure 5: Protein Deficiency by Province
Dietary diversity varies considerably across provinces but its distribution is relatively different from other two measures of food security. The proportion of population suffering from poor dietary diversity varies from less than 10 percent in Southwestern provinces (for example, Kandahar, Hilmand, Nimroz, and Zabdul) to a high of 50-80 percent in the West Central and Northern provinces (Ghor, Sar-i-Pul, Ghor, Balkh, and Samangan). This concentration of poor dietary diversity in the provinces of West, West Central and North regions 26 This broad pattern of co-variation between the indicators of poverty and food security is confirmed by the results of pair-wise correlation of provincial estimates, which shows positive and statistically significant relationship between the three indicators: Poverty-calorie deficiency (0.61), poverty-protein deficiency (0.52), and calorie-protein deficiency (0.85). All of them are statistically significant at p<1%.

19
is in sharp contrast with the distribution of calorie deficiency, which is generally lower in these two regions, with the exception of Balkh province (Figure 6).
Figure 6: Poor Dietary Diversity by Province
One potential source of low diversity in food consumption (in contrast with relatively high calorie consumption) in the West Central and North could be rooted in their typical livelihood options. For example, some of these provinces have high dependence on cereal production. Figure 7 shows per capita wheat production by province which is much higher in the northern region27, coinciding with the poor dietary diversity in many provinces (including Samangan, Balkh, and Sar-i-Pul). In these high wheat producing provinces, the ownership of livestock (cattle, sheep, and goats) also appears to be much lower (see Annex 2).28 This combination of high wheat production and low availability of other sources (such as livestock) could mean that provinces with low dietary diversity may be consuming more grain in relation to other sources of food, resulting in high calorie consumption but relatively low food diversity.
27 This map is based on the wheat production estimates for 2010 (GoA/MAIL (2010): Agriculture Prospects Report). It is assumed that the production patterns would have been similar in 2007/08. 28 Furthermore, these provinces appear to have relatively less opportunities for cross-border trade and migration, which are important sources of livelihoods in some pockets in the eastern and western regions (Annex 2).

20
Figure 7: Per Capita Wheat Production by Province (2010)
Table 6 explores this hypothesis. It shows that provinces with low dietary diversity (compared to other provinces) spend more on grain and bread (59% compared to 44%) and relatively less on dairy, fruits, and vegetables. Correspondingly, they also draw considerably higher amounts of calories from grain sources (Table 7). As noted above, another key explanation for this high consumption of grain calories in the relatively poorer regions in the Central and North regions is that poor families trade quality for quantity by opting for higher levels of cheaper calories.
Table 6: Share of Key Food Items in Household Expenditure
Province Groups29 Grains
and Bread
Meat Dairy Oil Vegetable Fruits Sweets
and Sugar
Low Prevalence of Poor Diet
44.6 12.6 10.8 7.5 9.3 6.8 3.7
High Prevalence of Poor Diet
59.1 10.1 4.6 9.8 6.6 2.6 3.3
Source: Authors’ calculations based on NRVA 2007/2008
29 Provinces where the prevalence of poor dietary diversity ( i.e. population having an FCS =< 42) is less than 40 percent are grouped into “Low Prevalence of Poor Diet” category, while those having a higher rate of poor dietary diversity are grouped into “High Prevalence of Poor Diet”.

21
Table 7: Per Capita Calories from Key Food Items
Province Groups Grains
and Bread
Meat Dairy Oil Vegetable Fruits Sweets
and Sugar
Low Prevalence of Poor Diet
1792 64 153 300 99 63 127
High Prevalence of Poor Diet
2028 50 59 320 77 24 78
Source: Authors’ calculations based on NRVA 2007/2008
III. SEASONALITY, PRICE SHOCKS, AND FOOD SECURITY
Food security in Afghanistan has a strong seasonal character. Seasonality plays an important role in food security in Afghanistan. Temperatures vary dramatically across seasons, with hot summers and frigid winters; and the climate in the highlands varies with elevation. In many cases, severe winter conditions affect transportation, and in high mountainous areas roads are often blocked throughout the winter due to heavy snow accumulation. In these communities in particular, households are forced to rely only on food supply stored before the winter. Therefore, one would expect large variation in food security outcomes across different seasons. Figure 8 below shows that the food security situation in Afghanistan (as measured by diet diversity, calorie and protein deficiency rates) was far worse in the spring and summer seasons of 2008 than that experienced in the fall and winter seasons of 2007.30
The seasonal variation in food security outcomes appears to be higher in the plateaus and mountainous region. The panel on seasonal variation (Figure 8) describes the extent to which each of the food security indicators varies over the year in each terrain type. Since the terrain characteristics and seasonal factors are strongly related, food security outcomes (particularly calorie and protein intake) appear to vary dramatically in the elevated mountainous regions, reflecting varied seasonal access to food sources from home production and markets (Figure 8). Moreover, across the quarters, food insecurity in mountainous regions and plateaus is generally higher than that in the plains (except for quarter 1 where calorie deficiency and protein deficiency are marginally higher in the plains). This reemphasizes the connection between poor agro-ecological conditions, limited production possibilities, limited access to non-farm activities owing to difficult geography, and the eventual impact on food security outcomes.
30 It is worth noting that the prevalence of poverty also followed a similar pattern, with poverty rates sharply rising from 23.1 and 31.8 in first two quarters to 43.6 and 46 percent in the spring and summer of 2008.

22
Figure 8
Source: Authors’ calculations based on NRVA 2007/2008
Food price crisis of 2007-2008 has interacted with the seasonal effects to worsen food security situation in Afghanistan. The food-price crisis can be seen in the pattern of food consumption across the seasons (Table 8). The table shows the seasonal variation in the calorie deficiency rate, the food poverty rate, the real food expenditure and the nominal food expenditure (Government of Afghanistan et al, 2010). First, it is worth noting that nominal food consumption stays largely unchanged throughout the year. The average monthly food expenditure, in nominal terms, is just under 1,200 AFA in each quarter. Once consumption is adjusted though for the change in food prices over the duration of the survey (accounting for the food price crisis, and also accounting for spatial differences in prices), the pattern is quite different. The real value of consumption is highest in quarter 1, after the fall harvest. With the advent of winter, real expenditures decline by about 20 percent; and then continue to decline as the food price crisis hit Afghanistan. Relative to the value of consumption in quarters 3 and 4, during the food-price crisis, quarter 1 consumption was approximately 50 percent higher.
Empirical analysis of the impact of food prices on food security in Afghanistan. In order to gain a deeper understanding of the impacts of rising price of staple foods on the welfare of Afghan population, this report draws on the extensive NRVA 2007/2008 data. The NRVA 2007/2008 allows the analysis of price effects due to its unique seasonally representative design (see Box 1 for details of food-price crisis). This section of the report aims to address the following key questions. How does an increase in the price of a staple food affect household wellbeing, specifically its food consumption, calorie intake, and the quality of diet (i.e. food diversity)? Do poor and non-poor families respond differently to rising food prices? In coping
24
1512
23
14
23
33
19
24
36
21 21
Calorie Deficiency rate
Protein Deficiency rate
Poor Dietary Diversity
Food Security by Season
Fall Winter Spring Summer
0.18 0.18
0.29
0.220.21
0.260.29
0.32
0.27
Calorie Deficiency rate
Protein Deficiency rate
Poor Dietary Diversity
Seasonal Variation by Terrain Type
Plain Plateau Mountain

23
with rising food prices, do families (in particular, poor ones) make quality-quantity trade-off in their food consumption?
Table 8: Food consumption measures by quarter
Qtr Season Calorie deficiency
rate(a)(%) Food poverty
rate(b) (%)
Food consumption (real terms)
Food consumption (nominal terms)
1 Fall 24 20 1,200 1,196
2 Winter 23 31 960 1,122
3 Spring 32 45 789 1,129
4 Summer 34 42 798 1,183
Note: (a) consumption below 2100 calories; (b) Food consumption below the food poverty line Source: Government of Afghanistan, Ministry of Economy and World Bank (2010).
Food price and food security relationship. To assess the average impact of food prices on household food security (national level analysis), multivariate regressions are estimated (by the OLS estimator) to assess the relationship between several measures of household food security (food consumption, calorie intake, and food consumption scores—a measure of dietary diversity) and the price of domestic wheat flour (D’Souza and Jolliffe, 2010). The advantage of multivariate regression analysis is that it allows the price effect to be partially isolated from other potentially confounding factors. To control for these potentially confounding factors, the multivariate model includes data on household characteristics (such as household head’s age, literacy, marital status), district features (rural or agricultural status of household, and terrain characteristics), prices of other goods (kerosene, milk, lamb, rice, vegetable oil), and province dummies. The advantage of this multi-variate approach can be seen by comparing it with the bi-variate table on food consumption by quarter (Table 8). In a bi-variate comparison, a very large decline in real food consumption is observed by quarter, but this decline could be due to many different factors in addition to the rising price of wheat (e.g. fuel prices were also increasing, which may have led to people needing to spend more on fuel and less on food). In the multivariate regression analysis, many of these other factors can be controlled for. The results from this analysis control for many potentially confounding factors and provide an estimate of how much the change in wheat price itself affected the food security outcomes.
24
Box 1: Food-Price Crisis
Source: D’Souza & Jolliffe (2010)
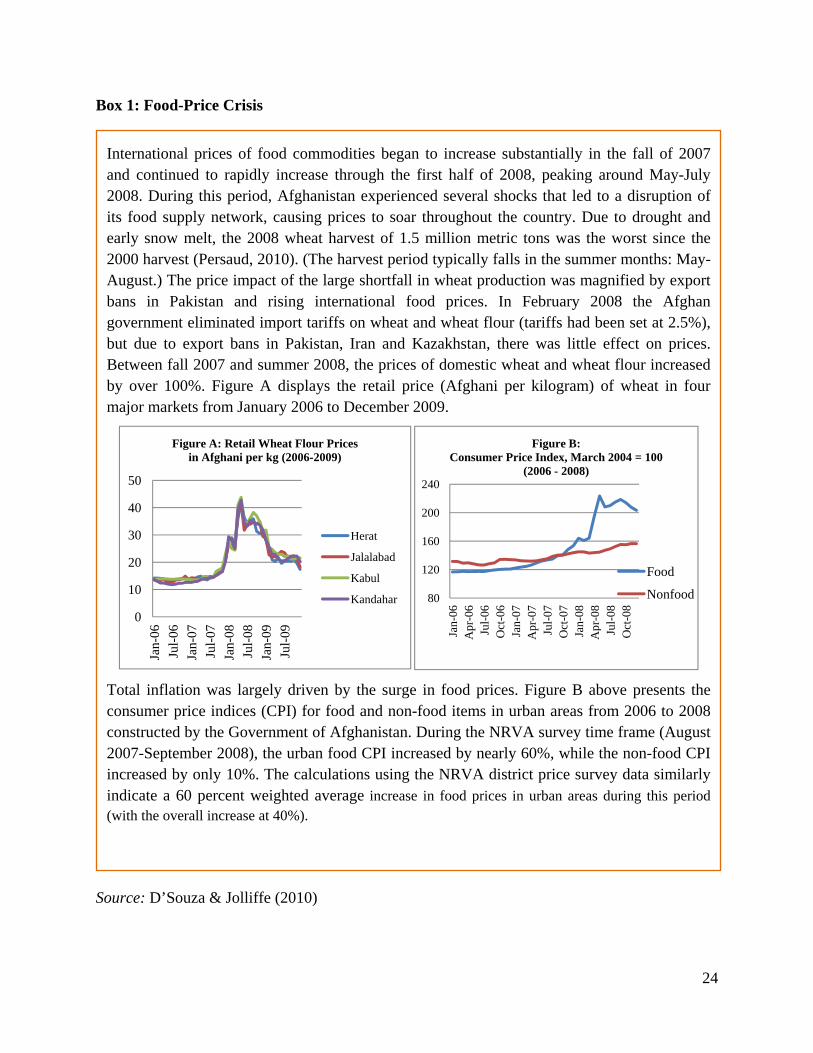
International prices of food commodities began to increase substantially in the fall of 2007 and continued to rapidly increase through the first half of 2008, peaking around May-July 2008. During this period, Afghanistan experienced several shocks that led to a disruption of its food supply network, causing prices to soar throughout the country. Due to drought and early snow melt, the 2008 wheat harvest of 1.5 million metric tons was the worst since the 2000 harvest (Persaud, 2010). (The harvest period typically falls in the summer months: May-August.) The price impact of the large shortfall in wheat production was magnified by export bans in Pakistan and rising international food prices. In February 2008 the Afghan government eliminated import tariffs on wheat and wheat flour (tariffs had been set at 2.5%), but due to export bans in Pakistan, Iran and Kazakhstan, there was little effect on prices. Between fall 2007 and summer 2008, the prices of domestic wheat and wheat flour increased by over 100%. Figure A displays the retail price (Afghani per kilogram) of wheat in four major markets from January 2006 to December 2009.
Total inflation was largely driven by the surge in food prices. Figure B above presents the consumer price indices (CPI) for food and non-food items in urban areas from 2006 to 2008 constructed by the Government of Afghanistan. During the NRVA survey time frame (August 2007-September 2008), the urban food CPI increased by nearly 60%, while the non-food CPI increased by only 10%. The calculations using the NRVA district price survey data similarly indicate a 60 percent weighted average increase in food prices in urban areas during this period (with the overall increase at 40%).
0
10
20
30
40
50
Jan-
06
Jul-
06
Jan-
07
Jul-
07
Jan-
08
Jul-
08
Jan-
09
Jul-
09
Figure A: Retail Wheat Flour Prices in Afghani per kg (2006-2009)
Herat
Jalalabad
Kabul
Kandahar 80
120
160
200
240
Jan-
06A
pr-0
6Ju
l-06
Oct
-06
Jan-
07A
pr-0
7Ju
l-07
Oct
-07
Jan-
08A
pr-0
8Ju
l-08
Oct
-08
Figure B: Consumer Price Index, March 2004 = 100
(2006 - 2008)
Food
Nonfood

25
Several salient findings emerge from the household-level food security analysis. Prior to and during the large increase in food prices from August 2007 to September 2008, the descriptive statistics reveal a large decline in the real food consumption and a large increase in the calorie deficiency rate. The regression analysis provides a more complete picture and reveals that the price elasticities with respect to calories are much smaller than those with respect to food consumption. In other words, larger reductions in food consumptions are observed compared to those in calorie intake. This suggests that households traded off quality for quantity of calories consumed. As additional evidence of this trade-off, the regression estimates show that the price increases are associated with changes in the composition of food consumption, namely decreases in dietary diversity and a movement towards staple foods.
Increase in wheat flour price is associated with a significant decline in food consumption. Specifically, a ten percent increase in the price of domestic wheat flour is associated with a 4.3 percent decline in real monthly per capita food consumption (Table 9). Given the large increases in wheat prices observed over the last several years, the potential effects on consumption are large. For example, between June and December of 2010, the retail price of wheat in Afghanistan was estimated to increase by 19 percent (World Bank, 2011). To illustrate the poverty effect of an increase in wheat prices of this size, consider the hypothetical exercise of subtracting from total consumption an amount equal to 8 percent of the value of food consumption (as would be implied from a 19 percent increase in wheat prices multiplied by 0.43, the estimated change in food consumption from wheat price changes). With this decline in total consumption, the poverty rate for Afghanistan would increase by 5 percentage points. (Islamic Republic of Afghanistan, 2010).
Table 9: The Impact of Higher Food Prices on Food Security of Average Household
Log real per capita food consumption
Log daily per capita calorie intake
Log food consumption
score
Log Wheat Flour Price -0.43*** -0.18*** -0.19***
[0.040] [0.024] [0.027]
Observations 20,483 20,483 20,483
R-squared 0.35 0.25 0.39
Source: See Annex III

26
The impact of rising wheat price on calorie intake and food diversity is less pronounced than that experienced in food consumption. The price response of calories and dietary diversity (at the national level) show that households are able to buffer the impact of the large shock in prices to a certain extent. The regression results in Table 9 show that on average, a ten percent in the wheat flour price would lead to a 1.9 percent decline in calorie intake. This relatively smaller effect on calories can be explained by the decline in dietary diversity. Food consumption scores—a measure of dietary diversity—would decline by a similar amount (1.8 percent), on average, with a ten percent increase in the price of wheat.31
Evidence suggests that households are trading off quality for quantity. As a result of the price increases and the subsequent decline in purchasing power, households change the composition of their diets in order to maintain calories.32 In particular, they shift towards lower quality (less nutrient-rich), cheaper foods, thus allowing them to acquire more food to maintain their calories – to the extent possible – in the face of large declines in purchasing power.33 The regression results show a decline in expenditure shares of all food groups except grains, consistent with a story of substitution across food groups and a movement toward staple food consumption (D’Souza and Jolliffe 2010). The largest decline is seen in fruit, which can be considered a luxury item.
Behavioral response of different groups: The forgoing results provide the estimate of average response of households to a change in wheat price. However, if there are reasons to believe that poor households respond to price changes differently than nonpoor households (or, more precisely, households at different points of the distribution), then it is helpful to disaggregate the estimated behavioral responses for different groups. For example, a household’s degree of sensitivity to an increase in wheat flour prices may depend on the percentage of its budget devoted to wheat relative to other foods or on its average level of nutrition; and factors such as these may differ for rich and poor households. In such situations, the average estimates calculated through OLS regression (such as those presented above) could be misleading.
Distribution sensitive analysis of behavioral response. The following analysis shows the impact of rising prices on different groups, classified by their status on the food security measure of interest. Using a recent innovation in quantile regression analysis – the unconditional quantile regression (UQR), the analysis now examines the impact of the wheat flour price shocks on
31 Other analysis by D’Souza and Jolliffe (2010) reveals that the percentage reduction in grams of protein consumed is greater than the reduction in calories and diversity. 32 The NRVA 2007/2008 has a section on shocks which asks the respondents to mention any shocks (up to three) that have negatively impacted their household. Surprisingly, only 1.5 percent of the households reported ‘unusually high increases in food price’ as a shock. Those who reported food price increase as a shock also mentioned using different coping mechanisms including reducing food consumption, sale of assets, community support etc. Further disaggregation of those who reported reducing quality or quantity of food shows that 25 percent reported reducing both quantity and quality, 11 percent mentioned reducing quality only and 12 percent reported reducing the quantity only. This contrast between subjective findings and empirical results require further investigation. 33 Diagana et al., (1999) find similar effects – decreases dietary diversity and changes in food consumption patterns – after the devaluation of the CFA franc in 1994.
27
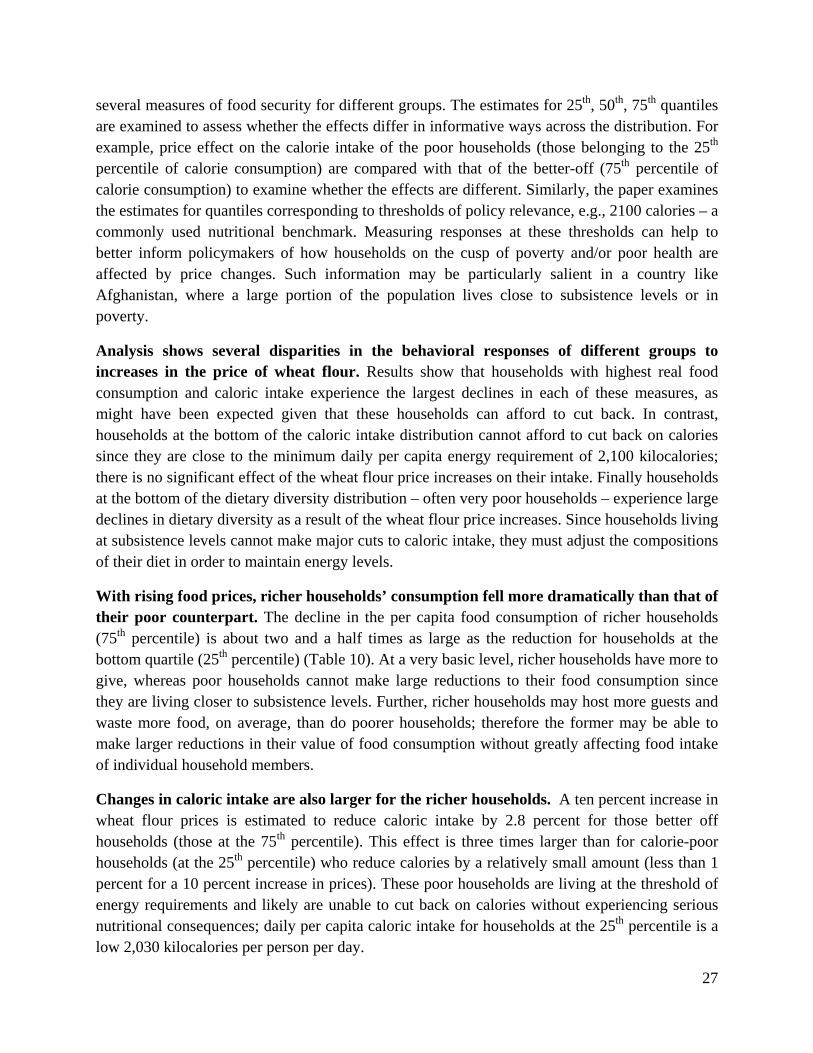
several measures of food security for different groups. The estimates for 25th, 50th, 75th quantiles are examined to assess whether the effects differ in informative ways across the distribution. For example, price effect on the calorie intake of the poor households (those belonging to the 25th percentile of calorie consumption) are compared with that of the better-off (75th percentile of calorie consumption) to examine whether the effects are different. Similarly, the paper examines the estimates for quantiles corresponding to thresholds of policy relevance, e.g., 2100 calories – a commonly used nutritional benchmark. Measuring responses at these thresholds can help to better inform policymakers of how households on the cusp of poverty and/or poor health are affected by price changes. Such information may be particularly salient in a country like Afghanistan, where a large portion of the population lives close to subsistence levels or in poverty.
Analysis shows several disparities in the behavioral responses of different groups to increases in the price of wheat flour. Results show that households with highest real food consumption and caloric intake experience the largest declines in each of these measures, as might have been expected given that these households can afford to cut back. In contrast, households at the bottom of the caloric intake distribution cannot afford to cut back on calories since they are close to the minimum daily per capita energy requirement of 2,100 kilocalories; there is no significant effect of the wheat flour price increases on their intake. Finally households at the bottom of the dietary diversity distribution – often very poor households – experience large declines in dietary diversity as a result of the wheat flour price increases. Since households living at subsistence levels cannot make major cuts to caloric intake, they must adjust the compositions of their diet in order to maintain energy levels.
With rising food prices, richer households’ consumption fell more dramatically than that of their poor counterpart. The decline in the per capita food consumption of richer households (75th percentile) is about two and a half times as large as the reduction for households at the bottom quartile (25th percentile) (Table 10). At a very basic level, richer households have more to give, whereas poor households cannot make large reductions to their food consumption since they are living closer to subsistence levels. Further, richer households may host more guests and waste more food, on average, than do poorer households; therefore the former may be able to make larger reductions in their value of food consumption without greatly affecting food intake of individual household members.
Changes in caloric intake are also larger for the richer households. A ten percent increase in wheat flour prices is estimated to reduce caloric intake by 2.8 percent for those better off households (those at the 75th percentile). This effect is three times larger than for calorie-poor households (at the 25th percentile) who reduce calories by a relatively small amount (less than 1 percent for a 10 percent increase in prices). These poor households are living at the threshold of energy requirements and likely are unable to cut back on calories without experiencing serious nutritional consequences; daily per capita caloric intake for households at the 25th percentile is a low 2,030 kilocalories per person per day.

28
Table 10: Differential Impact of increase in Wheat Prices on Poor and Non Poor
Poor (25%) Median Household (50%) Upper (75%)
Food Consumption (log, real, monthly, value)
-0.24*** -0.43*** -0.62***
Calorie Intake (log, daily, per capita)
-0.09*** -0.19*** -0.28***
Diet Diversity (log WFP food Consumption Score)
-0.25*** -0.17*** -0.16**
Note: Each cell represents a separate unconditional quantile regression (UQR) with population weighted estimates. *, **, and *** denote significance at 10%, 5% and 1%, respectively
Source: See Annex III
Changes in caloric intake are linked to concessions in dietary quality, as reflected in the dietary diversity measure. In order to fully maintain energy levels in the face of the wheat flour price increases, households at the bottom of the distribution adjust dietary diversity much more than they adjust caloric intake, whereas households at the top of the distribution reduce both caloric intake and dietary diversity. These findings are consistent with the literature on the impact of high food prices on nutritional outcomes (see Klotz et al. (2008), Diagana et al. (1999), Martin-Prevel et al. (2000), Block et al. (2004). Also see Ruel et al. (2009) for a more detailed review of the literature on the effects of economic crises on household wellbeing).
Impact of food prices on population groups defined by policy thresholds. Further analysis pertains to the effects of wheat flour prices on measures of food security at the pertinent policy thresholds. For the real value of food consumption, pertinent policy point is the food poverty line of 687.13 Afghani. Similarly, the relevant point on distribution for caloric intake is the daily threshold of 2,100 calories per capita and for the food consumption score, this report considers one of the thresholds recommended by WFP (borderline food secure) -- a value of 42.
The impacts of food prices at the relevant policy thresholds of food security measures are statistically significant. A one percent increase in the price of wheat flour is associated with a 0.3 percent decline in the real value of food consumption at the national level (Table 11). For those households living near subsistence levels, consuming approximately 2,100 calories per

29
day, there is a small decline of 0.1 calories per capita given a one percent increase in wheat flour prices. At the thresholds which define a borderline diet, dietary diversity declines significantly in statistical terms. The reductions in dietary diversity are larger for households at the upper threshold than for those at the lower threshold. This finding is not surprising since households at the cusp of a poor diet are likely consuming mostly grains and oils and thus have less room for adjustment following the price increases.
Table 11: Household Response to Price at Policy Thresholds
Policy Thresholds Change from increase
in wheat prices
Real Value of Monthly Food Consumption =687.13 -0.30***
Daily Calorie Intake Per Capita =2,100 -0.12***
Poor Diet (Food Consumption Score=42) -0.26***
Note: Each cell represents a separate unconditional quantile regression (UQR) with population weighted estimates. *, **, and *** denote significance at 10%, 5% and 1%, respectively.
Source: See Annex III
IV. CONCLUSION
Food security is a major concern for a significant part of Afghan population. High volatility in local production of staple food and increasing and volatile food prices only add to the challenge by reducing the population’s ability to sustain a stable, adequate and good quality diet. This report provides an overview of the geographic variation of food security in Afghanistan and synthesizes the findings of empirical analysis presented in two inter-related papers (D’Souza and Jolliffe, 2010, 2011). These papers focus on assessing the impacts of rising food prices (in 2007/2008 using the NRVA data for the same year) on various measures of household food security (food consumption, calorie intake, protein intake, and dietary diversity).
The report highlights that food security outcomes vary considerably across provinces, broadly in tandem with poverty. It shows that there are many provinces such as Balkh, Ghazni, Paktya, Khost, Laghman, Badakshan, and Logar where high prevalence of poverty (ranging from 60 to 80 percent) has coincided with high levels of calorie deficiency (ranging from 50-80 percent).

30
This inter-relatedness of poverty and food security is confirmed by the fact that more than two thirds of the poor (69 percent) are food insecure in at least one of the three dimensions—calorie intake, protein intake, and dietary diversity. In contrast, only 26 percent of non-poor experience some form of food insecurity.
Several key findings emerge from the impact analysis of rising food prices on food security. The OLS regression estimates which look at the average impact (at the national level) show that with the doubling of wheat flour prices, food consumption drops by 43 percent. However, the price responsive is smaller for calorie intake (18 percent) and dietary diversity (19 percent). This suggests that households reduced consumption by reducing both the quantity consumed (as measured by calories) and diet quality (as measured by dietary diversity). In reducing diet quality, households essentially traded off quality for quantity of calories consumed. As additional evidence of this trade-off, regression estimates show that the price increases are associated with changes in the composition of food consumption, namely decreases in dietary diversity and a movement towards staple foods (D’Souza and Jolliffe, 2010).
Further analysis of price effects on different types of households (using UQR) shows that there are large differences in the behavioral response of households to rising wheat flour price based on their food security status (e.g. whether food secure or insecure). The differences uncovered in this analysis are typically obscured when using standard (OLS) estimation techniques. Households at the 75th percentile of the distribution of real food consumption (ie. those that are better off in terms of food consumption) experience the largest percentage declines in real food consumption for a given increase in wheat flour prices – over four times larger than those at the 25th percentile. Analogously, those at the 75th percentile of the caloric intake distribution experience the largest percentage declines in caloric intake for a given increase in wheat flour prices. As some might expect, households at the bottom of the caloric intake distribution experience a relatively small decline in caloric intake due to the price increases. Such households live near subsistence levels and are forced to make adjustments to the quality of their diets in order to maintain energy levels; households at the 25th percentile of the dietary diversity distribution make the largest changes to the quality of their diets – about fifty percent larger than those at the 75th percentile (i.e. those with relatively much higher dietary diversity).
The findings have several implications for policy. First, given large differences in food security outcomes at the sub-national level (for example, across provinces), better targeting is crucial to increase the effectiveness of food security programs. For example, provinces that are poor in overall terms may or may not be equally poor in terms of calorie intake and the diversity of diet. In fact, many provinces that perform well on calorie intake (for example, Ghor and Sar-i-Pul) are worse-off in terms of dietary diversity. Similarly, provinces that do not produce surplus grain may not necessarily be calorie deficient. For example, Daikuni, Nuristan, and Bamyan have experienced relatively lower levels of calorie deficiency (less than 30 percent) compared to Ghazni, Balkh, Laghman and Badadshan where the calorie deficiency rate is in excess of 50

31
percent.34 These large and sometime divergent food security outcomes at the provincial level underscore both complexity of and need for better targeting that is required to inform policy choices.
Second, the empirical evidence highlights that if policy makers focus exclusively on changes in caloric intake in the event of a price shock, they may miss an important component of the big picture. While poorer households do not cut back on calories, the evidence presented in this report show that they reduce dietary quality by making adjustment in their consumption patterns, for example, by increasing the consumption of staple food (for example, wheat). Therefore, the government’s on-going efforts to ensure adequate supply of staple food during the time of crisis can only address part of the challenge. But the high degree of micro-nutrient deficiency among children in general and high potential for this problem to compound during the time of food crisis (through increased consumption of low quality diet by the poor) suggest that complementary efforts are also equally crucial to address micro-nutrient deficiency (such as through the fortification of staples and vitamin distributions). To this end, devising new initiatives as well as improving the outreach and targeting in existing programs (e.g. WFP’s micro-nutrient enriched food for children and wheat flour fortification initiative) would help secure better food security outcomes. For instance, increased efforts are needed to boost the uptake of fortified wheat flour in rural areas where the poor diet is affecting a much larger proportion of the population.
Finally, given that poor nutrition and food insecurity affects a sizeable proportion of Afghan population year-round but more so during bad times (e.g. lean months of spring season or during food price shocks), there is genuine need for a scaled-up and well-targeted safety nets program in Afghanistan. Currently, the government is implementing a few state sponsored safety nets programs but they have limited outreach. Other initiatives such as conditional in-kind and cash transfers to the vulnerable groups under the WFP led programs are implemented as part of relief and recovery efforts and have varying degrees of outreach and effectiveness. Lessons can be learned from these experiences to devise a comprehensive safety net program that is well targeted, reliable and sufficient in scale.
34 MAIL 2009: Strategic Grain Reserve: Infrastructure for Food Security (Concept Paper)

32
References
Block, Steven A., Lynnda Kiess, Patrick Webb, Soewarta Kosen, Regina Moench-Pfanner, Martin W. Bloem, and C. Peter Timmer. “Macro shocks and micro outcomes: child nutrition during Indonesia’s crisis,” Economics and Human Biology. Vol 2. 2004. 21-44.
Chabot, Philippe and Paul A. Dorosh (2007): “Wheat markets, food aid and food security in Afghanistan,” Food Policy. Vol. 32. 2007. 334-353.
Deaton, A., & Dreze, J. (2009). Food and Nutrition in India: Facts and Interpretations. Economic and Political Weekly, XLIV(7), 42-65
Diagana, Bocar, Francis Akindes, Kimseyinga Savadogo, Thomas Reardon, and John Staatz. “Effects of the CFA franc devaluation on urban food consumption in West Africa: overview and cross-country comparisons,” Food Policy. Vol. 24. 1999. 465-478.
D'Souza, A. E., & Jolliffe, D. (2012): Rising Food Prices and Coping Strategies: Household-Level Evidence from Afghanistan. Journal of Development Studies, 48(2): pp-pp.
D'Souza, A. E., & Jolliffe, D. (2011). Food Security and Wheat Prices in Afghanistan: A Distribution-sensitive Analysis of Household-level Impacts, orld Bank Policy Research Working Paper Series 56XX.
Economic Research Service, U.S. Department of Agriculture: Food Security Assessment, 2008-2009. GFA-20. June 2009.
FEWSNET and USAID: Livelihoods Zoning “Plus” Activity in Afghanistan. [Online:]
http://www.fews.net/docs/Publications/AF_livelihoods%20descriptions_en.pdf [August 4, 2011]
Food Aid Convention (FAC): Food Aid Operations 2008/09. Secretariat of the International Grain Council, London, February 2010.
Food and Agricultural Organization, U. N (2006): Afghanistan. National Livestock Census 2002-2003, Final Report 2006. [Online:] http://www.fao.org/docrep/010/i0034e/i0034e00.htm.
Food and Agricultural Organization, U. N. (2008). The State of Food Insecurity in the World 2008: High food prices and food security – threats and opportunities.
Food and Agricultural Organization, U. N. Afghanistan: Map of Major Farming Systems. [Online:] http://www.fao.org/countryprofiles/Maps/AFG/01/fs/index.html [January 3, 2012]
Islamic Republic of Afghanistan, Ministry of Agriculture, Irrigation and Livestock: Agriculture Prospects Report, MAIL, General Department of Policy and Planning, Statistics and Marketing Information Office, Kabul. May 2010.

33
Islamic Republic of Afghanistan, Ministry of Economy, and the World Bank, Economic Policy and Poverty Sector. Poverty Status in Afghanistan: A Profile based on the National Risk and Vulnerability Assessment (NRVA) 2007/08. Kabul: July 2010.
Islamic Republic of Afghanistan, Ministry of Economy, and the World Bank, Economic Policy
and Poverty Sector. Afghanistan Provincial Briefs. Kabul: June 2011.
International Monetary Fund (2009): World Economic Outlook 2009. Crisis and Recovery, April 2009
Klotz, Christine, Saskia de Pee, Andrew Thorne-Lyman, Klaus Kraemer, and Martin Bloem. “Nutrition in the Perfect Storm: Why Micronutrient Malnutrition will be a Widespread Health Consequence of High Food Prices,” Sight and Life Magazine. Iss. 2. 2008.
Maletta, Hector (2004): “Winters of Discontent: Seasonal changes in wages and food prices in Afghanistan, 2002-2003,” FAO discussion paper. January 2004. [Online:] ftp://ftp.fao.org/country/afghanistan/Winters_of_discontent.pdf [April 15, 2010]
Martin-Prevel, Y., F. Delpeuch, P. Traissac, J-P. Massamba, G. Adoua-Oyila, K. Coudert, and S. Treche. “Deterioration in the nutritional status of young children and their mothers in Brazzaville, Congo, following the 1994 devaluation of the CFA franc,” Bulletin of the World Health Organization. Vol.78. Iss. 1. 2000. 108-118.
Ministry of Agriculture, Irrigation and Livestock (MAIL): Strategic Grain Reserve: Infrastructure for Food Security, Concept Paper under the Agricultural Production and Productivity Programme, National Agriculture Development Framework, April 2009.
Organization for Economic Co-operation and Development (OECD)/Development Assistance Committee (DAC): DAC2a ODA Disbursements. [Online:] http://stats.oecd.org/Index.aspx?DatasetCode=TABLE2A [March 5, 2011]
Persaud, Suresh (2010): “Price Volatility in Afghanistan's Wheat Market,” E-Outlook Report No. WHS-10d-01. U.S. Department of Agriculture, Economic Research Service. May 2010.
Ruel, Marie T., James L. Garrett, Corinna Hawkes and Marc J. Cohen. "The Food, Fuel, and Financial Crises Affect the Urban and Rural Poor disproportionately: A Review of the Evidence,” in supplement: “The Impact of Climate Change, the Economic Crisis, and the Increase in Food Prices on Malnutrition,” The Journal of Nutrition (Nov. 25, 2009).
UNICEF: Tracking Progress on Child and Maternal Nutrition: a survival and development priority. New York: UNICEF. November 2009.
United Nations Development Program (UNDP): Human Development Report 2009. [Online:] http://hdr.undp.org/en/reports/global/hdr2009/chapters/ [April 20, 2010]
United Nations Office on Drugs and Crime (UNODC) (2008): Afghanistan Opium Survey, 2008. Kabul and Vienna: UNODC. September 2008. [Online:]

34
http://www.unodc.org/documents/publications/Afghanistan_Opium_Survey_2008.pdf [January 03, 2012]
World Bank. Enhancing Food Security in Afghanistan: Private Market and Public Policy Options, Agriculture and Rural Development Sector and Human Development Sector South Asia Region, Discussion Paper Series. August 2005.
World Bank. Food Price Increases in South Asia: National Responses and Regional Dimensions. South Asia Region Sustainable Development Department. Washington DC. June 2010
World Bank. Afghanistan Nutrition, Washington, DC. 2011.[Online:] http://siteresources.worldbank.org/SOUTHASIAEXT/Resources/223546-1171488994713/3455847-1232124140958/5748939-1234285802791/AfghanistanNutrition.pdf. [December 14, 2011]
World Bank. Food Price Watch. Poverty Reduction and Economic Management Newsletter. Washington, DC. 2011. [Online:] http://siteresources.worldbank.org/INTPREMNET/Resources/Food_Price_Watch_Feb_2011_Final_Version.pdf. [December 15, 2011]
World Bank and UNHCR—The UN Refugee Agency. Research Study on IDPs in Urban Settings of Afghanistan. Kabul, May 2011. [Online:] http://siteresources.worldbank.org/EXTSOCIALDEVELOPMENT/Resources/244362-1265299949041/6766328-1265299960363/WB-UNHCR-IDP_Full-Report.pdf. [January 3, 2012]
World Food Programme (WFP) (2009): Evaluation of Afghanistan-PRRO 10427 (Evaluation Report). “Post Conflict Relief and Rehabilitation in the Islamic Republic of Afghanistan”, Office of Evaluation, World Food Programme 2009.
World Food Programme (WFP): [Online:] http://www.wfp.org/countries/Afghanistan/Operations [February 24 & March 03, 2011]
World Food Programme (WFP): International Food Aid Information System. [Online:] http://www.wfp.org/fais/quantity-reporting [March 5, 2011]
35
Annex 1: WFP’s Key Food Assistance Programs and their Performance
a) Relief-General Food Distribution
Provision of relief ration to people who suffer from man-made and natural disasters is one of the key components of WFP’s food operations. During 2006-2008, 21 percent of WFP’s overall food distribution went to support emergency food aid, including relief-focused food for work programs to benefit on average a million people each year (WFP 2009). In 2010, WFP’s relief food assistance reached more than 1.8 million people, including those affected by floods and landslides as well as returning refugees and internally displaced persons due to conflict (Table 4).
Relief food activities have done a relatively better job in reaching the desired groups. A World Bank report “Enhancing Food Security in Afghanistan: Private Market and Public Policy Options” notes that relief food aid targeted the poorest 20 percent better than the other two programs—Food for Work and Cash for Work (World Bank 2005). However, the report also identified significant exclusion errors; 85 percent of food insecure households did not benefit from relief food, implying both limited coverage of the program as well as significant inclusion errors. A more recent evaluation carried out by the WFP notes that the majority of relief food recipients matched the specified targeting criteria which typically included widows/female headed households, disabled, IDPs/returnees and landless families in rural areas (WFP 2009).
b) Food for Work
The Food for Work (FFW) program provides food support to vulnerable and poor Afghans as an incentive for their labor contribution in building or repairing productive community infrastructure such as roads, bridges, reservoirs and irrigation systems. The projects are selected in consultation with the government and local communities. Though FFW was originally intended to be a recovery activity, it has also become a key component of relief food aid, reflecting the general cultural preference of beneficiaries to contribute back in exchange for relief food. As a result, FFW activities (both relief and recovery) has become one of the largest component of WFP’s food aid. For instance, recovery FFW accounted for 38 percent of overall food distribution in 2006-2008, while relief FFW claimed another 8 percent during the same period (WFP 2009).
In terms of beneficiary coverage, FFW assisted around 1.5 million Afghan people in 2010. Targeting appears to be a challenge, however. World Bank (2005) notes that only 37 percent of poor households participated in FFW programs, while nearly two-thirds were excluded. The evaluation of most recent PRRO by WFP notes that low value of FFW vis-à-vis daily labor rates help self select the beneficiaries from most vulnerable groups (WFP 2009). However, the report also mentions reports from donors indicating as little as 50 percent of beneficiaries meeting the WFP’s specified criteria for FFW eligibility. There were also cases in which communities

36
reported food delivery delays of up to 8 months, thus curtailing the ability of vulnerable communities to cope with their food needs.
c) Food for Education
Food for Education (FFE) aims to bridge nutritional gaps among children and promote school enrollment, particularly among girls, by providing school meals and take-home rations. It continues to be one of the largest components of WFP’s food operations in Afghanistan, accounting for close to a third of overall food distribution and serving an annual beneficiary base of more than 1 million children35. In 2010 alone, as part of its on-site feeding program, WFP fed over a million children with a daily snack of micro-nutrient enriched biscuits (also known as High Energy Biscuits) or a hot meal. In addition, to reduce the gender gap in schooling in areas where female enrollment is low, WFP distributed a take-home ration of vegetable oil to 600,000 girl students as an incentive to their families to send the girls to schools.
FFE is considered to have an important role in strengthening enrollment in primary schools, particularly among girls. Comparison between FFE beneficiary and non-beneficiary schools show positive effects in terms of narrowing gender gap, with FFE incentives being more successful in enrolling girls at the entry level grades (WFP 2009). These positive effects notwithstanding, there were challenges associated with the exclusion of potentially eligible participants from FFE programs due to complexity of targeting criteria. Over-crowding in FFE-schools was also noted as a key issue in some instances.
d) Food for Training
Food for Training (FFT) is designed to help the poor acquire functional literacy and vocational skills. The ultimate objective of FFT is to improve economic and social prospects for vulnerable members of the community, particularly women. As part of this initiative, WFP has provided food ration to over 500,000 participants since 2006. This includes 140,000 participants, mostly women, who were given food rations during 2010 to feed their families in return for their participation in various training activities, including literacy, reproductive and child care, and other skills-building programs (such as handicraft production, carpentry, and plumbing). FFT also includes food support for teachers’ training, mostly in rural parts. Overall, FFT has primarily focused on reaching to beneficiary groups in food insecure regions and has helped ensure participation in functional literacy and vocational training programs.
e) Health and Nutrition Components
35 For example, FFE accounted for 30 percent of WFP’s total distribution in 2006-08, benefiting around 2.1 million children annually (see table 3-6 in Evaluation of Afghanistan-PRRO 104270, Office of Evaluations WFP, October 2009)

37
WFP supports a number of health and nutrition activities, including assistance to tuberculosis (TB) patients, wheat flour fortification, and a newly launched Mother and Child Health and Nutrition program36. Under its efforts to support national campaign against TB, WFP is providing a monthly ration to more than 20,000 patients as an incentive to complete their eight-month Direct Observational Treatment (DOT) course at clinics across the country. As a result, many positive outcomes have been witnessed over the years, including an increase in the number of people seeking voluntary TB treatment, increased DOT coverage and an overall decrease in the number of defaulters in terms treatment completion (WFP 2009).
Wheat flour fortification initiative aims to reduce deficiencies of iron and other micronutrients among vulnerable groups, particularly among women of child-bearing age. In 2010, eight mills across Afghanistan were producing on average 250 metric tons of fortified wheat flour per day. The fortification involved adding vitamins and other essentials minerals to wheat flour. Initial assessments show that the majority of fortified wheat consumers belongs to urban lower and middle-income classes (WFP 2009).
Mother and Child Health and Nutrition program aims to fight malnutrition among pregnant women, new mothers and children under the age of 5. Under this newly launched program, WFP provides nutritious food to pregnant and nursing mothers to help them survive pregnancy, while children under the age of 5 are given a special nutritional past to avoid long-term consequences of poor nutrition. In 2011, WFP aims to increase the outreach of the program by providing nutritional support to around 55,000 women (pregnant and nursing mothers) and 62,000 children.
36 De-worming initiative has been another notable activity under the health and nutrition component. The initiative aims to address high levels of worm infestation among school going children (see WFP 2009 for more details).

38
Annex 2: Maps of Livestock Ownership and Dominant Livelihoods Zones

39
Annex 3: Descriptive Statistics and Regression Estimates from Section III
NationalAgricultural
Households aNonagricultural
Households a
1926 1752 2159
(1158) (934) (1371)
1158 1134 1189
(583) (528) (648)
2601 2587 2619
(974) (977) (969)
60.95 61.59 60.07
(20.03) (19.48) (20.71)
44.87 45.37 44.19
(13.78) (13.68) (13.89)
2.09 2.19 1.96
(1.30) (1.33) (1.25)
2.01 2.09 1.89
(1.19) (1.22) (1.13)
4.51 4.75 4.18
(2.39) (2.46) (2.26)
Dummy for married household heads 0.95 0.95 0.94
Dummy for literate household heads 0.32 0.30 0.34
Dummy for plateau areas 0.22 0.27 0.16
Dummy for mountainous areas 0.39 0.49 0.27
Total observations 20,491 11,633 8,858
Percentage of full sample 100.00 0.57 0.43
Table 1. Population means
Note: Estimated population weighted means. Standard deviations in parentheses. Prices in Afghani per kilogram or
liter (kerosene). aStatistical tests of differences in means (corrected for complex sample design) between prices faced by Agricultural and Nonagricultural Households (based on location) show significant differences at a 5% level of significance for all estimated means. Source: NRVA 2007/08
Nominal value of per capita monthly total consumption (Afghani)
Nominal value of per capita monthly food consumption (Afghani)
Per capita daily caloric intake (kilocalories)
Food consumption score
Age of household head
Number of males
Number of females
Number of children under 16

40
NationalAgricultural
Households aNonagricultural
Households a
Price of wheat flour 28.45 29.01 28.45
(8.15) (8.35) (8.15)
Price of vegetable oil 81.16 82.39 81.16
(6.88) (6.97) (6.88)
Price of rice 42.77 43.25 42.77
(14.93) (15.07) (14.93)
Price of lamb 184.44 183.01 184.44
(11.97) (12.38) (11.97)
Price of milk 26.94 26.57 26.94
(23.91) (24.08) (23.91)
Price of kerosene 48.12 48.80 48.12
(6.25) (6.05) (6.25)
Table 2. Average prices of key commodities
Note: Estimated population weighted means. Standard deviations in parentheses.
Prices in Afghani per kilogram or liter (kerosene). aStatistical tests of differences in means (corrected for complex sample design) between prices faced by Agricultural and Nonagricultural Households (based on location) show significant differences at a 5% level of significance for all estimated means; the price of lamb is the exception. Source: NRVA 2007/08

41
Quarter 1 (Fall)
Quarter 2 (Winter)
Quarter 3 (Spring)
Quarter 4 (Summer)
Price of domestic wheat flour 18.09 23.51 34.19 36.51
Price of vegetable oil 64.81 76.93 88.90 91.70
Price of domestic rice 33.93 33.99 46.16 55.29
Price of lamb 182.34 186.20 189.28 180.27
Price of milk 23.44 25.66 27.23 30.75
Price of kerosene 43.15 45.78 46.83 55.48
Table 3: Average prices by quarter
Full Sample
Note: Estimated population weighted means. Prices in Afghani per kilogram or liter (kerosene). Source: NRVA 2007/08
Quarter 1 (Fall)
Quarter 2 (Winter)
Quarter 3 (Spring)
Quarter 4 (Summer)
Nominal value of monthly total consumption 2017.79 1902.86 1876.92 1914.64
Real value of monthly total consumption 2022.00 1718.27 1519.12 1477.56
Nominal value of monthly food consumption 1196.98 1123.25 1129.01 1182.97
Real value of monthly food consumption 1201.19 961.26 789.41 797.60
Daily caloric intake 2884.92 2725.03 2445.83 2387.33
Food consumption score 67.88 61.28 57.86 57.69
Table 4. Population statistics by quarter
Full Sample
Note: Estimated population weighted means. All values in per capita terms, except the food consumption score that is calculated for the household. Real values in Afghani reflect adjustments for spatial and temporal price differences, covering 13 months of field work. Caloric intake in kilocalories. Source: NRVA 2007/08

42
National sample Mean 25th 50th 75th Real value of per capita monthly food consumption 929 612 810 1101
Daily per capita caloric intake 2601 2030 2441 3006
Food consumption score 61 46 61 74
Agricultural households Mean 25th 50th 75th Real value of per capita monthly food consumption 911.29 606.95 801.34 1088.28
Daily per capita caloric intake 2586.81 2026.04 2419.25 2964.53
Food consumption score 61.59 48.00 62.00 74.00
Nonagricultural households Mean 25th 50th 75th Real value of per capita monthly food consumption 951.86 619.16 821.26 1121.48
Daily per capita caloric intake 2619.47 2033.54 2470.99 3044.94
Food consumption score 60.07 44.00 59.50 75.00
Table 5. Food security measures across the distribution
See Table 4 notes.
OLS
25th quantile 50th quantile 75th quantile
‐0.425*** ‐0.242*** ‐0.433*** ‐0.619***
[0.0364] [0.0437] [0.0447] [0.0571]
‐0.184*** ‐0.0866*** ‐0.187*** ‐0.279***
[0.0244] [0.0290] [0.0268] [0.0340]
‐0.189*** ‐0.246*** ‐0.173*** ‐0.158***
[0.0270] [0.0508] [0.0305] [0.0319]
Table 6. Effects of wheat flour price increases on food securityUnconditional Quantile Regression
Note: Coefficients and standard errors are from separate, population weighted regressions with dependent variable listed in the first column. Total observations: 20,483. OLS standard errors are corrected for clustering and stratification, UQR standard errors are clustered bootstrap (with replacement) estimates. *, **, and *** denote significance at 10%, 5%, and 1%, respectively.
Log Real Value of Monthly Per Capita Food Consumption
Log Daily Per Capita Calorie Intake
Log Food Consumption Score

43
OLS UQR
MeanPolicy-relevant
cutoffLog Real Value of Monthly Per Capita Food Consumption ‐0.425*** ‐0.298***
Cutoff: Value = 687.13 [0.0364] [0.0437]
Log Daily Per Capita Calorie Intake ‐0.184*** ‐0.115***
Cutoff: Intake = 2,100 [0.0244] [0.0279]
Log Food Consumption Score Mean ‐0.189***
[0.0270]
Poor Diet Cutoff: Score= 28 ‐0.163***
[0.0565]
Borderline Diet Cutoff: Score= 42 ‐0.256***
[0.0518]
Table 7. Marginal effects at policy-relevant cutoffs
See Table 6 notes. Below the dependent variable, we list the policy-relevant cutoff at which the marginal effect is evaluated using UQR.
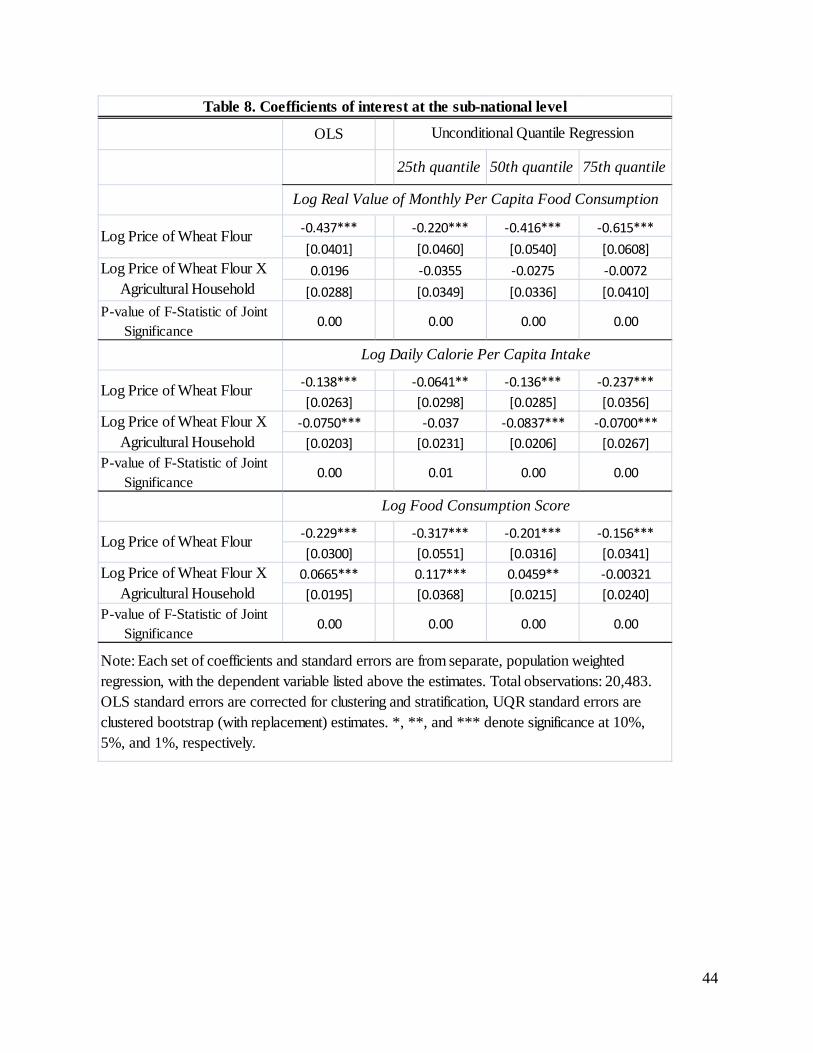
44
OLS
25th quantile 50th quantile 75th quantile
‐0.437*** ‐0.220*** ‐0.416*** ‐0.615***
[0.0401] [0.0460] [0.0540] [0.0608]
0.0196 ‐0.0355 ‐0.0275 ‐0.0072
[0.0288] [0.0349] [0.0336] [0.0410]
P-value of F-Statistic of Joint Significance
0.00 0.00 0.00 0.00
‐0.138*** ‐0.0641** ‐0.136*** ‐0.237***
[0.0263] [0.0298] [0.0285] [0.0356]
‐0.0750*** ‐0.037 ‐0.0837*** ‐0.0700***
[0.0203] [0.0231] [0.0206] [0.0267]
P-value of F-Statistic of Joint Significance
0.00 0.01 0.00 0.00
‐0.229*** ‐0.317*** ‐0.201*** ‐0.156***
[0.0300] [0.0551] [0.0316] [0.0341]
0.0665*** 0.117*** 0.0459** ‐0.00321
[0.0195] [0.0368] [0.0215] [0.0240]
P-value of F-Statistic of Joint Significance
0.00 0.00 0.00 0.00
Note: Each set of coefficients and standard errors are from separate, population weighted regression, with the dependent variable listed above the estimates. Total observations: 20,483. OLS standard errors are corrected for clustering and stratification, UQR standard errors are clustered bootstrap (with replacement) estimates. *, **, and *** denote significance at 10%, 5%, and 1%, respectively.
Log Price of Wheat Flour
Log Price of Wheat Flour X Agricultural Household
Log Price of Wheat Flour
Log Price of Wheat Flour X Agricultural Household
Log Food Consumption Score
Log Price of Wheat Flour X Agricultural Household
Log Daily Calorie Per Capita Intake
Table 8. Coefficients of interest at the sub-national level
Unconditional Quantile Regression
Log Real Value of Monthly Per Capita Food Consumption
Log Price of Wheat Flour

45
Quarter 1 (Fall)
Quarter 2 (Winter)
Quarter 3 (Spring)
Quarter 4 (Summer)
All
Average household size* 7.4 7.5 7.1 7.2 7.3
Average age (years) 20.6 20.4 20.7 20.5 20.6
Household members %, age <15) 47.9 48.7 48.4 48.7 48.5
Age dependency ratio 131.6 134.2 133.6 134.0 133.4
Full Immunization (%, age 12-23 months)* 33.0 41.1 34.8 37.6 36.7
Literate household head (%)* 34.4 28.8 28.4 29.5 30.1
Ever attended school (%, age >18)* 21.7 21.3 18.9 21.6 20.9
Education level of persons (age >18) 2.0 1.9 1.6 1.9 1.9
Safe drinking water (% hh)* 30.4 27.7 24.2 25.3 26.8
Sanitary toilet (% hh) 5.9 5.6 4.5 4.0 4.9
Electricity (% hh) 40.9 42.2 41.5 39.8 41.1
Note: Estimated population weighted means. * denotes estimates that are statistically different at 10% across quarters. Source: NRVA 2007/08
Table A1. Key indicators across quarters
Access to Services and Infrastructure Indicators
Education and Health Indictors
Demographic Indicators

46
Log Real Value of Monthly Food Consumption
Log Daily Calorie Intake Per Capita
Log Food Consumption Score
Log Wheat Flour Price ‐0.425*** ‐0.184*** ‐0.189***
[0.0364] [0.0244] [0.0270]
Agricultural Household 0.0351*** 0.0302*** 0.0310***
[0.0100] [0.00713] [0.00727]
0.0366*** ‐0.00489 0.0381***
[0.00684] [0.00444] [0.00479]
0.0996*** 0.0375*** 0.0571***
[0.00444] [0.00332] [0.00303]
0.0133*** 0.00670*** 0.0166***
[0.00128] [0.000932] [0.000999]
Log Kerosene Price 0.233*** 0.179*** ‐0.0286
[0.0644] [0.0461] [0.0477]
Log Vegetable Oil Price ‐0.140** 0.0136 ‐0.0329
[0.0598] [0.0443] [0.0442]
Log Local Rice Price ‐0.0059 ‐0.109*** 0.0734***
[0.0398] [0.0264] [0.0263]
Log Lamb Price ‐0.128 ‐0.0488 ‐0.0199
[0.0903] [0.0629] [0.0644]
Log Milk Price ‐0.140*** ‐0.143*** ‐0.103***
[0.0376] [0.0280] [0.0268]
Head Age 0.00173 0.0284 0.024
[0.0264] [0.0213] [0.0200]
Head Married 0.00754 ‐0.0323*** 0.0621***
[0.0144] [0.0106] [0.0101]
Head Literate ‐0.0371*** ‐0.000189 ‐0.0453***
[0.00775] [0.00610] [0.00572]
Number Men 0.00194 ‐0.004 0.0198***
[0.00382] [0.00303] [0.00294]
Number Women ‐0.00192 ‐0.00502* 0.0167***
[0.00353] [0.00275] [0.00256]
Number Children ‐0.0208*** ‐0.0212*** 0.0128***
[0.00177] [0.00144] [0.00127]
Plateau 0.00367 5.49E‐06 ‐0.00466
[0.0210] [0.0141] [0.0153]
Mountainous ‐0.00373 0.00126 ‐0.0115
[0.0196] [0.0141] [0.0139]
Observations 20,483 20,483 20,483
R-squared 0.353 0.25 0.392
Table A2. National results using the OLS estimator
Note: Each column represents a separate regression with population weighted estimates. Robust standard errors -in brackets- are clustered by stratum and adjusted for survey design. Real values reflect adjustments for spatial and temporal price differences. Plains is excluded category. *, **, and *** denote significance at 10%, 5%, and 1%, respectively.
Log Real Value Monthly Housing Per Capita Log Real Value Monthly Durables Per Capita Log Real Value Livestock Per Capita

47
25th 50th 75th
Log Wheat Flour Price ‐0.242*** ‐0.433*** ‐0.619***
[0.0437] [0.0447] [0.0571]
Agricultural Household 0.0382*** 0.0321*** 0.0407***
[0.0126] [0.0117] [0.0138]
0.0210** 0.0396*** 0.0410***
[0.00854] [0.00774] [0.00910]
0.0813*** 0.0807*** 0.107***
[0.00568] [0.00518] [0.00733]
0.0117*** 0.0135*** 0.0115***
[0.00154] [0.00147] [0.00209]
Log Kerosene Price 0.215** 0.141* 0.272***
[0.0839] [0.0727] [0.0930]
Log Vegetable Oil Price ‐0.0755 ‐0.0717 ‐0.119
[0.0621] [0.0689] [0.0900]
Log Local Rice Price ‐0.0615 ‐0.00552 0.0283
[0.0562] [0.0476] [0.0573]
Log Lamb Price ‐0.141 ‐0.200* ‐0.258*
[0.107] [0.109] [0.132]
Log Milk Price ‐0.108** ‐0.0809* ‐0.173***
[0.0421] [0.0431] [0.0553]
Head Age 0.0192 0.00517 ‐0.00127
[0.0361] [0.0342] [0.0411]
Head Married 0.0461** 0.024 ‐0.00441
[0.0189] [0.0181] [0.0223]
Head Literate ‐0.0245** ‐0.0349*** ‐0.0434***
[0.00973] [0.00997] [0.0128]
Number Men ‐0.00244 0.00781* 0.00366
[0.00467] [0.00467] [0.00599]
Number Women 0.00194 ‐0.00318 0.00264
[0.00448] [0.00430] [0.00539]
Number Children ‐0.0150*** ‐0.0182*** ‐0.0236***
[0.00239] [0.00225] [0.00287]
Plateau ‐0.00518 ‐0.00539 0.0382
[0.0244] [0.0220] [0.0268]
Mountainous ‐0.00952 0.00443 0.000734
[0.0212] [0.0220] [0.0273]
Observations 20,483 20,483 20,483
R-squared 0.183 0.231 0.23
See Table A2 notes.
Table A3. National results using the unconditional quantile regression Log Real Value of Monthly Food Consumption
Log Real Value Monthly Housing Per Capita Log Real Value Monthly Durables Per Capita Log Real Value Livestock Per Capita

48
25th 50th 75th
Log Wheat Flour Price ‐0.0866*** ‐0.187*** ‐0.279***
[0.0290] [0.0268] [0.0340]
Agricultural Household 0.0303*** 0.0215*** 0.0254***
[0.00791] [0.00744] [0.00917]
‐0.00970* ‐0.00513 0.00438
[0.00510] [0.00488] [0.00565]
0.0329*** 0.0344*** 0.0336***
[0.00370] [0.00341] [0.00462]
0.00578*** 0.00541*** 0.00509***
[0.00101] [0.000964] [0.00130]
Log Kerosene Price 0.176*** 0.217*** 0.326***
[0.0522] [0.0452] [0.0554]
Log Vegetable Oil Price 0.057 0.0294 ‐0.00418
[0.0465] [0.0448] [0.0556]
Log Local Rice Price ‐0.120*** ‐0.0990*** ‐0.111***
[0.0350] [0.0301] [0.0351]
Log Lamb Price ‐0.158** ‐0.00786 0.0426
[0.0737] [0.0647] [0.0813]
Log Milk Price ‐0.128*** ‐0.123*** ‐0.161***
[0.0316] [0.0285] [0.0351]
Head Age 0.00601 0.0417** 0.0591**
[0.0243] [0.0211] [0.0277]
Head Married ‐0.0146 ‐0.0198* ‐0.0318**
[0.0120] [0.0117] [0.0146]
Head Literate 0.00476 0.00286 0.00699
[0.00682] [0.00655] [0.00823]
Number Men ‐0.00124 ‐0.00111 ‐0.00453
[0.00327] [0.00340] [0.00440]
Number Women 0.000764 ‐0.00398 ‐0.00670*
[0.00324] [0.00290] [0.00382]
Number Children ‐0.0155*** ‐0.0184*** ‐0.0235***
[0.00162] [0.00162] [0.00222]
Plateau 0.00628 0.00175 0.00868
[0.0142] [0.0141] [0.0165]
Mountainous ‐0.000836 0.00897 0.015
[0.0134] [0.0140] [0.0177]
Observations 20,483 20,483 20,483
R-squared 0.163 0.194 0.177
Table A3 continuedLog Daily Calorie Intake Per Capita
See Table A2 notes.
Log Real Value Monthly Housing Per Capita Log Real Value Monthly Durables Per Capita Log Real Value Livestock Per Capita
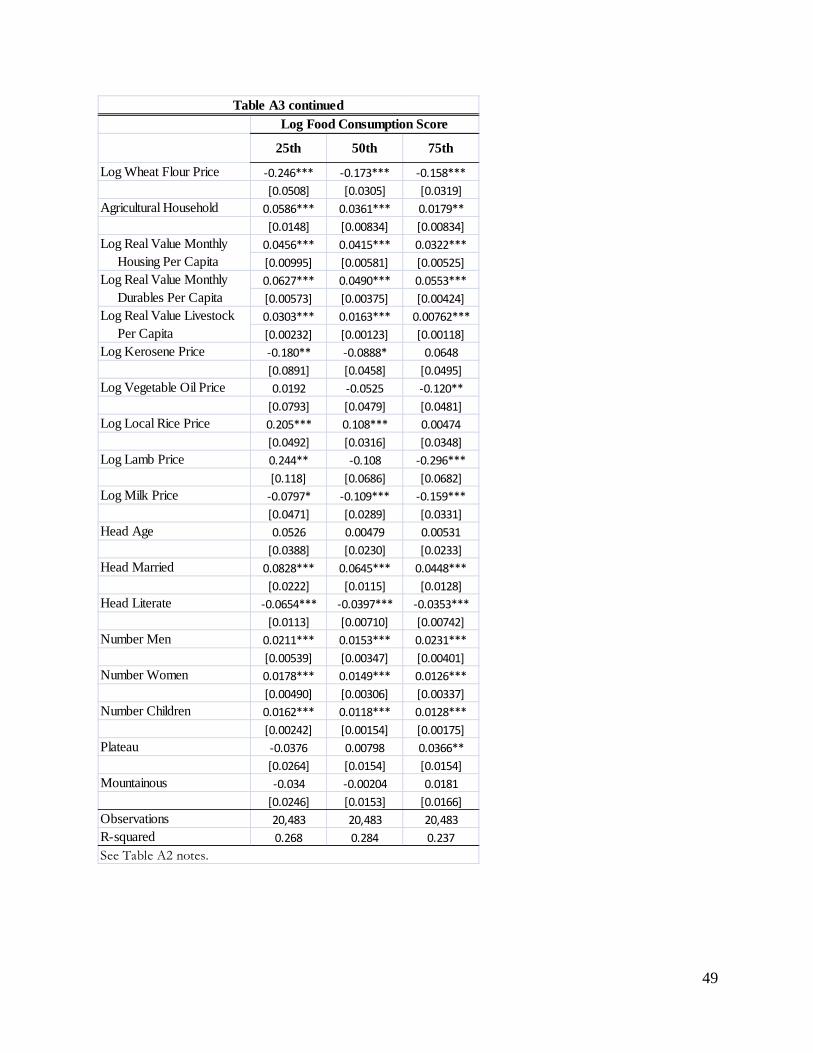
49
25th 50th 75th
Log Wheat Flour Price ‐0.246*** ‐0.173*** ‐0.158***
[0.0508] [0.0305] [0.0319]
Agricultural Household 0.0586*** 0.0361*** 0.0179**
[0.0148] [0.00834] [0.00834]
0.0456*** 0.0415*** 0.0322***
[0.00995] [0.00581] [0.00525]
0.0627*** 0.0490*** 0.0553***
[0.00573] [0.00375] [0.00424]
0.0303*** 0.0163*** 0.00762***
[0.00232] [0.00123] [0.00118]
Log Kerosene Price ‐0.180** ‐0.0888* 0.0648
[0.0891] [0.0458] [0.0495]
Log Vegetable Oil Price 0.0192 ‐0.0525 ‐0.120**
[0.0793] [0.0479] [0.0481]
Log Local Rice Price 0.205*** 0.108*** 0.00474
[0.0492] [0.0316] [0.0348]
Log Lamb Price 0.244** ‐0.108 ‐0.296***
[0.118] [0.0686] [0.0682]
Log Milk Price ‐0.0797* ‐0.109*** ‐0.159***
[0.0471] [0.0289] [0.0331]
Head Age 0.0526 0.00479 0.00531
[0.0388] [0.0230] [0.0233]
Head Married 0.0828*** 0.0645*** 0.0448***
[0.0222] [0.0115] [0.0128]
Head Literate ‐0.0654*** ‐0.0397*** ‐0.0353***
[0.0113] [0.00710] [0.00742]
Number Men 0.0211*** 0.0153*** 0.0231***
[0.00539] [0.00347] [0.00401]
Number Women 0.0178*** 0.0149*** 0.0126***
[0.00490] [0.00306] [0.00337]
Number Children 0.0162*** 0.0118*** 0.0128***
[0.00242] [0.00154] [0.00175]
Plateau ‐0.0376 0.00798 0.0366**
[0.0264] [0.0154] [0.0154]
Mountainous ‐0.034 ‐0.00204 0.0181
[0.0246] [0.0153] [0.0166]
Observations 20,483 20,483 20,483
R-squared 0.268 0.284 0.237
Table A3 continuedLog Food Consumption Score
See Table A2 notes.
Log Real Value Monthly Housing Per Capita Log Real Value Monthly Durables Per Capita Log Real Value Livestock Per Capita
