engineering models for vented deflagrationsukelg.ps.ic.ac.uk/58has.pdf · • vented deflagrations...
TRANSCRIPT

Engineering Models for Vented Lean
Hydrogen Deflagrations
Anubhav Sinha, Vendra Chandra and Jennifer X. Wen
Warwick FIRE, School of Engineering
University of Warwick, UK

• Introduction
• Review of Engineering Models
• Performance Evaluation of Engineering Models
• Effect of Obstacles
• HySEA Experiments – GexCon 20-feet ISO containers
• New Model development
• Concluding Remarks
Outline
• Vented deflagrations – simplest way to relieve pressure
• Experiments are expensive, specially for large enclosures / buildings
• Computational models – challenge to incorporate large range of scales
involved, time taking and large computational resources required
• EM – reasonable predictions, simple and fast to use
• Review Engineering models to assess their applicability for hydrogen
deflagrations
Introduction

• EN14994 (2007)1
• NFPA 68 (2013) 2
• Bauwens et al. (2012) 3
• Molkov and Bragin (2015) 4
Review of Engineering Models
These models are reviewed and their applicability is tested with experimental
results available in literature and from results generated in this project
[1] EN 14994 (2007). Gas explosion venting protective systems
[2] NFPA 68. (2013): Standard on explosion protection by deflagration venting, 2013 Edition, National Fire Protection Association, Quincy, MA 02269.
[3] Bauwens, C. R., Chao, J., & Dorofeev, S. B. (2012). Effect of hydrogen concentration on vented explosion overpressures from lean hydrogen–air deflagrations.
International journal of hydrogen energy.
[4] Molkov, V., Bragin, M. (2015). Hydrogen–air deflagrations: Vent sizing correlation for low-strength equipment and buildings. International Journal of Hydrogen
Energy, 40(2), 1256-1266.
• The formulation is divided into two parts, one for a compact enclosure (with
L/D≤2) and the other for elongated enclosure (with L/D>2)
• A gas explosion constant KG which denotes maximum value of pressure rise per
unit time is used to determine overpressure
• The constant KG is determined experimentally
• Effect of initial turbulence is not taken into account
• Not recommended for Hydrogen
EN14994 (2007)1

NFPA 68(2013)2
• This model consists of two formulations – one for low static pressure and another
for high static pressure
• Effect of turbulence on flame speed is accounted in this model formulation.
• Different considerations are given to the vent deployment, whether it is a part of a
wall or a complete side wall is used as a vent
• In general, predictions from this model are conservative and tend to predict higher
overpressures than experimentally obtained values

Bauwens et al.3 Model
• This model is based on the multi-peak behaviour of vented explosions due to
various physical processes involved
• Different formulations are give to derive maximum pressure for each peak
• Three different pressure peaks considered are –
o External explosion (P1)
o Flame-Acoustic interaction (P2)
o Pressure peak due to presence of obstacles (P3)
• The maximum value of all these peaks gives the final overpressure value
Molkov and Bragin4 Model• This model is based on the novel concept of Deflagration-Outflow Interaction
(DOI) number
• The major assumption is that the overpressure correlates with the DOI number and
can be related using the turbulent Bradley number
• Various physical processes including initial turbulence, effect of elongated
enclosure, effect of obstacles, fractal nature of flame-front, are accounted for in
this model.
• Two formulations are proposed – one for conservative estimate and other for best
fit value

GeomVol
(m3)
Vent Area
(m2)Fuel Conc (%) Ignition Obs Remarks
Kumar (2006) Cuboid 120 0.55/1.09/2.19 H2 8.5-12.0 BW No Initial Turb
Kumar (2009) Cuboid 120 0.55/1.09/2.19 H2 5.9-10.8 BW No Initial Turb
Daubech et al. (2011) Cyl 1/ 10.5 0.15 / 2 H2 10.0-27.0 BW No High L/D
Bauwens et al. (2012) Cube 63.7 5.4/ 2.7 H2 12.1-19.7 CI, BW, FW Yes
Schiavetti, and Carcassi (2016) Cube 25 1.004 H2 7.5-12.5 BW, cube centre Yes Obstacles
Experimental Studies
These experimental studies are used to assess engineering models
[5] Kumar, K., Vented combustion of hydrogen-air mixtures in a large rectangular volume. In 44th AIAA Aerospace Sciences Meeting and Exhibit, 2006.
[6] Kumar, R. K. (2009). Vented Turbulent Combustion of Hydrogen-Air Mixtures in A Large Rectangular Volume. In 47th AIAA aerospace sciences meeting
including the new horizons forum and aerospace exposition. Paper AIAA 2009-1380.
[7] Daubech, J., Proust, C., Jamois, D., Leprette, E. (2011, September). Dynamics of vented hydrogen-air deflagrations. In 4. International Conference on
Hydrogen Safety (ICHS 2011)
[8] Schiavetti, M., and M. Carcassi. "Maximum overpressure vs. H 2 concentration non-monotonic behavior in vented deflagration. Experimental results."
International Journal of Hydrogen Energy (2016).
5
6
7
3
8
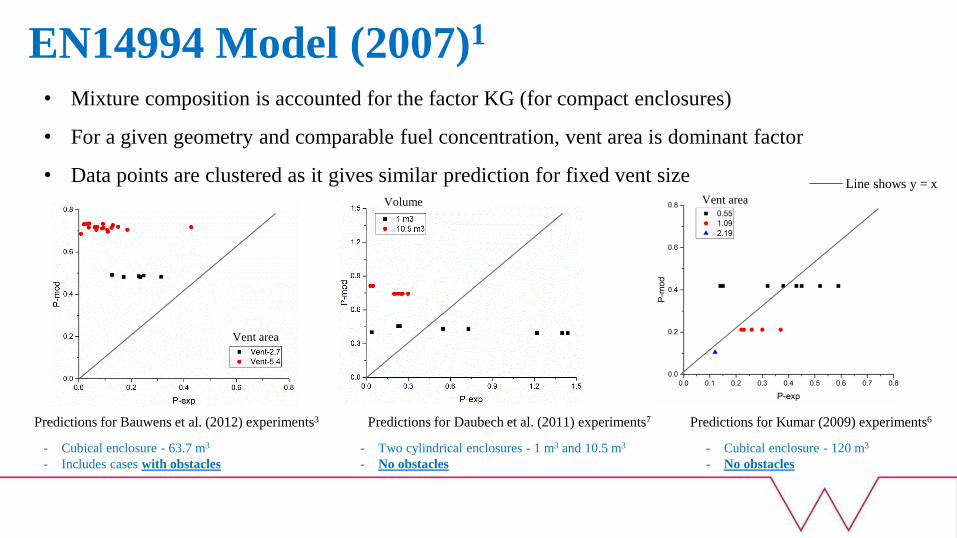
EN14994 Model (2007)1
• Mixture composition is accounted for the factor KG (for compact enclosures)
• For a given geometry and comparable fuel concentration, vent area is dominant factor
• Data points are clustered as it gives similar prediction for fixed vent size
Predictions for Bauwens et al. (2012) experiments3 Predictions for Daubech et al. (2011) experiments7 Predictions for Kumar (2009) experiments6
Volume Vent area
- Cubical enclosure - 63.7 m3
- Includes cases with obstacles
- Two cylindrical enclosures - 1 m3 and 10.5 m3
- No obstacles
Line shows y = x
- Cubical enclosure - 120 m3
- No obstacles
Vent area
Predictions for Bauwens et al. (2012) experiments3
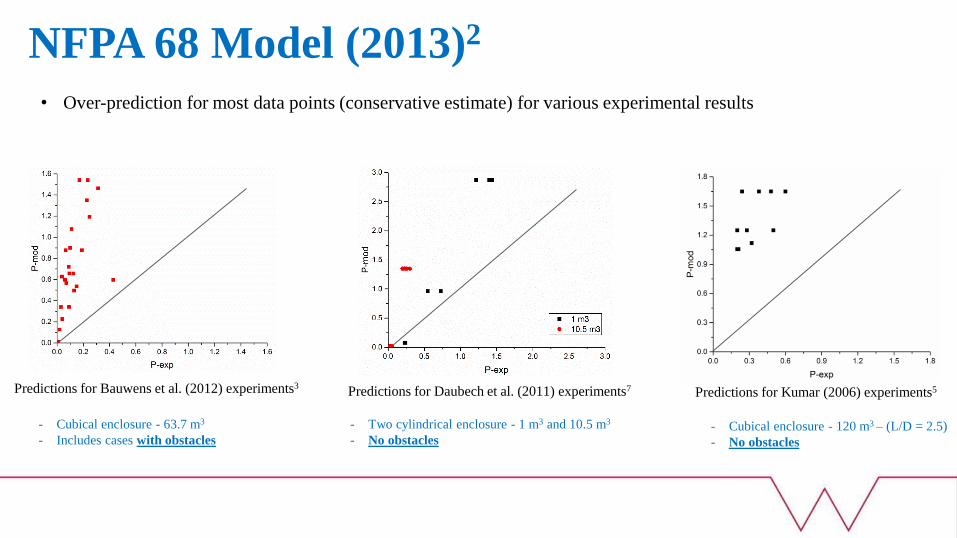
• Over-prediction for most data points (conservative estimate) for various experimental results
NFPA 68 Model (2013)2
- Cubical enclosure - 63.7 m3
- Includes cases with obstacles
Predictions for Kumar (2006) experiments5Predictions for Daubech et al. (2011) experiments7
- Two cylindrical enclosure - 1 m3 and 10.5 m3
- No obstacles- Cubical enclosure - 120 m3 – (L/D = 2.5)
- No obstacles

Predictions for Bauwens et al. (2012) experiments3Predictions for Kumar’s experiments5,6Predictions for Daubech et al. (2011) experiments7
• Accounts for several physical aspects- calculates multiple peak pressures
• Under-prediction for Kumar’s experiments – cases with high initial turbulence and high L/D (2.5)
• Some experiments of Daubech et al. (2011) also show high over-prediction (L/D=3.3)
Bauwens et al. Model (2012)3
- Cubical enclosure - 63.7 m3
- Includes cases with obstacles
- Two cylindrical enclosure - 1 m3 and 10.5 m3
- No obstacles
- Cubical enclosure - 120 m3 – (L/D = 2.5)
- No obstacles

Predictions for Daubech et al. (2011) experiments7Predictions for Bauwens et al. (2012) experiments3
• Under-predicts cases with Forward wall ignition
• Over-predicts for larger enclosure used by Daubech et al. (L/D=3.3) – for higher H2 concentrations
Bauwens et al. Model (2012)3
- Cubical enclosure - 63.7 m3
- Includes cases with obstacles
- Two cylindrical enclosures - 1 m3 (L/D = 1.4)
and 10.5 m3 (L/D = 3.3)
- No obstacles

Predictions for Bauwens et al. (2012) experiments3 Predictions for Kumar (2009) experiments6
Ign locationVent area
Predictions for Daubech et al. (2011) experiments7
• In the formulation, two equations are suggested – conservative and best-fit
• Best-fit formula appears to slightly under-predict for most of data points
Molkov and Bragin Model (2015)4
- Cubical enclosure - 63.7 m3
- Includes cases with obstacles- Two cylindrical enclosures - 1 m3 and 10.5 m3
- No obstacles
- Cubical enclosure - 120 m3
- No obstacles
Enclosure volume
For obstacles, Ξo is provided in Molkov and Bragin4
(3.5 for BW and 1.0 for CI)

Predictions for Bauwens et al. (2012) experiments3 Predictions for Kumar (2009) experiments6 Predictions for Daubech et al. (2011) experiments7
• The predictions appear to be reasonable for the experiments compared
• The formulation of coefficient for obstacles is not clearly defined
Molkov and Bragin Model (2015)4
- Cubical enclosure - 63.7 m3
- Includes cases with obstacles- Two cylindrical enclosures - 1 m3 and 10.5 m3
- No obstacles
- Cubical enclosure - 120 m3
- No obstacles
For obstacles, Ξo is provided in Molkov and Bragin4
(3.5 for BW and 1.0 for CI)

Issues in Current models
• EN-14994 and NFPA – mostly over-predicting – will result in a very large / unfeasible vent area
• Models of Bauwens et al. and Molkov and Bragin have many equations and not simple to
implement.
• No formulation for stratified fuel distribution which resembles realistic accidental cases rather
closely
• Effect of obstacles need to be investigated further and more accurate models are required
• Hydrogen flame speed is much higher than hydrocarbons and same formulations will not
necessary be correct to use.

Effect of
Obstacles

• Scarcity of data on systematic study of effect of
obstacles
• Schiavetti and Carcassi (2016) 8 – impact of
obstacles in a small volume enclosure
• Flat plates are used as obstacles
• More such experiments required for realistic
obstacles in a larger geometry (Schiavetti and Carcassi (2016))8
Obstacles

Obstacles -Bauwens et al. Model (2012)3
Obstacle 2 Obstacle 3 Obstacle 4
• Predictions are reasonably close to experiments with some scatter
• Prescribed formulation is used – no new addition for these cases

Obstacles – Molkov and Bragin Model (2015)4
• Different values of Ξo used and plotted with various obstacle configurations
• The best fit value of Ξo is shown in table
Obstacle config
Ξo(best fit)
Obs 2 2.00
Obs 3 2.00
Obs 4 2.00
Obs 5 2.00
Obs 6 3.00
Obs 8 3.50
Obstacle 2 Obstacle 3 Obstacle 4

HySEA Experiments -
GexCon (20 feet ISO containers)
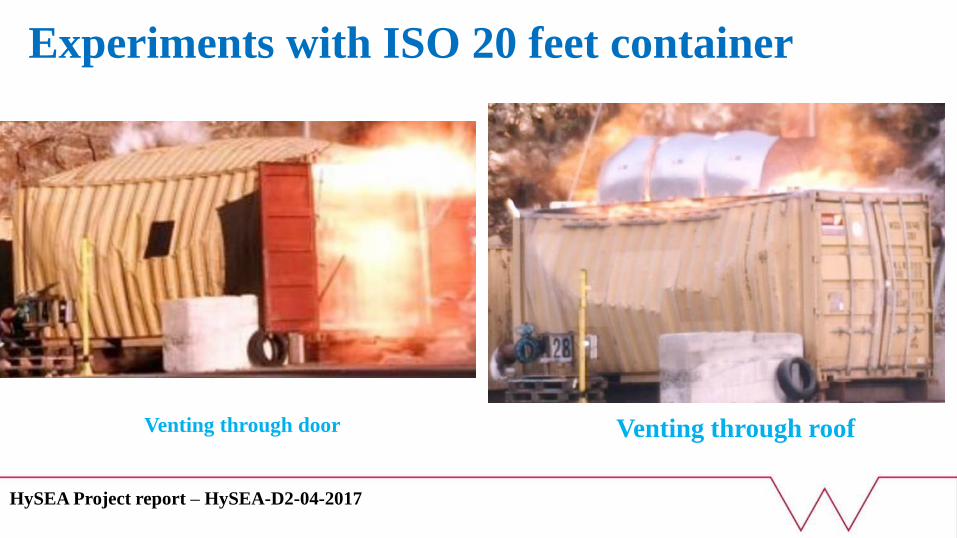
Experiments with ISO 20 feet container
Venting through door Venting through roof
HySEA Project report – HySEA-D2-04-2017

Bauwens et al. (2012) model3
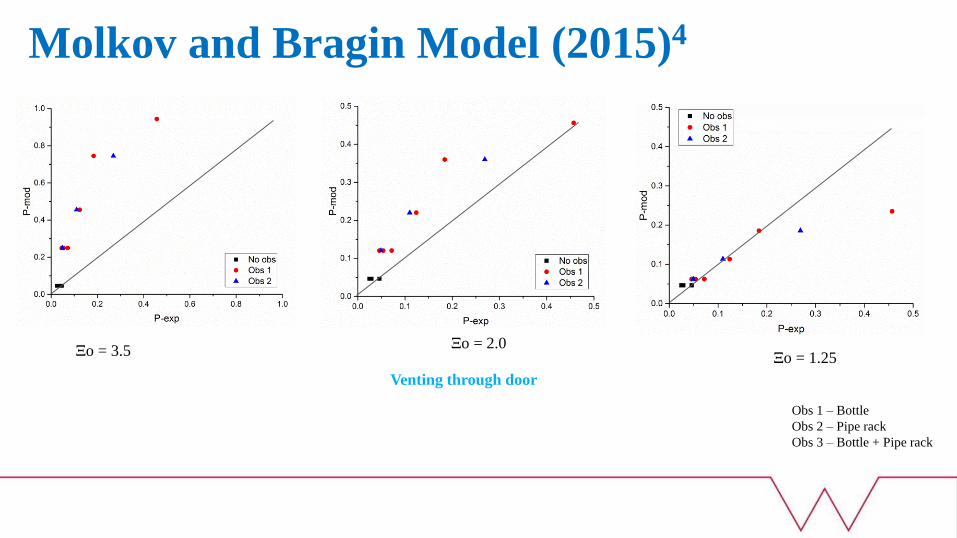
Obs 1 – Bottle
Obs 2 – Pipe rack
Obs 3 – Bottle + Pipe rack
Venting through door Venting through roof
- Cubical enclosure – 33 m3
- Includes cases with obstacles
• Over-prediction is observed for cases with obstacles for both experimental sets
Bauwens et al. Model (2012)3
Obs 1 – Bottle
Obs 2 – Pipe rack
Obs 3 – Bottle + Pipe rack
Venting through door
Ξo = 1.25Ξo = 2.0
Ξo = 3.5
Molkov and Bragin Model (2015)4

Molkov and Bragin Model (2015)4
Blockage Ratio
Ξo Experiments
0.06 3.50 Bauwens et al. (2012) - BW ignition
0.30 1.25 GexCon 20 ft ISO container-bottles – BW
0.12 1.25 GexCon 20 ft ISO container -pipe and rack- BW
Venting through roof - Ξo = 1.25

New Engineering Model
Expectation from new model for Hydrogen
• Accurate prediction within acceptable limits
• Simple and easy to calculate formulas / equations
• Able to predict overpressure for cases with realistic accidental scenarios
o Stratified fuel distribution
o Presence of obstacles
• Consider unique properties of hydrogen into its formulation
o Higher flame-speed
o Increase in flame-speed, due to Lewis number effects and instability in lean mixtures

Same vent area gives same overpressure ?
Bauwens, C.R., and Dorofeev, S., Understanding the effect of multiple adjacent vent panels on
explosion overpressures , in ICDERS 2017
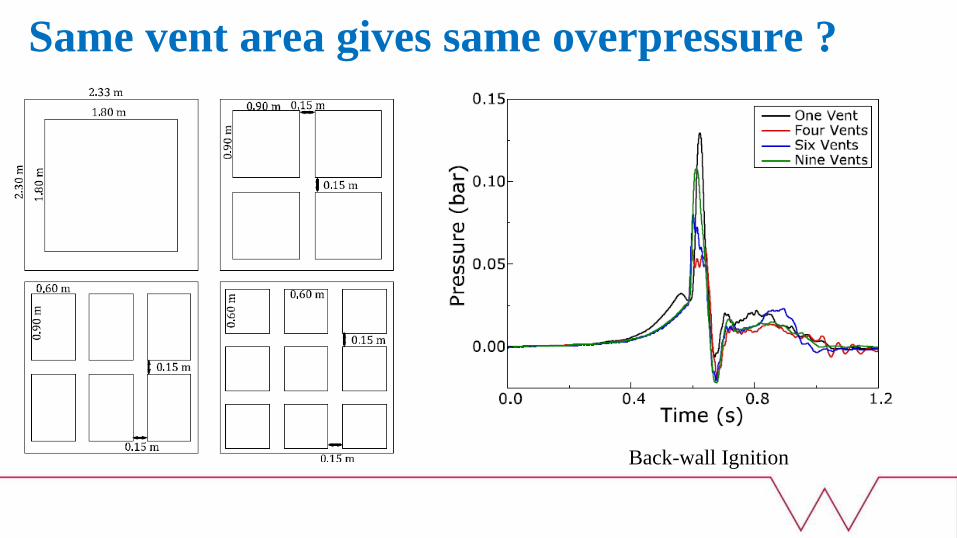
Same vent area gives same overpressure ?
Back-wall Ignition
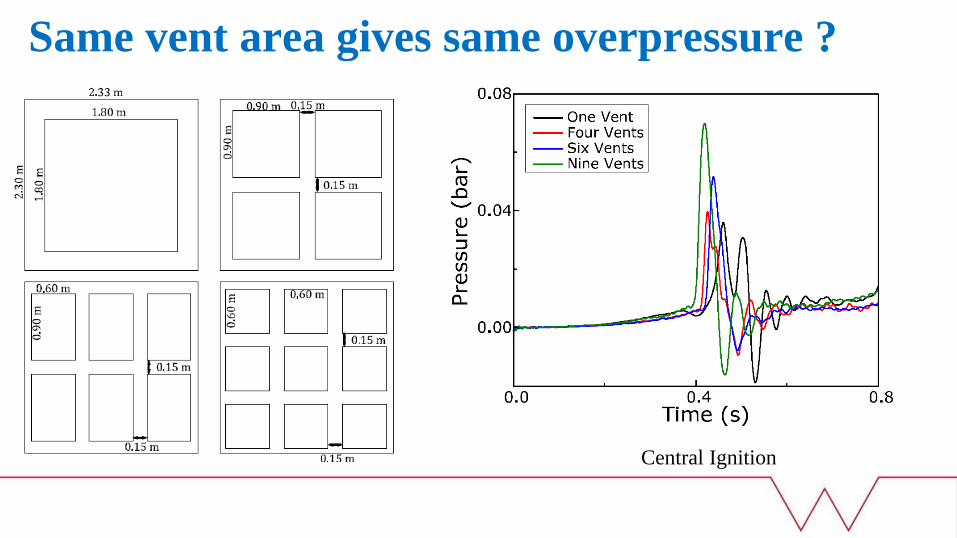
Same vent area gives same overpressure ?
Central Ignition
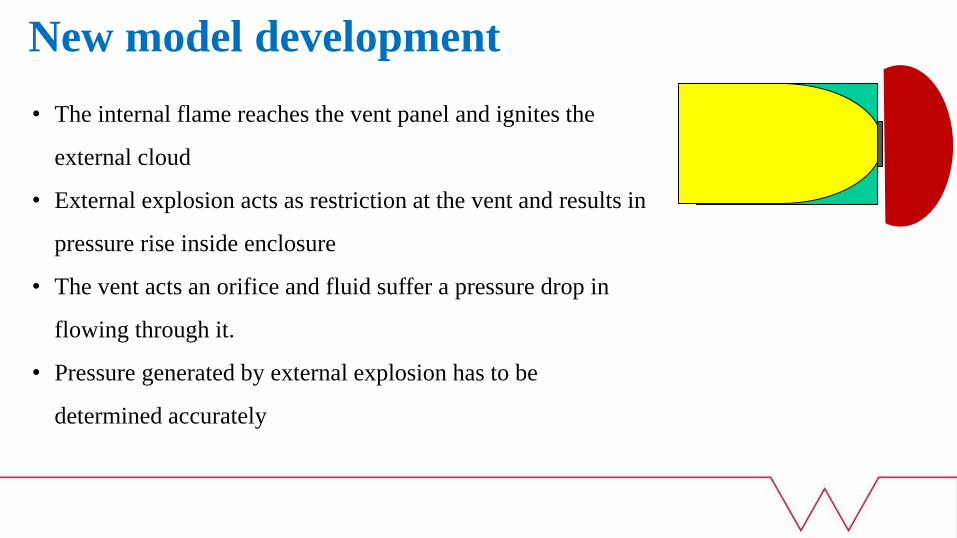
New model development
• The internal flame reaches the vent panel and ignites the
external cloud
• External explosion acts as restriction at the vent and results in
pressure rise inside enclosure
• The vent acts an orifice and fluid suffer a pressure drop in
flowing through it.
• Pressure generated by external explosion has to be
determined accurately

External Explosion
• Mixtures with higher flame-speed result in higher peak
pressures
• As the flame in the enclosure ignites the external cloud, the
time required for flame to reach the vent should affect
overpressure
• External cloud is formed by unburnt gas jet coming out of the
vent.
• Spread and stratification of this cloud will determine the
overpressureResults from Daubech et al. (2011) experiments7
L
Time = L / Su

Obstacles and Stratified Mixture
• Obstacles
• reduce available cross section,
• increase flame surface area
• increase flame speed
• Stratified Mixture – increases flame speed
• equivalent mixture composition
• 1-D integration if concentration profile is available
• Both these parameters affect time for flame-front to reach
vent and ignite external cloud

Present Effort
• Calculation of the cloud ignition time
• Understanding the cloud structure, spread and stratification – pressure
generated
• Calculating the overpressure generated inside the enclosure using the external
overpressure
• Integrate effect of obstacles and stratified mixture distribution into this model

• Both NFPA 68 and EN 14994 models over-predicted the experimental measurements
• The predictions of Bauwens et al. (2012) model and Molkov and Bragin (2015) model (without
obstacles) are in reasonable agreement with the experimental data, but both models have some
limitations:
₋ The predictions of Bauwens et al. (2012) model have relatively large discrepancy for high L/D
enclosures and cases with high initial turbulence
₋ Molkov and Bragin (2015) model does not provide any specific treatment for obstacles. Instead
obstacles can only be considered through adjusting the coefficient Ξo
₋ Neither considers stratified distribution of the fuel
• New model using external cloud combustion is under development
Concluding remarks

Acknowledgements
• The HySEA project is supported by the Fuel Cells and Hydrogen 2 Joint
Undertaking (FCH 2 JU) under the Horizon 2020 Framework Program for Research
and Innovation.
• We also thank Regis Bauwens (FM Global) and Trygve Skjold (GexCon) for useful
discussions and suggestions

Thank
You