engine finance rountable managing an engine stephane ... an engine... · engine finance rountable....
TRANSCRIPT

Engine Finance RountableManaging an engine
Stephane Garson, General Manager Marketing
1st May 2008, New York
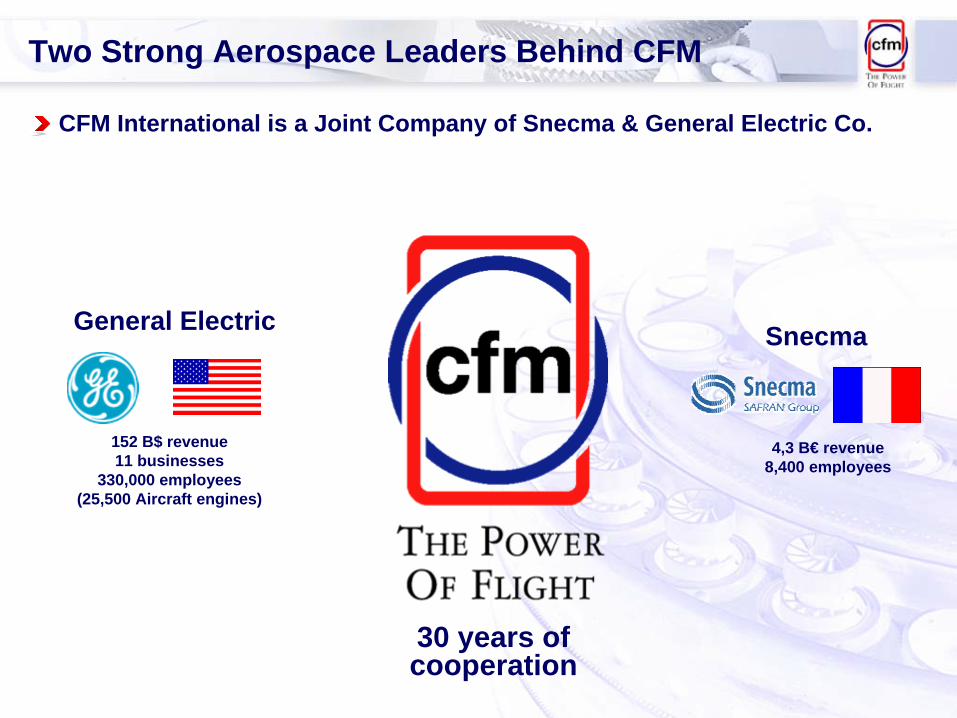
Two Strong Aerospace Leaders Behind CFM
30 years of cooperation
General Electric
152 B$ revenue11 businesses
330,000 employees(25,500 Aircraft engines)
4,3 B€ revenue8,400 employees
Snecma
CFM International is a Joint Company of Snecma & General Electric Co.

50/50 Efficient Work Sharing
SNECMAGE
Simple structure :
Everything shared 50-50 :
Takes full benefit of global GEAE/Snecma partnership
CFM is the only interface for the customer
50% GEAE ( USA) 50% Snecma (France)
Research & development, design, engineering, marketing, production,product support

Simple Sales & Customer Support Sharing
CFM split the world into 2 regions to better support customers on a coordinated basis.
SALES,PRODUCT SUPPORT
CFMI CINCINNATI,OHIO, U.S.A.
SALES,PRODUCT SUPPORT
CFMI CINCINNATI,OHIO, U.S.A.
SALES, PRODUCT SUPPORTCFMI VILLAROCHE,
FRANCE
SALES, PRODUCT SUPPORTCFMI VILLAROCHE,
FRANCE
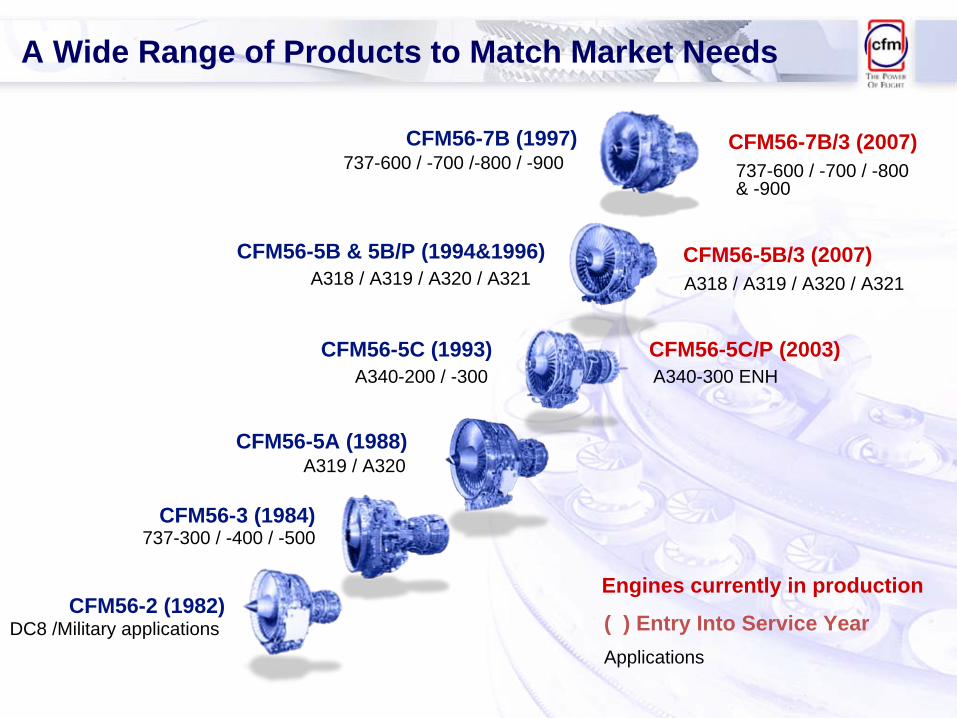
A Wide Range of Products to Match Market Needs
( ) Entry Into Service Year
Engines currently in production
Applications
737-600 / -700 /-800 / -900CFM56-7B (1997) CFM56-7B/3 (2007)
737-600 / -700 / -800 & -900
A318 / A319 / A320 / A321CFM56-5B & 5B/P (1994&1996) CFM56-5B/3 (2007)
A318 / A319 / A320 / A321
A340-200 / -300CFM56-5C (1993)
A340-300 ENHCFM56-5C/P (2003)
A319 / A320CFM56-5A (1988)
737-300 / -400 / -500CFM56-3 (1984)
DC8 /Military applicationsCFM56-2 (1982)

CFM56 Family TodayAs of December 31, 2007
THE WORLD’S MOST POPULAR ENGINETHE WORLD’S MOST POPULAR ENGINE
More than 25,400 CFM56 on commitment (options & spares included)
489 Operators/ Customers & VIP
7,195 A/C / 17,636 engines in service (delivered to Operators)
385 million Engine Flight Hours & 222 million Engine Flight Cycles
1 aircraft departure every 3 seconds

CFM = THE PREFERRED ENGINECFM = THE PREFERRED ENGINE
Single Aisle A/C Market Share
CFM71,9%
IAE18,3%
PW3,7%
RR6,1%
* RR / RR Deutsch
CFMA/C IAE PW RR*2786A319/320/321 2218 N/A N/A71A318 N/A PW N/A
1988737/-3 N/A N/A N/A 4303737/-7B N/A N/A N/AN/A717 N/A N/A 155N/A757 N/A 429 617N/AMD90 N/A N/A N/A
9148TOTAL N/A 464 772Based on cumulative firm orders (100 Pax +)

A320 operators consistently vote CFMA320 operators consistently vote CFM
A320 Family Market Share: Firm Orders over last 5 years
CFM56.5%
IAE43.5%
PW0.0%
2004
CFM50.8%
IAE46.7%
PW2.5%
2005
CFM62.9%
IAE37%
PW0 %
2006
CFM65.5%
IAE34.5%
PW0 %
2007
PW0.0%
2003
CFM56.8%
IAE43.2%

CFM Single Aisle/ Narrow Body Market Share
Europe & CIS
341
2260
Asia Pacific
456
1425
Africa & Middle East
106
318
N&S America
587
2256
Excellent MarketabilityMore than 4 times more A/C with CFM56 than the competition
Excellent MarketabilityMore than 4 times more A/C with CFM56 than the competition
CFM – 6259 A/C
IAE – 1490 A/C
Number and location of A/C in serviceA318/ 319/ 320/ 321, B737CL and NG, MD90
2600
2400
2200
2000
1800
1600
1400
1200
1000
800
600
400
200
0
1979
1980
1981
1982
1983
1984
1985
1986
1987
1988
1989
1990
1991
1992
1993
1994
1995
1996
1997
1998
1999
2000
2001
2002
2003
2004
2005
2006
2007
YearYear
Number of enginesNumber of engines
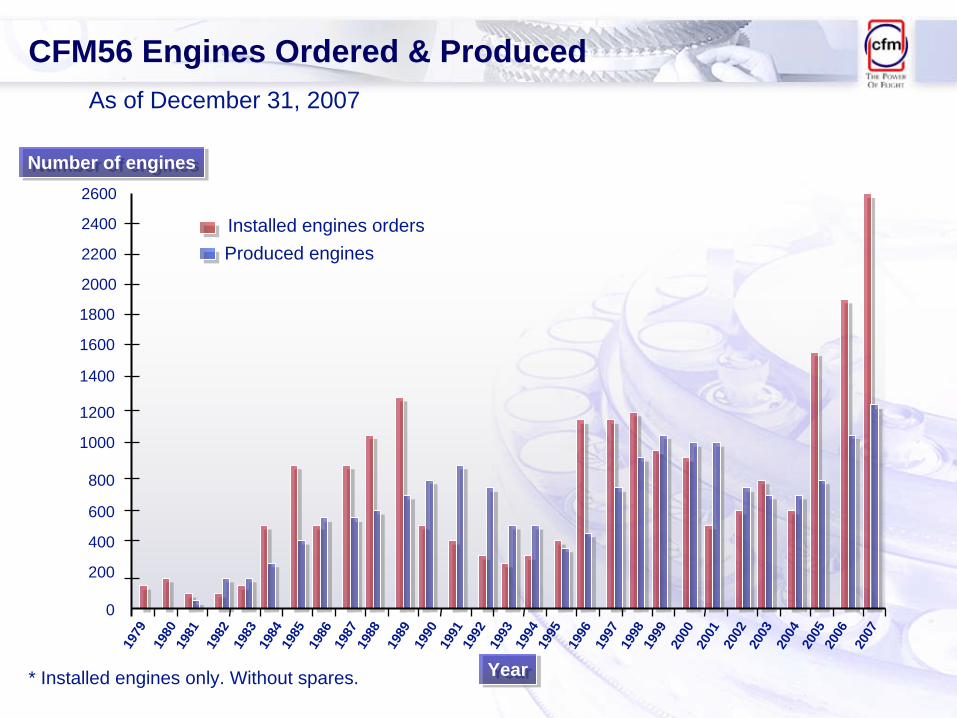
CFM56 Engines Ordered & Produced
* Installed engines only. Without spares.
As of December 31, 2007
Installed engines ordersProduced engines

Keep it simple, dummy
New York, April 4th

First Look at a Jet Engine

The fanThe fan
First Look at a Jet Engine

The Fan
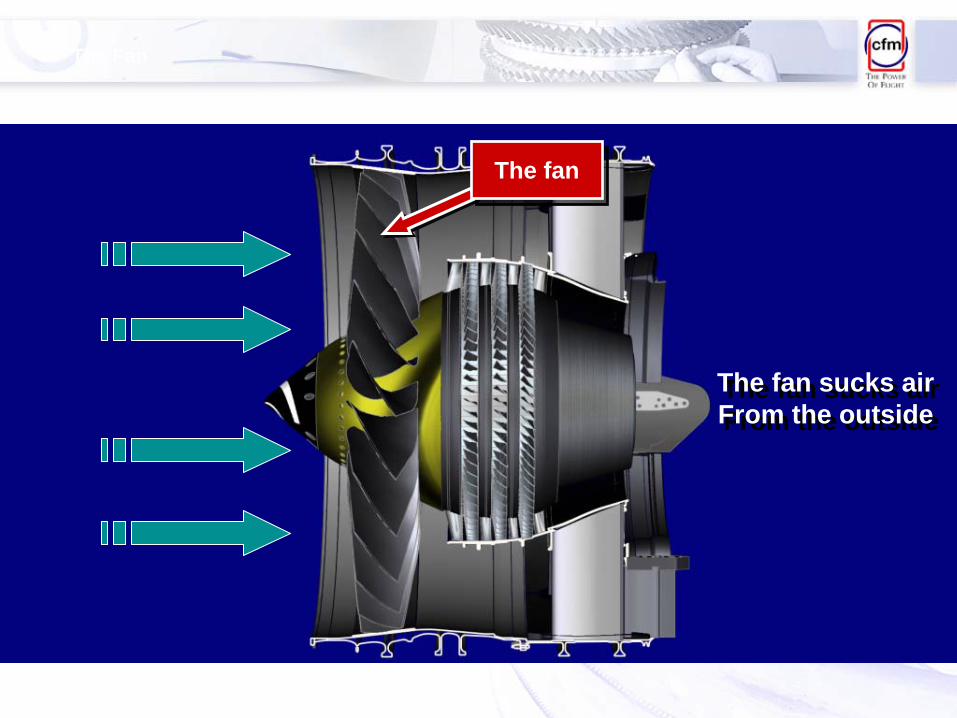
The fan sucks airFrom the outsideThe fan sucks airFrom the outside
The fanThe fan
The Fan

The Jet Engine Principle

The turbine drives the compressorThe turbine drives the compressor
The fuel brings the energy to the systemThe fuel brings the energy to the system
CompressorCompressor CombustorCombustor TurbineTurbine
FuelFuel
The Jet Engine Principle

Increase in by-pass ratio improves SpecificFuel Consumption (SFC)
Increase in by-pass ratio improves SpecificFuel Consumption (SFC)
11 AirAir
33
33
22
22
By-pass ratio = Mass flow / Mass flow
By-pass ratio = Mass flow / Mass flow33 22
TRUST ME!TRUST ME!
The Jet Engine Principle: By-Pass Ratio

WHEN THE LARGEST BUYERS OF AIRCRAFT ENGINES DO THEIR CALCULATIONS THEY ALWAYS GET THE SAME ANSWER.
Calculating Engine Calculating Engine MaintenanceMaintenance

Acronyms
A/F AirframeATO Aircraft Take OffsD&C Delays & CancellationsDMC Direct Maintenance CostECO Engine Cost OwnershipEGT Exhaust Gas TemperatureEMO Engine Management Opimization ®IFSD In Flight Shut-DownsLLP Life Limited PartsLRU Line Replaceable UnitNPV Net Present Value

OATL Outside Air Temperature LimitSV Shop VisitSVR Shop Visit RateSVC Shop Visit CostT/O Take OffTOC Total Operating CostTOW Take Off WeightUSG US GallonsVSV Variable Stator VanesW/S Work Scope
Acronyms

Engine DMC Breakdown
THE COST TO KEEP AND RESTORE ENGINESERVICEABILITY CAN BE SPLIT BETWEEN:
THE COST TO KEEP AND RESTORE ENGINESERVICEABILITY CAN BE SPLIT BETWEEN:
Line Maintenance cost
Shop maintenance cost

Engine DMC Breakdown ( cont’d )
LINE MAINTENANCE REPRESENTS ABOUT 7 %OF ENGINE MAINTENANCE COST
LINE MAINTENANCE REPRESENTS ABOUT 7 %OF ENGINE MAINTENANCE COST
Line Labor :
LINE MAINTENANCE :
InspectionTroubleshootingReplacement of Line Replaceable Units ( LRU’s )Test
Consumable parts (items which must be scrapped at everymaintenance action )
Line Material :
Repair of equipment removed on line

Engine DMC Breakdown (cont’d)
SHOP MAINTENANCE REPRESENTS ABOUT 93 %OF ENGINE MAINTENANCE COST
SHOP MAINTENANCE REPRESENTS ABOUT 93 %OF ENGINE MAINTENANCE COST
Routine Labor : assembly / disassembly, cleaning, inspection ofmodules and parts
SHOP ACTIVITY :
Repair of parts ( including LRU’s )
Material: cost of parts and material replaced during the shop visit
Fees, Tests, Transportation

Shop Visit Rate - Definitions
WATOG : World Airlines Technical Operations Glossary
“An engine Removal is classified as a "SHOP VISIT" wheneverthe subsequent engine maintenance performed prior toreinstallation entails separation of pairs of major mating flangesor removal of a disk, hub or spool. (WATOG definition)”
SHOP VISIT :
Some maintenance operations performed on wing or on a standmay not be defined as a SV (eg compressor top casing onCFM56 engines)

Shop Visit Rate – Definitions (cont’d)
SVR IS A MEASURE OF THE ENGINE RELIABILITY PARAMETER
DILUTED (“POPULAR”) SHOP VISIT RATE SVRRatio of the number of shop visits in a fleet to the total fleet flying time(expressed in 1000 hours) within a given period
It represents the aging process of the whole fleet
Ratio of the total number of shop visits having occurred within a period to the total number of hours flown by the involved engines since their last shop visit.
Average on-wing time = 1000 / RSVR
It represents an average time on wing between removals
NON DILUTED OR RESTORED SHOP VISIT RATE RSVR

Shop Visit Rate – RSVR and SVR
Average Mature life = 1000 / MatureSVR
1 2 3 4 5 6 7 8 9 10 11 12 13 14 15
SV/KEFHSV/KEFH
YearsYears
RSVR
Mature SVR
SVR

Engine DMC Breakdown ( cont’d )
SHOP MAINTENANCE COST DEPENDS ON TWO FACTORS :
SHOP DMC IS A FUNCTION OF SV RATE AND SV COSTSHOP DMC IS A FUNCTION OF SV RATE AND SV COST
SHOP DMC = SVC x SVR measured in $ / EFHSHOP DMC = SVC x SVR measured in $ / EFH
SHOP VISIT COST SVC in K$
SHOP VISIT RATE SVR nb SV / 1000

Shop Visit Rate – Definitions (cont’d)
5 4730 h
20130 h
Yearly utilization
Calculation example
Popular SVR = 1000 / 20130 = 0.049
1 3610 h
2 3480 h
3 4340 h
4 3970 h

Shop Visit Rate : Shop Visits cause breakdown
SV MAINLY CAUSED BY EGT AND OTHER CAUSESSV MAINLY CAUSED BY
EGT AND OTHER CAUSES
Other 32%
Hot Parts 12%
LLP 14%
Performances 42%
CFM56-5B3/PA321
Example of a High Thrust Rating engine

Other 42%
Hot Parts 10%
LLP 47%
Performances 1%
SV MAINLY CAUSED BY LLP AND OTHER CAUSESSV MAINLY CAUSED BY
LLP AND OTHER CAUSES
CFM56-5B6/PA319
Shop Visit Rate : Shop Visits cause breakdown
Example of a Low Thrust Rating engine

Shop Visit Cost - Shop Visit Workscope
Determined by :
Goal is to rebuild an engine with acceptable time to the next shop visit
Shop visit causeTime since last shop visit Condition of different modulesOn-wing life policyStatus of Life Limited PartsExpected time to the next shop visitBusiness consideration
Expected time to next shop visit
Performance Performance
Life Limited PartsLife Limited Parts
Other PartsOther Parts
Shop Visit

On-Wing Life Parameters
Engine Rating
Usage severityEngine Age

By-pass Ratio LimitationsEngine Rating and On-Wing Life

Maximum temperatureMaximum temperature
By-pass Ratio LimitationsEngine Rating and On-Wing Life

Engine Rating and On-Wing Life
LARGE EGT MARGIN & LOW DETERIORATION RATETRANSLATE INTO LONGER ON-WING LIFE
LARGE EGT MARGIN & LOW DETERIORATION RATETRANSLATE INTO LONGER ON-WING LIFE
0 10,000 20,000Time on wing
EGT
dete
riora
tion
EGT Limit
0 10,000 20,000
Time on wing
EGT Limit
Low RatingHigh Rating
Same Engine
Engine goes to shop

Exhaust Gas Temperature
Outside Air Temperature at T/O
Severity Factor
1
2
1 2 3 4Flight Leg (Hours)
Factors Affecting Severity
Engine Corner Point
Flight Leg and Thrust DerateFlight Leg and Thrust Derate Outside Air Temperature InfluenceOutside Air Temperature Influence
0.78
1.35
Decreasing Takeoff Derate
Source: EMCWG
0%
5%
15%10%
Environmental Conditions

Fan DiskBooster spoolShaft
High Pressure Compressor Front shaftStage 1-2 spoolStage 3 diskStage 4-9 spoolCDP seal
High Pressure TurbineFront shaftFront air sealDiskRear shaft
Low Pressure TurbineShaftConical supportStage 1 diskStage 2 diskStage 3 diskStage 4 disk
Current Lives
30,00030,00030,000
20,00020,00020,00020,00020,000
20,00020,00020,00020,000
25,00025,00025,00025,00025,00025,000
For Budgetary Purpose Only
LLP Management CFM56-7B/5B Life Limited Parts Status
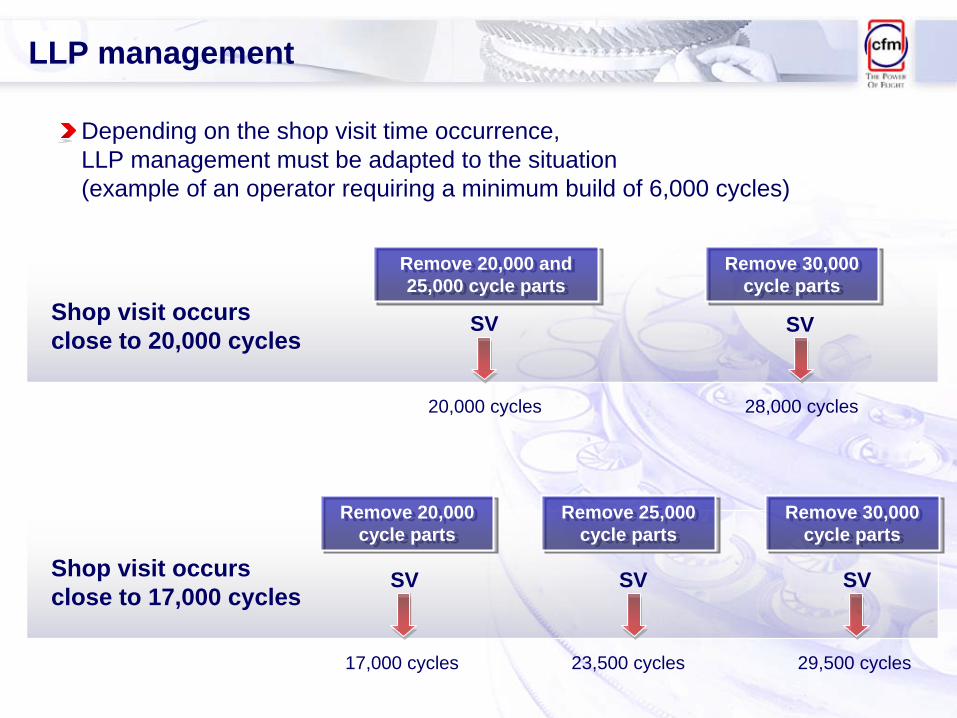
LLP management
Depending on the shop visit time occurrence, LLP management must be adapted to the situation (example of an operator requiring a minimum build of 6,000 cycles)
SV SVShop visit occurs close to 20,000 cycles
Remove 20,000 and 25,000 cycle parts
Remove 20,000 and 25,000 cycle parts
Remove 30,000 cycle parts
Remove 30,000 cycle parts
20,000 cycles 28,000 cycles
SV SV SVShop visit occurs close to 17,000 cycles
Remove 20,000 cycle parts
Remove 20,000 cycle parts
Remove 25,000 cycle parts
Remove 25,000 cycle parts
Remove 30,000 cycle parts
Remove 30,000 cycle parts
17,000 cycles 23,500 cycles 29,500 cycles

Engine Aging
As engine ages, the average time to shop visit lessens
1st SV
1
2nd SV
0.7
3rd SV
0.6
4th SV
0.6
Relative times to Shop Visit Mature Engine

Maintenance Reserve Calculation
An example - Assumptions
First Operator (10 year lease contract ):
Expected on wing lives:
Flight Leg: 1.3 hoursUtilization: 2,800 hours per yearCalculated average mature SVR: 0.100T/O derate: 15%Western Europe
Mature Shop Visit at 1000/SVR = 10 000 hoursFirst shop visit at 10,000/ 0.60.6 = 16,700 hours (12 900 cycles)Second Shop Visit at 11,700 hours (9000 cycles) , but limited at 7,100cycles due to 20,000 cycle LLP limit Following Shop Visits expected every 10,000 hours (Mature life)

An example - Rapid Calculation
Expected Shop Costs (LLP cost not included) 2 Core refurbishment: 2 M$
Expected expenses Operator 1: 2,0 M$ over 28,000 hours, or 78 $/EFH
SV1 SV2
Operator 1
10 year Contract
Maintenance Reserve Calculation

An example - Assumptions
Second Operator (7 year lease contract ) :
Calculated average mature SVR: 0.089 < Operator 1
Expected Shop Costs (LLP cost not included)
Flight Leg: 2.4 hoursUtilization: 3,200 hours per yearT/O derate: 10% Western Europe
Shop Visits expected every 1000/ 0.089 = 11,200 hours (4700 cycles)(theoretical first and second lives at 18,700 and 13,100 hours)
Core refurbishment: 1 M$Core + LPT refurbishment: 1.4 M$
Maintenance Reserve Calculation

SV1 SV2
Operator 1
SV3 SV4
Operator 2
Expected expenses Operator 1: 2 M$ over 28,000 hours, or 85 $/EFHExpected expenses Operator 2: 2.4 M$ over 22,400 hours, or 107 $/EFH
10 year Contract 7 year Contract
Operator 2 operation less severe than Operator 1
=>Maintenance Reserves need to be adjusted
Maintenance Reserve Calculation An example - Rapid Calculation

Maintenance Reserve Calculation
Expected expenses over 4 Shop visit, with operation 2: 4.4 M$ over 54,200 hours.Operation 2 maintenance reserves : 81 $/EFH
Expected expenses over 4 Shop visit, with operation 1: 4.4 M$ over 46,000 hours.Operation 1 maintenance reserves : 96 $/EFH 688k$ remaining in the reserve at the end of the 10th year
SV1 SV2 SV3 SV4
Operator 1
SV3 SV4
Operator 2
SV1 SV2
An example - More Accurate Calculation
Enough reserves to cover SV3 and SV4Enough reserves to cover SV3 and SV4
Engine Fleet Management
OBJECTIVES
KEEP HIGHEST RELIABILITYMAXIMIZE ASSET USEMINIMIZE COST OF OWNERSHIPMINIMIZE SPARE ENGINE INVENTORY

Engine Fleet Management - Tools
Take advantage of the different ratings of a common engine modelinstalled on different aircraft models
Permit to extend the average time between shop visits of theengine fleet
Engine Re-rating
Easier Shop Visit planningSpare engines used to reduce average usage of individual engines
Staggering
Commonality

Engine Fleet Management - Commonality
ENGINE COMMONALITYA KEY DRIVER TO REDUCE COSTS
ENGINE COMMONALITYA KEY DRIVER TO REDUCE COSTS
Commonality within a fleet of engines brings savings on :
…DocumentationInterface with Engine ManufacturerMechanics trainingEngine fleet managementSpare parts inventorySpare engine inventory
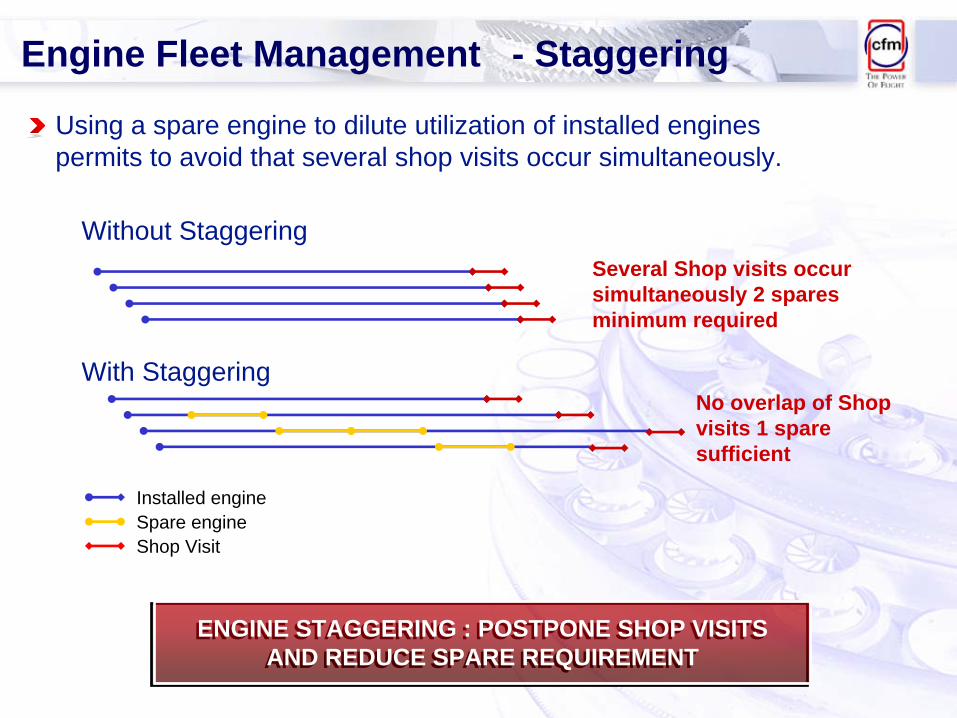
Engine Fleet Management - Staggering
Installed engineSpare engineShop Visit
Without StaggeringSeveral Shop visits occur simultaneously 2 spares minimum required
With StaggeringNo overlap of Shop visits 1 spare sufficient
Using a spare engine to dilute utilization of installed engines permits to avoid that several shop visits occur simultaneously.
ENGINE STAGGERING : POSTPONE SHOP VISITSAND REDUCE SPARE REQUIREMENT
ENGINE STAGGERING : POSTPONE SHOP VISITSAND REDUCE SPARE REQUIREMENT

EMO
3D. Engine Operation – Fuel consumption vs. on-wing life
Engine Removed from A321 and installed on A319
Extends the on wing life of the engines that are EGT limited on A321Postpones shop visits which would have otherwise occurred on A321
EGT Redline
A321-5B3/3 On Wing Life A319-5B6/3 Additional On Wing Life
EGT
EFH

3D. Engine Operation – Fuel consumption vs. on-wing life
0%
1%
2%
3%
4%
5%
6%
7%
EIS Year 5 Year 10 Year 15
5 shop visits for Operator 1
Single Engine deterioration
Average fuel consumption increase
Operator 1 : 3.8% to 3.9%
% F
uel B
urn
dete
riora
tion
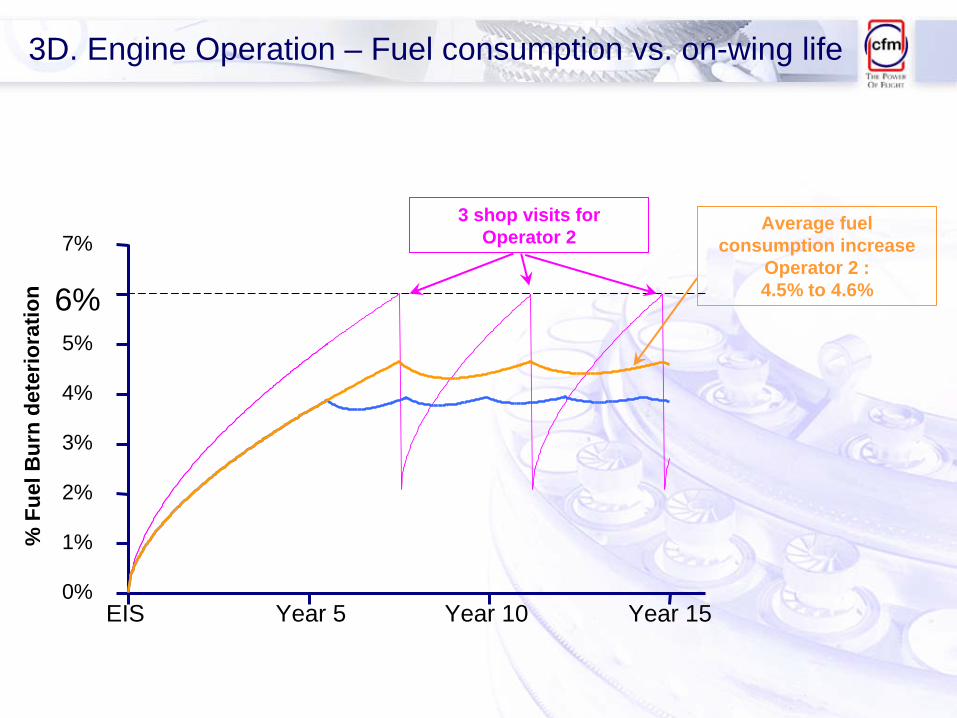
3D. Engine Operation – Fuel consumption vs. on-wing life
0%
1%
2%
3%
4%
5%
6%
7%
EIS Year 5 Year 10 Year 15
3 shop visits for Operator 2
Average fuel consumption increase
Operator 2 : 4.5% to 4.6%
% F
uel B
urn
dete
riora
tion

0.7% Lower fuel consumption for Operator 1 at the cost of 2 additional Shop Visits over 15 years
3D. Engine Operation – Fuel consumption vs. on-wing life
0%
1%
2%
3%
4%
5%
6%
7%
EIS Year 5 Year 10 Year 15
% F
uel B
urn
dete
riora
tion
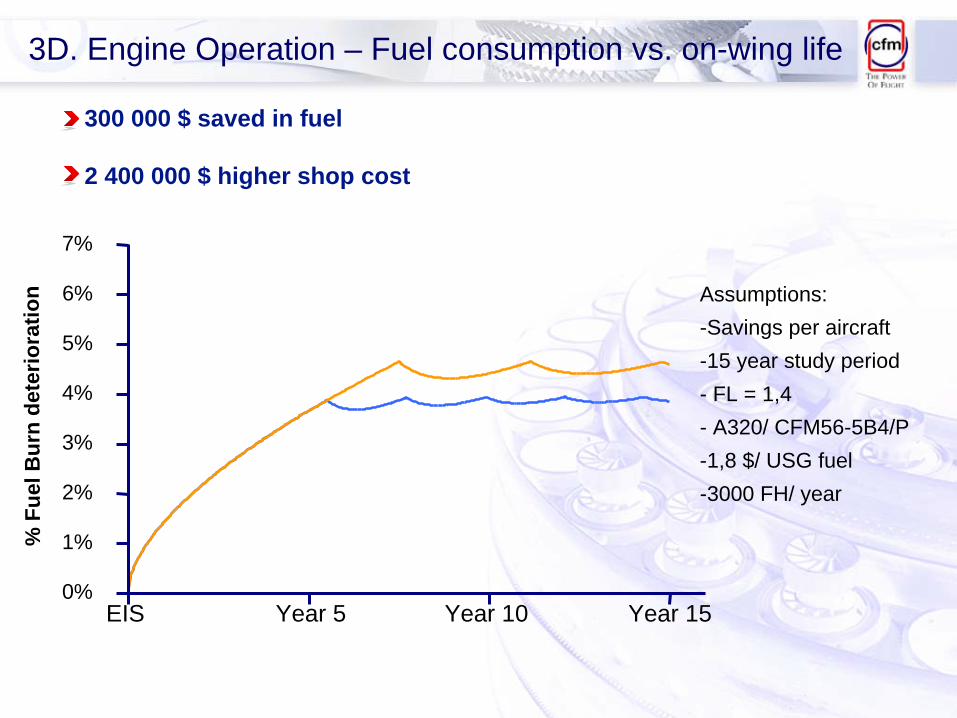
3D. Engine Operation – Fuel consumption vs. on-wing life
300 000 $ saved in fuel
2 400 000 $ higher shop cost
0%
1%
2%
3%
4%
5%
6%
7%
EIS Year 5 Year 10 Year 15
% F
uel B
urn
dete
riora
tion Assumptions:
-Savings per aircraft-15 year study period- FL = 1,4- A320/ CFM56-5B4/P-1,8 $/ USG fuel-3000 FH/ year

NEW CFM OWNERSTIME TO PUT YOUR FIRST SHOP VISIT IN THE DIARY
