engaging faculty in using data to increase student success dr. karen stout, president leon hill,...
TRANSCRIPT

Engaging Faculty in Using Data to Increase Student
SuccessDr. Karen Stout, President
Leon Hill, Director of Institutional Research
David Whalen, Instructor of Biology
Barbara Lontz, Assistant Professor of Mathematics
Diane McDonald, Assistant Professor of English
2012 D.R.E.A.M. Annual Meeting

About the College
More than 33,000 annual unduplicated credit and non-credit students
14,900 fall 2011 credit students Two campuses Suburban Philadelphia location in County with
800,000 residents Highly competitive higher education marketplace


Engagement of the Data

Gateway Courses
ACC 111
BIO 121
BIO 131
CHE 121
ENG 010
ENG 011
ENG 101
HIS 205
MAT 010
MAT 011
MAT 011B
MAT 106
MAT 100
SCS 101
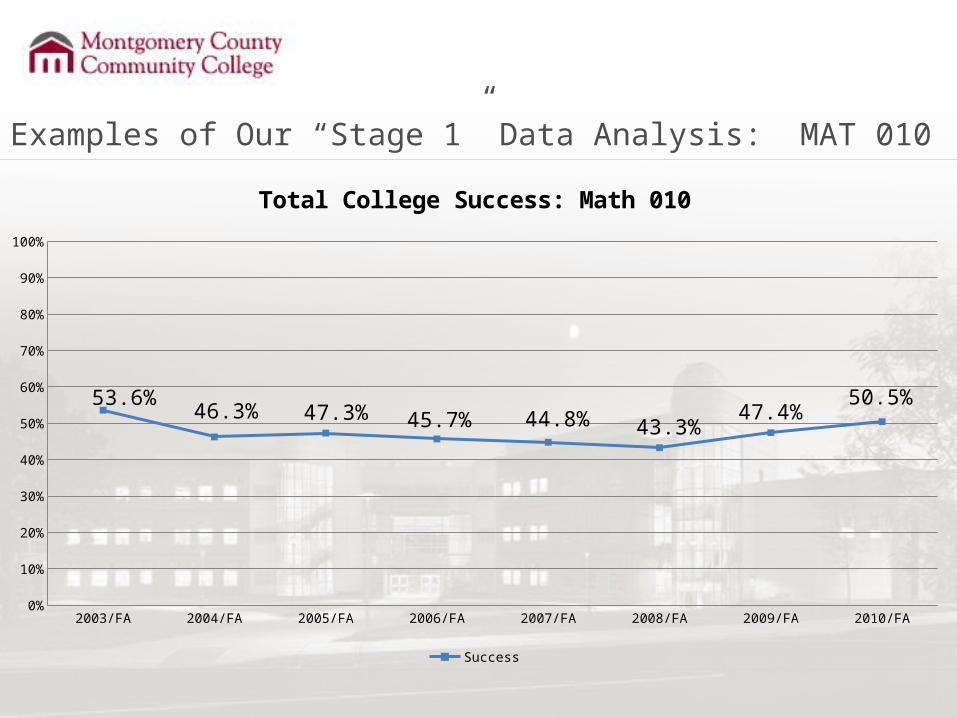
Examples of Our “Stage 1” Data Analysis: MAT 010
2003/FA 2004/FA 2005/FA 2006/FA 2007/FA 2008/FA 2009/FA 2010/FA0%
10%
20%
30%
40%
50%
60%
70%
80%
90%
100%
53.6%46.3% 47.3% 45.7% 44.8% 43.3%
47.4%50.5%
Total College Success: Math 010
Success

Examples of Our “Stage 1” Data Analysis: MAT 010
2003/FA 2004/FA 2005/FA 2006/FA 2007/FA 2008/FA 2009/FA 2010/FA0%
10%
20%
30%
40%
50%
60%
70%
80%
90%
100%
58.9%52.1% 49.4% 52.2%
47.8% 48.2%
56.4% 55.2%
45.7%
37.0%
44.7%
36.2%40.7%
36.5% 35.0%
43.4%
Math 10: Success by Gender
Female Success Male Success

Examples of Our “Stage 1” Data Analysis: MAT 010
2003/FA 2004/FA 2005/FA 2006/FA 2007/FA 2008/FA 2009/FA 2010/FA0%
10%
20%
30%
40%
50%
60%
70%
80%
90%
100%
43.0%37.7% 38.8%
25.6% 26.9%30.3%
38.6%36.8%
58.0%
52.1% 50.1%52.5% 53.5%
48.5%52.8%
59.0%
Math 10: Success by Race/Ethnicity
African American Success Latino Success Caucasian Success

Next Steps
Creation of strategies to address these issues in certain courses.
BIO 131 MAT 010 ENG 101

BIOLOGY 131:Human Anatomy & Physiology

The Problem
Low overall success rates (<55%) in Anatomy & Physiology I, a “gatekeeper” Biology course
Anatomy & Physiology I prerequisite:
High school biology within the past 5 years or successful completion of General Biology
General Biology students successfully complete Anatomy & Physiology at a FAR higher rate than high school biology students

Past Success Rates in A&P I
0102030405060708090
100
HS Biologyas prereq
General Biologyas prereq
Success Rates in A&P IDepending on Prerequisite
% S
ucce
ssfu
l
73%
38%

Relationship between Placement Exam Score and A&P I Success Rates for 2009-2010
Per
cent
Suc
cess
in A
&P
I
Biology Placement Exam Score
2009/FA
2010/SP
20-29 30-39 40-49 50-59 60-69 70-79 80-89 90-1000
10
20
30
40
50
60
70
80
90
100
N=767 students

Implementation of Biology Placement Exam
A&P I prerequisite for new students:
Successful completion of General Biology or passing score on the Biology Placement Exam
Cutoff score:
• Students scoring >55% place into A&P I (BIO 131)
• Students scoring <55% place into General Biology I (BIO 121)
Online review materials are available to students preparing for the Biology Placement Exam
For more information: http://www.mc3.edu/admissions/gettingStarted/placement/bio.aspx

MATH 010: Fundamentals of Arithmetic

Developmental Math Crisis
Data received identified the arithmetic/prealgebra course as having the lowest success rate of any course at the College
Challenge was to increase success rates without changing or lowering learning outcomes
Potential solutions included Learning Communities & Supplemental Instruction

Course Redesign
The delivery format changed from a presentation of topics to an understanding of concepts
The teaching approach switched from a mastery of skills to a discovery approach
Concepts of Numbers for Arithmetic & Prealgebra was developed in fall 2008
Awarded a Hewlett Scaling Innovation grant in fall 2011

Concepts Data Fall
2008Spring 2009
Fall 2009
Spring 2010
Fall 2010
Spring 2011
Fall2011
Concepts of Numbers
74% 63% 68% 60%* 58%** 57.4% 57.72%
N = 19 N = 19 N = 19 N = 255 N = 380 N = 289 N = 704
Traditional Arithmetic
45% 34% 41% 40% 40% 37.8% n/a
N = 664 N = 429 N = 567 N = 236 N = 284 N = 150 N = 0

ENGLISH 101: Composition

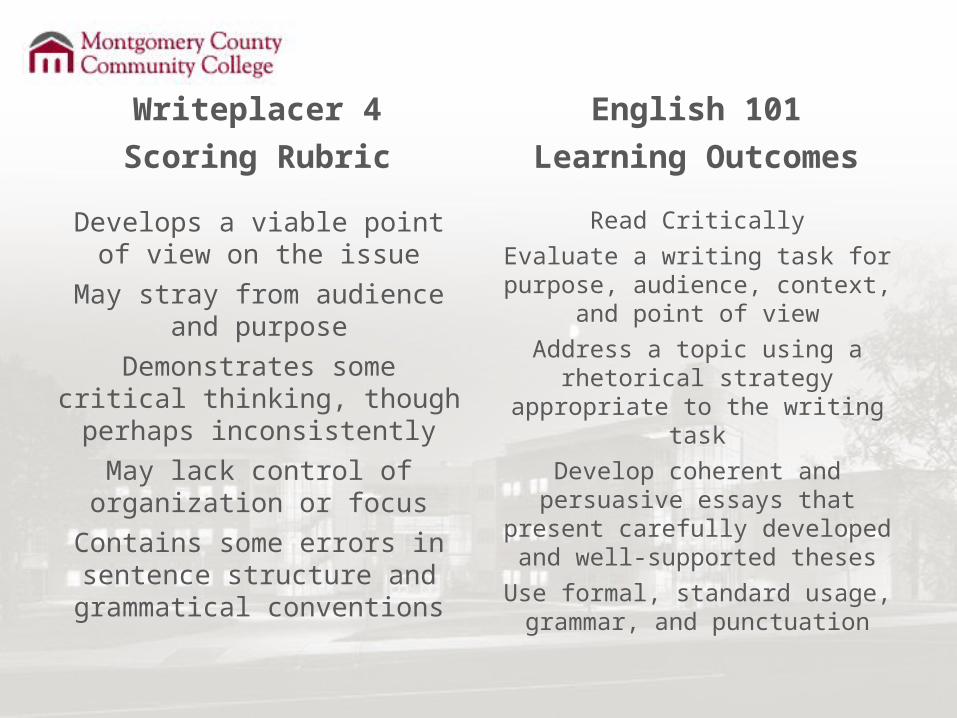
Writeplacer 4
Scoring Rubric
Develops a viable point of view on the issue
May stray from audience and purpose
Demonstrates some critical thinking, though perhaps
inconsistently
May lack control of organization or focus
Contains some errors in sentence structure and
grammatical conventions
English 101
Learning Outcomes
Read Critically
Evaluate a writing task for purpose, audience, context, and
point of view
Address a topic using a rhetorical strategy appropriate to the writing
task
Develop coherent and persuasive essays that present carefully
developed and well-supported theses
Use formal, standard usage, grammar, and punctuation

Placement Cut Off Scores
Writeplacer
FA '10 SP '11 FA '110
10
20
30
40
50
60
70
8069
5965
WP 4WP 4-8Overall Success
Accuplacer
FA '10
SP '11
FA '11
0
10
20
30
40
50
60
70
80
69
5965
AP 86-100AP 101+Overall Success

SAT Exemption
FA '10 SP '11 FA '110
10
20
30
40
50
60
70
80
90
100
86
59
7569
5965
SAT ExemptOverall Success

Evaluation of InitiativesResearch Question
Are students who enroll in a MAT 010 conceptual approach pilot more successful than those students who enroll in a traditional MAT 010 course?
Previous Literature/Research
Research Design Metric & Definition
Population Under Study
Population or Sample
Study Occur
Timeframe/Timeline
Control Group
Treatment Introduced
Comparison Group Analysis
Success Rate in Alt Math 010 vs. Success Rate in all other Math 010 courses Success Rate= (Grades of A, B, C, P) / Total enrolled in the course)
Students enrolled in the Alternative MAT 010 and all other Mat 010 students
Total population of students in the courses.
All locations
Fall 2008, Spring 2009. Fall 2009, Spring 2010
Yes: All MAT 010 sections that are not part of the Alternative approach
none
Confounding Variables
Type of Data:Qualitative/ Quantitative/ Mixed Method?
Collection Method
How will the data be analyzed
Targeted Outcome
Does the data match the question?
Can we estimate or predict fiscal cost if any?
Different faculty may be teaching the course; no textbook
Mixed Grade Data
Pre & Post Tests
Student Evaluations
One Minute Papers
Percentages,
Mean, Median, Mode, Standard Deviations
Theme Analysis
Success Rate of XX%
Yes $300 supplies

Dissemination of Results
Research and Practice Academic Division Presentations General Faculty Meetings President’s Cabinet Board of Trustees National/Regional Conferences


Gateway Course Academy
Outgrowth of the initiatives: Goal is to provide faculty with the necessary support
to develop, implement and evaluate improvements Cross-disciplinary team (Economics, Beginning
Algebra, Criminal Justice, Intro to Education , US History & Basic Writing 2)
Members identify a course-based research question

Gateway Academy
Broader issues of student motivation, college readiness and faculty development are discussed
Future expansion of the group will be on-going

Final Thoughts