energyconservationasaprincipleunderlyingmobilizable ... · on an extended mobilizable strength...
TRANSCRIPT
Energy Conservation as a Principle Underlying MobilizableStrength Design for Deep Excavations
S. Y. Lam1 and M. D. Bolton2
Abstract: Finite-element analyses (FEA) and case histories of deep excavations in soft clay are used to validate a decision-making tool basedon an extended mobilizable strength design (MSD) method that permits the designer an extremely simple method of predicting grounddisplacements during an undrained excavation. This newly extended MSD approach accommodates a number of issues that are importantin underground construction between in situ walls, including alternative base heave mechanisms suitable either for wide excavations inrelatively shallow soft clay strata or narrow excavations in relatively deep soft strata, the influence of support system stiffness in relationto the sequence of propping of the wall, and the capability of dealing with stratified ground. In addition, a simplified MSD framework isproposed for analyzing a database of 110 deep excavation case histories worldwide. The approach examines the governing factors controllingdeformation in deep excavations and offers simple guidelines for designing support structures for deep excavations. These developmentsshould make it possible for a design engineer to make informed decisions on the relationship between prop spacing and ground movements orthe influence of wall stiffness and on the need for and influence of a jet-grouted base slab, for example, prior to conducting project-specificFEA. DOI: 10.1061/(ASCE)GT.1943-5606.0000510. © 2011 American Society of Civil Engineers.
CE Database subject headings: Energy efficiency; Case studies; History; Excavation; Stiffness.
Author keywords: Mobilizable strength design; Case histories; Deep excavation; Soil stiffness.
Introduction
The mobilizable strength design (MSD) method has its origins inattempts to use plastic deformation mechanisms to predict grounddisplacements around retaining walls: (Milligan and Bransby 1976;Bolton and Powrie 1987; Bolton et al. 1989, 1990a, b). Separate butbroadly consistent mechanisms were used to represent the states ofequilibrium of soil bodies adjacent to a wall and their possiblestates of deformation. The demands of equilibrium were first ap-plied to deduce a mobilized soil strength. Raw shear stress-straindata from soil tests on representative undisturbed samples couldthen be used directly to link stresses and strains under working con-ditions and thereby to deduce soil strains and wall movements.
The fully developed MSD approach, on the other hand, requiresthe engineer only to imagine the kinematics (i.e., the pattern ofdisplacements) of the soil caused by the proposed actions. Thisdeformation mechanism will immediately imply a compatibilityrelationship between the average strain mobilized in the soil andthe boundary displacements. It is then necessary to providerepresentative stress-strain data for the soils participating in themechanism. Just as with an upper bound plastic analysis of col-lapse, the requirement for a separate equation of equilibrium canthen be replaced by the consideration of work and energy in theselected mechanism. In the case of MSD, however, this energy
equation is related to working stresses and the prediction of defor-mations in service.
The MSD approach has been successfully implemented forshallow foundations (Osman and Bolton 2005), cantilever retainingwalls (Osman and Bolton 2004), tunneling-induced ground dis-placements (Osman et al. 2006) and also the sequential construc-tion of braced excavations that induce wall displacements andground deformations (Osman and Bolton 2006). Recent work byKlar and Osman (2008) further clarified the approach to MSDthrough the principle of energy conservation. This is furtherextended to deep excavations in the current work, following Boltonet al. (2009), in which changes of gravitational potential energy andthe strain energy of the supporting structure are included in theformulation for the first time.
Current Design Approach for Braced Excavations
Plastic Failure Mechanisms
Limit equilibrium methods are routinely used in stability calcula-tions for soft clay that is overidealized as rigid-plastic. Slip surfacesare selected as the assumed focus of all plastic deformations. Fail-ure mechanisms should be kinematically admissible, meaning thatneither unwanted gaps nor overlaps should be produced. Further-more, in the case of undrained shearing of clays, a constant-volumecondition should be respected at every point. A consequence is thatundrained plane-strain failure mechanisms must comprise only slipplanes and slip circles. The soil on such failure surfaces is taken tomobilize its undrained shear strength divided by a safety factor tomaintain the mechanism in limiting equilibrium under the action ofgravity and any other applied loads. If preferred, the same calcu-lation can be set up as a balance of work done and energy dissipatedas the result of an arbitrary displacement of the mechanism, whichthen cancels out. Calculated in this way, the safety factor literallyoffers an estimate of the factor by which the strength of the soil
1Ph.D. Student, Dept. of Engineering, Univ. of Cambridge, UnitedKingdom (corresponding author). E-mail: [email protected]
2Professor, Dept. of Engineering, Univ. of Cambridge, UnitedKingdom. E-mail: [email protected]
Note. This manuscript was submitted on August 24, 2009; approved onJanuary 14, 2011; published online on January 17, 2011. Discussion periodopen until April 1, 2012; separate discussions must be submitted for indi-vidual papers. This paper is part of the Journal of Geotechnical andGeoenvironmental Engineering, Vol. 137, No. 11, November 1, 2011.©ASCE, ISSN 1090-0241/2011/11-1062–1074/$25.00.
1062 / JOURNAL OF GEOTECHNICAL AND GEOENVIRONMENTAL ENGINEERING © ASCE / NOVEMBER 2011
Downloaded 20 Mar 2012 to 129.169.242.3. Redistribution subject to ASCE license or copyright. Visit http://www.ascelibrary.org

would have to drop before the soil construction would collapse.Such estimates will err on the high side if the assumed mechanismdeparts from reality in any given case.
In the case of base heave in braced excavations, plastic solutionswere derived from slip-line fields based on the method of character-istics. Such solutions comprise both slip surfaces, as before, andplastic fans, which distribute plastic strains over a finite zone in theshape of a sector of a circle. Notwithstanding these zones ofdistributed strain, the additional presence of slip surfaces still re-stricts the application of these solutions to the prediction of failure.Furthermore, no such solution can be regarded automatically as anaccurate predictor of failure, notwithstanding their apparent sophis-tication. Their use in practice can only be justified following back-analysis of actual failures, whether in the field or the laboratory.
Fig. 1 shows two typical failure mechanisms, as suggested byTerzaghi (1943) and Bjerrum and Eide (1956). They have eachbeen widely used for the design of multipropped excavations.Terzaghi (1943) suggested a mechanism consisting of a soil columnoutside the excavation, which creates a bearing-capacity failure.The failure is resisted by the weight of a corresponding soil columninside the excavation and also by adhesion acting along the verticaledges of the mechanism. Bjerrum and Eide (1956) assumed that thebase of the excavation could be treated as a negatively loadedperfectly smooth footing. The bearing-capacity factors proposedby Skempton (1951) are used directly in the stability calculationsand are taken as stability numbers, N ¼ γH=cu. Eide et al. (1972)
modified this approach to account for the increase in basal stabilityowing to mobilized shear strength along the embedded length of therigid wall.
O’Rourke (1993) further modified the basal stability calcula-tions of Bjerrum and Eide (1956) to include flexure of the wallbelow the excavation level. It was assumed that the embeddeddepth of the wall does not change the geometry of the basal failuremechanism. However, an increase in stability was anticipated as aresult of the plastic work done on the wall. This gave stability num-bers that were functions of the yield moment and of the assumedboundary conditions at the base of the wall.
Ukritchon et al. (2003) used numerical limit analysis to calculatethe stability of braced excavations. Upper and lower bound formu-lations were presented on the basis of Sloan and Kleeman (1995)and Sloan (1988), respectively. The technique calculates upper-bound and lower-bound estimates of collapse loads numericallyby linear programming, whereas spatial discretization and interpo-lation of the field variables are calculated using the finite-elementmethod. No failure mechanism needs to be assumed, and failureboth of the soil and the wall are taken care of. However, both soiland wall are again assumed to be rigid perfectly plastic, so thefailure mechanism includes a plastic hinge at the lowest level ofsupport.
All these collapse limit analyses provide useful guidance on thepossible geometry of plastic deformation mechanisms for serviceconditions. But the key requirement for MSD mechanisms is thatdisplacement discontinuities (slip surfaces) must be avoidedentirely. In that way, small but finite ground displacements are as-sociated at every internal point with small but finite strains.
Wall Deformations
Clough et al. (1989) used field case records of braced excavationsto plot the ratio of maximum wall movement to excavation depth(wmax=H) as a function of the support-system stiffness. Mana andClough (1981) went on to plot a chart of wmax=H against the factorof safety against base heave as defined by Terzaghi (1943), ignor-ing the influence of the wall. They showed a very strong increase inwall bulging as the factor of safety of the soil dropped to unity orbelow. Although indicative guidelines were sketched on the chart,the scatter of the field data was rather wide. The current work in-tends to retain the simplicity inherent in such design charts whilereducing scatter by better characterizing and analyzing deformationmechanisms.
At each stage of excavation in soft clay, the incremental dis-placement profile of the wall below the lowest prop will be assumedto be a cosine function, as described by O’Rourke (1993) andsketched in Fig. 2:
Fig. 2. Incremental displacements in braced excavation (afterO’Rourke 1993)
Fig. 1. Conventional basal stability mechanism and notation (afterUkritchon et al. 2003 ASCE): (a) without wall embedment (prin-cipal stress directions after Clough and Hansen 1981); (b) with wallembedment
JOURNAL OF GEOTECHNICAL AND GEOENVIRONMENTAL ENGINEERING © ASCE / NOVEMBER 2011 / 1063
Downloaded 20 Mar 2012 to 129.169.242.3. Redistribution subject to ASCE license or copyright. Visit http://www.ascelibrary.org
δw ¼ δwmax
2
�1� cos
�2πyλ
��ð1Þ
Here, δw = incremental wall displacement at any distance ybelow the lowest support; δwmax = its maximum value; and λ =wavelength of the deformation, defined by O’Rourke (1993) asthe vertical distance from the lowest support to the level at whichthe wall is effectively fixed in a stiff underlying layer. Osman andBolton (2006) noted that wavelength λ should therefore depend onthe degree of wall base fixity. They expressed this in terms of thelength s of the wall projecting below the lowest level of currentsupport, by using a parameter α:
λ ¼ αs ð2ÞFor walls embedded into a stiff layer beneath soft clay such that
the wall base is fully fixed in position and direction, α was set to 1.For walls embedded in deep soft clay, the maximum wall displace-ment occurs at the tip of the wall so the wavelength was taken astwice the projecting wall length (α ¼ 2). Intermediate cases weredescribed as restrained-end walls (1 < α < 2). It was recognizedthat this simple prescription could not accurately represent theactual soil–structure interaction, but it was also shown that MSDpredictions made on the basis of it were nevertheless fairly good.
However, these kinematic conditions apply only to very wideexcavations. When a narrow excavation is considered, the wave-length may be limited by the width of the excavation. This is con-sidered next, together with other extensions and improvements toMSD for braced excavations.
Application of MSD for Deep Excavations
Osman and Bolton (2006) showed that for an in situ wall support-ing an undrained deep excavation in soft clay, the total deformationcan be approximated as the sum of the cantilever movement priorto propping and the subsequent bulging movement that accretesincrementally with every step in the sequence of propping andexcavation.
A method for estimating the cantilever movement had been sug-gested earlier in Osman and Bolton (2004). It begins by consideringthe lateral earth pressure distribution for a smooth, rigid, cantileverwall rotating about a point some way above its toe in undrainedconditions. A simple mobilized strength ratio is introduced to char-acterize the average degree of mobilization of undrained shearstrength throughout the soil. By using horizontal force and momentequilibrium equations, the two unknowns (the position of the pivotpoint and the mobilized strength ratio) are obtained. Then a mobi-lized strain value is read off from the shear stress-strain curve of asoil element appropriate to the representative depth of the mecha-nism at the middepth of the wall. Simple kinematics for a cantileverwall rotating about its base suggests that the shear strain mobilizedin the adjacent soil is double the angle of wall rotation. Accord-ingly, for the initial cantilever phase, the wall rotation is estimatedas one-half of the shear strain required to induce the degree ofmobilization of shear strength necessary to hold the wall in equi-librium. Osman and Bolton (2004) used finite-element analysis(FEA) to show that correction factors up to about 2.0 could beapplied to these MSD estimates of the wall crest displacement,depending on a variety of nondimensional groups of parametersignored in the simple MSD theory, such as wall flexibility andinitial earth pressure coefficient prior to excavation.
A typical increment of bulging, on the other hand, was calcu-lated in Osman and Bolton (2006) by considering an admissibleplastic mechanism for base heave. In this case, the mobilized shear
strength was deduced from the kinematically admissible mecha-nism itself, by using virtual work principles. The energy dissipatedby shearing was said to balance the virtual loss of potential energycaused by the simultaneous formation of a subsidence trough on theretained soil surface and a matching volume of heave inside theexcavation. The mobilized strength ratio could then be calculated,and the mobilized shear strain read off from the stress-strain curveof a representative element, as before. The wall deformation incre-ment was then estimated by using the relationship between theboundary displacements and the average mobilized shear strain,in accordance with the original bulging mechanism.
The MSD solutions of Osman and Bolton (2006) comparedquite well with some numerical simulations with the realisticnonlinear MIT-E3 model and various field case studies. However,these early solutions are capable of improvement in the followingthree ways, which will contribute to their applicability in engineer-ing practice:• The original mechanism assumed a relatively wide excavation,
whereas cut-and-cover tunnel and subway constructions arelikely to be much deeper than their width. The MSD mechanismtherefore needs to be adapted for the case in which the plasticdeformation fields for the side walls interfere with each otherbeneath the excavation.
• The structural strain energy of the support system can be incor-porated. This could be significant when the wall is stiff and thesoil is weak and especially so when measures are taken to limitbase heave in the excavation, such as by base grouting betweenthe supporting walls. In this case, the reduction of lateral earthpressure caused by ground deformation may be relatively small,and it is principally the stiffness of the structural system itselfthat limits external ground displacements.
• Progressively incorporating elastic strain energy requires thecalculation procedure to be fully incremental, whereas Osmanand Bolton (2006) used total energy flows to calculate the re-sults of each stage of excavation separately. A fully incrementalsolution, admitting ground layering, will permit the accumula-tion of different mobilized shear strengths and shear strains atdifferent depths in the ground, thereby improving accuracy.This paper aims to introduce an enhanced MSD solution
that includes these three features. This is then compared withan existing FEA study and with some case histories of bracedexcavation.
Geostructural Mechanisms and Extended MSDMethod
Osman and Bolton (2006) proposed an incremental plastic defor-mation mechanism conforming to Eq. (1) for a wide multiproppedexcavation in clay. In this mechanism, the wall is assumed to befixed incrementally in position and direction at the lowest prop,implying that the wall has sufficient strength to avoid the formationof a plastic hinge. The wall and soil are deforming compatibly, andthe soil deformation also follows the cosine function of Eq. (1). Thedimensions of this mechanism depend on the wavelength λ.
Fig. 3(a) shows the complete displacement field for the mecha-nism proposed by Osman and Bolton (2006). The solution includesfour zones of distributed shear, which consist of a column of soiladjoining the excavation above the level of the lowest prop, a cir-cular fan zone centered at the lowest prop, another circular fan zonewith its apex at the junction of the wall and the excavation surface,and a 45° isosceles wedge below the excavation surface. The soilshears compatibly and continuously with no relative sliding at theboundaries of each zone. The dotted lines with arrows show the
1064 / JOURNAL OF GEOTECHNICAL AND GEOENVIRONMENTAL ENGINEERING © ASCE / NOVEMBER 2011
Downloaded 20 Mar 2012 to 129.169.242.3. Redistribution subject to ASCE license or copyright. Visit http://www.ascelibrary.org

direction of the flow. Along each of these lines, the displacement isconstant and is given by the cosine function of Eq. (1). It is assumedthat the zone outside the deformation zones is rigid. This mecha-nism of shearing at constant density is simple, but it only appliesto wide excavations. In the case of a narrow excavation, the widthof the triangular wedge could be bigger than the actual width of the
excavation. In view of this, a new mechanism for narrow excava-tions is proposed in Fig. 3(b). The mechanism in the passivezone (zone EFHI) is replaced. The new mechanism [as shown inFig. 3(c)] also meets the condition for undrained shearing, whichmeans that the volumetric strain remains zero throughout the zone.
The original solution of Osman and Bolton (2006) assumed thatsoils were homogenous. The average shear strain increment in eachzone was calculated by taking the derivative of the prescribed dis-placement equation. Then the undrained shear strength (cu;mob),mobilized at any location for any excavation height, was expressedusing a single mobilization ratio β ¼ cu;mob=cu to factor thestrength profile. With the use of the virtual work principle, the plas-tic work done by shearing of the soil was equated to the virtualchange of gravitational potential energy of the soil. A β factorwas then found so that a corresponding mobilized shear straincould be read off from the chosen stress-strain curve. The incre-mental displacement was then calculated by the correlationbetween the average shear strain increment and the incrementalwall displacement.
This approach offered a straightforward way to estimate thebulging displacement of the retaining wall. However, the approachrequires refinement to include additional features that are signifi-cant in deep excavations. First, the approach did not consider theelastic strain energy stored in the support system. Second, it iscommon to find a nonuniform soil stratum with undrained shearstrength that varies irregularly with depth. Furthermore, the geom-etry of the deformation mechanism changes as the constructionproceeds, so the representation of mobilization of shear strengththrough the whole depth, by using a single mobilization ratio, isonly a rough approximation. In reality, there will be differencesin mobilization of shear strength at different depths for calculatingincremental soil displacement.
Last, the original mechanism of Osman and Bolton (2006),shown in Fig. 3(a), only applied to wide excavations, which aredefined with respect to Fig. 3(a) as indicating that the pair ofretaining walls does not encroach so close as to cause their passivetriangular zones FIH to overlap. Because the radius of the shearfan FHE is (λ-h0), in which h0 = depth of excavation below thelowest prop, the wide excavation is defined by the conditionB ≥ 2
p2ðλ-h0). Conversely, the new mechanism, shown in
Fig. 3(b), should be employed for narrow excavations definedby B ≤ 2
p2ðλ-h0Þ, for which the displacement field is given in
Fig. 3(c).
Deformation Pattern in Different Zones
From Fig. 3, the soil is assumed to flow parallel to the wall at theretained side above the level of the lowest support (zone ABDC),and the incremental displacement at any distance x from the wall isgiven by the cosine function of Eq. (1), replacing y with x.
By taking the origin as the top of the wall, the deformationpattern of retained soil ABDC is given in rectangular coordinatesas follows:
δwy ¼ � δwmax
2
�1� cos
�2πxλ
��ð3Þ
δwx ¼ 0 ð4ÞIn fan zone CDE, by taking the apex of the fan zone as the
origin:
δwy ¼δwmax
2
�1� cos
�2π
ffiffiffiffiffiffiffiffiffiffiffiffiffiffix2 þ y2
pλ
��� �xffiffiffiffiffiffiffiffiffiffiffiffiffiffix2 þ y2
p�
ð5Þ
δwmax
δwmax
A B
C DF
E
H
Iδwmax
λ
λ
C
hHL
Stiff stratum
h'
B
Stiff stratum
δwmax
δwmax
A B
C DF
E
I
H
λ
λ B
h
h'
HL
Cl
wABCDave
max, 2
δγ =
l
wCDEave
max, 2.2γ =
Whole Mechanism:
l
wave
max2γ =
EFHIave,γ : See Figure 5
δ
δ
0 1 2 3 4 5 6 7 8 9 10-5
-4
-3
-2
-1
0
1
2
3
4
5F I
E H
(a)
(b)
(c)
Fig. 3. Incremental displacement fields: (a) incremental displacementfield for wide excavation; (b) incremental displacement field for narrowexcavation; (c) incremental displacement field for narrow excavationfor zone EFHI
JOURNAL OF GEOTECHNICAL AND GEOENVIRONMENTAL ENGINEERING © ASCE / NOVEMBER 2011 / 1065
Downloaded 20 Mar 2012 to 129.169.242.3. Redistribution subject to ASCE license or copyright. Visit http://www.ascelibrary.org

δwx ¼δwmax
2
�1� cos
�2π
ffiffiffiffiffiffiffiffiffiffiffiffiffiffix2 þ y2
pλ
���yffiffiffiffiffiffiffiffiffiffiffiffiffiffi
x2 þ y2p
�ð6Þ
For fan zone EFH in a wide excavation, as indicated in Fig. 3(a),by taking the junction of the wall and the current excavation levelas the origin:
δwy ¼δwmax
2
�1� cos
�2π½hþ
ffiffiffiffiffiffiffiffiffiffiffiffiffiffix2 þ y2
p�
λ
���xffiffiffiffiffiffiffiffiffiffiffiffiffiffi
x2 þ y2p
�ð7Þ
δwx ¼δwmax
2
�1� cos
�2π½hþ
ffiffiffiffiffiffiffiffiffiffiffiffiffiffix2 þ y2
p�
λ
���yffiffiffiffiffiffiffiffiffiffiffiffiffiffi
x2 þ y2p
�ð8Þ
For the triangular zone FHI in a wide excavation, again takingthe junction of the excavation and the wall as the origin:
δwy ¼ δwx ¼ffiffiffi2
pδwmax
4
�1� cos
�2π½hþ
ffiffi2
p2 ðx� yÞ�λ
��ð9Þ
For a narrow excavation, as shown in Fig. 3(b), a rectangularzone EFHI of two-dimensional (2D) shearing is now proposed.The origin is taken as the midpoint of FE, midwavelength in theexcavation, at the wall:
δwy ¼λδwmax
4B
�π þ 2πy
λþ sin
�2πyλ
���sin
�πxB
��ð10Þ
δwx ¼δwmax
2
�1þ cos
�2πyλ
���cos
�πxB
��ð11Þ
In order to get more accurate solutions, it is supposed that thesoil stratum is divided into n layers of uniform thickness (Fig. 4).The average shear strain δγðm; nÞ is calculated for the n layers in mexcavation stages. The incremental engineering shear strain in eachlayer is calculated as follows:
δγðm; nÞ ¼R� ffiffiffiffiffiffiffiffiffiffiffiffiffiffiffiffiffiffiffiffiffiffiffiffiffiffiffiffiffiffiffiffiffiffiffiffiffiffiffiffiffiffiffiffi
ð∂wx∂y þ ∂wy
∂x Þ2 � 4 ∂wx∂x∂wy
∂yq �
dVolRdVol
ð12Þ
In order to get a better idea of the deformation mechanism, therelationship between the maximum incremental wall displacementand the average shear strain mobilized in each zone of deformationshould be obtained. On the active side of the excavation, the spatialscale is fixed by the wavelength of deformation λ, and all straincomponents are proportional to δwmax=λ. The average engineeringshear strain increment (γmob) mobilized in the deformed soil can becalculated from the spatial average of the shear strain increments inthe whole volume of the deformation zone. For a wide excavation,as in Fig. 3(a), the average shear strain is equal to 2δwmax=λ. For anarrow excavation, the average shear strain (γave) of active zoneABCD and fan zone CDE is 2δwmax=λ and 2:23δwmax=λ, respec-tively, whereas γave in the passive zone EFHI depends both on thewavelength λ of the deformation and the width B of the excavation.The relationship between the normalized average shear strain inEFHI and the excavation geometry (i.e., λ=B ratio) is shown inFig. 5. Different excavation geometries are considered and indi-cated as black icons. The corresponding correlations are as follows:
γave2wmax=B
¼ 0:38
�2λB
�þ 0:61 for
λB≥ 1 ð13Þ
γave2wmax=B
¼ 0:98
�2λB
�2� 3:16
�2λB
�þ 3:83 for
λB≤ 1 ð14Þ
If an excavation has a width B that is slightly larger or smallerthan 2
ffiffiffi2
p ðαs� h0Þ, the two mechanisms should ideally produceidentical wall displacements. Since the average shear strain insidethe passive zone for the wide mechanism is γave ¼ 2:23δwmax=λat the transition, and that of the narrow excavation is γave ¼2:25δwmax=λ, this condition is satisfied sufficiently well.
Apart from the first excavation stage, all subsequent deforma-tion mechanisms must partially overlay the previous ones (Fig. 6).Because of the nonlinearity of soil, it is important to calculate theaccumulated mobilized shear strain in each particular layer of soilto correctly deduce the mobilized shear strength of that layer. Thisis done by an area-average method described as follows:
γðm; nÞ ¼ dγðm; nÞ × Aðm; nÞ þ γðm� 1; nÞ × Aðm� 1; nÞAðm; nÞ ð15Þ
in which γðm; nÞ = total shear strain of the nth layer in the mthexcavation stage, and Aðm; nÞ = area of deformation in the nth layerin the mth excavation stage.
Fig. 5. Correlation between normalized average shear strain andexcavation geometry for a narrow excavation
A B
C DF
E
H
I
σ1
1σ
σ1
σ1
DSS
DSS
PSAPSP
Layer 1
Layer 2
Layer 3
Layer 4
Layer n
Layer (n-1)
λ
Fig. 4. Mobilizable shear strength profile of an excavation stage in alayered soil
1066 / JOURNAL OF GEOTECHNICAL AND GEOENVIRONMENTAL ENGINEERING © ASCE / NOVEMBER 2011
Downloaded 20 Mar 2012 to 129.169.242.3. Redistribution subject to ASCE license or copyright. Visit http://www.ascelibrary.org

With the help of some suitable stress-strain relation for thesoil (discussed in the following section), the mobilized strengthratio βðm; nÞ after the excavation stage m for soil layer n can befound by reading off the stress-strain curve at the average shearstrain level experienced by the nth layer in the mth stage ofconstruction.
Shear Strength Mobilized within the Mechanism
In soft clay, the undrained shear strength generally varies withdepth and with orientation of shear direction. The strength matrixcmobðm; nÞ mobilized for excavation stage m for layer n can be ex-pressed using a matrix βðm; nÞ on the appropriate undrained shearstrength profile. Regarding orientation, anisotropy of soft soil canbe a significant factor for excavation stability. For example, Cloughand Hansen (1981) show an empirical factor on the basis of theobservation that triaxial extension tests give roughly one-half theundrained shear strength of triaxial compression, with simple shearroughly halfway between. Fig. 4 shows the orientation of the majorprincipal stress direction within the various zones of shearing in theassumed plastic mechanism for wide excavations and indicateswith a code the soil-test configuration that would correctly re-present the undrained shear strength of the specific orientation.For locations marked DSS, the assumed directions of shearingare either vertical or horizontal, so the ideal test on a vertical coreis a direct simple shear test. In areas marked plane-strain active(PSA) and plain-strain passive (PSP), shearing takes place at 45°to the horizontal, and these zones are best represented by plane-strain active and passive tests, respectively. Since the undrainedshear strength of the direct simple shear test is roughly the averageof that of PSA and PSP, the relative influence of the PSA and PSPzones is roughly neutral with respect to direct simple shear. As aresult, the design method for braced excavation can best be madeon the basis of the undrained shear strength of a direct simple sheartest. A similar decision was made by O’Rourke (1993).
The equilibrium of the unbalanced weight of soil inside themechanism is achieved by mobilization of shear strength. For eachexcavation stage, the mobilization of shear strength for each layer isobtained by the following:
cu;mobðm; nÞ ¼ βðm; nÞcuðnÞ ð16Þ
in which cu;mobðm; nÞ = mobilized undrained shear strength forlayer n after excavation stage m; cuðnÞ = undrained shear strengthfor layer n; and βðm; nÞ = mobilized strength ratio for soil layer nafter excavation stage m.
Incremental Energy Balance
By conservation of energy, the total loss of potential energy of thesoil (ΔP) must balance the total work done in shearing the soil(ΔW) and the work done in bending the wall, which (in the absenceof plastic yielding of the wall) will be the total elastic strain energystored within it (ΔU):
ΔP ¼ ΔW þΔU ð17Þ
The potential energy loss on the active side of the wall and thepotential energy gain of soil on the passive side can be calculatedeasily. The net change of gravitational potential energy (ΔP) in themth stage of construction is given by the sum of the potentialenergy changes in each layer:
ΔPm ¼Xni¼1
�Zvolume
γsatðm; iÞdwyðm; iÞdVol�
ð18Þ
in which δwyðm; iÞ = vertical component of displacement of soil inthe ith layer for the mth stage of construction; γsatðm; iÞ = saturatedunit weight of soil in the ith layer for themth construction. The totalchange in potential energy ΔP from the start of excavation is thussimply given by
ΔP ¼XMm¼1
ΔPm ð19Þ
This procedure can obviously be simplified if all soil layers areof equal density.
Because there are no displacement discontinuities, the totalwork done in shearing the soil is given by summing for each layer:
ΔW ¼Xni¼1
�ZVolume
βðm; iÞcuðm; iÞjδγðm; iÞjdVol�
ð20Þ
in which cuðm; iÞ = undrained shear strength of soil in the ith layerfor the mth stage of construction; dγðm; iÞ = shear strain incrementof soil in the ith layer for the mth stage of construction; and thecorresponding mobilized strength ratio is given by
βðm; iÞ ¼ cu;mobðm; iÞcuðm; iÞ
ð21Þ
The total elastic strain energy stored in the wall, ΔU, canbe evaluated by repeatedly updating the deflected shape of thewall. It is necessary to do this since U is a quadratic function ofdisplacement
ΔU ¼ EI2
Zs
0
�d2wx
dy2
�2dx ð22Þ
in which E and I = the elastic modulus and the second moment ofarea per unit width of wall and s = length of the wall in bending,which is taken here to be the unsupported length of wall that canbulge below the lowest prop.
By assuming the cosine waveform equation [Eq. (1)], the strainenergy term can be shown to be as follows:
ΔU ¼ π3EIδw2max
λ3
�πsλþ sinð4πsλ Þ
4
�ð23Þ
in which λ = wavelength of deformation and dwmax = maximumdeflection of the wall in any given excavation increment.
C" D"
E"
H"
I"F"
A"
C'
A' B'
F'
E'H'
I'
A(m,n)
A(m-1,n)
Stiff Stratum
Fig. 6. Overlapping of deformation field
JOURNAL OF GEOTECHNICAL AND GEOENVIRONMENTAL ENGINEERING © ASCE / NOVEMBER 2011 / 1067
Downloaded 20 Mar 2012 to 129.169.242.3. Redistribution subject to ASCE license or copyright. Visit http://www.ascelibrary.org
Calculation Procedure
The following calculation procedure is programmed in Matlabversion 2006b.1. At each stage of excavation, a maximum deformation wmax,
which is bounded by an upper and a lower bound, is assumed.The soil stratum is divided into n layers. The areas on both theactive side and the passive side in each layer are calculated.
2. For each layer, the mobilized shear strain and the change inpotential energy on both active and passive sides in differentzones is calculated with the help of the numerical integrationprocedure in Matlab by using Eq. (18). The total mobilizedshear strain is updated according to Eq. (15).
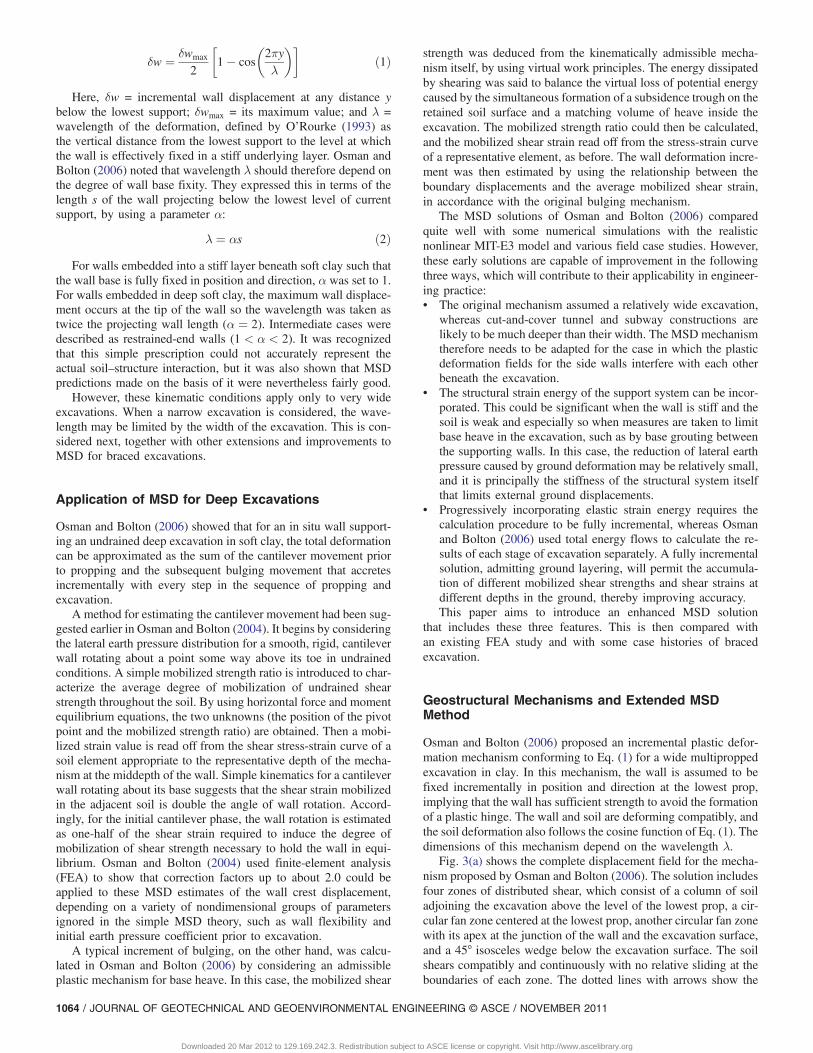
3. With the use of a suitable stress-strain curve (e.g., the simpleshear stress-strain data shown in Fig. 7), the mobilized strengthratio β is found.
4. The total change in potential energy, the work done on the soil,and the elastic bending energy stored in the wall are calculatedby Eqs. (19), (20), and (22), respectively.
5. By considering the conservation of energy of a structure instatic equilibrium, the sum of work in the soil and storedenergy in the wall must balance the total change in potentialenergy. To facilitate solving the solution, an error term isintroduced as follows:
Error ¼ ΔW þΔU �ΔP ð24Þ
6. When the error is smaller than a specified convergence limit,the assumed magnitude of deformation is accepted as the solu-tion; otherwise, the method of bisection is employed to obtainanother trial maximum displacement, and the error term is cal-culated again using steps 1–5.
7. The incremental wall movement profile is then plotted usingthe cosine function of Eq. (1).
8. The cumulative displacement profile is obtained by accumulat-ing the incremental movement profiles.
Comparison with Numerical Analysis
The finite-element method can provide a framework for perfor-ming numerical simulations to validate the extended MSD methodin evaluating the performance of braced excavations. However,finite-element analysis of retaining walls is potentially problematic.One the most challenging problems is choice of a constitutive
model for the soil. A generalized stress-strain relationship canbe very complicated when considering soil stress history andanisotropy (Whittle 1993).
The validation of the extended MSD method is examined bycomparing its predictions with results of comprehensive FE analy-ses of a plane-strain-braced excavation in Boston blue clay (BBC)carried out by Jen (1998). In these analyses, the MIT-E3 constit-utive model is used (Whittle 1987) on the basis of Modified camclay (Roscoe and Burland 1968). However, several modificationshad been made to include small-strain nonlinearity, soil anisotropy,and the hysteretic behavior associated with reversal of load paths.Whittle (1993) also demonstrated the ability of the model to accu-rately represent the behavior of different clays when subjected to avariety of loading paths.
Example of MSD Calculation
The following example shows the extended MSD calculationof wall deflections for a 40-m deep wall retaining clay to a17.5 m depth, creating an 80-m wide excavation with seven levelsof support [Fig. 8(a)]. The construction sequence comprises thefollowing steps:1. The soil is excavated initially to an unsupported depth (h)
of 2.5 m.2. The first support is installed at the ground surface.3. The next level of props is installed at a vertical spacing of
2.5 m, and 2.5 m of soil is excavated.4. Step 3 is repeated up to an excavation depth of 17.5 m.The undrained shear strength of the soil is expressed by the re-
lationship suggested by Hashash and Whittle (1996) for Bostonblue clay as follows:
cu ¼ 0:21½8:19zþ 24:5� kPa ð25ÞThe cantilever mode of deformation and the bulging move-
ments are calculated separately using the mechanism of Osman andBolton (2006) for Step 1 and the extended MSD method as de-scribed above for the succeeding steps. The total wall movementsare then obtained by adding the bulging movements to the canti-lever movement following Clough et al. (1989).
Cantilever Movement
By solving for horizontal force equilibrium and moment equilib-rium at the top of the wall, the average mobilized shear stress(cmob) is found to be 11.4 kPa. The mobilized strength ratio β is0.29. The mobilized strain is then read off from the direct simpleshear stress-strain data of Fig. 7, by using an appropriate precon-solidation pressure σ0
p and an appropriate OCR. The mobilizedshear strain (γmob) is thereby found to be 0.2%. The correspondingwall rotation is therefore found to be 0.1%, giving a displacementof 39 mm at the top of the wall.
Bulging Movements
The first support is installed at the top of the wall. The length of thewall below the support is 40 m. By adopting an iterative calculationprocedure and by using the deformation mechanism for a narrowexcavation, the magnitude of bulging movement at each stage ofexcavation can be obtained. Then the incremental bulging move-ment profile in each stage is plotted by using the cosine functionon the basis of the corresponding wavelength, which reduces aseach level of props is placed. The total wall movement is obtainedby superimposing the cantilever movement with all of the bulgingmovements for the successive stages of excavation. Fig. 8(a) showsthe accumulated deformation profiles of the wall. In general, MSDpredicted deeper maximum bulging displacements than the FEA of
log γ,%0.001 0.01 0.1 1 10
τ/σ '
p
0.00
0.05
0.10
0.15
0.20
0.25OCR =1OCR = 2OCR = 4OCR = 8
Fig. 7. Stress-strain response for Ko-consolidated undrained DSS testson Boston blue clay (after Whittle 1993)
1068 / JOURNAL OF GEOTECHNICAL AND GEOENVIRONMENTAL ENGINEERING © ASCE / NOVEMBER 2011
Downloaded 20 Mar 2012 to 129.169.242.3. Redistribution subject to ASCE license or copyright. Visit http://www.ascelibrary.org

Jen (1998). The maximum wall deflection predicted by MSD for anexcavation depth of 17.5 m is 115 mm, which corresponds to0.66% of the excavation depth. This underestimates the FEA bya factor of 1.2.
The final displacement profiles of ground settlement areobtained by summing up the incremental settlements in each stageof excavation and are given in Fig. 8(b). The maximum groundsettlement predicted by MSD is 117 mm, which overpredicts theFEA by a factor of 1.3. Both the predicted and computed settlementtroughs offer maximum settlements at 20 m (about 1.14 H) behindthe diaphragm wall. The MSD prediction of base heave at differentstages of excavation is compared with computed results in Fig. 8(c).The maximum base heave predicted by MSD is 64 mm, whichoverpredicts FEA by a factor of 1.1. To sum up, the maximumground movements predicted by MSD fall within 30% of the FEAcomputation of Jen (1998).
Fig. 8(d) shows comparisons of the bending moments in theretaining wall obtained from FEA and those derived from MSDby using a simple finite-difference method. Despite the fact thatthe position of the MSD-predicted maximum bending momentoccurs at a deeper level, the magnitude of the maximum bendingmoment compares very well with the computed result. A designenvelope for bending moment is proposed on the basis of MSDpredictions and accounting for the changes in profile as excavation
proceeds. This gives the designer of a concrete diaphragm wall anapparently successful approximate criterion for the design of steel-reinforcement cages necessary for the prevention of plastic hinges.
The least successful aspect of the comparisons in Fig. 8 is theextent of the settlement trough on the retained soil surface. MSDstrongly underestimates FEA settlement computations for separa-tions 2H < x < 4H. In offering a settlement trough of 50 m width,compared to about 80 m from FEA, MSD may be conservativelyoverpredicting ground curvatures in hogging, perhaps by a factor ofup to 2. Such curvatures are used to assess the serviceability ofexisting structures or services adjacent to deep excavations. Apartfrom recognizing that MSD apparently errs on the safe side, weshould recall that FEA generally predicts settlement troughs thatare shallower and wider than those found in the field.
Database of Movements Caused by DeepExcavation in Soft Soil
The MSD procedure for estimating ground deformations in plane-strain caused by deep, undrained excavations is capable of account-ing for factors such as ground stratification, soil nonlinearity, wallstiffness, and boundary conditions, which should be known at thedesign stage. Other factors, such as three-dimensional (3D) effectsand the onset of consolidation and swelling, would require more
Distance behind wall (m)20 40 60 80 100
Sur
face
set
tlem
ent (
m)
0.00
0.05
0.10
0.15
0.20
0.25
Wall Deflection (m)
0.000.050.100.15
Dep
th (
m)
0
10
20
30
40
50
Predicted H=2.5mPredicted H=5.0mPredicted H=7.5mPredicted H=10.0mPredicted H=12.5mPredicted H=15.0mPredicted H=17.5mComputed H=2.5mComputed H=5.0mComputed H=7.5m Computed H=10.0mComputed H=12.5mComputed H=15.0mComputed H=17.5m
Bending Moment (kNm)
Dep
th (
m)
0
10
20
30
40
z=22.5m
Distance in front of wall (m)
-2000 -1000 0 1000 2000 30000 20 40 60
Hea
ve (
m)
0.00
0.10
0.20
0.30
0.40
0.50
Proposed design envelope
(a) (b)
(c) (d)
H
2h
Fig. 8. Comparison of wall performance as predicted by MSD and as computed by FEA by Jen (1998; with permission from Massachusetts Instituteof Technology)
JOURNAL OF GEOTECHNICAL AND GEOENVIRONMENTAL ENGINEERING © ASCE / NOVEMBER 2011 / 1069
Downloaded 20 Mar 2012 to 129.169.242.3. Redistribution subject to ASCE license or copyright. Visit http://www.ascelibrary.org
complete numerical analyses. And design uncertainties, such as theactual construction sequence in space and time and the workman-ship involved in fixing struts, will only emerge during construction.
With the aim of gaining a better understanding of the predict-ability of actual ground deformations induced by deep excavations,a database of 155 international case histories was collected, each ofwhich has been published in geotechnical journals, internationalconference proceedings, national technical reports, or dissertations.The main focus of these cases was on the deformation of walls sup-porting deep excavations in soft to firm clays (i.e., cu < 75 kPa).For each case history, relevant information was extracted andanalyzed, and major factors, such as soil properties, groundwaterconditions, excavation geometry, stiffness of structural support sys-tem, construction method, and ground deformation responses, wereconsidered. The details of each of these excavation case histories,together with the source references from which they were derived,can be found in Lam (2010).
Traditional Interpretation of Field Data
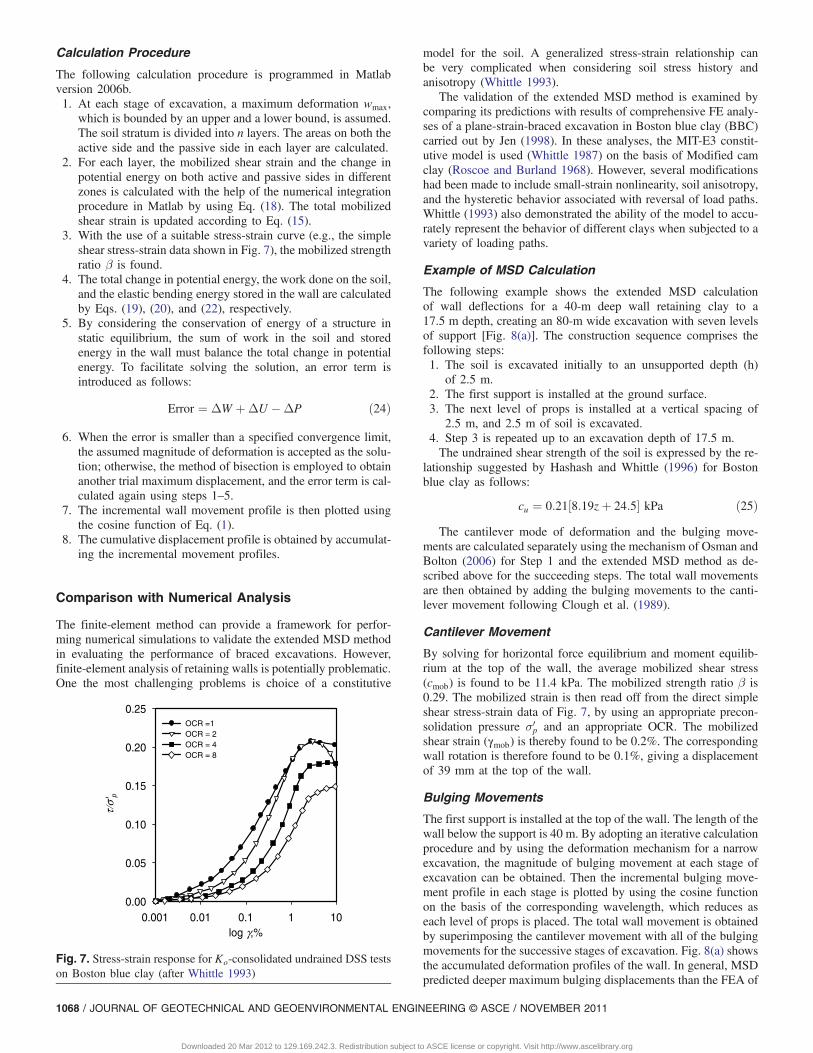
This section uses the new database to demonstrate the rather limitedefficacy of current ways of presenting wall deformation data. InFig. 9, the maximum horizontal wall displacement wmax is plottedagainst the excavation depth H with different icons used for differ-ent structural support systems. The values of maximum horizontaldisplacement scatter over a very wide range, showing that there isno simple linear relationship between horizontal wall displacementand excavation depth even for a specific wall type. For 55% of thecases, most of which are supported by diaphragm walls, the maxi-mum displacement wmax is less than 0.5% H, whereas 26% of thecases show maximum displacements lying between 0.5% H and1% H. Only in 19% of the cases, which always involve sheet piledexcavations, are the maximum wall displacements greater than 1%H. Other plots are required to better understand the scatter.
Mana and Clough (1981) plotted the normalized maximumhorizontal displacement wmax=H against a factor of safety againstbase heave (FOS) defined by Terzaghi (1943); this is shown for thenew database in Fig. 10. Fig. 10 also shows the limits suggested byMana and Clough for cases of excavation in soft soil supported bysheet pile walls. In general, the normalized horizontal displacementof walls from the new database decreases with increasing FOS asexpected. Although the majority of the cases fall within the sug-gested limits, the measured wall movements for a typical FOS ¼1:5 scatter between wmax=H ¼ 0:2% and 2.8%, demonstrating thatthere is no simple dependence of normalized wall movement withthe FOS based on the soil strength alone. The traditional calculationof FOS does not account for governing factors such as soil stiffnessand the structural stiffness of the support system.
Fig. 11 shows the normalized maximum horizontal walldisplacement versus the system stiffness (η) as defined by Cloughet al. (1989):
η ¼ EIλwh4
ð26Þ
in which EI = flexural stiffness of the wall, h = representativevertical spacing between supports, and γw = unit weight of water.Again, the field data scatter over a wide range, although the generaltrends of a decrease in displacement with increasing system stiff-ness and soil FOS are those suggested by Clough et al. (1989).Nevertheless, a calculated safety factor of about 1 could lead toan observed maximum wall displacement wmax=H as low as0.1%, though the value expected by Clough et al. was about 1%for even the stiffest support system. Similar observations weremade with other databases by Moorman (2004) and Long (2001).
Excavation Depth (m)0 5 10 15 20 25 30
Max
. Hor
iz. W
all D
ispl
acem
ent,
wm
ax(m
m)
0
100
200
300
400 Diaphragm wallAnchored wallSheet pile wallSlurry wallContiguous pile wall
w max / H = 1%
w max / H = 0.5%
Fig. 9. Normalized horizontal wall displacement with different supportsystems
FOS against base heave
0 1 2 3 4
wm
ax/ H
(%
)
0.0
0.5
1.0
1.5
2.0
2.5
3.0Anchored wallContinguous pile wallDiaphragm wallSecant pile wallSheet pile wallSlurry wall
Limit Suggested by Mana & Clough
Fig. 10.Variation of normalized horizontal wall displacement (adaptedfrom Mana and Clough 1981, ASCE)
1 10 100 1000 100000.0
0.5
1.0
1.5
2.0FS<=11<FS<=1.41.4< FS<=22<FS<=3FS>3
FS=1.0
FS=0.9
FS=1.1
FS=1.4
FS=2.0
FS=3.0
System Stiffness, EI/(γwh4)
wm
ax /
H (
%)
Fig. 11. Variation of maximum horizontal wall displacement withsystem stiffness and factor of safety against base heave, followingClough et al. (1989, ASCE)
1070 / JOURNAL OF GEOTECHNICAL AND GEOENVIRONMENTAL ENGINEERING © ASCE / NOVEMBER 2011
Downloaded 20 Mar 2012 to 129.169.242.3. Redistribution subject to ASCE license or copyright. Visit http://www.ascelibrary.org

Apparently, the factor of safety against base heave is not an idealmeasure to quantify ground movements caused by deep excavationeven when the wall stiffness is accounted for. Soil stiffness is also asignificant parameter, as subsequently described.
Performance of MSD Method in EstimatingDeformations around Deep Excavations
A total of 110 out of 155 case histories, from nine cities worldwide,were fully documented so that an analysis could be conducted withthe incremental form of the MSD method, taking careful consid-eration of ground stratification, system stiffness and prop spacing,and excavation geometry, including excavation depth and breadth,depth to stiff layer, undrained shear strength profile, and soilstiffness.
Fig. 12 shows the degree of mobilization β of shear strengthversus strain in tests reported for the nine soils concerned. Theexcavation case-specific information from the database was useddirectly in MSD to predict maximum wall displacements for eachstage of excavation, which are compared with writers’ reportedobservations in Fig. 13. Results show a correlation coefficientR2 ¼ 0:83 around the line 1∶1 with a coefficient of variation of0.24. More than 90% of the MSD predictions, typically for each
of four excavation levels, fell within 30% of the correspondingobservations. Considering the lack of any detailed account ofsoil anisotropy, the field performance of MSD is evidently quitesatisfactory.
Simplified Relationship between Wall Deflectionsand Mobilization of Soil Strength
Following the logic of MSD, a simplified but sound way ofanalyzing data from the whole database can now be introduced.According to the requirement of soil-structure compatibility andthe kinematics of mechanisms involved in deep excavations asshown in Fig. 3, the wall deflection wmax can be related to the aver-age shear strain γave in the adjacent soil mass by the following:
wmax ≈ λγave=2 ð27Þ
in which λ = typical wavelength that defines the size of the zone ofdeformation. For the field case studies, which were all on excava-tions with fixed-based walls, the wavelength is always limited bythe depth of the soft clay stratum. In other words, it is defined at anystage as the distance between the lowest prop level and the base ofthe clay stratum. Because of the incremental nature of a multipropexcavation, the average wavelength can be taken as
λave ≈ C � ðH � hÞ=2 ð28Þ
in which C and H = depth of clay stratum and ultimate excavationdepth, respectively, and h = vertical prop spacing.
The second element of MSD is to relate the shear strain to themobilization of soil strength by considering the shear stress-strainproperties of representative soils. A mobilization factor was definedin the UK Code of Practice on Earth Retaining Structures (BS 80021994) as follows:
M ¼ cucmob
¼ 1β
ð29Þ
The degree of strength mobilization is controlled by shear strainthrough the stress-strain relation.
Shearing within the retained soil mass is characterized by prin-cipal stress rotation and is best approximated by data from directsimple shear tests. The use of undrained direct simple shear tests iswell developed for geotechnical engineering design in soft groundconstruction (e.g., Ladd and Foott 1974). Fig. 12 summarizes themobilized shear strength ratio (β) obtained mainly from undraineddirect simple shear (DSS) tests on a variety of soft clays worldwide.For β < 0:8, these clays are well described by a parabolic relation:
γγu
¼�cmob
cu
�2¼
�1M
�2
for β < 0:8; i:e:; M ≥ 1:25 ð30Þ
in which γu = reference strain obtained by extrapolating approxi-mately parabolic small-strain data to intersect the peak strengthasymptote. These curves, superimposed on the data in Fig. 12, tendto fall within a range of γu from 1% to 5%. For very soft andhigh plasticity clays like Oslo clay, the reference strain value canbe larger than 5%, whereas the shear strength of firm and low-plasticity Boston blue clay is mobilized at a smaller reference strainof about 1%. When the reference strain is used to normalize thesmall-strain power-law stiffness of soil, a simple relation can beobtained from Eqs. (27)–(30) to define a normalized displacementfactor ψ for deep excavations as follows:
Shear Strain, γ (%)0 1 2 3 4 5 6 7 8 9 10M
obili
zatio
n of
Und
rain
ed s
hear
str
engt
h, β
0.0
0.2
0.4
0.6
0.8
1.0
1.2
Mexico City Clay (Diaz-Rodriguez et al.,1992)Bangkok Clay (MOH et al., 1969)Oslo Clay (Bjerrum and Landva, 1966)Boston Blue Clay (Whittle, 1993)San Francisco Bay Mud (Hunt et al., 2002) Chicago Glacial clay (Finno and Chung, 1990)Shanghai Clay (X.F.Ma,Person. com., Feb 2009)Taipei Silty Clay (Lin and Wang,1998). Singapore marine clay (Wong and Brom, 1989)
γu=1.0% γu=3.0% γu=5.0%
Fig. 12. Stress-strain relationship of soft clays worldwide
Measured wmax,m
0 50 100 150 200
Pre
dict
ed w
max
,p
0
50
100
150
200
wmax,m
/wmax,p =1
wmax,m/wmax,p=0.7
wmax,m /wmax,p=1.4
R2=0.91COV=0.25
Fig. 13. Comparing measured lateral wall displacements with MSDpredictions
JOURNAL OF GEOTECHNICAL AND GEOENVIRONMENTAL ENGINEERING © ASCE / NOVEMBER 2011 / 1071
Downloaded 20 Mar 2012 to 129.169.242.3. Redistribution subject to ASCE license or copyright. Visit http://www.ascelibrary.org

ψ ¼ 2wmax
λaveγu¼ 2wmax
½C � ðH � hÞ=2�γuð31Þ
The approximate parabolic fitting, for β ≤ 0:8 (M ≥ 1:25) inFig. 12 permits a further prediction:
ψ ¼�1M
�2
for β < 0:8; i:e:; M ≥ 1:25 ð32Þ
The records of field displacements from the database permit thedirect calculation of displacement factor ψ from Eq. (31), where thecharacteristic shear strain γu is known. We might expect that ψ willvary between 0 and 1 and that it will decrease as the stiffness of thesupport system increases. The newly extended MSD theory enablesa prediction to be made of the variation of ψ with the system stiff-ness (η ¼ EI=γwh4) as defined by Eq. (26). An MSD chart of ψversus η, for various values of the ratio (H=C) of excavation depthto the depth of fixity in the stiff layer, calculated for a typical softclay strength profile and a stress-strain curve with γu ¼ 3%, isgiven in Fig. 14(a). Although the present analysis does not considerother factors such as consolidation effects, corner effects, andworkmanship, the MSD trend lines are broadly consistent withthe field data. However, it should be noted that when the parabolicstress-strain approximation leads to calculated values of ψ in excessof 0.64, the field measurements can significantly exceed the MSDprediction [see the square icons lying above the uppermost MSDprediction in Fig. 14(a)]. Fig. 14(b) repeats the MSD prediction ofψ versus η, but for selected values of γu ¼ 1%, 3% and 5% for theparticular excavation geometry. γu is embodied in the definition ofψ itself, through Eq. (31). Accordingly, although γu is found inFig. 14 not to influence very strongly the predicted displacementfactor ψ, at least for flexible walls (η ≤ 102), the predicted wall dis-placement remains proportional to γu through Eq. (31).
As mentioned previously, a warning is included in Fig. 14against using the simple parabolic prediction of displacement factorψ in the case of ψMSD > 0:64, corresponding to M < 1:25 orβ > 0:8. For these very large mobilizations of strength, the strainsmeasured in the soil tests, reported in Fig. 12, invariably exceededthe parabolic fitting to small-strain data. So Eq. (32) will probablyunderestimate field deformations. For a typical excavation intypical soft clay with γu ¼ 3%, the limitation ψMSD ¼ 0:64 corre-sponds to limiting wmax=H ≈ 1%, which would already be exces-sive if there were any structures or services within the zone ofinfluence. Furthermore, the adoption of a mobilization factor(or factor of safety) below 1.25 would often be considered unwise,especially considering the possibility of adhesion on the retainingwall being smaller that the soil strength cu and of its droppingfurther as a result of soil sensitivity. Even this degree of cautionleaves the engineer free to accept a greater wall deformation ofwmax=H ≈ 1:5% in more compliant soils (γu ≈ 5%). The rationalselection of a mobilization/safety factor with respect to separatesafety and displacement criteria is a particular opportunity affordedby the MSD approach.
If an engineer wants to design a structure to support an exca-vation with a specified excavation geometry in soil with a stress-strain curve that can be estimated and if the permissible walldeflection is specified, the equivalent normalized displacementfactor ψ can be deduced. The required system stiffness can thenbe read off from the trend lines in Fig. 14(b). For instance, to designa 20-m deep excavation in a 30-m-thick very soft soil with a refer-ence strain γu of 3% and a maximum permissible lateral wall move-ment of 100 mm, simple calculations [Eq. (31)] tell the engineerthat the displacement factor ψ should be about 0.33. From thedesign trend line, a support system with a system stiffness η of
about 1,170 is recommended; this could correspond to a 0.8-m-thick diaphragm wall with a support spacing of about 3 m (givingη≈ 1; 230).
Although this simplified approach can apparently provideapproximate but reasonably robust answers to key design questionsand do so simply by inspection of a chart, there is no particularjustification for the use of system stiffness parameter η beyond thatoriginally given by Clough et al. (1989). Further refinement of thedifferent influences of prop spacing and wall flexural stiffnessshould ultimately be possible. Nevertheless, the opportunity to in-clude strain to failure γu in simple wall movement predictionsshould lead engineers to consider soil stiffness as a key factorin the design of deep excavations and to request stress-strain dataaccordingly.
Conclusions
This paper introduces an improved MSD method to calculate thedisplacement profile of a multipropped wall retaining an excavationin soft clay, which is taken to involve undrained soil behavior dur-ing construction. As with the earlier MSD approach, each incre-ment of wall bulging, generated by excavation of soil beneaththe current lowest level of support, is approximated by a cosinefunction. The soil is divided into layers in which the average shearstrain increments are compounded so that the mobilized strengthratio in each layer can be tracked separately as excavation proceedsby using normalized stress-strain data from DSS tests matched tothe soil properties at the middepth of each layer. The incrementalloss in potential energy associated with the formation of a settle-ment trough, a result of wall deformation and base heave, can beexpressed as a function of those ground movements at any stage.By conservation of energy, this must always balance the sum of
System Stiffness, η =EI/(γwh4)
100 101 102 103 104
Dis
plac
emen
t fac
tor
ψ
0.0
0.2
0.4
0.6
0.8
1.0
1.2
1.4
1.6
1.8Database, 0<H/C<0.33Database, 0.33<H/C<0.66Database, 0.66<H/C<1.0MSD prediction,γu =3%
System Stiffness, η =EI/(γwh4)
100 101 102 103 104
Dis
plac
emen
t fac
tor
ψ
0.0
0.2
0.4
0.6
0.8
1.0
1.2
1.4
1.6
1.8MSD predction ,γu =5%
MSD prediction,γu =3%
MSD prediction, γu =1%
H/C=1.00
H/C=0.66
H/C=0.33
H/C=1.00
H/C=0.66
H/C=0.33
(a)
(b)
ψ may exceed MSD guideline for ψ> 0.64
Fig. 14. Variation of displacement factor ψ with system stiffnessdefined by Clough (1989): (a) data and MSD prediction forγu ¼ 3%; (b) MSD prediction for γu ¼ 1%, 3%, and 5%
1072 / JOURNAL OF GEOTECHNICAL AND GEOENVIRONMENTAL ENGINEERING © ASCE / NOVEMBER 2011
Downloaded 20 Mar 2012 to 129.169.242.3. Redistribution subject to ASCE license or copyright. Visit http://www.ascelibrary.org

incremental work done in shearing the soil and the incrementalstorage of elastic strain energy in bending the wall. By using aniterative procedure, the developing profile of wall displacementscan be found.
A reasonable agreement is found between predictions made ofwall displacements, ground settlements, base heave, and bendingmoments by using this extended MSD method and the FEA resultsof Jen (1998), who created full numerical solutions by using theMIT-E3 soil model. Although there were some discrepancies inthe precise location of the point of maximum bulges, the shapeof the wall profile was broadly correct, and the magnitude ofthe maximum displacement was 20% underpredicted by MSDcompared with the FEA values. The magnitude of maximum set-tlement was 30% overpredicted by MSD compared with FEA,which also gave a characteristically wider settlement trough. Maxi-mum wall bending moments produced by MSD corresponded quiteclosely to FEA computations, although the computed location ofthe maximum value was significantly higher. Nevertheless, it isproposed that a relatively straightforward MSD analysis, whichcould be performed within an hour or two by a design engineer,could be a useful tool in making key design decisions, even if itserves as a precursor to more elaborate FEA.
In order to assess the capability of MSD to produce useful walldisplacement predictions in actual field conditions, a new databasehas been created of 155 case histories of walls that could be takento be fixed in a hard layer at their toe but otherwise were retainingsoft to firm clays. This is a much larger database than has previ-ously been collected. It was shown for 110 well-documented fieldstudies that incremental MSD analyses were capable of makingpredictions of maximum wall movement in 90% of these caseswithin 30% of the actual field values.
Since MSD is semianalytical, it could also be used to gen-erate a more rational normalization of maximum excavation-induced wall displacement, by using the parameter ψ ¼ 2wmax=½C � ðH � hÞ=2�γu. This normalization recognizes that if all detailsof excavation geometry, wall stiffness, and support remain thesame, wmax should be proportional to the size of the ground defor-mation mechanism induced by the various stages of excavation andalso proportional to the characteristic soil strain γu defined by theintersection of the small-strain nonlinear stress-strain curve ex-tended to meet the peak strength asymptote. This newly definedcharacteristic soil shear strain γu is a promising index parameterthat might be taken to lie between 1% for firm, low-plasticity claysand 5% for soft, high-plasticity clays. Further work offering stat-istical correlations for γu in terms of basic soil properties would beuseful.
A new chart of ψ versus normalized system stiffness η ¼EI=γwh4 was used to demonstrate that MSD could correctly cap-ture the trend of wall displacements increasing with the ratio(H=C) of excavation depth to the depth of fixity in the stiff baselayer. Further work needs to be done to refine the separate effects ofψ reducing with reduced prop spacing h and with increased wallstiffness EI.
Acknowledgments
The writers would like to acknowledge the Platform Grant (GR/T18660/01) awarded by the UK Engineering and Physical SciencesResearch Council. We were alerted to the extensive field recordsof excavations in Shanghai through a presentation by Dr. Xu ofEastern China Architectural Design and Research Institute (ECA-DI) at an Engineering and Physical Science Research Council(EPSRC) UK–China GEONET meeting in Ningbo in September
2008. We are grateful to Dr. Xianfeng Ma for help in translatingkey terms in Dr. Xu’s Ph.D. thesis.
Notation
The following symbols are used in this paper:A = area of deformation mechanism;B = breadth of excavation;C = depth of soft soil stratum;cu = undrained shear strength;
cu;mob = mobilized undrained shear strength;Et = tangential elastic modulus;EI = bending stiffness of retaining wall;
FOS = factor of safety against base heave;H = excavation depth;h = prop spacing;K = system stiffness;L = length of retaining wall;
OCR = overconsolidation ratio;t = wall thickness;s = unsupported length of the wall;w = gravimetric water content;
wmax = maximum later wall displacement;z = depth below ground surface.β = mobilized strength ratio;γ = total shear strain;λ = wavelength of deformation;
γave = average mobilized shear strain;γmob = mobilized shear strain;γsat = saturated unit weight;γu = reference strain;
ΔD = energy dissipation as a result of plastic shearing;ΔP = loss of potential energy;ΔU = elastic strain energy;δw = incremental lateral wall displacement;
δwmax = maximum incremental lateral wall displacement;δγ = incremental shear strain;ε1 = major principle strain;σ1 = major principle stress;σ3 = minor principle stress; andσ0p = preconsolidation pressure.
References
Bjerrum, L., and Eide, O. (1956). “Stability of strutted excavations in clay.”Geotechnique, 6, 115–128.
Bolton, M. D., Lam, S. Y., and Osman, A. S. (2009). “Geotechnicalaspects of underground construction in soft ground.” Proc., 6th Int.Symp., CRC Press, London, 15–28.
Bolton, M. D., and Powrie, W. (1987). “Behaviour of diaphragmwalls retaining walls prior to collapse.” Geotechnique, 37(3),335–353.
Bolton, M. D., Powrie, W., and Symons, I. F. (1989). “The design of stiffin-situ walls retaining overconsolidated clay part.” Ground Eng., 22(8),44–48.
Bolton, M. D., Powrie, W., and Symons, I. F. (1990a). “The design ofstiff in-situ walls retaining over-consolidated clay. Part 1: Short termbehaviour.” Ground Eng., 22(9), 34–39.
Bolton, M. D., Powrie, W., and Symons, I. F. (1990b). “The design ofstiff in-situ walls retaining over-consolidated clay. Part II: Long termbehaviour.” Ground Eng., 23(2), 22–28.
BSI 8002. (1994). “Code of practice for earth retaining structures.” BritishStandards Institution, London.
Clough, G. W., and Hansen, L. A. (1981). “Clay anisotropy and braced wallbehavior.” J. Geotech. Eng., 107(7), 893–913.
JOURNAL OF GEOTECHNICAL AND GEOENVIRONMENTAL ENGINEERING © ASCE / NOVEMBER 2011 / 1073
Downloaded 20 Mar 2012 to 129.169.242.3. Redistribution subject to ASCE license or copyright. Visit http://www.ascelibrary.org

Clough, G. W., Smith, E. W., and Sweeney, B. P. (1989). “Movementcontrol of excavation support system by iterative design.” Foundationengineering current principles and practices, ASCE, New York, 2,869–882.
Eide, O., Aas, G., and Josang, T. (1972). “Special application of cast-in-place walls for tunnels in soft clay.” Proc., 5th European Conf.on Soil Mechanics and Foundation Engineering, Madrid, Spain, 1,485–498.
Hashash, Y. M. A., and Whittle, A. J. (1996). “Ground movement predic-tion for deep excavations in soft clay.” J. Geotech. Eng., 122(6),474–486.
Jen, L. C. (1998). “The design and performance of deep excavationsin clay.” Ph.D. thesis, Dept. of Civil and Environmental Engineering,Massachusetts Inst. of Technology, Cambridge, MA.
Klar, A., and Osman, A. S. (2008). “Load-displacement solutions forpile and shallow foundations abased on deformation fields and energyconservation.” Geotechnique, 58(7), 581–589.
Ladd, C. C., and Foott, R. (1974). “New design procedure for stability ofsoft clays.” J. Geotech. Engrg. Div., 100(GT7), 763–786.
Lam, S. Y. (2010). “Ground movements due to excavation in clay:physical and analytical models.” Ph.D. thesis, Cambridge Univ.,Cambridge, UK.
Long, M. (2001). “Database for retaining wall and ground movements dueto deep excavations.” J. Geotech. Geoenviron. Eng., 127(3), March,2001, 203–224.
Mana, A. I., and Clough, G. W. (1981). “Prediction of movements forbraced cut in clay.” J. Geotech. Engrg. Div., 107(6), 759–777.
Milligan, G. W. E., and Bransby, P. L. (1976). “Combined active andpassive rotational failure of a retaining wall in sand.” Geotechnique,26(3), 473–494.
Moormann, C. (2004). “Analysis of wall and ground movements due todeep excavations in soft soil based on a new worldwide database.” SoilsFound., 44(1), 87–98.
O’Rourke, T. D. (1993). “Base stability and ground movement prediction
for excavations in soft clay.” Retaining structures, Thomas Telford,London, 131–139.
Osman, A. S., and Bolton, M. D. (2004). “A new design method for retain-ing walls in clay.” Can. Geotech. J., 41(3), 451–466.
Osman, A. S., and Bolton, M. D. (2005). “Simple plasticity-based predic-tion of the undrained settlement of shallow circular foundations onclay.” Geotechnique, 55(6), 435–447.
Osman, A. S., and Bolton, M. D. (2006). “Ground movement predictionsfor braced excavations in undrained clay.” J. Geotech. Geoenviron.Eng., 132(4), 465–477.
Osman, A. S., Bolton, M. D., and Mair, R. J. (2006). “Predicting 2D groundmovements around tunnels in undrained clay.” Geotechnique, 56(9),597–604.
Roscoe, K. H., and Burland, J. B. (1968). “On the generalized stress-strain behaviour of ‘wet’ clay.” Engineering plasticity, J. Heyman andF. A. Leckie, eds., Cambridge University Press, Cambridge, UK.
Skempton, A. W. (1951). “The bearing capacity of clays.” Proc., BuildingResearch Congress, London, 180–189.
Sloan, S. W. (1988). “Lower bound limit analysis using finite elements andlinear programming.” Int. J. Numer. Anal. Methods Geomech., 12(1),61–77.
Sloan, S. W., and Kleeman, P. W. (1995). “Upper bound limit analysis usingdiscontinuous velocity fields.” Comput. Methods Appl. Mech. Eng.,127, 293–314.
Terzaghi, K. (1943). Theoretical soil mechanics, Wiley, New York.Ukritchon, B., Whittle, A. J., and Sloan, S. W.(2003). “Undrained stability
of braced excavations in clay.” J. Geotech. Geoenviron. Eng., 129(8),738–755.
Whittle, A. J. (1987). “A constitutive model for overconsolidated clayswith application to the cyclic loading of friction piles.” Ph.D. thesis,Dept. of Civil and Environmental Engineering, Massachusetts Inst. ofTechnology, Cambridge, MA.
Whittle, A. J. (1993). “Evaluation of a constitutive model for overconso-lidated clays.” Geotechnique, 43(2), 289–313.
1074 / JOURNAL OF GEOTECHNICAL AND GEOENVIRONMENTAL ENGINEERING © ASCE / NOVEMBER 2011
Downloaded 20 Mar 2012 to 129.169.242.3. Redistribution subject to ASCE license or copyright. Visit http://www.ascelibrary.org