energy, water, cost, and greenhouse gas implications · pdf file ·...
TRANSCRIPT

SHORT TECHNICAL NOTE
Energy, Water, Cost, and Greenhouse Gas Implicationsof Steam-Assisted Gravity Drainage Surface Facility Technologies
Zainab Dadashi Forshomi1 & Carlos E. Carreon1& Alberto Alva-Argaez2 &
Joule A. Bergerson1
Received: 23 February 2017 /Revised: 17 April 2017 /Accepted: 13 May 2017 /Published online: 31 May 2017# Springer Science+Business Media Singapore 2017
Abstract This analysis explores the implications of tech-nology options for steam-assisted gravity drainage(SAGD) surface facilities on cost, energy, greenhousegas (GHG) emissions, and water consumption. Water in-tegration in the form of distributed effluent treatment sys-tem design as well as heat integration considerations arethe basis of this study. Cost savings are accomplished bysequentially employing water network optimization andenergy integration techniques. Total annual cost savingsof 2.7 to 7.8% are achieved at the surface facility throughwater integration. Additional operating cost savings of9.2–10.2% are found due to heat integration. Of the tech-nology options considered in this study, hot lime soften-ing (HLS) with blowdown evaporation and hot lime soft-ening with blowdown recycle are the most promisingwhen considering the tradeoffs between energy, green-house gas emissions, and water consumption. However,these options are quite different (i.e., blowdown evapora-tion has lower water consumption but higher greenhousegas emissions than blowdown recycle, whereas blowdownrecycle has lower greenhouse gas emissions but higherwater consumption than blowdown evaporation).Deciding between these options requires placing a valueon these environmental externalities. The approach
described in this work can be applied to inform decisionsin the face of tradeoffs between a range of performancemetrics. In addition, the analysis framework described inthis paper can be adapted to consider new technologypathways as they become available.
Keywords Process integration .Water integration . Heatintegration . Pinch analysis . Steam-assisted gravity drainage .
Bitumen production
AbbreviationsBAU Business as usualBFD Block flow diagramBFW Boiler feed waterCC Capital cost, composite curveCPF Central processing facilityDO Dissolved oxygenFWKO Free water knockoutGHG Greenhouse gasHEN Heat exchanger networkHLS Hot lime softeningHP High pressureIGF Induced gas flotationMP Mathematical programmingNG Natural gasOC Operating costORF Oil removal filterOTSG Once-through steam generatorPA Pinch analysisPI Process integrationSAGD Steam-assisted gravity drainageTDS Total dissolved solidsTH Total hardnessTOC Total organic carbon
Electronic supplementary material The online version of this article(doi:10.1007/s41660-017-0007-0) contains supplementary material,which is available to authorized users.
* Joule A. [email protected]
1 Chemical and Petroleum Engineering, Schulich School ofEngineering, University of Calgary, Calgary, Alberta, Canada
2 Process Ecology Inc., Calgary, Alberta, Canada
Process Integr Optim Sustain (2017) 1:87–107DOI 10.1007/s41660-017-0007-0

TSS Total suspended solidsWAC weak acid cation exchangerWN Water network
Introduction
Bitumen production from the Canadian oil sands resource wasreported as 2.2 million bpd in 2014 (CAPP 2015). Althoughthe recent increase in global crude oil production has led todecreased oil prices and has challenged the Canadian crude oilindustry, total oil sands bitumen production continues to growalbeit at a lower rate (CAPP 2015).
The energy intensity of the oil sands extraction process hasraised concerns over the associated environmental impacts,including greenhouse gas (GHG) emissions which tend to behigher when compared to conventional oil production(Charpentier et al. 2011). As such, oil sands operators areseeking new technologies and improving current techniquesto reduce these environmental impacts. New technologies andimprovements such as carbon capture and low emissions elec-tricity are promising long-term solutions. However, near termimprovements are also required.
The most prominent in situ oil sands recovery process issteam-assisted gravity drainage (SAGD) that requires the gen-eration of significant volumes of high-pressure (7000–11,000 kPa) steam. The focus of this study is the assessmentof short-term incremental improvements in the efficiency of theSAGD process using water and heat integration techniques. InSAGD, the steam is injected into the reservoir through an in-jection well, which heats the bitumen and reduces its viscosityallowing the resource to flow. The resulting bitumen emulsion(a mixture of oil, water, sand, and clay minerals) is pumped tothe surface through the production well and enters the centralprocessing facility (CPF) (Butler 2001; Gwak and Bae 2010).The SAGD CPF consists of oil/water separation units, watertreatment units, and steam generation in addition to storageunits, pipelines, gas treatment units, oil treatment units, andother utilities. Water and oil are first separated in the CPF.The separated oil is sent to upgrading facilities or is dilutedand transported to refineries for further processing. The pro-duced water is treated in a set of water treatment units to reachthe quality requirements for recycle and reuse in the steam-generating boiler (Halari et al. 2011).
Process integration techniques have been used to studyprocess design, remove inefficiencies, and investigate poten-tial improvements in a wide range of industrial processes.Mathematical programming (MP) and pinch analysis (PA)are process integration techniques to improve energy efficien-cy and minimize water and raw material consumption of asystem. These techniques can be used to improve the heatrecovery in SAGD facilities, minimize external cooling andheating requirements, and minimize energy consumption for
water treatment. This paper makes contributions to decision-making techniques within the industry by providing a broadset of insights on available technology options in the oil sandsindustry.
Literature Review
Pinch analysis has been shown to provide benefits in indus-tries such as pulp and paper, petrochemical, power generation,and chemicals (Klemeš et al. 2013; Klemeš and Kravanja2013). However, the application of pinch analysis to the oilsands industry has not gained much attention to date and thereare only a few studies (Carreon et al. 2015; Nadella 2010) thatexplore the potential energy and cost savings in the SAGDprocess using pinch analysis for energy efficiency.
Nadella (2010) applied energy pinch analysis to oil sandsoperations and used a simplified example to demonstrate theminimum energy requirement calculations for a SAGD pro-cess and proposed a heat exchanger network (HEN).However, Nadella (2010) only considered a simple SAGDconfiguration and did not include any process modifications.
Jacobs Consultancy (2012) conducted a study to assess theenergy efficiency of SAGD operations and to evaluate thepotential for reducing energy consumption and GHG emis-sions for a set of technology options (e.g., lime softeningand evaporation). The results showed that 3.5% savings inenergy consumption and 2.5% reduction in GHG emissionscould be achieved through improved heat recovery. However,they only defined the energy targets and did not propose aHEN in their study to show where the energy savings wouldcome from. Finally, they did not consider different configura-tions of SAGD in their analysis.
In another recent study, Carreon et al. (2015) applied heatintegration to a specific configuration of the SAGD process(HLS and once-through steam generators (OTSG) with blow-down evaporation) to investigate the energy efficiencyimprovement and GHG emissions reduction potential inexisting and future SAGD projects. They introduced processmodifications to increase energy savings beyond themaximum energy recovery identified by the pinch method.The effect of employing other technologies such as anevaporator for produced water treatment and a drum boilerfor steam generation is not considered in the Carreon et al.(2015) study. The present study aims to provide a more com-plete evaluation of improvement opportunities in SAGDplants by conducting both water and energy integration for arange of technology options.
There is one study that considers the application of waterintegration methods to the SAGD process by designing a dis-tributed effluent treatment system (Dadashi Forshomi et al.2017). Distributed effluent treatment design provides the op-portunity to improve water treatment networks by evaluating
88 Process Integr Optim Sustain (2017) 1:87–107
alternative configurations of the network by rearranging thewastewater streams without changing the treatment technolo-gies under consideration (Wang and Smith 1994). This meth-od evaluates a set of wastewater streams that could be treatedfor a number of contaminants in several treatment units withthe possibility of partial or total bypass for each unit, in orderto reach the environmental limit (or any other performancegoals) for all the contaminants. Bypassing wastewater streamscould potentially reduce the total system costs/energy con-sumption. Although conceptual methodologies are available,it has been shown that mathematical programming can assistin the design of distributed effluent treatment systems, partic-ularly for the case where multiple contaminants are involved.In the Dadashi Forshomi et al. (2017) study, potential im-provements in SAGD operations were investigated by design-ing a distributed effluent treatment system using mathematicalprogramming. The results show up to 19.5% in cost savings inthe water treatment system and up to 12% in electricity con-sumption savings only by diverting flows in the water treat-ment system. However, heat integration opportunities werenot in the scope of the study. Therefore, in the present study,we assess the additional savings opportunities in terms of costand energy through the sequential application of a water treat-ment system optimization followed by conventional energypinch analysis.
The area of combined water and energy integration (bothsequential and simultaneous) has received increased attentionin recent years. A review of recent work in this area can befound in Ahmetović et al. (2015). PA andMP are the twomainmethods used for both energy and water integration problems.PA can be applied for a sequential water and energy analysiswhile MP can be used for both sequential and simultaneousintegration. The advantage of MP methods is that they arecapable of exploring all the interactions between water net-works (WNs) and HENs. However, the overall synthesis prob-lem ismore complex whenMPmethods are used. PAmethodsreduce the complexity of the problem and give a better graph-ical visualization of the problem. It should be noted that theadvantages of PA and MP methods could be combined byusing a hybrid method (combined PA and MP) (Ahmetovićet al. 2015) similar to the approach followed in the presentstudy. In the hybrid approach, it is possible to solve the WNdesign problem by MP first and then find the correspondingHEN design by PA. The advantage of using MP to solve theWN design problem is the capability of handling multiplecontaminants in the mathematical model of the system.
The most well-known approach to investigate combinedwater and energy integration problems is proposed bySavulescu et al. (2005a, b) for systems with and without waterreuse. In the proposed approach by Savulescu et al. (2005a, b),first a graphical approach is used to define water and energytarget and then a two-dimensional grid diagram is implement-ed to design a combined water and energy integrated network.
In 2011,WanAlwi et al. (2011) improved the targeting step byintroducing superimposed mass and energy curves that canassess water and energy reductions simultaneously.
Savulescu and Alva-Argaez (2013) reviewed different ap-proaches that have been applied to various sectors of industryto improve energy and water efficiency using process integra-tion considering the interactions between water and energynetworks. They concluded that changing the energy networkusually impacts water network in different ways and viceversa. Therefore, it is important to consider water and energynetworks together in order to find sustainable solutions. Theimportance of water and energy networks interactions is alsopresented in Savulescu’s study (Savulescu 1999). Savulescushowed that when process integration is applied to water andenergy networks separately as proposed by Polley et al.(2010), it could limit water and energy savings potential.The Bwater path^ concept has been explored in several studies(Feng et al. 2009; Savulescu and Alva-Argaez 2008; Sum Ngand Yee Foo 2006) to improve energy efficiency of waternetworks when water consumption is minimized.
The earliest proposed approaches to design integrated wa-ter and energy systems are based on graphical tools(Savulescu et al. 2005a, b). However, mathematical program-ming techniques were introduced later to deal with complexproblems (e.g., with high number of contaminants andstreams). In 1994, Papalexandri and Pistikopoulos (1994) pro-posed a general optimization framework to deal with heat andmass exchange networks that lead to a mixed integer nonlinearprogramming (MINLP) problem. Papalexandri andPis t ikopoulos (1994) used Genera l ized BendersDecomposition method to solve the MINLP problem. Since2000, several studies attempted to improve the initial frame-work proposed by Papalexandri and Pistikopoulos (1994) byreformulating the mathematical model and including addition-al components of the system and proposing new methods tosolve the MINLP model such as generating random initialpoints and performing stochastic perturbations on the initialguesses (Dong et al. 2008; Feng et al. 2009; Xiao et al. 2009).
Manan et al. (2009) proposed a new method for simulta-neous water and energy minimization in process plants. Theproposed method is a combination of mathematical modelingand pinch analysis graphical tools that are employed simulta-neously and consists of three main steps: (1) water and waste-water targeting, (2) water network design, and (3) heat ex-changer network design. They present a paper mill plant casestudy to demonstrate the application of the combined method(Manan et al. 2009).
Ahmetov ić and Kravan ja (2013) p roposed asuperstructure-based optimization model that includes bothwater network and heat exchanger network simultaneously.The superstructure proposed by Ahmetović and Kravanja(2013) considers both direct (by mixing the streams) and in-direct (in heat exchangers) heat exchange and involves
Process Integr Optim Sustain (2017) 1:87–107 89

increased heat integration opportunities and splitting andmixing of fresh water and wastewater streams (Ahmetovićand Kravanja 2013). The mathematical model is a MINLPmodel and is solved to minimize the total annual costs. Theproposed approach is applied to three cased studies to illus-trate its applicability and capabilities.
In a recent study, Jagannath and Almansoori (2016) pro-pose a two-stage sequential approach to synthesize a heat-integrated water network that includes water sources, waterusers, water treatment units, and sinks for multiplecontaminants. Heat exchangers are of course part of thesolution via designing a HEN for these water streams. In thefirst stage, they used a superstructure model for waternetworks as reported earlier and added heaters and coolers tothe interconnecting water streams. Once the water networkhas been designed and the stream population determined, theHEN superstructure of Yee and Grossmann (1990) is used todesign the HEN similar to the approach followed in the pres-ent study. Since there is an energy cost term in the objectivefunction, it is likely that this approach would favor non-isothermal mixing when feasible. The sequential approach isthen applied to generate a set of designs and the solution withlowest cost is selected.
It must be stressed that industrial applications do not typi-cally conform to the problem types defined in the literature.Heat-integrated water-using networks or WN-HEN problemsas defined by Ahmetović et al. (2015) limit the heat integra-tion to take place among water streams only. The current caseinvolves the design of a distributed effluent treatment networkwith heat integration potential for the rest of the process andthe water streams.
This study aims to continue the analyses performed byCarreon et al. (2015) and Dadashi Forshomi et al. (2017).In the Carreon et al. (2015) study, only heat integration isapplied to one set of technology options (lime softeningand OTSG) and Dadashi Forshomi et al. (2017) only con-sider water integration opportunities across different setsof technology options. The present study intends to im-prove those two studies by (1) applying both water andheat integration to SAGD operations and (2) consideringfour different cases of technology options. The purpose ofthese additional analyses is to provide a broader set ofinsights on available technology options to the decisionmakers in the oil sands industry.
Methods
In this study, we assess the impact of applying process inte-gration tools using a hybrid strategy MP-PA, to selectedSAGD configurations in terms of energy efficiency andGHG emissions of the SAGD process. Water integration isconducted by applying mathematical optimization and heat
(or energy) integration is conducted by using conventionalpinch analysis (Linnhoff 1998). Both methods are introducedin BMathematical Model for Designing a Distributed EffluentTreatment Network^ and BPinch Analysis Method for HeatIntegration^ sections.
Problem Statement
In this study, four different configurations of the SAGD cen-tral processing facility (CPF) are investigated and compared interms of energy and water consumption, cost, and GHG emis-sions before and after process integration. The SAGD config-urations investigated in this study are described below.
& Case 1: HLS is used for water treatment and steam isgenerated in an OTSG. Boiler blowdown is treated in anevaporator and the evaporator distillate is recycled directlyas boiler feed water.
& Case 2: Similar to the case 1, case 2 uses HLS and OTSGfor water treatment and steam generation, respectively. Inthis case however, the boiler blowdown is partiallyrecycled back to HLS for further treatment without theevaporation step (50% recycle ratio). The remainder ofthe blowdown goes to deep well injection for disposal.
& Case 3: An evaporator is used for produced water treat-ment and steam is generated in an OTSG. Boiler blow-down is recycled back to the evaporator.
& Case 4:Water is treated in an evaporator and a drum boileris used for steam generation.
The system investigated in this study consists of a set ofwater and wastewater streams with known flow rates, contam-inant concentrations, and temperatures. There are a set of wa-ter treatment units with known temperature requirements andremoval ratios for each contaminant. Two process integrationmethods are employed to reduce the total cost in the system;mathematical optimization is applied to design an optimalwater network and pinch analysis is used to design an optimalheat exchanger network byminimizing the total annual cost ofthe process. Total cost savings potential as a result of applyingwater and heat integration methods is investigated for fourdifferent configurations. In the final step, four configurationsare compared in terms of total cost, GHG emissions, water,and energy consumption.
Mathematical Model for Designing a Distributed EffluentTreatment Network
Dadashi Forshomi et al. (2017) developed a mathematicalmodel to design an optimized water treatment network for aSAGD plant. The model is developed based on a superstruc-ture model of the network that includes all components of thewater treatment system (splitters, mixers, wastewater streams
90 Process Integr Optim Sustain (2017) 1:87–107

with known flow rates and contaminant concentrations, watertreatment processes with known removal ratios, etc.) and in-terconnections between treatment units as shown in Fig. 1.The model developed in the Dadashi Forshomi et al. (2017)study is used in the present study to investigate the combinedeffect of water and energy integration in SAGD operations.
Objective function of the model is minimum total cost (ortotal energy consumption) of the system. Constraints of themathematical model are mainly mass balance equations andsome additional constraints of the system (e.g., minimum boil-er feed water quality requirements). Decision variables are theflow rates of wastewater streams through each treatment pro-cess. The complete mathematical model can be found inDadashi Forshomi et al. (2017).
Mathematical model of the system leads to a MINLP prob-lem. The MINLP model is divided into two simpler sub-models: mixed integer linear programming (MILP) modeland linear programming (LP) model by introducing a penaltyfunction and projection and relaxation approaches. MILP andLP models are solved iteratively to reach an optimal solutionwhich is then used as an initial point for MINLP problem.Then, the MINLP problem is solved to find the optimalsolution.
Pinch Analysis Method for Heat Integration
Energy pinch analysis is a well-known process integration toolthat is used to identify heat recovery potential in a system andminimize energy consumption. The first step in this type ofanalysis is called the targeting step where the maximum heatrecovery potential and minimum hot and cold utility require-ments (external heating and cooling) are identified. The nextstep is the design of a HEN to reach the energy targets iden-tified in the previous step (Linnhoff 1998). The HENs aredeveloped based on pinch analysis rules (Kemp 2007). The
three fundamental rules to achieve maximum heat recoverywhen designing a HEN are:
1. No heat transfer across the pinch point2. No external cooling above the pinch point3. No external heating below the pinch point
Any violation of these rules leads to an energy penalty andminimum utility requirements will not be achieved.
Combined Method
In the present study, we apply water and heat integration usinga sequential approach to the SAGD process to study theircombined effects in terms of energy and cost savings consid-ering four different configurations of the SAGD process thatare introduced in the BProblem Statement^ section.
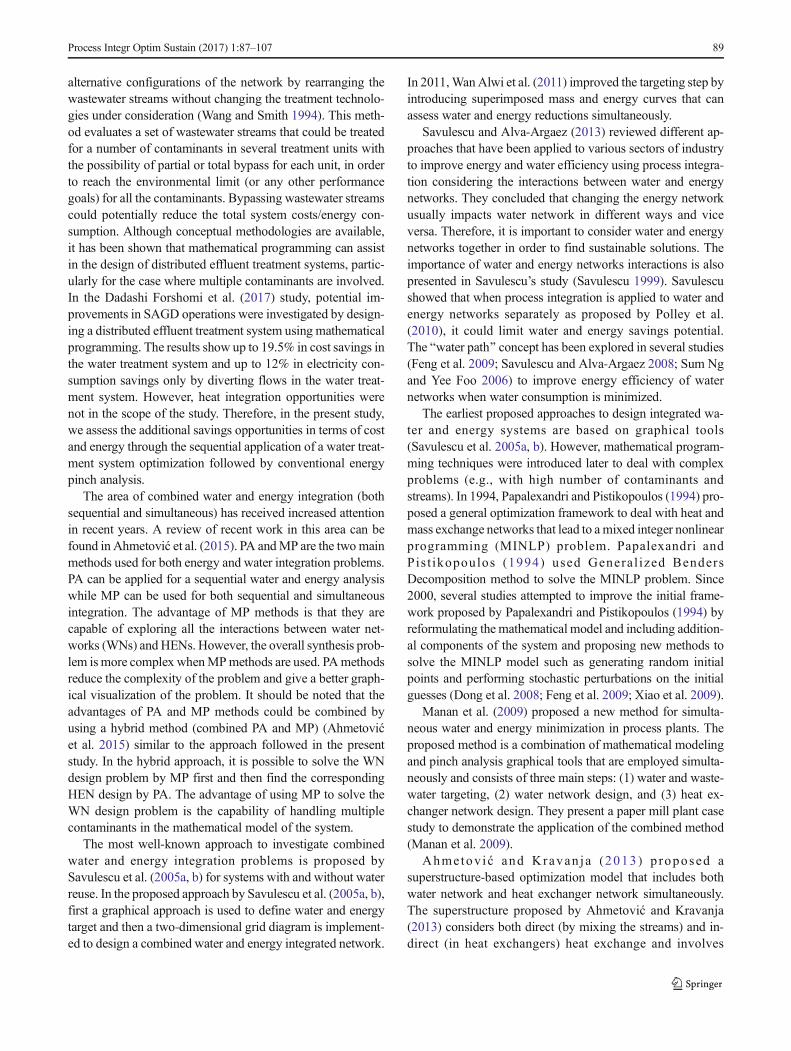
A simplified block flow diagram (BFD) for case 1 is shownin Fig. 2a. The BFD of case 1 includes the process units of thecentral processing facility of SAGD operations. Inlet separa-tors, free water knockout drums (FWKO), and treaters areused to separate gases and oil from water. Produced waterfrom FWKOs and treaters is sent to the water deoiling sectionthat consists of skim tank, induced gas flotation (IGF), and oilremoval filters (ORF). Deoiled water goes to the water treat-ment section that consists of hot lime softener and ion ex-change units. Treated water enters the boiler (OTSG) to pro-duce ~80% quality steam. HP separators are used to separatethe blowdown (water) and produce 100% quality steam whichis injected into the reservoir. Boiler blowdown is treated in theevaporation unit and evaporator distillate is recycled to theboiler inlet. In this figure, streams are numbered from 1 to 9,and the corresponding characteristics of each of these hot andcold streams are presented in Table 1. BFDs of the other threecases are shown in Figs. 3a, 4a , and 5a and the streams in eachcase are listed in Tables 2, 3, and 4.
Fig. 1 Superstructure of thesystem (adapted from DadashiForshomi et al., (2017))
Process Integr Optim Sustain (2017) 1:87–107 91

A business as usual (BAU) case is defined as a spe-cific configuration of the SAGD process before applyingwater and heat integration. In other words, for each ofthe four cases introduced, the BAU case implementstypical heat integration configurations found in industry.BAU cases are used as the basis of comparison to eval-uate cost and energy savings as a result of applyingwater and heat integration techniques for each selectedconfiguration of SAGD operations. The effect of waterand heat integration on the capital and operating costsand the data sources used in this study are presented inthe Online Resource 1.
For each BAU case, the total cost and associated energyconsumption are estimated. Total cost includes capital andoperating costs of water treatment units, makeup water with-drawal and wastewater disposal, capital cost of boilers andsteam separators, capital cost of heat exchangers, and naturalgas (NG) cost. Energy consumption also includes electricityconsumption. GHG emissions are calculated based on energyconsumption and energy source type. For heat exchanger costcalculations in BAU cases, it is assumed that a similar HEN isdesigned for all BAU cases, and it is noted that the requireddata to build the specific HEN for the BAU cases 2–4 was notavailable. The HEN of BAU case before water and heat
Fig. 2 a Block flow diagram of business as usual design of case 1. b Distributed effluent treatment design for case 1
92 Process Integr Optim Sustain (2017) 1:87–107

integration is shown in Fig. 6. In this figure, gray connectedcircles are process heat exchangers, blue circles are coolers,and red circles are heaters. It must be stressed that the BAUcase already has some degree of heat integration, but the pres-ent study aims at improving on these current practices.
After analyzing the BAU cases, the optimization modelfor the water treatment system presented in DadashiForshomi et al. (2017) is used to estimate the cost savingsas a result of diverting flows around treatment units.Pertinent data that are used in the mathematical modelto design a distributed effluent treatment for SAGD watertreatment system are presented in Tables 5, 6, 7, 8, and 9,and the results are discussed in BCost Savings Resultingfrom Water Integration^ section (Data presented in thetables are extracted from the following references: Allen2008; ASME Consensus Documents 1994; Bridle 2005;Goodman et al. 2010; Gwak and Bae 2010; Heins 2006;Hill 2012; Kawaguchi et al. 2012; Pedenaud et al. 2005;Peterson et al. 2007; Wayne Gilraine 2013; Zaidi andLeopold 2010). The cost data for water treatment unitsused in this analysis are presented in Table 10. It shouldbe noted that the cost data are acquired from industrypartners under a confidentiality agreement; therefore, datapresented in Table 10 are normalized to 100 (the cost datacan be used as presented to reproduce the present studyand it will not affect the results). Once the optimizeddesign of the water treatment system is identified, streamdata presented in Tables 1, 2, 3, and 4 is used to generatecomposite curves and grand composite curves to find en-ergy targets. After the energy targets are established, aHEN is developed for each case to show how the energytargets can be achieved. Once the heat exchanger networkis developed, the heat load and heat transfer area of theheat exchangers are evaluated and used for capital costestimation and calculation of NG requirements and GHGemissions. Then, the additional cost and energy savings
associated with heat integration of the process are calcu-lated. The results of heat integration and the total impactof sequential water and heat integration are presented inBCost and Energy Savings Result ing from HeatIntegration^ section.
After evaluating the savings potential due to water and heatintegration for each case, the results of energy consumption,total cost estimates, and GHG emissions of the four cases arecompared with their corresponding BAUs. Comparisonsacross configurations are used to identify the tradeoffs be-tween cost, energy, and emissions.
In this work, the minimum temperature approach to deter-mine the pinch location was selected to be 13 °C. This valuecorresponds to the lowest temperature approach identified inany heat exchanger as reported in the base case. This selectionensures that current industrial practice is taken into consider-ation for the remainder of the analysis. Lower values could beexplored but would likely result in excessive capital cost andis outside the scope of this paper.
The optimization problem was solved using the GeneralAlgebraic Modeling System (GAMS). CPLEX solver wasused for LP and MILP, and BARON solver was used forMINLP. Aspen Energy Analyzer was used to solve the heatintegration problem and to generate composite and grandcomposite curves. A computer with an Intel® Core™ i7 pro-cessor at 3.4 GHz was used to run the simulations.
Results and Discussion
The sequential application of water and heat integrationmethods to the SAGD process leads to cost and energy sav-ings and GHG emissions reductions. By applying the mathe-matical model, distributed effluent treatment systems are de-veloped for all cases. Optimized water treatment network
Table 1 Stream data for case 1Stream Tinitial
(°C)Tfinal(°C)
Mass flow rate(kg/h)
Heat load(MW)
Hotstreams
1. Bitumen emulsion 187 133 610,138 38.5
2. Diluted bitumen (dilbit) 130 50 172,453 8.2
3. Produced water form FWKO andtreaters
130 85 466,960 26.2
4. HP blowdown 310 90 125,997 35.8
5. Evaporator blowdown 90 65 6,300 0.2
Coldstreams
6. Makeup water 5 50 4,838 0.3
7. Deoiled water to lime softener 85 95 475,463 6.0
8. Boiler feed water 105 310 629,986 167.0
9. Evaporator distillate 90 105 119,697 2.1
Boiler feed water to steam conversion(latent heat)
310 310 493,658 181.0
Process Integr Optim Sustain (2017) 1:87–107 93

designs and diverted flows are presented in Figs. 2b, 3b , 4band 5b (diverted flows are shown in green).
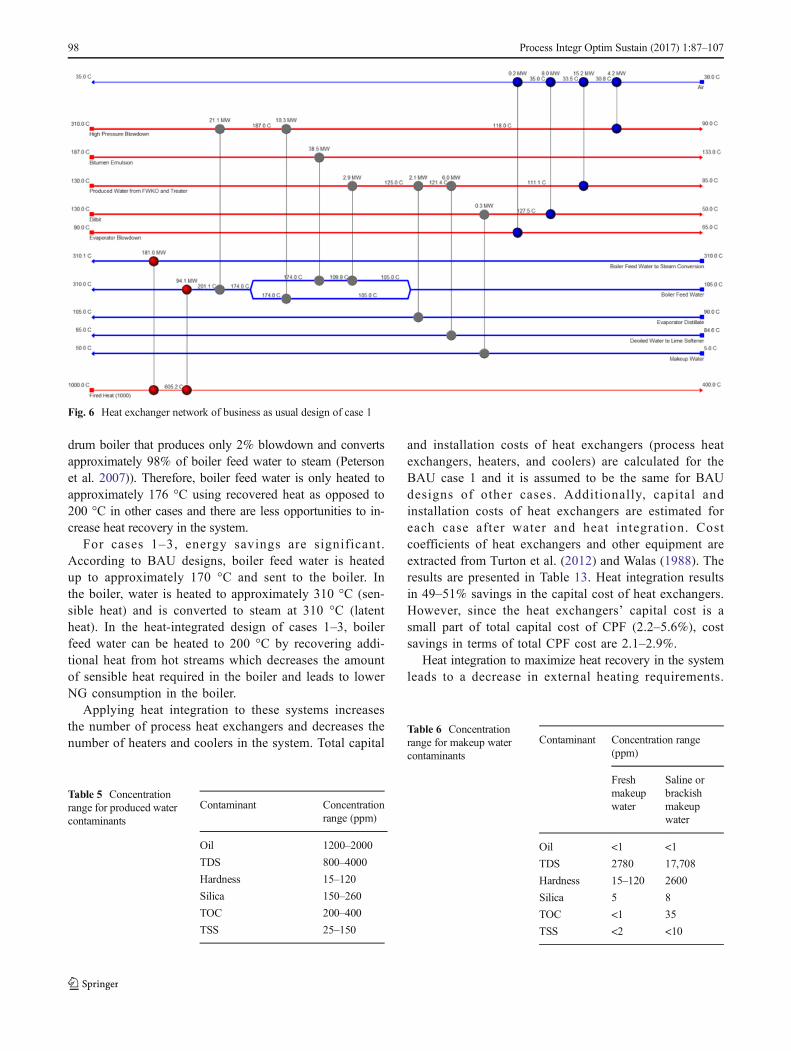
Hot and cold streams in the water treatment networks(shown in Figs. 2a, 3a , 4a , and 5a) are extracted and used toconstruct composite and grand composite curves. It should benoted that diverting flows will not impact stream data presentedin Tables 1, 2, 3, and 4. Composite curves and grand compositecurves for all four cases are shown in Figs. 7, 8, 9, and 10. Fromthe composite curves, the pinch temperature in all four cases is180.5 °C (hot pinch temperature = 187 °C, cold pinchtemperature = 174 °C). Then, the HEN is developed followingthe pinch design method (Linnhoff and Hindmarsh 1983).
HEN of the four cases are shown in Figs. 11, 12, 13, and14.
Comparison of Cost, Energy, and GHG Emissionsfor Integrated and Non-integrated (BAU) Cases
Cost savings associated with water and heat integration ofeach case are categorized into two main sections:
1. Savings in the capital and operating costs of treatmentunits resulting from water integration (diverting flowaround treatment units)
Fig. 3 a Block flow diagram of case 2. b Distributed effluent treatment design for case 2
94 Process Integr Optim Sustain (2017) 1:87–107

2. Savings in the capital cost of heat exchangers (process heatexchangers, heaters, and coolers) and savings in NG con-sumption, resulting from heat integration of the system
Cost Savings Resulting from Water Integration
Optimizing the water treatment network and diverting flowsdecrease both capital and operating cost (CC and OC) of treat-ment units. Cost savings as a result of water integration areshown in Table 11. The capital cost reductions shown in thistable are due to the use of smaller treatment units handling
smaller flows of wastewater. This in turn decreases electricityand chemical consumption in the treatment units reducingoperating cost. Total cost savings range from 2.7 to 7.8% ofthe total cost of the process. Case 3 shows the highest potentialfor cost reduction (compared to the BAU case associated withcase 3) as a result of distributed effluent treatment design. Thisis due to the use of an evaporator with an OTSG. The qualityof evaporator distillate is high (contaminant concentrations areapproximately 10 times lower than other treatment units) andthe water is treated to a quality that is cleaner than what isrequired in the OTSG. The difference between the evaporatortreated water quality and the OTSG quality requirements
Fig. 4 a Block flow diagram of case 3. b Distributed effluent treatment design for case 3
Process Integr Optim Sustain (2017) 1:87–107 95

provides an opportunity to bypass a large part of the evapora-tor inlet stream (~14%) and use a smaller evaporator for watertreatment. This leads to a significant cost reduction in theevaporator (~14%).
Cost and Energy Savings Resulting from Heat Integration
Applying energy pinch analysis increases heat recovery in thesystem beyond BAU heat recovery, which results in a de-crease of both cold and hot utility requirements.
Table 12 shows both the additional recovered heat (in MW)as well as the percentage of heat recovery that occurs becauseof the heat integration (beyond the BAU design of that case
(HEN in BAU designs for cases 2, 3, and 4 are assumed to besimilar to case 1, because required data were not available forBAU HEN for all cases). Furthermore, makeup water con-sumption, wastewater disposal, capital and operating cost es-timates, annual cost savings, and GHG emissions reductionare also shown in Table 12 (annual costs are calculated using a10% discount factor and assuming a 30-year lifetime for theplant). The results of pinch analysis show that the energysavings are comparable across the cases considered exceptfor case 4. The energy savings potential for case 4 is signifi-cantly lower given that the high-pressure blowdown used forheating boiler feed water is a very small stream in case 4compared to the other three cases (because of the use of a
Fig. 5 a Block flow diagram of case 4. b Distributed effluent treatment design for case 4
96 Process Integr Optim Sustain (2017) 1:87–107

Table 2 Stream data for case 2Stream Tinitial
(°C)Tfinal(°C)
Mass flow rate(kg/h)
Heat load(MW)
Hotstreams
1. Bitumen emulsion 187 133 610,138 38.5
2. Diluted bitumen (dilbit) 130 50 172,453 8.2
3. Produced water form FWKO andtreaters
130 85 466,960 26.2
4. HP blowdown 310 95 125,997 35.0
5. HP blowdown to disposal 95 65 62,998 2.2
Coldstreams
6. Makeup water 5 50 86,032 4.6
7. Deoiled water to lime softener 82 95 475,463 8.8
8. Boiler feed water 105 310 629,986 167.0
Boiler feed water to steam conversion(latent heat)
310 310 493,658 181.0
Table 3 Stream data for case 3Stream Tinitial
(°C)Tfinal(°C)
Mass flow rate(kg/h)
Heat load(MW)
Hotstreams
1. Bitumen emulsion 187 133 610,138 38.5
2. Diluted bitumen (dilbit) 130 50 172,453 8.2
3. Produced water form FWKO andtreaters
130 85 466,960 26.2
4. Evaporator blowdown 90 65 27,726 0.8
5. Boiler blowdown 310 90 123,415 34.9
Coldstreams
6. Makeup water 5 50 50,759 2.7
7. Deoiled water to evaporator 82 90 521,384 5.1
8. Boiler feed water 90 310 617,073 174.4
Boiler feed water to steam conversion(latent heat)
310 310 493,658 181.0
Table 4 Stream data for case 4Stream Tinitial
(°C)Tfinal(°C)
Mass flow rate(kg/h)
Heat load(MW)
Hotstreams
1. Bitumen emulsion 187 133 610,138 38.5
2. Diluted bitumen (dilbit) 130 50 172,453 8.2
3. Produced water form FWKO andtreaters
130 85 466,960 26.2
4. Evaporator blowdown 90 65 26,512 0.8
5. Boiler blowdown 310 65 10,075 3.2
Coldstreams
6. Makeup water 5 50 59,620 3.2
7. Deoiled water to evaporator 81 90 530,245 5.8
8. Boiler feed water 90 310 503,733 142.3
Boiler feed water to steam conversion(latent heat)
310 310 493,658 181.0
Process Integr Optim Sustain (2017) 1:87–107 97
drum boiler that produces only 2% blowdown and convertsapproximately 98% of boiler feed water to steam (Petersonet al. 2007)). Therefore, boiler feed water is only heated toapproximately 176 °C using recovered heat as opposed to200 °C in other cases and there are less opportunities to in-crease heat recovery in the system.
For cases 1–3, energy savings are significant.According to BAU designs, boiler feed water is heatedup to approximately 170 °C and sent to the boiler. Inthe boiler, water is heated to approximately 310 °C (sen-sible heat) and is converted to steam at 310 °C (latentheat). In the heat-integrated design of cases 1–3, boilerfeed water can be heated to 200 °C by recovering addi-tional heat from hot streams which decreases the amountof sensible heat required in the boiler and leads to lowerNG consumption in the boiler.
Applying heat integration to these systems increasesthe number of process heat exchangers and decreases thenumber of heaters and coolers in the system. Total capital
and installation costs of heat exchangers (process heatexchangers, heaters, and coolers) are calculated for theBAU case 1 and it is assumed to be the same for BAUdesigns of other cases. Additionally, capital andinstallation costs of heat exchangers are estimated foreach case after water and heat integration. Costcoefficients of heat exchangers and other equipment areextracted from Turton et al. (2012) and Walas (1988). Theresults are presented in Table 13. Heat integration resultsin 49–51% savings in the capital cost of heat exchangers.However, since the heat exchangers’ capital cost is asmall part of total capital cost of CPF (2.2–5.6%), costsavings in terms of total CPF cost are 2.1–2.9%.
Heat integration to maximize heat recovery in the systemleads to a decrease in external heating requirements.
Fig. 6 Heat exchanger network of business as usual design of case 1
Table 5 Concentrationrange for produced watercontaminants
Contaminant Concentrationrange (ppm)
Oil 1200–2000
TDS 800–4000
Hardness 15–120
Silica 150–260
TOC 200–400
TSS 25–150
Table 6 Concentrationrange for makeup watercontaminants
Contaminant Concentration range(ppm)
Freshmakeupwater
Saline orbrackishmakeupwater
Oil <1 <1
TDS 2780 17,708
Hardness 15–120 2600
Silica 5 8
TOC <1 35
TSS <2 <10
98 Process Integr Optim Sustain (2017) 1:87–107

Assuming that heat is provided by burning NG in a firedheater, heat integration decreases NG consumption in the sys-tem. NG cost for each case before and after heat and waterintegration along with the resulting savings are shown inTable 14. Heat integration results in 11–12% savings in NGconsumption. NG cost is a significant contributor to the totaloperating cost of the system and constitutes between 73 and85% of the total CPF operating cost. Therefore, heat integra-tion leads to 9.2–10.2% savings of the total operating cost ofthe system.
Cost Savings Resulting from Both Water and Heat Integration
Figure 15 shows the total system cost before and after waterand heat integration broken down by capital and operatingcost. It shows there is a reduction in total cost for each caseafter water and heat integration of the process. Cost reductionsrange from $3.9 to $7.4 M/year which corresponds to $0.56–1.06/bbl of bitumen produced. Detailed information about thecost savings are presented in Online Resource 1.
Heat integration leads to larger savings than water integration inoperating cost because of decreased NG consumption. Capital cost
savings as a result of heat integration are not significant since heatexchangers constitute a small part of the total capital cost of thesystem and improving the heat exchanger network will not affectthe total capital cost of the system significantly. On the other hand,water integration leads to approximately similar capital and operat-ing cost savings in each case (order of magnitude $105 to $106 peryear). This is due to the diversion of flows which results in smallertreatment units with lower capital and operating costs. However, theeffect of water integration on operating cost savings is less signifi-cant, since the operating cost of treatment units constitutes a smallpart of total operating cost of the system (boilers constitute themajorpart of operating cost in the system which are not affected by waterintegration). By applying bothwater and heat integration techniques,there are potential cost savings in both capital and operating costs ofthe system. Total cost savings range from $3.9 to $7.4 M/year andoperating cost savings contribute to 74–82% of the total costsavings.
GHG Emissions, Makeup Water Consumption, and TotalCost Tradeoffs Across Four Cases
In order to inform decisions about the selection of the pre-ferred process option, a more complete investigation of theperformance of each option is required. Figure 16 shows thetradeoffs between makeup water consumption, GHG emis-sions, and total annual cost for the optimized cases 1–4.
Table 8 Boiler feed water quality requirements for OTSG and drumboiler
Parameter OTSG requirement(ppm)
Drum boilerrequirement (ppm)
Oil 0.5–10 0.2
TDS 7000–12,000 5
TSS <1 <1
Hardness 0.5–1 0.02–0.5
Silica 20–150 0.1–2
TOC 200–600 0.2
DO 0.04 0.04
Specific conductance 2000–10,000a 150*
aUnit is microsiemens per centimeter
Table 9 Contaminant concentrations of water and wastewater streamsin the system used in the optimization model
Contaminant Producedwater
Freshmakeupwater
Brackishmakeupwater
Oil (ppm) 2000 0 0
Silica (ppm) 350 15 15
TH (ppm) 20 245 2500
TSS (ppm) 50 0 5
Table 10 Capital and operating cost data (normalized) used in themathematical model
Treatment unit Capital cost per unitflowrate ($ tonne−1 h−1)(normalized to 100)
Operating cost per unitflowrate ($ tonne−1 h−1 h−1)(normalized to 100)
Skim tank 10.69 0.29
Induced gasflotation
6.92 1.26
Oil removal filter 4.47 0
Hot lime softener 16.49 21.75
Ion exchanger 5.55 1.29
Evaporator 55.88 75.41
Table 7 Deoiling processes and their oil removal efficiency
Process Separationtechnology
Oildropletsizeremoval
Effluent oilconcentration(ppm)
Approximateremoval ratio
Skim tank Gravity >150 μm 200–400 85–90%API separator Gravity >150 μm 200–400 50–99%CPI separator Gravity/coalescence >50 μm 100 –a
DGF/IGF Flotation >20 μm 10–40 90–93%Deoiling
hydrocyc-lone
Centrifugal force >10 μm 20–40 90–93%
Filtration Absorption <2 μm 1–5 90%Membrane Barrier <1 μm 0.5–4 –a
a Accurate removal ratios could not be found in the literature
Process Integr Optim Sustain (2017) 1:87–107 99
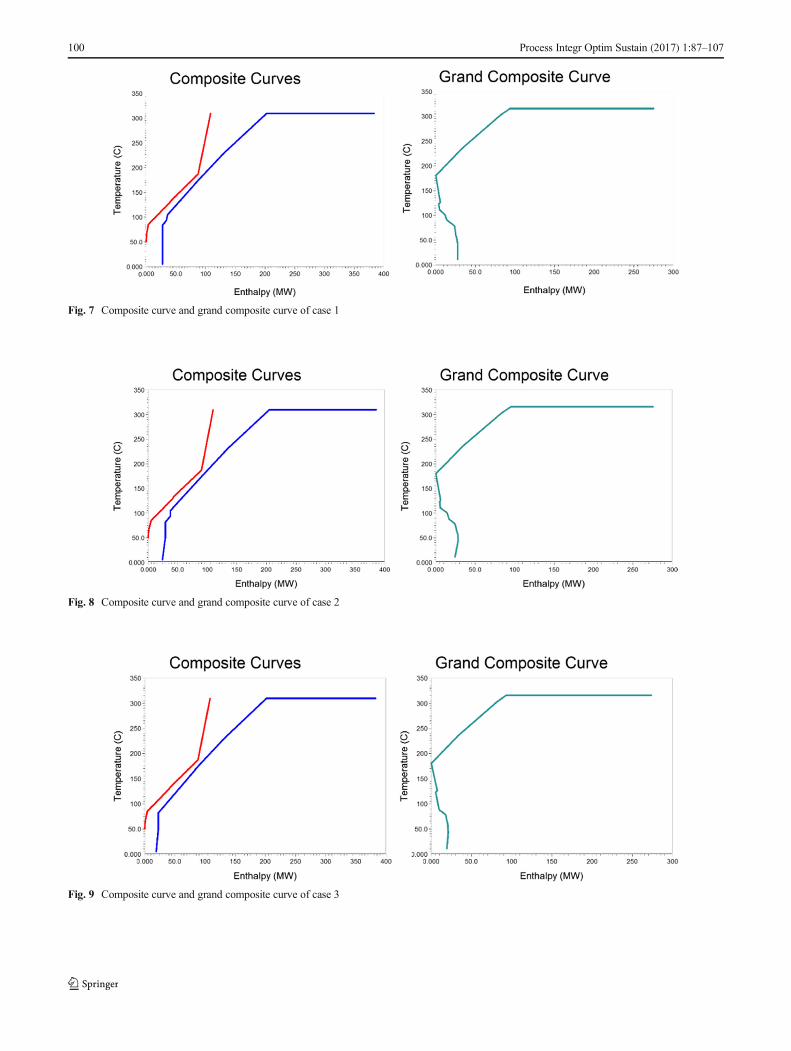
Fig. 7 Composite curve and grand composite curve of case 1
Fig. 8 Composite curve and grand composite curve of case 2
Fig. 9 Composite curve and grand composite curve of case 3
100 Process Integr Optim Sustain (2017) 1:87–107

Makeupwater is on the horizontal axis, GHG emissions are onthe vertical axis, and the size of the circles represents the totalcost of each case (the cost differences are more visually dis-tinguishable when the circles are larger). According to Fig. 16,case 1 has the lowest makeup water consumption and is thesecond lowest in GHG emissions after case 2. Case 3 and case4 have relatively high GHG emissions because of the use ofevaporators that have high electricity consumption, but make-up water consumption of cases 3 and 4 is lower than case 2that has the highest makeup water consumption. Additionally,cases 3 and 4 are more expensive than cases 1 and 2 because
of the use of evaporators which are more expensive than limesoftening and ion exchange units. However, there are no sig-nificant differences between the total costs of the four caseswhich indicates that with approximately equal cost, the pro-cess can be designed to produce different amounts of GHGemissions and to consume different amounts of makeup water.Cases 1 and 2 are overall the most promising options. Thedecision between these two options will require a decisionmaker to apply a value to the externalities of GHG emissionsversus the makeup water consumed.
Fig. 10 Composite curve and grand composite curve of case 4
Fig. 11 Heat exchanger network of case 1 after water and heat integration
Process Integr Optim Sustain (2017) 1:87–107 101

Sensitivity Analysis
There are a number of parameters in the system that havea significant impact on total cost and total GHG emissionssuch as NG price. However, these parameters tend to shiftall cases proportionally in the same direction and total
cost and GHG emissions of different cases would remainrelatively unchanged. Therefore, sensitivity analyses forthese parameters are not listed here or in OnlineResource 1.
The quality of steam generated in the boiler is an im-portant parameter in the SAGD process. It will affect NG
Fig. 12 Heat exchanger network of case 2 after water and heat integration
Fig. 13 Heat exchanger network of case 3 after water and heat integration
102 Process Integr Optim Sustain (2017) 1:87–107

Fig. 14 Heat exchanger network of case 4 after water and heat integration
Table 11 Cost savings due to water integration
CCsavings($/year)
CC savingspercentage (%)
OCsavings($/year)
OC savingspercentage (%)
Total costsavings ($/year)
Total costsavingspercentage (%)a
Case 1 4.14E+05 2.51% 3.22E+05 3.03% 7.37E+05 2.71%
Case 2 6.88E+05 4.22% 7.04E+05 8.09% 1.39E+06 5.57%
Case 3 9.76E+05 4.15% 1.34E+06 7.35% 3.35E+06 7.82%
Case 4 1.05E+06 4.53% 1.27E+06 7.77% 2.32E+06 5.87%
aCost savings due to water integration are different from the Dadashi Forshomi et al. (2017) study. The reason is Dadashi Forshomi et al. (2017) onlyincluded water treatment system in their cost analysis; however, in this study, the cost of steam generation section is considered as well
Table 12 Summary of energy savings, GHG emissions, and cost reduction compared to BAU design due to heat integration
Increased heat recovery GHG emissionreduction
Makeup waterconsumption
Annualized cost ($ 106/year) Annual savings
MW % kg CO2e/bbl kg/h Capital Operating Total $ 106/year
Case 1 23.7 41.2 6.3 4.84E + 03 17.1 55.5 72.6 5.1
Case 2 27.0 46.4 7.2 8.60E + 04 16.6 53.4 70.0 6.3
Case 3 24.5 38.1 7.5 5.08E + 04 23.4 62.1 85.5 7.4
Case 4 6.6 12.3 2.9 5.96E + 04 22.6 59.7 82.3 3.9
Process Integr Optim Sustain (2017) 1:87–107 103

consumption in the boiler, bitumen production rate, andproduced water flow rate. The impact of changing theOTSG produced steam quality to 90% (instead of 80%assumed in the analysis to this point) is investigated forcase 3 (In case 3, OTSG is used for steam generation withan evaporator for water treatment. Therefore, there is anopportunity to generate high-quality steam (higher that80% which is the conventional quality of steam generatedin an OTSG) because of the high quality of water inevaporator effluent stream). It should be noted that pro-ducing higher quality steam indicates higher quality re-quirements for boiler feed water (BFW) which in turnrequires a smaller bypassed stream for the evaporator. A90% steam quality requires a lower flow rate of BFW. Theresults of the analysis show that BFW temperature is re-duced to 187 from 200 °C (in the original 80% qualitysteam case). However, this change does not affect NGconsumption because of the lower flow rate of BFW. Inother words, when 90% quality steam is produced, theBFW has a smaller flow rate and is heated from 187 to310 °C, while in the case of producing 80% quality steam,a slightly larger flow rate of BFW is heated from 200 to310 °C. Calculations show that total heat load required toheat the BFW remains nearly constant ($44.8 versus$45.0 M/year). The results of this sensitivity analysisshow that the total cost increases by less than 1.5%.
In the second part of the sensitivity analysis, the BFWflow rate is kept constant. This means that for the case of
producing 90% quality steam, more steam is producedwhich in turn leads to a higher bitumen production rate.Steam generation volume is increased by 12.5% whichresults in a 12.5% volume increase in bitumen production.The results of the analysis show that BFW temperature isreduced to approximately 187 °C, similar to the first sen-sitivity analysis, and since the BFW flow rate is keptconstant, the required heat load to heat the BFW to310 °C for steam generation increases by 10%. This inturn leads to a 10.4% increase in total NG consumption.The system cost to achieve this increased production isapproximately $7.4 M/year (8.7% of total system costs)while the potential revenue from this increased productionis for example $35 M/year at $40/bbl and $70 M/year at$80/bbl. Since the production increase is larger than theincrease in cost, it is economic to produce 90% qualitysteam even if it means that higher water quality isrequired.
Conclusions
This paper contributes to decision making in the oil sandsindustry by providing a broad set of insights on availabletechnology options. The analysis shows that applying wa-ter and heat integration to SAGD central processing facil-ities provides the opportunity to reduce the total cost ofthe system by between $5.1 and $7.4 M/year which isbetween 7.0 and 8.2% of the total cost of the system,respectively. The contribution of operating cost savingsto the total cost savings due to a decrease in NG con-sumption in the boiler is more significant than the capitalcost (e.g., in case 1, the operating cost savings constitutes82% of the total cost reduction and the capital cost sav-ings constitutes the remaining 18%). Case 4 uses a drumboiler for steam generation and has the lowest potentialfor cost savings of all cases. This is due to the smallerboiler blowdown volume produced. This means that thestream provides less heat for additional potential heatrecovery.
Tradeoffs between cost, water consumption, and GHGemissions exist when choosing between these technology
Table 14 NG consumption before and after water and heat integrationfor each case and NG savings within each case due to integration
NG cost ($/year) NG savings ($/year) NG savings (%)
Case 1 BAU 4.91E+07 − −Case 1 4.52E+07 3.90E+06 7.93%
Case 2 BAU 4.98E+07 − −Case 2 4.54E+07 4.44E+06 8.91%
Case 3 BAU 4.87E+07 − −Case 3 4.51E+07 3.58E+06 7.35%
Case 4 BAU 4.57E+07 − −Case 4 4.46E+07 1.09E+06 2.39%
Table 13 Capital cost of HENbefore and after water and energyintegration, HEN cost savings
HEN capitalcost ($)
HEN capitalcost savings ($)
HEN capital costsavings percentage (%)
HEN annual costsavings ($/year)
BAU 9.40E+06 − −Case 1 4.80E+06 4.60E+06 48.9% 4.88E+05
Case 2 4.94E+06 4.46E+06 47.4% 4.73E+05
Case 3 4.77E+06 4.63E+06 49.3% 4.91E+05
Case 4 4.59E+06 4.81E+06 51.2% 5.10E+05
104 Process Integr Optim Sustain (2017) 1:87–107

options. Use of an evaporator for produced water treat-ment (cases 3 and 4) increases the GHG emissions inthe system significantly (~12.5%) when compared to theboiler blowdown recycle case (case 2). However, waterconsumption is reduced. If an evaporator is used, case 2
provides the best balance between GHG emissions, waterconsumption, and cost (compared to cases 3 and 4).
The sensitivity analysis shows that there is an oppor-tunity to increase the profit in the case of using anOTSG with an evaporator by modifying the OTSG to
Fig. 16 Cost, water, and GHG emissions across four cases after water and heat integration
Fig. 15 Total annual cost before and after water and heat integration for each case
Process Integr Optim Sustain (2017) 1:87–107 105

produce higher quality steam. This in turn leads to ahigher bitumen production rate at a relatively low costincrease due to the additional NG consumed in theboiler.
Acknowledgements The authors wish to thank the Natural Sciencesand Engineering Research Council of Canada (NSERC) for financialsupport.
Compliance with Ethical Standards
Conflict of interest On behalf of all authors, the corresponding authorstates that there is no conflict of interest.
References
Ahmetović E, Ibrić N, Kravanja Z, Grossmann IE (2015) Water andenergy integration: a comprehensive literature review of non-isothermal water network synthesis. Comput Chem Eng 82:144–171. doi:10.1016/j.compchemeng.2015.06.011
Ahmetović E, Kravanja Z (2013) Simultaneous synthesis of process wa-ter and heat exchanger networks. Energy 57:236–250
Allen EW (2008) Process water treatment in Canada’s oil sands industry:I. Target pollutants and treatment objectives. J Environ Eng Sci 7:123–138. doi:10.1139/S07-038
Alwi SRW, Ismail A, Manan ZA, Handani ZB (2011) A new graphicalapproach for simultaneous mass and energy minimisation. ApplTherm Eng 31:1021–1030
The American Society of Mechanical Engineers (1994) Consensus doc-uments: feedwater, boiler water, steam, lay-up of boiler systems andwater chemistry monitoring. ASME, US
Bridle M (2005) Treatment of SAGD produced waters without lime soft-ening. Society of Petroleum Engineers. doi:10.2118/97686-MS
Butler R (2001) Application of SAGD, related processes growing inCanada. J Can Pet Technol 99:74
CAPP (2015) 2015 CAPP crude oil forecast, markets & transportation(no. 2015–7). Canadian Association of Petroleum Producers. www.capp.ca/publications and statistics/publications/264673. Accessed16 Dec 2015
Carreon CE, Mahmoudkhani M, Alva-Argaez A, Bergerson J (2015)Evaluation of energy efficiency options in steam assisted gravitydrainage oil sands surface facilities via process integration. ApplTherm Eng 87:788–802. doi:10.1016/j.applthermaleng.2015.04.055
Charpentier AD, Kofoworola O, Bergerson JA, MacLean HL (2011) Lifecycle greenhouse gas emissions of current oil sands technologies:GHOST model development and illustrative application. EnvironSci Technol 45:9393–9404
Dadashi Forshomi Z, Alva-Argaez A, Bergerson JA (2017) Optimal de-sign of distributed effluent treatment systems in steam assisted grav-ity drainage oil sands operations. J Clean Prod 149:1233–1248. doi:10.1016/j.jclepro.2017.02.131
Dong HG, Lin CY, Chang CT (2008) Simultaneous optimization ap-proach for integrated water-allocation and heat-exchange networks.Chem Eng Sci 63:3664–3678. doi:10.1016/j.ces.2008.04.044
Feng X, Li Y, Shen R (2009) A new approach to design energy efficientwater allocation networks. Appl Therm Eng 29:2302–2307
Gilraine W (2013) SAGD facility water treatment and steam generationprocess technology selection. Presented at Canadian Heavy OilAssociation. Alberta, Canada
Goodman WH, Godfrey MR, Miller TM, Comany N (2010) Scale anddeposit formation in steam assisted gravity drainage (SAGD)
facilities. Presented at the International Water Conference. SanAntonio, Texas
Gwak KW, Bae W (2010) A review of steam generation for in-situ oilsands projects. Geosystem Eng 13:111–118. doi:10.1080/12269328.2010.10541317
Halari A, Jergeas G, Eng P (2011) Lessons learned from execution of oilsands’ SAGD projects. s3.amazonaws.com/elasticbeanstalk-us-east-1-200981706290/wufu/5632b4159a237. Accessed 12 Dec 2015
Heins B (2006) Operational experience of heavy oil produced waterevaporation system at Suncor Firebag and Deer Creek facilities inNorthern Alberta. Presented at 2006 CONRAD water usage work-shop and seminar. Ft. McMurray, Alberta
Hill R (2012) Thermal in situwater conservation study, a summary report.Alberta Innovates—Energy and Environment Solutions. www.ai-ees.ca/media/6868/thermal-in-situ-water-summary-report.pdf.Accessed 10 Dec 2015
Jacobs Consultancy, Suncor Energy Services Inc. (2012) Climate changeand emissions management corporation (CCEMC). A greenhousegas reduction roadmap for oil sands. Climate Change and EmissionsManagement Corporation (CCEMC). http://sustainability.suncor.com/2014/pdf/CCEMC-Suncor_GHG_Reduction_Roadmap-Final_Jacobs_Report.pdf. Accessed 12 Dec 2015
Jagannath A, Almansoori A (2016) Sequential synthesis of heat integrat-ed water networks: a new approach and its application to small andmedium sized examples. Comput Chem Eng 90:44–61. doi:10.1016/j.compchemeng.2016.04.016
Kawaguchi H, Li Z, Masuda Y, Sato K, Nakagawa H (2012) Dissolvedorganic compounds in reused process water for steam-assisted grav-ity drainage oil sands extraction. Water Res 46:5566–5574. doi:10.1016/j.watres.2012.07.036
Kemp IC (2007) Pinch analysis and process integration: a user guide onprocess integration for the efficient use of energy, 2nd edn.Butterworth-Heinemann, Amsterdam
Klemeš JJ, Kravanja Z (2013) Forty years of heat integration: pinchanalysis (PA) and mathematical programming (MP). Curr OpinChem Eng, Biotechnology and bioprocess engineering/Process sys-tems engineering 2:461–474. doi:10.1016/j.coche.2013.10.003
Klemeš JJ, Varbanov PS, Kravanja Z (2013) Recent developments inprocess integration. Chem Eng Res Des 91:2037–2053
Linnhoff (1998) Introduction to pinch technology. Northwich, Cheshire,England
Linnhoff B, Hindmarsh E (1983) The pinch design method for heat ex-changer networks. Chem Eng Sci 38:745–763
Manan ZA, Tea SY, Alwi SRW (2009) A new technique for simultaneouswater and energy minimisation in process plant. Chem Eng Res Des87:1509–1519
Nadella N (2010) Improving energy efficiency in thermal oil recovery. In:Improving energy efficiency in thermal oil recovery. Presented at theWorld Energy Congress, Montreal
Papalexandri KP, Pistikopoulos EN (1994) A multiperiod MINLP modelfor the synthesis of flexible heat and mass exchange networks.Comput Chem Eng 18:1125–1139
Pedenaud P, Goulay C, Michaud P (2005) Oily water treatment schemesfor steam generation in SAGD heavy oil developments. Society ofPetroleum Engineers. doi:10.2118/97750-MS
Peterson D, West HPD, Washington B (2007) Guidelines for producedwater evaporators in SAGD. IWC 7:68
Polley GT, Picón-Núñez M, de Jesús López-Maciel J (2010) Design ofwater and heat recovery networks for the simultaneous minimisationof water and energy consumption. Appl Therm Eng., Selected Papersfrom the 12th Conference on Process Integration, Modelling andOptimisation for Energy Saving and Pollution Reduction 30:2290–2299. doi:10.1016/j.applthermaleng.2010.03.031
Savulescu L (1999) Simultaneous energy and water minimisation.UMIST, Department of Process Integration, Manchester
106 Process Integr Optim Sustain (2017) 1:87–107

Savulescu L, Alva-Argaez A (2013) Chapter 15: process integration con-cepts for combined energy and water integration. In: Klemeš JJ (ed)Handbook of process integration (PI). Woodhead Publishing Seriesin Energy. Woodhead Publishing, p 461–483
Savulescu L, Kim JK, Smith R (2005a) Studies on simultaneous energyand water minimisation—part I: systems with no water re-use.Chem Eng Sci 60:3279–3290. doi:10.1016/j.ces.2004.12.037
Savulescu L, Kim JK, Smith R (2005b) Studies on simultaneous energyand water minimisation—part II: systems with maximum re-use ofwater. Chem Eng Sci 60:3291–3308. doi:10.1016/j.ces.2004.12.036
Savulescu LE, Alva-Argaez A (2008) Direct heat transfer considerationsfor improving energy efficiency in pulp and paper Kraft mills.Energy 33:1562–1571
Sum Ng DK, Yee Foo DC (2006) Evolution of water network usingimproved source shift algorithm and water path analysis. Ind EngChem Res 45:8095–8104
Turton R, Bailie RC, Whiting WB, Shaeiwitz JA, Bhattacharyya D(2012) Analysis, synthesis and design of chemical processes, 4thedn. Prentice Hall, Upper Saddle River
Walas SM (1988) Chemical process equipment: selection and design,new edition. Butterworth-Heinemann, Boston
Wang YP, Smith R (1994) Design of distributed effluent treatment sys-tems. Chem Eng Sci 49:3127–3145. doi:10.1016/0009-2509(94)E0126-B
Xiao W, Zhou R, Dong HG, Meng N, Lin CY, Adi VSK (2009)Simultaneous optimal integration of water utilization and heat ex-change networks using holistic mathematical programming. KoreanJ Chem Eng 26:1161–1174
Yee TF, Grossmann IE (1990) Simultaneous optimization models for heatintegration—II. Heat exchanger network synthesis. Comput ChemEng 14:1165–1184
Zaidi A, Leopold G (2010) Produced water treatment—theory and prac-tice. CANMET, Energy, Mines and Resourced
Process Integr Optim Sustain (2017) 1:87–107 107