energy use of fine grinding in mineral processing - … use of fine grinding in mineral processing...
TRANSCRIPT
Energy Use of Fine Grinding in Mineral Processing
JAN DE BAKKER
Fine grinding, to P80 sizes as low as 7 lm, is becoming increasingly important as mines treat oreswith smaller liberation sizes. This grinding is typically done using stirredmills such as the Isamill orStirredMediaDetritor.While fine grinding consumes less energy than primary grinding, it can stillaccount for a substantial part of a mill’s energy budget. Overall energy use and media use arestrongly related to stress intensity, as well as to media size and quality. Optimization of grindingmedia size and quality, as well as of other operational factors, can reduce energy use by a factor oftwo or more. The stirred mills used to perform fine grinding have additional process benefits, suchas polishing the mineral surface, which can enhance recovery.
DOI: 10.1007/s40553-013-0001-6� The Minerals, Metals & Materials Society and ASM International 2013
I. INTRODUCTION
FINE grinding is becoming an increasingly commonunit operation in mineral processing. While fine grindingcan liberate ores that would otherwise be considereduntreatable, it can entail high costs in terms of energyconsumption and media use. These costs can be mini-mized by performing adequate test work and selectingappropriate operating conditions. This paper reviewsfine grinding technology, research, and plant experienceand seeks to shed light on ways in which operators canreduce both operating costs and the environmentalfootprint of their fine grinding circuit.
This paper will begin by giving an overview of finegrinding and the equipment used. It will then discussenergy–product size relationships and modeling effortsfor stirred mills in particular. The paper will go on tocover typical test work requirements, the effect of mediasize, and the contained energy in media. In closing,specific case studies will be reviewed.
II. ENERGY USE IN COMMINUTION
Grinding activities in general (including coarse, inter-mediate, and fine grinding) account for 0.5 pct of U.S.primary energy use, 3.8 pct of total U.S. electricityconsumption, and 40 pct of total U.S. mining industryenergy use. Large energy saving opportunities have beenidentified in grinding in particular.[1]
Table I shows a very large disparity between thetheoretical minimum energy used in grinding and theactual energy used. More interestingly, a fairly largedifference remains even between ‘‘Best Practice’’ grindingenergy use and current energy use. This suggests that largesavings in grinding energy (and associated savings in
maintenance, consumables, and capital equipmentneeded)could be obtained by improving grinding operations.As fine grinding is typically used on regrind applica-
tions, the feed tonnages to fine grinding circuits aresmall compared to head tonnages, typically 10 to 30 tph.However, the specific energies are often much largerthan those encountered in intermediate milling and canbe as high as 60 kWh/t. Total installed power in a finegrinding circuit can range from several hundred kW toseveral MW; for example, the largest installed Isamillhas 3 MW installed power.[3] This quantity is smallcompared to the power used by a semi-autogenous milland a ball mill in a primary grinding circuit; a ball millcan have an installed power of up to 15 MW, whileinstalled power for a SAG mill can go up to 25 MW.However, the energy used for fine grinding is stillsignificant. Moreover, as this paper seeks to demon-strate, large energy reduction opportunities are fre-quently found in fine grinding.
III. OVERVIEW OF FINE GRINDING
Grinding canbe classified into coarse, intermediate, andfine grindingprocesses. These differ in the equipmentused,the product sizes attained, and the comminution mecha-nisms used. The boundaries between these size classesmust always be drawn somewhat arbitrarily; for thispaper, the boundaries are as given inTable II.As shown inthe table, coarse grinding typically corresponds tousing anAG or SAG mill, intermediate grinding to a ball mill ortower mill, and fine grinding to a stirred mill such as anIsamill or Stirred Media Detritor (SMD). Of course,various exceptions to these typical values can be found.In fine grinding, a material with an F80 of less than
100 lm is comminuted to a P80 of 7 to 30 lm. (P80s of2 lm are at least claimed by equipment manufacturers.)The feed is typically a flotation concentrate, which isreground to liberate fine particles of the value mineral.The three modes of particle breakage are impact;
abrasion, in which two particles shear against eachother; and attrition, in which a small particle is sheared
JAN DE BAKKER, Metallurgist, is with BBA, Inc., 630 Rene-Levesque Blvd. West, Suite 1900, Montreal, QC H3B 4V5, Canada.Contact e-mail: [email protected]
Manuscript submitted April 25, 2013.Article published online December 18, 2013
8—VOLUME 1E, MARCH 2014 METALLURGICAL AND MATERIALS TRANSACTIONS E
between two larger particles or media moving atdifferent velocities. In fine grinding, breakage is domi-nated by attrition alone.[4] In stirred mills, this isaccomplished by creating a gradient in the angularvelocity of the grinding media along the mill’s radius.
IV. EQUIPMENT USED
A. High-Intensity Stirred Mills
Fine grinding is usually performed in high-intensitystirred mills; several manufacturers of these stirred millsexist. Two frequently used stirred mills include theIsamill, produced by Xstrata Technology, and the SMD,produced by Metso (Figure 1). A third mill, the Knel-son–Deswik mill (now the FLS stirred mill), is a relativenewcomer to the stirred milling scene, having beendeveloped through the 1990s and the early 2000s.[5] Inall these mills, a bed of ceramic or sand is stirred at highspeed. Ceramic media sizes in use range from 1 to6.5 mm.
The Isamill and the SMD have very similar grindingperformance. Grinding the same feed using the samemedia, Nesset et al.[7] found that the Isamill and SMDhad very similar specific energy use. Gao et al.[8]
observed that an Isamill and SMD, grinding the samefeed with the same media, produced very similar productparticle size distributions (PSDs). This similarity inperformance has also been observed in other operations.
Nevertheless, there are important differences. In theIsamill, the shaft is horizontal and the media are stirredby disks, while in the SMD, the stirring is performed bypins mounted on a vertical shaft. In an SMD, the
product is separated from the media by a screen; theIsamill uses an internal centrifugation system. Thismeans that the screens in an SMD constitute a wear partthat must be replaced, while for the Isamill, the sealsbetween the shaft and body constitute important wearparts. Liner changes and other maintenance are claimedby Xstrata Technology to be much easier than in anSMD: While an SMD’s liner is removed in eight parts,the Isamill’s liner can be removed in two pieces, with theshell sliding off easily.[3] The Knelson–Deswik mill is topstirred and can therefore be considered to be similar toan SMD.[5]
An important difference among the Isamill, the SMD,and the Knelson–Deswik mill is that of scale. The largestIsamill installed at time of writing had 3 MW ofinstalled power; an 8 MW Isamill is available, butappears not to have yet been installed.[3] The largestSMD available has 1.1 MW of installed power; one 1.1-MW SMD has been installed. The next largest size SMDhas 355 kW of installed power.[6] Thus, several SMDsare often installed for a fine grinding circuit, while thesame duty would be performed by a single Isamill.SMDs are typically arranged in series, with the productof one becoming the feed for the other. This has theadvantage that each SMD in the line can have its mediaand operating conditions optimized to the particle sizeof its particular feed. The largest installed power in aKnelson–Deswik mill is 699 kW[5]; this places it in anintermediate position between the 355-kW and 1.1-MWSMDs.In 2012, FLSmidth reported that it had acquired the
Knelson–Deswik mill; the mill is now known as theFLSmidth stirred mill. An FLSmidth stirred mill will beinstalled to perform a copper concentrate regrind inMongolia.[9] It is speculated that the mill will continue tobe scaled up under its new owners to allow it toeffectively compete against the SMD and Isamill.
B. Fine Grinding in Gravity-Induced Stirred Mills andBall Mills
Gravity-induced stirred (GIS) mills include the Towermill, produced by Nippon Eirich, and the Vertimill,produced by Metso. Grinding to below 40 lm in GISmills or ball mills is usually not recommended. In theirproduct literature, Metso give 40 lm as the lower end ofthe ‘‘optimal’’ P80 range for Vertimills.[6] At lowerproduct sizes, both tower mills and ball mills willovergrind fines. At Mt. Isa Mines, a GIS mill fed withmaterial of F80 approximately 50 lm lowered the P80size by only 5 to 10 lm, at the same time producing a
Table I. Energy Consumption in Total, in the Mining Indus-try, and in Grinding[1,2]
CategoryEnergy Use9 109 kWh
Total U.S. primary energy use (2011) 28,509Total U.S. electricity consumption (aftertransmission and distribution losses, 2011)
3856
Total energy use in mining (2007) 365Energy used in grinding activities (U.S. coal,metals, and minerals mining, 2007)
145
‘‘Best Practice’’ energy use in grinding (U.S. coal,metals, and minerals mining, 2007)
123
Theoretical minimum energy use in grinding(U.S. coal, metals, and minerals mining,2007)
0.6
Table II. Comminution Equipment, Size Classes, and Grinding Mechanisms
Grinding Level Equipment ‘‘Typical’’ P80 (lm) Dominant Breakage Mechanism*
Coarse AG/SAG mill 500 to 10,000 impact+abrasion+attritionIntermediate ball mill 40 to 400 impact+attrition
tower mill 40 to 400 attritionFine stirred mills <30 attrition
*See Ref. [4]
METALLURGICAL AND MATERIALS TRANSACTIONS E VOLUME 1E, MARCH 2014—9

large amount of fines.[10] Similarly, in ball mills, it isknown that grinding finer than approximately 40 lmwill result in overgrinding of fines as well as high mediaconsumption. However, it must be noted that theproduct size to which a mill can efficiently grind dependson the feed material, the F80, and media type and size.A Vertimill has been used to grind to sizes below10 lm.[11]
The phenomenon of overgrinding is largely the resultof using media that are too large for the product sizegenerated. The smallest ball size typically charged intoball mills and tower mills is ½ inch (12.5 mm), althoughmedia diameters as small as 6 mm have been usedindustrially in Vertimills.[11]
In a laboratory study by Nesset et al.,[7] a GIS millcharged with 5-mm steel shot, and with other operatingconditions similarly optimized, achieved high energyefficiencies when grinding to less than 20 lm. Thisappears to qualitatively confirm the notion that finegrinding requires smaller media sizes. In the case of theNesset study, the power intensity applied to the labo-ratory tower mill was low—that is, the shaft was rotatedslowly in order to obtain this high efficiency, leading tolow throughput. This suggests that charging GIS millswith small media may not be practicable in plantoperation.
C. Millpebs
Millpebs have been used as grinding media to achievefine grinding in ball mills. These are 5- to 12-mmspherical or oblong cast steel pellets, charged into ballmills as a replacement of, or in addition to, balls. WhileMillpebs can give significantly lower energy use whengrinding to finer sizes, they also can lead to high finesproduction and high media use.
Millpebs were tested for fine grinding at the Brunswickconcentrator. The regrind ball mills at the concentratorused 25-mm slugs to produce a P80 of 28 lm. In one of theregrind mills, the slugs were replaced by Millpebs; thesewere able to consistently maintain a P80 of 22 lm whiledecreasing the power draw by 20 pct. However, media useincreased by 50 pct and the production of fines of less than16 lmdiameter increasedbya factorof 5.[12] The observeddrop in specific energymaybe due to the fact thatMillpebshad smaller average diameters than the slugs and so weremore efficient at grinding to the relatively small productsizes required. It is therefore unclear whether the perfor-mance of Millpebs would be better than that of conven-tional 12-mm steel balls. To the best of the author’sknowledge, no performance comparison between Mill-pebs and similarly sized balls has been performed.
D. Other Fine Grinding Technologies
A host of other technologies exist to produce finegrinding, including jet mills, vibrating mills, roller mills,etc. However, none of these technologies has reached thesame unit installed power as stirred mills. For example,one of the largest vibrating mills has an installed powerof 160 kW.[13] Therefore, these mills are considered asfilling niche roles and are not treated further in thisreview. A fuller discussion of other fine grindingtechnologies can be found in a review by Orumwenseand Forssberg.[14]
E. Other Advantages to Stirred Milling
Several advantages to stirred milling have been foundapart from the efficient comminution of particles.Neese et al.[15] subjected 50- to 150-lm sand contam-
inated with oil to cleaning in a stirred mill in the
Fig. 1—Left: Isamill.[3] Right: SMD.[6] Figures used with permission.
10—VOLUME 1E, MARCH 2014 METALLURGICAL AND MATERIALS TRANSACTIONS E
laboratory. The mill operated at low stress intensities: Alow speed and small-size media (200- to 400-lm quartzor steel beads) were used. These conditions allowed theparticles to be attrited without being broken. As a result,a large part of the oil contaminants was moved to the�5-lm portion of the product. This treatment may holdpromise as an alternative means of processing bitumi-nous sands, for example, in northern Alberta.
The Albion process uses ultrafine grinding toenhance the oxidation of sulfide concentrates in treat-ing refractory gold ores.[16] In the process, the flotationconcentrate is ground to a P80 of 10 to 12 lm. Theproduct slurry is reacted with oxygen in a leach tank atatmospheric pressure; limestone is added to maintainthe pH at 5 to 5.5. The leach reaction is autothermaland is maintained near the slurry boiling point.Without the fine grinding step, an autoclave wouldbe required for the oxygen leaching process. It ishypothesized that the fine grinding enhances leachkinetics by increasing the surface area of the particles,as well as by deforming the crystal lattices of theparticles.
Numerous researchers, for example, Buys et al.,[17]
report that stirred milling increases downstream flota-tion recoveries by cleaning the surface of the particles.The grinding media used in stirred mills are inert, andtherefore corrosion reactions, which occur with steelmedia in ball mills, are not encountered. Corrosionreactions change the surface chemistry of particles,especially with sulfide feeds, and hamper downstreamflotation.
Further increases in flotation recoveries are obtainedby limiting the amount of ultrafine particles formed;stirred mills can selectively grind the larger particles inthe feed with little increase in ultrafines production.Ultrafine particles are difficult to recover in flotation.
V. SPECIFIC ENERGY: PRODUCT SIZERELATIONS
A. Validity Range of the Bond Equation
In intermediate grinding to approximately 75 lm, theBond equation (Eq. [1]) is used to relate feed size,product size, and mechanical energy applied. Below75 lm, correction factors can be applied to extend itsrange of validity.[4]
W ¼ 10Wi P80ð Þ�0:5� F80ð Þ�0:5h i
½1�
where W is the specific grinding energy (kWh/t), Wi isthe Bond ball mill work index (kWh/t), F80 is the feed80 pct passing size (lm), and P80 is the product 80 pctpassing size (lm).
It can be seen that in the regime in which the Bondequation is valid, energy use increases exponentially asproduct size decreases with constant feed size, with anexponent of (approximately) �0.5.
For P80s finer than 75 lm, the Levin test, a modifiedBond ball mill work index test, may be used to predictgrinding performance.[18]
B. Signature Plots
No general work index formula governing energy useover a range of conditions, like the Bond equation forintermediate grinding, has yet been found for the finegrinding regime. Instead, the work-to-P80 curve isdetermined in the laboratory for each case. The energyuse usually fits an equation of the form
W ¼ A P80ð Þk ½2�
where W is the specific grinding energy (kWh/t), P80 theproduct 80 pct passing size (lm), and A and k are theconstants.Taking the logarithm of both sides, one obtains a
linear equation,
logW ¼ logAþ k � log P80 ½3�
and the specific energy vs P80 curve is usually plotted onlog–log axes. This is referred to as a ‘‘signature plot’’; anexample is given in Figure 2.Values for the exponent k have been found in the
range �0.7 to �3.5, meaning that the work to grindincreases more rapidly as grind size decreases than inintermediate grinding. The specific energy vs productsize curve has a much steeper slope in this region than inintermediate grinding.The values of k and A are specific to the grinding
conditions used in the laboratory tests. Changes in feedsize, media size distribution, and in other propertiessuch as media sphericity and hardness can change bothk and A, often by very large amounts. Media size andF80 appear to be the most important determinants ofthe signature plot equation.The connections (if any) between k and A and various
operating conditions remain unknown. Because of therelatively recent advent of stirred milling in mineralprocessing, fine grinding has not been studied to thesame extent as grinding in ball mills (which of courseentail much larger capital and energy expenditures inany case). One of the research priorities in the field ofstirred milling should be the investigation of the effectsof F80 and media size on the position of the signatureplots. If analogous formulas to the Bond ball mill workformula and the Bond top ball size formula can befound, the amount of test work required for stirredmilling would be greatly reduced.
C. Surface Area Production Analysis
Larson et al.[19] found thatwhen specific energy is plottedagainst the square of the percent particles in the productpassing a given size (a proxy for particle surface area), astraight line is obtained. This is demonstrated in Figure 3.In contrast to the conventional signature plot, this
function gives zero energy at the mill feed. It is thereforehypothesized that if a squared function plot is obtainedby test work for one feed particle size, the plot foranother feed particle size can be obtained simply bychanging the intercept of the line while keeping the slopethe same. Therefore, the squared function plot allowsthe effect of changes in both F80 and P80 to be modeled.
METALLURGICAL AND MATERIALS TRANSACTIONS E VOLUME 1E, MARCH 2014—11

While the Squared Function Plot is intriguing, exper-imental validation of its applicability has not yet beenpublished. It nevertheless remains an interesting topicfor further investigation and if validated may be used inthe future as an alternative measure of specific energy.
A similar analysis has been performed by Musa andMorrison,[21] who developed a model to determine thesurface area within each size fraction of mill product.They defined a ‘‘marker size’’ below which 70 to 80 pctof the product surface area was contained; the markersize thus served as a proxy for surface area production.Specific energy use was then defined as kWh of powerper the tonne of new material generated below themarker size. Musa and Morrison found that by definingspecific energy in this way, it was possible to accuratelypredict the performance of full-scale Vertimills andIsamills from laboratory tests.
VI. STRESS INTENSITY
A. Overview
Blecher and coworkers[22,23] found that stress intensitycombines the most important variables determiningmilling performance. Stress intensity for a horizontalstirred mill, with media much harder than the mineral tobe ground, is defined as in Eq. [4].
SIs ¼ D3 qm � qsð Þv2t ½4�
where SIs is the stress intensity (stirring), D the mediadiameter, qm the media density, qs the slurry density,and vt is the impeller tip speed.Note that the stress intensity is strongly sensitive to
changes in media diameter (to the third power), is lesssensitive to stirrer tip speed (to the second power), and isrelatively insensitive to media and slurry density.Jankovic[24] expanded the idea of stress intensity to
include gravitational stress intensity:
SIg ¼ D2ðqm � qsÞgh ½5�
where SIg is the stress intensity (gravitational), g thegravitational acceleration, and h is the media bed depth.For vertical stirred mills such as the SMD and tower
mill, both SIs and SIg are non-zero. For horizontalstirred mills such as the Isamill, net gravitational SI iszero due to symmetry along the horizontal axis. There-fore, for horizontal stirred mills, only SIs need be takeninto consideration.Kwade and coworkers noted that, at a given specific
energy input, the product P80 obtainable varies withstress intensity and passes through a minimum. Productsize at a given energy input can be viewed as a measureof milling efficiency; therefore, milling efficiency reachesa maximum at a single given stress intensity. This idea
Fig. 3—‘‘Squared function’’: specific energy is linear with the squareof the percent passing a given size. After Larson et al.[19]
Fig. 2—Signature plot (specific energy vs P80 curve) for Brunswick concentrator Zn circuit ball mill cyclone underflow; F80 = 63 lm. The plotsgive results for grinding the same feed using different mills and media. After Nesset et al.[7]
12—VOLUME 1E, MARCH 2014 METALLURGICAL AND MATERIALS TRANSACTIONS E
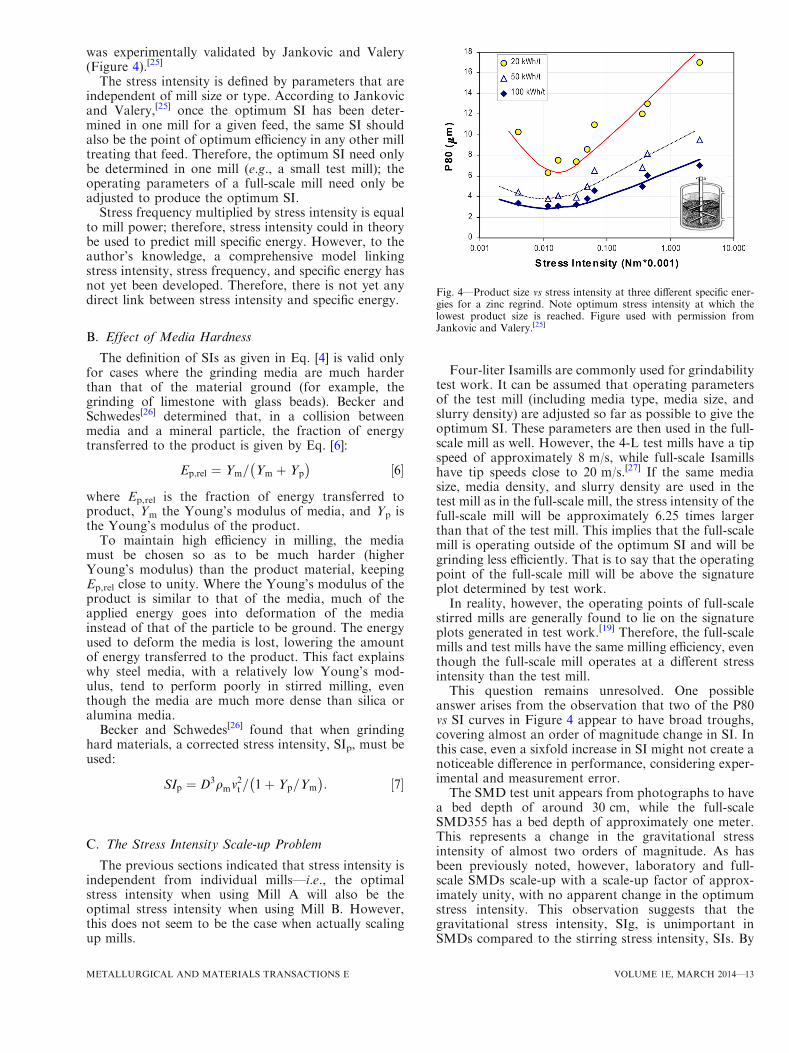
was experimentally validated by Jankovic and Valery(Figure 4).[25]
The stress intensity is defined by parameters that areindependent of mill size or type. According to Jankovicand Valery,[25] once the optimum SI has been deter-mined in one mill for a given feed, the same SI shouldalso be the point of optimum efficiency in any other milltreating that feed. Therefore, the optimum SI need onlybe determined in one mill (e.g., a small test mill); theoperating parameters of a full-scale mill need only beadjusted to produce the optimum SI.
Stress frequency multiplied by stress intensity is equalto mill power; therefore, stress intensity could in theorybe used to predict mill specific energy. However, to theauthor’s knowledge, a comprehensive model linkingstress intensity, stress frequency, and specific energy hasnot yet been developed. Therefore, there is not yet anydirect link between stress intensity and specific energy.
B. Effect of Media Hardness
The definition of SIs as given in Eq. [4] is valid onlyfor cases where the grinding media are much harderthan that of the material ground (for example, thegrinding of limestone with glass beads). Becker andSchwedes[26] determined that, in a collision betweenmedia and a mineral particle, the fraction of energytransferred to the product is given by Eq. [6]:
Ep;rel ¼ Ym= Ym þ Yp
� �½6�
where Ep,rel is the fraction of energy transferred toproduct, Ym the Young’s modulus of media, and Yp isthe Young’s modulus of the product.
To maintain high efficiency in milling, the mediamust be chosen so as to be much harder (higherYoung’s modulus) than the product material, keepingEp,rel close to unity. Where the Young’s modulus of theproduct is similar to that of the media, much of theapplied energy goes into deformation of the mediainstead of that of the particle to be ground. The energyused to deform the media is lost, lowering the amountof energy transferred to the product. This fact explainswhy steel media, with a relatively low Young’s mod-ulus, tend to perform poorly in stirred milling, eventhough the media are much more dense than silica oralumina media.
Becker and Schwedes[26] found that when grindinghard materials, a corrected stress intensity, SIp, must beused:
SIp ¼ D3qmv2t = 1þ Yp=Ym
� �: ½7�
C. The Stress Intensity Scale-up Problem
The previous sections indicated that stress intensity isindependent from individual mills—i.e., the optimalstress intensity when using Mill A will also be theoptimal stress intensity when using Mill B. However,this does not seem to be the case when actually scalingup mills.
Four-liter Isamills are commonly used for grindabilitytest work. It can be assumed that operating parametersof the test mill (including media type, media size, andslurry density) are adjusted so far as possible to give theoptimum SI. These parameters are then used in the full-scale mill as well. However, the 4-L test mills have a tipspeed of approximately 8 m/s, while full-scale Isamillshave tip speeds close to 20 m/s.[27] If the same mediasize, media density, and slurry density are used in thetest mill as in the full-scale mill, the stress intensity of thefull-scale mill will be approximately 6.25 times largerthan that of the test mill. This implies that the full-scalemill is operating outside of the optimum SI and will begrinding less efficiently. That is to say that the operatingpoint of the full-scale mill will be above the signatureplot determined by test work.In reality, however, the operating points of full-scale
stirred mills are generally found to lie on the signatureplots generated in test work.[19] Therefore, the full-scalemills and test mills have the same milling efficiency, eventhough the full-scale mill operates at a different stressintensity than the test mill.This question remains unresolved. One possible
answer arises from the observation that two of the P80vs SI curves in Figure 4 appear to have broad troughs,covering almost an order of magnitude change in SI. Inthis case, even a sixfold increase in SI might not create anoticeable difference in performance, considering exper-imental and measurement error.The SMD test unit appears from photographs to have
a bed depth of around 30 cm, while the full-scaleSMD355 has a bed depth of approximately one meter.This represents a change in the gravitational stressintensity of almost two orders of magnitude. As hasbeen previously noted, however, laboratory and full-scale SMDs scale-up with a scale-up factor of approx-imately unity, with no apparent change in the optimumstress intensity. This observation suggests that thegravitational stress intensity, SIg, is unimportant inSMDs compared to the stirring stress intensity, SIs. By
Fig. 4—Product size vs stress intensity at three different specific ener-gies for a zinc regrind. Note optimum stress intensity at which thelowest product size is reached. Figure used with permission fromJankovic and Valery.[25]
METALLURGICAL AND MATERIALS TRANSACTIONS E VOLUME 1E, MARCH 2014—13

contrast, in GIS mills, where full-size units have beddepths of ten meters or more, gravitational stressintensity can be expected to be much more importantin full-size units than in test units, adding a complicatingfactor to GIS mill scale-up.
VII. OTHER MODELING EFFORTS
Factorial design experiments were performed by Gaoet al.[28] and Tuzun and Loveday[29] to determine theeffect of various operating parameters on the power useof laboratory mills. Power models were determinedgiving the impact of different parameters as powerequations with linear and nonlinear terms. The derivedmodels did not appear to be applicable to mills otherthan the particular laboratory units being studied.
VIII. TEST WORK
In ball milling, the Bond ball mill work index can beused to determine specific energy at a range of feed andproduct sizes. The Bond top size ball formula can beused to estimate the media size required. No suchstandard formulas exist in fine grinding. Energy andmedia parameters must instead be determined in thelaboratory for every new combination of operatingconditions such as feed size, media size, and media type.
For the Isamill, test work is usually performed with a4-L bench-scale Isamill. Approximately 15 kg of thematerial to be ground is slurried to 20 pct solid densityby volume. The slurry is then fed through the mill andmill power is measured. The product’s PSD is measured,additional water is added if needed, and the material issent through the mill again. This continues until thetarget P80 is reached; typically, there will be 5 to 10passes through the mill. The test work will produce a
signature plot and media consumption data as thedeliverables.Test work for the SMD proceeds in a very similar
fashion, except that a 1.4-L bench-scale SMD is used.Typically, approximately 500 g of sample is required.In contrast to laboratory-scale testing for ball mills
and AG/SAG mills, test work results for stirred millscan be used for sizing full-size equipment with a scale-upfactor close to one. Larson et al.[19,20] found a scale-upfactor for the Isamill of exactly 1, while Gao et al.[8]
imply that the scale-up factor for SMDs is 1.25.A common error in test work is using monosize media
(e.g., fresh 2-mm media loaded into in the mill) asopposed to ‘‘aged’’ media with a distribution of particlesizes. The aged media will grind the smaller feedparticles more efficiently. Therefore, using ‘‘fresh’’media will give a higher specific energy than in reality.[30]
Another pitfall is coarse holdup in the mill. If the millis not sufficiently flushed, coarse particles will be keptinside the mill. The mill product then appears finer thanit in reality is. This leads to lower estimates of specificenergy than reality.[19]
Other sources of error in test work are reviewed inpapers by Larson et al.[19,20]
IX. PARTICLE SIZE DISTRIBUTIONS
In ball milling, the product particle size distribution(PSD) can usually be modeled as being parallel to thefeed PSD on a log-linear plot.[4] When grinding to finersizes in ball mills, the parallel PSDs mean that largeamounts of ultrafine particles are produced. This con-sumes a large amount of grinding energy while produc-ing particles which are difficult to recover in subsequentprocessing steps such as flotation.By contrast, stirred mills have been noted to produce a
steeperproductPSDthan feed.This is illustrated inFigure 5.
Fig. 5—Feed and product size distribution for an Isamill regrind at Cosmos mine, Australia. Figure used with permission from Curry et al.[31]
14—VOLUME 1E, MARCH 2014 METALLURGICAL AND MATERIALS TRANSACTIONS E

As shown in the figure, at the left end of the graph,the product PSD is very close to the feed PSD; at theright, the two PSDs are widely spaced. This indicatesthat the mill is efficiently using its energy to break thetop size particles and is spending very little energy onfurther grinding of fine particles. Thus, the overallenergy efficiency of the fine grinding can be expectedto be good. As a bonus, the tighter PSD makescontrol of downstream processes such as flotationeasier.
In an experimental study, Jankovic and Sinclair sub-jected calcite and silica to fine grinding in a laboratory pinstirred mill, a Sala agitated mill (SAM), and a pilot towermill. The authors found that for each mill, the PSD of theproduct was narrower (steeper) than that of the feed. Inaddition, when grinding to P80s below approximately20 lm in any of the three mills tested, the PSD becamemore narrow (as measured by P80/P20 ratio) as the P80decreased. (When the width of the PSD was calculatedusing an alternative formula, the PSD was only observedto narrow with decreasing P80 when using the pin stirredmill.) The authors concluded that the width of the PSDwas strongly affected by the material properties of thefeed, while not being significantly affected by the mediasize used.[32]
X. MEDIA USE AND CONTAINED ENERGY
A. Typical Media Use
In stirred milling, the most commonly used media areceramic balls of 1 to 5 mm diameter. The ceramic isusually composed of alumina, an alumina/zirconia blend,or zirconium silicate. Ceramic media exist over a widerange of quality and cost, with the lower quality/costceramic having a higherwear rate than higher quality/costceramic.Other operations have used sand asmedia, but atthe time of writing, only two operations continue to usesand.[8,27,33] Mt Isa Mines has used lead smelter slag asmedia; however, it is now using sandmedia.[10,27]Mt Isa isan exception in its use of slag, as a vast majority ofoperations do not have a smelter on-site to provide alimitless supply of free grinding media. However, inlocations where slag is available, it should be consideredas another source of media.
Media use in fine grinding is considered to beproportional to the mechanical energy applied. ‘‘Typi-cal’’ wear rates and costs are given in Table III andFigure 6; these figures can of course vary significantlyfrom operation to operation.
Of course, the choice of media type and quality willdepend on media availability (in the case of sand andslag), wear rate, and price.
Jankovic and Valery[25] reported that media comprisehalf of the operating cost for the SMDs at Century mine.
B. Contained Energy in Media
‘‘Contained energy’’ refers to the energy required toproduce and transport the media, and is distinct fromthe mechanical (electrical) energy used to drive the mill.
Hammond and Jones estimated the contained energy inhousehold ceramics (not taking account of transporta-tion).[39] Hammond and Jones’ estimates range from 2.5to 29.1 MJ/kg, with 10 MJ/kg for ‘‘general’’ ceramicsand 29 MJ/kg for ‘‘sanitary’’ ceramics. Given thatceramic grinding media require very good hardnessand strength, especially compared to household ceram-ics, it is appropriate to estimate its contained energy atthe top end of Hammond and Jones’ range, at 29 MJ/kg.Using 29 MJ/kg for the contained energy of ceramic
media and a wear rate of 35 g/kWh of mechanicalenergy gives a contained energy consumption of0.28 kWh contained per kWh of mechanical energyapplied. A wear rate of 7 g/kWh gives a containedenergy consumption of 0.06 kWh contained per kWh ofmechanical energy applied. Therefore, 6 to 20 pct of theenergy use in fine grinding using ceramic media can berepresented by ‘‘contained energy’’ in the grindingmedia itself.Sand media have much lower contained energy than
ceramic media as the media must simply be mined orquarried rather than manufactured. Hammond andJones report a contained energy of 0.1 MJ/kg. Blakeet al.[36] reported that switching a stirred mill’s mediafrom sand to ceramic results in a mechanical energysavings of 20 pct. Therefore, using sand rather thanceramic media would produce savings in containedenergy, but would cost more in mechanical energy.Likewise, Davey[40] suggests that poor-quality mediawill increase mechanical energy use in stirred milling. Itis speculated that this is due to the lower sphericity of
Table III. Wear Rates and Costs for Fine Grinding Med-
ia[8,27,33–38]
Media TypeTypical WearRate (g/kWh) Cost ($/t)
Ceramic 6 to 35 850 to 4500Sand 50 to 177 100 to 250Silica-alumina-zirconia (SAZ) ‘‘low’’ 25,000Slag as for sand? —
Fig. 6—Media price vs wear.[8,26,31–36]
METALLURGICAL AND MATERIALS TRANSACTIONS E VOLUME 1E, MARCH 2014—15

sand media. On the other hand, the work of Nessetet al.[7] suggests that the energy use between ceramic andsand media of the same size is the same. Slag media,where a smelter is on-site, would probably have thelowest contained energy consumption of the differentmedia types. There is very little transportation, and foraccounting purposes, almost no energy has gone intocreating the media as the granulated slag is a by-productof smelter operation.
Becker and Schwedes[41] point out that with poor-quality media, a significant part of the product willconsist of broken pieces of media, which will affect themeasured product PSD. Clearly, more information onthe relationships between contained energy in media andmedia wear rates is desirable.
XI. EFFECT OF MEDIA SIZE
A. Overview
Of the different operating parameters for stirred mills,media size probably has the biggest influence on overallenergy consumption. The appropriate media size for amill appears to be a function of the F80 and P80required. The grinding media must be large enough tobreak up the largest particles fed to the mill and smallenough to grind the material to the product finenessdesired. As demonstrated by the experience of Centurymine, an inappropriate media size choice can result inenergy consumption double that of optimum opera-tion.[8]
In their laboratory study, Nesset et al.[7] varied anumber of operating parameters for stirred mills andidentified media size as having the largest impact onenergy use. It was also noted that the trials whichproduced the sharpest product PSD were also the oneswhich resulted in the lowest specific energy use.
Gao et al.[8] report that at Century mine, the grindingmedia in SMDs performing regrind duty were changedfrom 1 to 3 mm. This resulted in a drop in energy use ofapproximately 50 pct; the signature plot shifted signif-icantly downward (Figure 7).
Figure 8 shows the product PSD for laboratory SMDtests using 1- and 3-mm media. The PSD for the testusing 1-mm media shows that the SMD produced asignificant amount of fines (20 pct below 4 lm). Themill also had difficulty breaking the top size parti-cles—the 100 pct passing size appears to be almost thesame for both the feed and the product. In contrast, thePSD using 3-mm media shows less fines production(20 pct below 9 lm) and effective top size breakage,with all the particles above 90 lm broken. This is in linewith the observation of Nesset et al.[7] that low energyuse is associated with tight product size distributions.
Mount Isa Mines achieved approximately 25 pctsavings in mechanical energy when it screened the�0.5-mm fraction of the lead smelter slag it used asmedia.[10]
Gao et al.[38] tested copper reverberatory furnace slag(CRFS, SG 3.8) and heavy media plant rejects (HMPR,SG 2.4) in a laboratory stirred mill at two sizes: �0.8/
+0.3 mm, and �1.7/+0.4 mm. For both CRFS andHMPR, the smaller size media gave a lower specificenergy than the larger size media. At the same size, bothCRFS and HMPR had similar specific energy use.
Fig. 7—Signature plots for SMDs at Century mine using 1-mm cera-mic media (in red, higher) and 3-mm media (in blue, lower) (afterGao et al.[8]) (Color figure online).
Fig. 8—Product size distributions for laboratory SMDs at Centurymine using 1- and 3-mm media. Figure used with permission fromGao et al.[8]
Fig. 9—F80 plotted against media size (blue diamonds); P80 plottedagainst media size (red crosses). Century UFG = Century ultrafinegrind; Century Regr. = Century regrind. Data are taken from Casestudies table (Color figure online).
16—VOLUME 1E, MARCH 2014 METALLURGICAL AND MATERIALS TRANSACTIONS E
Table
IV.
Case
StudiesofFineGrindingin
MiningOperations
Operation
Application
Equipment
F80
(lm)
P80
(lm)
Throughput
(TPH)
Media
Sizeand
Consumption
Specific
Energy
(kWh/t)
KLog(A
)Notes
References
Pogo(lab)
gold
regrind
2SMD355sin
series
35
10
11
2-to
3-m
mceramic
60
�2.25
4.01
34
Brunsw
ickMine
sulfideregrind
Millpebsin
BM
35
22
89
50pct
higher
media
use
thanslugsgrindingto
aP80of28
lm
5.4
fines
production
(�16
lm)
wentfrom
2to
10
tph
as
comparedto
previousoper-
ation.Milled
toa
P80
of
28
lm
w/slugs
12
McA
rthur
River
(lab)
Isamill
30
736
�2.83
�1.34
19
MtIsa
zincregrind
Isamill
25
11
1-to
2-m
mleadslag
22
alsohaveGIS
mill,but
overgrindsfines.
Screened
slag
tominim
ize�0.5-m
mfractionofmedia;this
ledto
a25pct
saving
inspecific
energy
10
MtIsa
zincretreatm
ent
Isamill
23
81-to
2-m
mleadslag
48
10
Century
ultrafinegrind
15SMD355s
46
7.5
1-m
msand
37.2
�1.20
2.70
8
Century
regrind
6SMD355s
88
40to
50
3-m
mceramic
(changed
from
1mm)
10to
20
(1mm)
�0.697
(1mm)
2.24 (1mm)
changingto
3-m
mmedia
lowered
power
by
~50pct,
gavesharper
PSD
8
6to
8(3
mm)
�0.985
(3mm)
2.45 (3mm)
Cosm
os
nickel
regrind
M500Isamill
40
20
2-m
mmedia
20
31
Thalanga
copper
regrindofflotation
concentrate
SMD185
60
27
23
7�1.29
2.60
40
Leinster
nickel
regrind
IsamillM3000
60
20
20
Coloradosand
89
12mesh
(2mm).50g/kWh
35
�2.4
4.2
33
Brunsw
ick(lab)
fineregrindofzinc
concentrate
(ball
millcycloneunderflow)
SMD
63
1.1-m
mceramic,
2.2-m
mceramic
�1.23
(1.1
mm)
3.32 (1.1
mm)
7
�0.97
(2.2
mm)
2.63 (2.2
mm)
Brunsw
ick(lab)
fineregrindofzinc
concentrate
(ball
millcycloneunderflow)
Isamill
63
1.1-m
mceramic
�0.93
2.58
7
Anglo
Platinum
flotationconcentrate
regrind
Isamill
69
34
sand
�4/+
1.2
mm;
180g/t
feed
8hofshutdownper
1300h
ofruntime
42
Ernest
Henry
(lab)
regrindofcobbed
magneticsprior
tocleaning(m
agnetite)
Isamill
113
13?
34
6.5-m
mceramic
�1.88
4.14
lower
specific
energythan
aGIS
millwhen
grinding
toless
than65
lm
38,43
Anglo
Platinum
Merensky
WLTR
regrindofflotation
concentrate
from
historicalPttailings
M10000Isamill
design:
75
design:
P90 of
25
lm
53
silica
sand�5/
+3mm,
50g/kWh
design:35
noted
surface
cleaning
ef-
fect,whichim
proved
downstream
flotation.
Product
PSD
noted
tobenarrower
thanfeed
17
actual:40
actual:
P90 of
40
lm
actual:14.5
CenterraKumtor
(lab)
regrindofgold-pyrite
feed
priorto
cyanidation
M10000Isamill
20
10
35
27.5
�3.3
4.74
16,19
MIM
George
Fisher
Pb-Znflotation
concentrate
regrind
M3000Isamill
�1.51
3.36
19
METALLURGICAL AND MATERIALS TRANSACTIONS E VOLUME 1E, MARCH 2014—17
However, the CRFS ground the material much fasterthan HMPR. Possibly, this was due to its higher density.
B. Media Size Benchmarking
Data on F80, P80, and media size were compiled fromthe literature in order to allow benchmarking againstexisting operations. The sources are listed in Table IV.F80 and P80 were plotted against media size; the resultsare given in Figure 9.It can be seen from the figure that as the P80 achieved
decreases, the media size does as well, from 3 mm toachieve 45 lm to 1 mm to achieve under 10 lm. TheF80 decreases with media size in a similar way, from90 lm at 3 mm to 45 lm at 1 mm. Dotted lines havebeen added to Figure 7 to define the region of operationof mills; these delimit a zone in which the stirred mill canbe expected to operate efficiently.In general, for a particular media size, limits on both
F80 and P80 must be respected. For example, the figuresuggests that a mill operating with an F80 of 100 lmshould use 3-mm media, while a mill grinding to below10 lm would need to use 1-mm media. To reduce a feedof 90 lm F80 to 10 lm P80, Figure 9 suggests thatcomminution be done in two stages (two Isamills orSMDs in series) for optimal efficiency. The first stagewould grind the feed from 90 lm to perhaps 45 lmusing 3-mm media, while the second would grind from45 to 10 lm using 1- or 2-mm media.
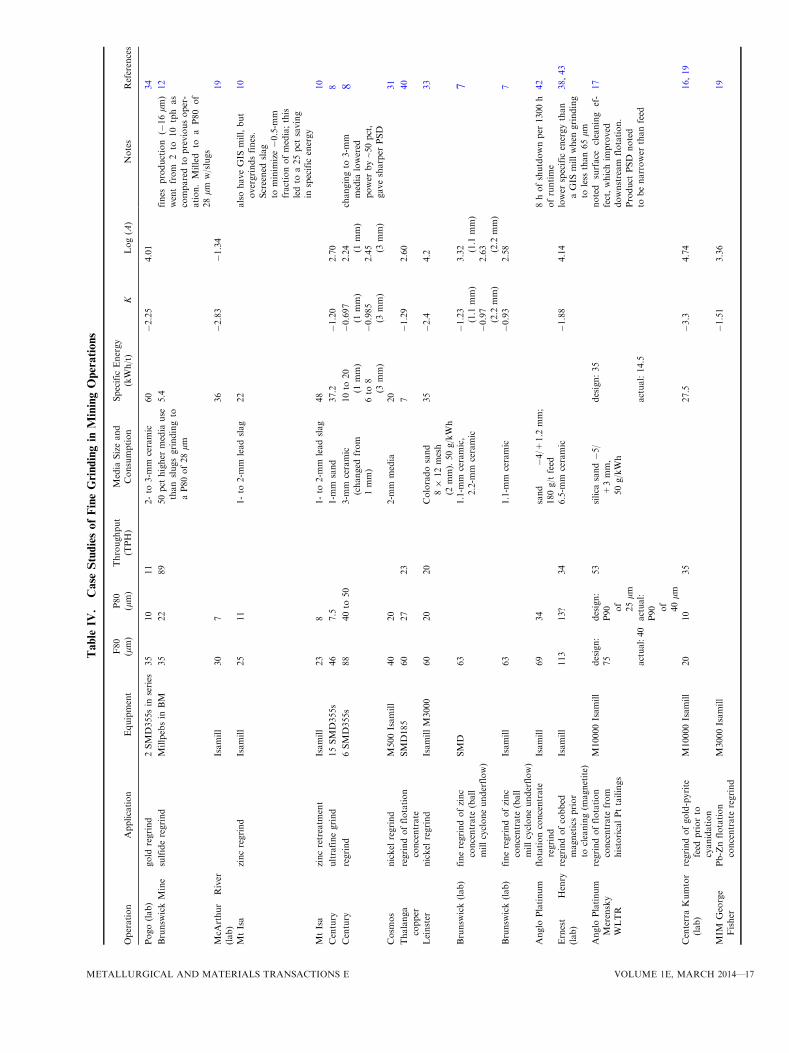
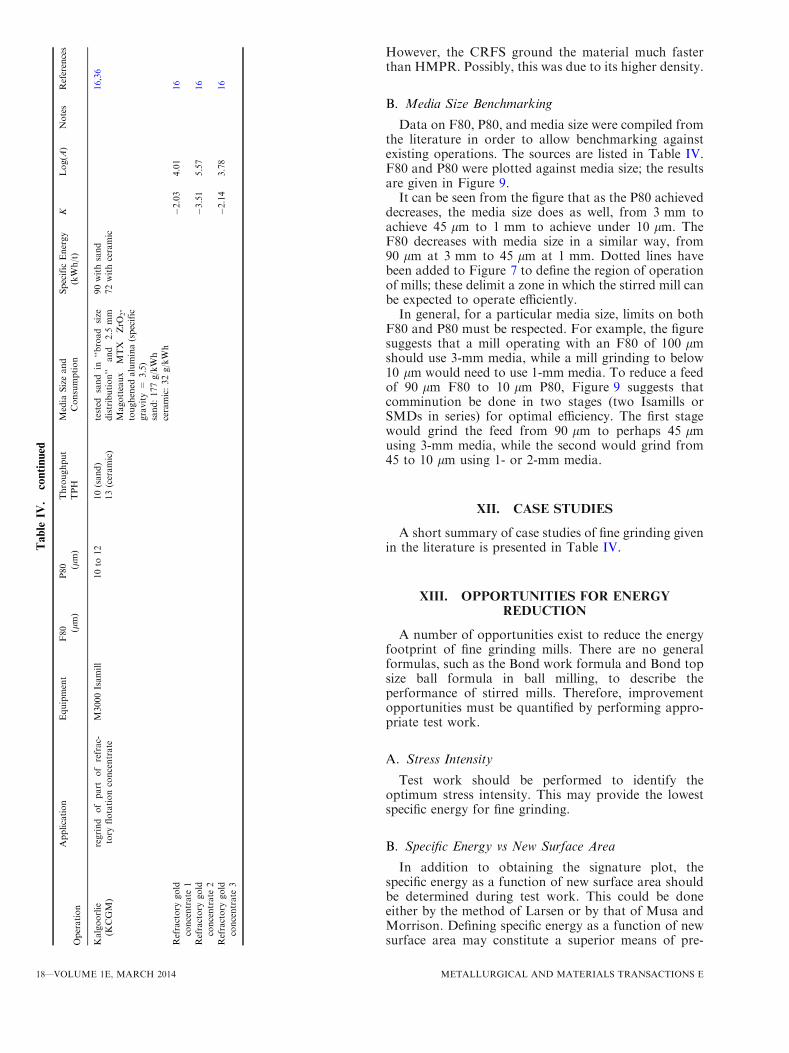
XII. CASE STUDIES
A short summary of case studies of fine grinding givenin the literature is presented in Table IV.
XIII. OPPORTUNITIES FOR ENERGYREDUCTION
A number of opportunities exist to reduce the energyfootprint of fine grinding mills. There are no generalformulas, such as the Bond work formula and Bond topsize ball formula in ball milling, to describe theperformance of stirred mills. Therefore, improvementopportunities must be quantified by performing appro-priate test work.
A. Stress Intensity
Test work should be performed to identify theoptimum stress intensity. This may provide the lowestspecific energy for fine grinding.
B. Specific Energy vs New Surface Area
In addition to obtaining the signature plot, thespecific energy as a function of new surface area shouldbe determined during test work. This could be doneeither by the method of Larsen or by that of Musa andMorrison. Defining specific energy as a function of newsurface area may constitute a superior means of pre-
Table
IV.
continued
Operation
Application
Equipment
F80 (lm)
P80 (lm)
Throughput
TPH
Media
Sizeand
Consumption
Specific
Energy
(kWh/t)
KLog(A
)Notes
References
Kalgoorlie
(KCGM)
regrind
ofpart
ofrefrac-
tory
flotationconcentrate
M3000Isamill
10to
12
10(sand)
tested
sand
in‘‘broad
size
distribution’’
and
2.5
mm
Magotteaux
MTX
ZrO
2-
toughened
alumina(specific
gravity=
3.5)
sand:177g/kWh
ceramic:32g/kWh
90withsand
16,36
13(ceramic)
72withceramic
Refractory
gold
concentrate
1�2.03
4.01
16
Refractory
gold
concentrate
2�3.51
5.57
16
Refractory
gold
concentrate
3�2.14
3.78
16
18—VOLUME 1E, MARCH 2014 METALLURGICAL AND MATERIALS TRANSACTIONS E

dicting the performance of full-scale mills, as opposed todefining specific energy as a function of feed tonnage.
C. Media Size
Media size should be chosen with care. It is recom-mended that test work be done with several media sizesin order to locate the stress intensity optimum. Mediasize can be benchmarked against other operations usingFigure 9.
D. Media Quality and Type
There are indications that lower-quality media, apartfrom degrading faster, require more mechanical energyfor grinding due to factors such as lower sphericity. It isrecommended to perform test work using media ofdifferent quality to determine the effect of media qualityon energy use. Slag and sand media may also beconsidered. Subsequently, a trade-off study involvingmedia cost, electricity cost, improvement in energyefficiency, and contained energy in media should beperformed to identify the best media from an economicand energy footprint standpoint.
REFERENCES1. BCS/U.S. Department of Energy Industrial Technologies Pro-
gram: Mining Industry Energy Bandwidth Study, 2007, availableat http://www1.eere.energy.gov, accessed April 2013.
2. U.S. Energy Information Administration: Annual Energy Review2011, DOE/EIA-0384(2011), 2012.
3. XstrataTechnology: IsamillWebsite, 2013, available at http://www.isamill.com, accessed April 2013.
4. T.J. Napier-Munn, S. Morell, R.D. Morrison, and T. Kojovic:Mineral Processing Circuits: Their Operation and Optimisation,Julius Kruttschnitt Mineral Research Centre, Indoorpilly, QLD,1999.
5. D. Rahal, D. Erasmus, and K. Major: Knelson–Deswick MillingTechnology: Bridging the Gap Between Low and High Speed StirredMills, Paper presented at the 43rd Canadian Mineral ProcessorsMeeting, Ottawa, 2011.
6. Metso: Stirred milling: Vertimill grinding mills and Stirred MediaDetritor (product brochure), 2013, available at http://www.metso.com/miningandconstruction/MaTobox7.nsf/DocsByID/F58680427E2A748F852576C4005210AC/$File/Stirred_Mills_Brochure-2011_LR.pdf, accessed April 21, 2013.
7. J. Nesset, P. Radziszewski, C. Hardie, and D. Leroux: Assessingthe Performance and Efficiency of Fine Grinding Technologies,Paper presented at the 38th Canadian Mineral Processors Meet-ing, Ottawa, 2006.
8. M. Gao, L. Reemeyer, D. Obeng, and R. Holmes: 9th MillOperators’ Conference, Fremantle, Australia, 19–21 March 2007,pp. 105–09.
9. FLSmidth: Acquisition enhances our precious metals offerings,2012, FLSmidth eHighlights April 2012, available at http://www.flsmidth.com/en-US/eHighlights/Archive/Minerals/2012/April/Acquisition+enhances+our+precious+metals+offerings, accessed17 April 2013.
10. M. Gao, M. Young, and P. Allum: IsaMill Fine Grinding Tech-nology and Its Industrial Applications at Mt Isa Mines, Paperpresented at the 34th Canadian Mineral Processors Meeting,Ottawa, 2002.
11. J. Allen: Personal Communication, 2013.12. I. Orford, P. Lacoste-Bouchet, and M. Cooper:Millpebs Testing at
Brunswick Concentrator, Paper presented at the 38th CanadianMineral Processors Meeting, Ottawa, 2006.
13. K. Andres and F. Haude: J. S. Afr. Inst. Min. Metall., 2010,vol. 110, pp. 125–31.
14. O.A. Orumwense and E. Forssberg: Miner. Process. Extr. Metall.Rev., 1992, vol. 11, pp. 107–27.
15. T. Neesse, F. Schaaff, and H. Tiefel: Miner. Eng., 2004, vol. 17,pp. 1163–67.
16. D.W. Turner and M. Hourn: Albion Process for Treatment of Refrac-tory Ores, Paper presented at ALTA 2010, Perth, Australia, 2010.
17. S. Buys, C. Rule, and D. Curry: The Application of Large ScaleStirred Milling to the Retreatment of Merensky Platinum Tailings,Paper presented at the 37th Canadian Mineral Processors Meet-ing, Ottawa, 2005.
18. J. Levin: J. S. Afr. Inst. Min. Metall., 1989, vol. 89 (1), pp. 13–21.19. M. Larson, G. Anderson, R. Morrison, and M. Young: Regrind
Mills: Challenges of Scaleup, Paper presented at SME AnnualMeeting, Feb 27–Mar 2, Denver, CO, 2011.
20. M. Larson, G. Anderson, K. Barns, and V. Villadolid: IsaMill 1:1Direct Scaleup from Ultrafine to Coarse Grinding, Paper presentedat Comminution 2012, 2012.
21. F. Musa and R. Morrison:Miner. Eng., 2009, vol. 22, pp. 593–601.22. L. Blecher, A. Kwade, and J. Schwedes: Powder Technol., 1996,
vol. 86, pp. 59–68.23. A. Kwade, L. Blecher, and J. Schwedes: Powder Technol., 1996,
vol. 86, pp. 69–76.24. A. Jankovic: Miner. Eng., 2001, vol. 14 (10), pp. 1177–86.25. A. Jankovic and W. Valery: Proc. 6th IIR Crushing and Grinding
Conference, Perth, Australia, 29–30 March 2005.26. M. Becker, A. Kwade, and J. Schwedes: Int. J. Miner. Process.,
2001, vol. 61 (3), pp. 189–208.27. M. Larson: Personal Communication, 2013.28. M. Gao, K. Forssberg, and K. Weller: Int. J. Miner. Process.,
1996, vols. 44–45, pp. 641–52.29. M. Tuzun and B. Loveday: Miner. Eng., 1994, vol. 7 (5–6),
pp. 551–60.30. M. Brissette: Personal Communication, 2013.31. D. Curry, M. Cooper, J. Rubenstein, T. Shouldice, and M. Young:
The Right Tools in the Right Place: How Xstrata Nickel AustralasiaIncreased Ni Throughput at Its Cosmos Plant, Paper presented atthe 42nd Canadian Mineral Processors conference, Ottawa, 2010.
32. A. Jankovic and S. Sinclair:Miner. Eng., 2006, vol. 19, pp. 1528–36.33. D.R. Seaman, K. Barns, P. Sharman, S. Thomas, and K. Stokes:
NinthMill Operator’s Conference, 2007, FremantleWA, pp. 131–37.34. G. Davey: Fine Grinding Applications Using the Metso Vertimill
Grinding Mill and the Metso Stirred Media Detritor (SMD) inGold Processing, Paper presented at the 38th Canadian MineralProcessors Meeting, Ottawa, 2006.
35. B. Knorr and J. Allen: Selection Criteria of Stirred Milling Tech-nologies, Paper presented at Comminution ’10, Cape Town, SouthAfrica, 2010.
36. G. Blake, C. Gianatti, and B. Clermont: AusIMM Bull., 2012,vol. 4, pp. 38–42.
37. D.C. Curry and B. Clermont: Improving the Efficiency of FineGrinding—Developments in Ceramic Media Technology, Paperpresented at the Randol Conference, 2005.
38. M. Gao, M. Young, B. Cronin, and G. Harbort: Miner. Metall.Process., 2001, vol. 18 (2), pp. 117–20.
39. G. Hammond and C. Jones: Inventory of Carbon and EnergyV1.6a, University of Bath, Bath, U.K., 2008.
40. G. Davey: Ultrafine and Fine Grinding Using the METSO StirredMedia Detritor (SMD), Paper presented at the 34th CanadianMineral Processors meeting, Ottawa, 2002.
41. M. Becker and J. Schwedes: Powder Technol., 1999, vol. 103 (1–3),pp. 374–81.
42. A.K. Anyimadu, C.M. Rule, and L. Knopjes: J. S. Afr. Inst. Min.Metall., 2007, vol. 107, pp. 15–22.
43. J. Siliezar, D. Stoll, and J. Twomey: Unlocking the Value in Wasteand Reducing Tailings: Magnetite Production at Ernest HenryMining, Paper presented at Iron Ore 2011, Perth, WA, 2011.
METALLURGICAL AND MATERIALS TRANSACTIONS E VOLUME 1E, MARCH 2014—19