energy use and greenhouse gas inventory model for ... · energy use and greenhouse gas inventory...
TRANSCRIPT
39CLIMATECHANGE RESEARCHREPORTCCRR-39
Responding to
Climate Change
Through Partnership
Ministry of Natural Resources Energy Use and Greenhouse Gas Inventory Model for Harvested Wood Product Manufacture in Ontario

Climate change will affect all MNR programs and the natural resources for which it has responsibility. This strategy confirms MNR’s commitment to the Ontario government’s climate change initiatives such as the Go Green Action Plan on Climate Change and out-lines research and management program priorities for the 2011-2014 period.
Theme 1: Understand Climate ChangeMNR will gather, manage, and share information and knowledge about how ecosystem composition, structure and function – and the people who live and work in them – will be affected by a changing climate. Strategies: • Communicate internally and externally to build
awareness of the known and potential impacts of climate change and mitigation and adaptation op-tions available to Ontarians.
• Monitor and assess ecosystem and resource condi-tions to manage for climate change in collaboration with other agencies and organizations.
• Undertake and support research designed to improve understanding of climate change, including improved temperature and precipitation projections, ecosystem vulnerability assessments, and im-proved models of the carbon budget and ecosys-tem processes in the managed forest, the settled landscapes of southern Ontario, and the forests and wetlands of the Far North.
• Transfer science and understanding to decision-makers to enhance comprehensive planning and management in a rapidly changing climate.
Theme 2: Mitigate Climate ChangeMNR will reduce greenhouse gas emissions in sup-port of Ontario’s greenhouse gas emission reduction goals. Strategies:• Continue to reduce emissions from MNR opera-
tions though vehicle fleet renewal, converting to other high fuel efficiency/low-emissions equipment, demonstrating leadership in energy-efficient facility development, promoting green building materials and fostering a green organizational culture.
Sustainability in a Changing Climate: An Overview of MNR’s Climate Change Strategy (2011-2014)
• Facilitate the development of renewable energy by collaborating with other Ministries to promote the val-ue of Ontario’s resources as potential green energy sources, making Crown land available for renewable energy development, and working with proponents to ensure that renewable energy developments are consistent with approval requirements and that other Ministry priorities are considered.
• Provide leadership and support to resource users and industries to reduce carbon emissions and in-crease carbon storage by undertaking afforestation, protecting natural heritage areas, exploring oppor-tunities for forest carbon management to increase carbon uptake, and promoting the increased use of wood products over energy-intensive, non-renewable alternatives.
• Help resource users and partners participate in a carbon offset market, by working with our partners to ensure that a robust trading system is in place based on rules established in Ontario (and potentially in other jurisdictions), continuing to examine the mitigation potential of forest carbon management in Ontario, and participating in the development of pro-tocols and policies for forest and land-based carbon offset credits.
Theme 3: Help Ontarians AdaptMNR will provide advice and tools and techniques to help Ontarians adapt to climate change. Strategies include: • Maintain and enhance emergency management
capability to protect life and property during extreme events such as flooding, drought, blowdown and wildfire.
• Use scenarios and vulnerability analyses to develop and employ adaptive solutions to known and emerg-ing issues.
• Encourage and support industries, resource users and communities to adapt, by helping to develop un-derstanding and capabilities of partners to adapt their practices and resource use in a changing climate.
• Evaluate and adjust policies and legislation to re-spond to climate change challenges.

2014
Science and Research Branch • Ontario Ministry of Natural Resources
Jon McKechnie1, Jiaxin Chen2, Donna Vakalis3, Heather MacLean3
1 Division of Energy and Sustainability, Faculty of Engineering, University of Nottingham, University Park, Nottingham, NG7 2RD, United Kingdom2 Ontario Forest Research Institute, Ontario Ministry of Natural Resources, 1235 Queen Street E., Sault Ste. Marie, Ontario, P6A 2E5, Canada3 Department of Civil Engineering, University of Toronto, 35 St. George Street, Toronto, Ontario, M5S 1A4, Canada
Energy Use and Greenhouse Gas Inventory Model for Harvested Wood Product Manufacture in Ontario

This paper contains recycled materials.
© 2014, Queen’s Printer for OntarioPrinted in Ontario, Canada
Single copies of this publicationare available from:
Science and Research Branch Ontario Forest Research InstituteMinistry of Natural Resources1235 Queen Street EastSault Ste. Marie, ONCanada P6A 2E5
Telephone: (705) 946-2981Fax: (705) 946-2030E-mail: [email protected]
Cette publication hautement spécialisée, Energy Use and Greenhouse Gas Inventory Model for Harvested Wood Product Manufacture in Ontario n’est disponible qu’en anglais en vertu du Règlement 671/92 qui en exempte l’application de la Loi sur les services en français. Pour obtenir de l’aide en français, veuillez communiquer avec le ministère des Richesses naturelles au [email protected]

i
SummaryForested ecosystems play an important role in climate change mitigation by capturing atmospheric carbon
and storing it in trees and their habitat. They also provide fibre to displace fossil fuels in energy production and to produce harvested wood products (HWPs), which store carbon and can displace greenhouse gas (GHG) intensive materials. Estimating the “forest-to-mill gate” energy use and associated GHG emissions is an essential component of evaluating the contribution of Ontario’s HWP sector to climate change mitigation. In this report, we present an Ontario-specific model for estimating GHG emissions from energy consumed for wood harvesting, forest renewal, road construction and maintenance, and wood transportation, as well as consumption of fossil fuels and electricity purchased during HWP manufacturing.
Representative categories of Ontario HWPs include lumber, board products, and pulp and paper products. We estimated that the forest-to-mill gate GHG emissions of lumber products ranged from 89 kg carbon dioxide equivalent (CO2eq.) per m3(softwood) to 148 kg CO2eq. (hardwood). For board products, GHG emissions ranged from 56 kg CO2eq. per m3 of oriented strand board to 204 kg CO2eq. per m3 of medium density fibreboard. Pulp and paper products are generally more GHG-intensive. For mechanical pulp and paper products, the forest-to-mill gate emissions were estimated to be 268 kg CO2eq. per air-dried tonne (adt) of wet mechanical pulp and 573 kg CO2eq. per adt of dry mechanical pulp, and ranged from 837 kg CO2eq. per adt of mechanical cardboard to 933 kg CO2eq. per adt of mechanical paper and 1,020 kg CO2eq. per adt of mechanical newsprint. In comparison, the forest-to-mill gate emissions were estimated to be 92 and 399 kg CO2eq. per adt of wet and dry kraft pulp, respectively, and ranged from 498 kg CO2eq. per adt of chemical newsprint to 686 kg CO2eq. per adt of chemical paper. The analysis and results reported here will be incorporated in future applications of the Ontario Forest Carbon Budget Model (FORCARB-ON) to better understand the role of Ontario’s forests in managing atmospheric GHG.
RésuméConsommation d’énergie et modèle d’inventaire des gaz à effet de serre pour les produits ligneux exploités et manufacturés en Ontario
Les écosystèmes forestiers jouent un rôle important dans l’atténuation des changements climatiques en captant le carbone atmosphérique et en le stockant dans les arbres et leur habitat. Ils fournissent aussi des fibres pour substituer les combustibles fossiles en production d’énergie et donner des produits ligneux exploités (PLE), qui stockent le carbone et peuvent déplacer de fortes quantités de matières de gaz à effet de serre (GES). Estimer la consommation d’énergie de « la forêt jusqu’à l’usine » et les émissions de GES connexes constitue un volet essentiel de l’évaluation de la contribution du secteur ontarien des PLE à l’atténuation des changements climatiques. Dans ce rapport, nous présentons un modèle ontarien d’estimation des émissions de GES à partir de l’énergie consommée pour l’exploitation des produits ligneux, la régénération forestière, la construction et l’entretien des routes, et le transport du bois, ainsi que la consommation des combustibles fossiles et l’électricité achetée pendant la fabrication des PLE.
Parmi les catégories représentatives des PLE en Ontario, mentionnons le petit bois d’œuvre, les produits pour panneaux, et les produits de pâtes et papiers. Nous avons estimé que les émissions de GES dégagées par les produits de bois d’œuvre de la forêt jusqu’à l’usine variaient entre 89 kg d’équivalent en CO2 (CO2eq.) par m3 (bois de résineux) et 148 kg CO2eq. (bois de feuillus). En ce qui concerne les produits pour panneaux, les émissions de GES variaient entre 56 kg de CO2eq. par m3 de panneaux de lamelles orientées et 204 kg de CO2eq. par m3 de panneaux de fibres à densité moyenne. Les produits de pâtes et papiers dégagent en général plus de GES. En ce qui concerne les produits de pâtes et papiers mécaniques, les émissions de GES de la forêt jusqu’à l’usine ont été estimées à 268 kg CO2eq. par tonne séchée à l’air (tsa) de pâte mécanique humide et à 573 kg CO2eq. par tsa de pâte mécanique sèche, et variaient entre 837 kg CO2eq. par tsa de

ii
Acknowledgements
Funding for this project was provided by the Climate Change Program, Ontario Ministry of Natural Resources (OMNR). We thank Steve Colombo and Michael Ter-Mikaelian for discussions about the study, Steve Colombo and Paul Gray for reviewing an earlier version of this report, and Trudy Vaittinen for formatting the report; all are with the OMNR’s Science and Research Branch.
papier à carton mécanique et 933 kg CO2eq. par tsa de papier de pâte mécanique et 1 020 kg CO2eq. par tsa de papier à journal mécanique. À titre de comparaison, les émissions de GES de la forêt jusqu’à l’usine ont été, respectivement, estimées à 92 et 399 kg CO2eq. par tsa de pâte kraft humide et sèche, et variaient entre 498 kg CO2eq. par tsa de papier à journal chimique et 686 kg CO2eq. par tsa de papier de pâte chimique. L’analyse et les résultats indiqués ici seront intégrés dans de futures applications du modèle de bilan de carbone pour les forêts de l’Ontario (FORCARB-ON) pour mieux comprendre le rôle que jouent les forêts de l’Ontario dans la gestion des GES atmosphériques.

CLIMATE CHANGE RESEARCH REPORT CCRR-39 vv
Contents
1. Introduction ............................................................................................................................................................... 1
2. Methods and Results ................................................................................................................................................ 1
2.1 Model overview ............................................................................................................................................... 1
2.2 Model structure ................................................................................................................................................ 2
2.3 Life cycle inventory .......................................................................................................................................... 3
2.3.1 Primary fibre supply .......................................................................................................................... 32.3.2 Secondary fibre supply ..................................................................................................................... 42.3.3 Harvested wood product manufacturing .......................................................................................... 5
3. Comparing Results with Other Studies and Data Sources ...................................................................................... 9
3.1 Lumber and board products ............................................................................................................................ 9
3.2 Pulp and paper products ................................................................................................................................. 9
4. Model Limitations ....................................................................................................................................................10
5. Summary and Recommendations ..........................................................................................................................10
6. References .............................................................................................................................................................. 11
vi CLIMATE CHANGE RESEARCH REPORT CCRR-39
Scientific Notation and Acronyms
Adt Air-dried tonne (10% moisture)
CO2 Carbon dioxide
CO2eq. Carbon dioxide equivalent
CH4 Methane
GHG Greenhouse gas(es)
GJ Gigajoule
HWP Harvested wood product(s)
kg Kilogram
kg CO2eq.m-3 kilogram emissions of carbon dioxide equivalent per cubic metre of HWP
km Kilometre
kWh 1000 watt-hours
L Litre
LCA Life-cycle assessment
m3 Cubic metre
MDF Medium density fibreboard
NRCan Natural Resources Canada
Odt Oven-dried tonne (0% moisture)
OMNR Ontario Ministry of Natural Resources
OSB Oriented strand board
N2O Nitrous oxide

CLIMATE CHANGE RESEARCH REPORT CCRR-39 1
1. IntroductionForests play an important role in mitigating climate change by capturing and storing atmospheric carbon dioxide
(CO2) in biomass and soil carbon pools (Chen et al. 2010), supplying feedstocks for bioenergy to displace fossil fuels and associated greenhouse gas (GHG) emissions (Zhang et al. 2010), and providing fibre for the production of harvested wood products (HWP) that store biogenic carbon and potentially displace more energy- and GHG-intensive alternatives (Sathre and O’Connor 2010).
The potential role of lumber, board, and pulp and paper products in mitigating GHG emissions can be evaluated using life cycle assessment models (e.g., Perez-Garcia 2006). To date however, GHG emissions estimates for HWP generated by Ontario’s forest products sector have not been modelled. Development of an Ontario-specific model will improve understanding of how the forest products sector can contribute to climate change mitigation. Integration with existing models of forest carbon (e.g., FORCARB-ON, Chen et al. 2010) and bioenergy production (Zhang et al. 2010, McKechnie et al. 2011) will improve understanding of the trade-offs between alternate forest resource uses and contribute to provincial reporting on forest condition, such as the provincial analysis of criteria and indicators of forest sustainability and Ontario’s State of the Forest Report.
In this report, we describe a life cycle inventory model of energy use and associated GHG emissions related to HWP manufacturing in Ontario, including all activities from forest to mill gate (i.e., forest management and harvesting, transport, and HWP manufacturing stages).
2. Methods and Results
2.1 Model overviewA forest-to-mill gate life cycle inventory model was developed to quantify energy use and associated GHG
emissions related to the production of representative HWP in Ontario. Energy inputs were inventoried for activities including forest management, fibre transport, and HWP manufacturing. Due to lack of data, non-energy inputs to HWP manufacturing (e.g., pulping chemicals) were not quantified to incorporate into the model. In addition, emissions associated with HWP distribution, use, and end-of-life were considered out of scope for the present study and were not included in the model. Therefore, energy use and GHG emissions implications of using forestry products in place of alternatives were not considered (e.g., Sathre and O’Connor 2010). The CO2, methane (CH4), and nitrous oxide (N2O) emissions were converted to units of carbon dioxide equivalent (CO2eq.) based on their 100-year global warming potentials.
The HWP assessed in this model include lumber, board, and pulp and paper products (Table 1). Softwood lumber was assumed to be kiln dried and planed. Hardwood lumber was assumed to be produced as rough green lumber only (not dried or planed). The functional unit for all board products was m3. The functional unit (m3) for both softwood and hardwood lumber was based on actual finished lumber dimensions rather than the more commonly used nominal dimensions. Board products included plywood, oriented strand board (OSB), particleboard, and medium density fibreboard (MDF). Pulp and paper products include dry and wet lap pulp, newsprint, printing and writing paper, and container board. Initial pulping of input fibre was modelled for both mechanical and sulphate (kraft) pulping. All pulp and paper products were assumed to be bleached. For all pulp and paper products, the functional unit was one air dry tonne (adt) (10% moisture content).
2 CLIMATE CHANGE RESEARCH REPORT CCRR-39
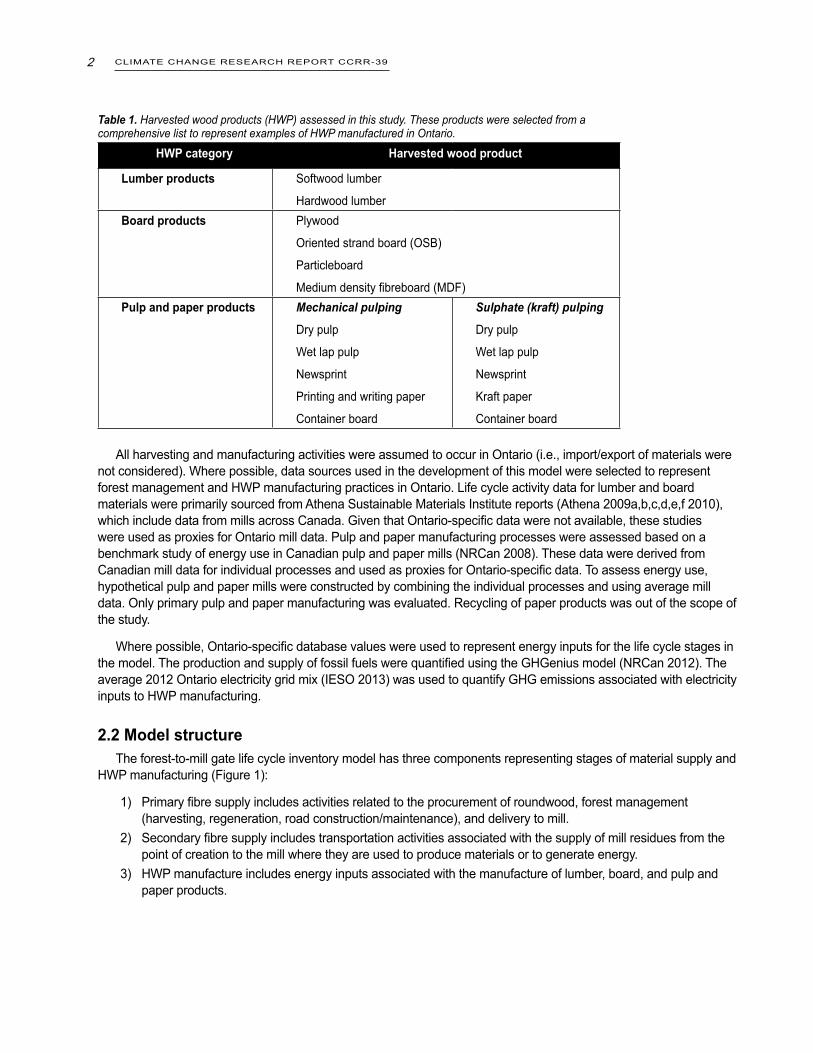
Table 1. Harvested wood products (HWP) assessed in this study. These products were selected from a comprehensive list to represent examples of HWP manufactured in Ontario.
HWP category Harvested wood product
Lumber products Softwood lumber
Hardwood lumberBoard products Plywood
Oriented strand board (OSB)
Particleboard
Medium density fibreboard (MDF)Pulp and paper products Mechanical pulping
Dry pulp
Wet lap pulp
Newsprint
Printing and writing paper
Container board
Sulphate (kraft) pulping
Dry pulp
Wet lap pulp
Newsprint
Kraft paper
Container board
All harvesting and manufacturing activities were assumed to occur in Ontario (i.e., import/export of materials were not considered). Where possible, data sources used in the development of this model were selected to represent forest management and HWP manufacturing practices in Ontario. Life cycle activity data for lumber and board materials were primarily sourced from Athena Sustainable Materials Institute reports (Athena 2009a,b,c,d,e,f 2010), which include data from mills across Canada. Given that Ontario-specific data were not available, these studies were used as proxies for Ontario mill data. Pulp and paper manufacturing processes were assessed based on a benchmark study of energy use in Canadian pulp and paper mills (NRCan 2008). These data were derived from Canadian mill data for individual processes and used as proxies for Ontario-specific data. To assess energy use, hypothetical pulp and paper mills were constructed by combining the individual processes and using average mill data. Only primary pulp and paper manufacturing was evaluated. Recycling of paper products was out of the scope of the study.
Where possible, Ontario-specific database values were used to represent energy inputs for the life cycle stages in the model. The production and supply of fossil fuels were quantified using the GHGenius model (NRCan 2012). The average 2012 Ontario electricity grid mix (IESO 2013) was used to quantify GHG emissions associated with electricity inputs to HWP manufacturing.
2.2 Model structureThe forest-to-mill gate life cycle inventory model has three components representing stages of material supply and
HWP manufacturing (Figure 1):
1) Primary fibre supply includes activities related to the procurement of roundwood, forest management (harvesting, regeneration, road construction/maintenance), and delivery to mill.
2) Secondary fibre supply includes transportation activities associated with the supply of mill residues from the point of creation to the mill where they are used to produce materials or to generate energy.
3) HWP manufacture includes energy inputs associated with the manufacture of lumber, board, and pulp and paper products.

CLIMATE CHANGE RESEARCH REPORT CCRR-39 3
Figure 1.Structure of the forest-to-mill gate life cycle inventory model. Arrows indicate materials transfer; model components are evaluated independently.
The model accounts for GHG emissions at the provincial level based on data for GHG emissions generated by total annual HWP production and associated forest management activities. This requires the use of multiple data sources representing the intermediate and final outputs from Ontario’s forest products sector. The primary fibre supply values were generated from provincial forest harvesting statistics to estimate energy use and GHG emissions associated with timber procurement, including harvesting operations, transporting wood to mill, and forest renewal. The HWP manufacturing values were based on provincial estimates of HWP output (e.g., OMNR 2005). Secondary fibre supply values were generated from estimates of secondary fibre inputs to each HWP type, and thus are linked to HWP manufacturing values. Combining these values provided an estimate of total annual GHG emissions.
Some mills manufacture multiple products. For example, sawmills produce lumber as well as pulp chips (transported to pulp and paper mills) and/or other process residues (exported to board manufacture or used as fuel). We did not distinguish between primary and secondary products; energy use and associated emissions values were simply assigned to the primary product. This simplified LCA procedure did not compromise the principal objective of the study, which was to evaluate the total GHG emissions of all HWP manufacturing in Ontario.
2.3 Life cycle inventory
2.3.1 Primary fibre supplyFor many wood product manufacturing mills, roundwood is the primary fibre source. Activities associated
with roundwood production include harvesting (felling, skidding, delimbing, and topping), forest renewal, road construction and maintenance, and transport to mill, referred to as primary fibre supply operations (Table 2). Inputs to the model were the quantity of roundwood harvested by three methods selected for evaluation: clear cut, shelterwood, and selection. Energy use data for the primary fibre supply stages were derived from data provided by FPInnovations for a previous study of wood pellet production in the Great Lakes-St. Lawrence forest region of Ontario (Zhang et al. 2010). These data were used to estimate energy use and GHG emissions associated with roundwood supply from across Ontario.
Harvest residue collection includes energy use associated with the collection and chipping of residues as well as subsequent transport. Data related to harvest residue collection were sourced from McKechnie et al. (2011). For this study, the transport distance between forest and mill was assumed to be 115 km, but this model parameter is adjustable.

4 CLIMATE CHANGE RESEARCH REPORT CCRR-39
Table 2. Energy inputs for primary fibre supply operations and associated greenhouse gas emissions for harvesting method and residues used in this study.
Operations/Emissions Harvesting methodClear cut
(m3)Shelterwood
(m3)Selection
(m3)Harvest residues
(odt¶)Life cycle stageHarvestOff-road diesel (L) 3.3 3.5 3.0 4.3Forest renewalOff-road diesel (L)Herbicides (L)
0.130.01
0.070§
0.040
--
Road constructionOff-road diesel (L)On-road diesel (L)
0.160.07
--
Transport: forest to millAssumed transport distance (km)On-road diesel (L)
115 km3.5
115 km7.3
Greenhouse gas emissions (grams)CO2CH4N2O
CO2eq.‡
22,3802010
24,400
23,9303010
26,100
25,3403010
27,400
39,4004010
42,000§ Zero value due to rounding.‡ Total CO2 equivalent may not correspond due to rounding. ¶ Oven-dried tonne, containing 0% moisture.GHG emissions associated with primary fibre supply operations can be put into context by comparing them with the CO2contained within the collected biomass. Assuming roundwood and harvest residues have a density of 500 dry kgm-3 and a carbon content of 0.5kg per dry kg, the embodied CO2 contained within the roundwood can be estimated as 920 kg CO2eq.m-3. Therefore, GHG emissions associated with primary fibre collection activities represent only 3 and 2% of embodied CO2 for roundwood and harvest residues, respectively.
2.3.2 Secondary fibre supplyIn addition to roundwood, mills may use other fibre sources either as a process fuel (e.g., hog fuel) or as a part
of the finished product (e.g., veneer input to plywood manufacture). Energy inputs associated with the delivery of secondary fibre sources are shown in Table 3.
Table 3. Energy inputs to secondary fibre source procurement and delivery (transportation and associated greenhouse gas emissions for an oven-dry tonne of fibre (0% moisture).
Operations/Emissions Veneer, dry† Veneer, green† Mill residues‡ Pulp chips¶
Initial moisture content 5% 50% 40% 40%Life cycle stageTransportDistance (km)§
On-road diesel (L)84530.0
80053.8
26014.8
26014.8
Greenhouse gas emissions (grams)CO2CH4N2O
CO2eq
102,00011010
107,000
184,00020010
193,000
50,700500±
53,000
50,700500±
53,000† Input to plywood manufacture. ‡ Input to particleboard and MDF manufacture. ¶ Input to pulp and paper manufacture.§ Distance estimates are based on Athena (2009c) (dry and green veneer) and Athena (2009e,f) (mill residues). Pulp chips are assumed to be transported the same distance as mill residues. These values can be adjusted in the model.±Zero value due to rounding.

CLIMATE CHANGE RESEARCH REPORT CCRR-39 5
The expected demand for secondary fibre per unit of product output is shown in Table 4. Combined with annual production data of end products, these data enable calculation of total annual energy use and GHG emissions associated with the secondary fibre supply. Secondary fibre inputs to lumber and board products were estimated based on prior LCA studies (Athena 2009b,c,d,e,f, 2010). Secondary fibre inputs to pulp and paper manufacture were estimated based on Ontario mill survey data (OMNR 2005). The composition of secondary fibre used to produce pulp and paper was reported as ‘pulp chips’, however, the exact composition was unknown and would be expected to consist of other fibre types (e.g., hog fuel) (Chen et al. 2013). Use of hog fuel in pulp and paper mills to generate heat and/or electricity is estimated in the ‘HWP manufacture’ model component.
Table 4. Roundwood and secondary fibre inputs to harvested wood product (HWP) manufacture (per unit of HWP product).
Fibre source Softwood lumber
Hardwood lumber
Plywood OSB Particle-board
MDF Pulp and paper
products(kgm-3) (kgm-3) (kgm-3) (kgm-3) (kgm-3) (kgm-3) (kgadt-1¶)
Roundwood 968 2,045 746 530 54 - 456Veneer, dry - - 8 - - - -Veneer, green - - 8 - - - -Processing residues
- - - - 558 766 -
Pulp chips - - - - - - 1,190
¶Air-dry tonne (10% moisture).
2.3.3 Harvested wood product manufacturing
2.3.3.1 Lumber productsData on energy used in the manufacture of softwood and hardwood lumber products (Table 5) were based on
results of prior LCA studies (Athena 2009a, 2010). In these studies survey data from mills across Canada were used to estimate energy inputs (e.g., electricity and fuels). Given that energy data for softwood and hardwood lumber manufacturing can differ by region and regionally specific data were not available, averages were used in the current study. The GHG emissions associated with upstream activities (e.g., electricity generation) were quantified using Ontario-specific data (IESO 2013, NRCan 2013).
Softwood lumber was assumed to be kiln-dried and planed. In contrast, energy use data for hardwood lumber production was based on the manufacture of green, unplaned lumber. Drying and planing of hardwood lumber consumes energy beyond what was considered in this study.
Table 5. Energy inputs to lumber product manufacture and associated greenhouse gas emissions.
Inputs/emissions Softwood lumber Hardwood lumber
Energy inputs per m3¶
Electricity (kWh)Diesel (L)Gasoline (L)Natural gas (m3)Propane (L)Fuel oil (L) Biomass, internal (GJ)Biomass, external (GJ)Pulping liquor (GJ)
712.60
6.100
0.80.10
703.30§
00.20
0.100
Greenhouse gas emissions per m3 (grams)CO2CH4N2O CO2eq.
30,800405
33,200
20,600201
21,500¶Energy input data from Athena (2009d, 2010).§ Zero value due to rounding.

6 CLIMATE CHANGE RESEARCH REPORT CCRR-39
2.3.3.2 Board productsEnergy use data related to board product manufacture (Table 6) were obtained from Canadian mill surveys
(Athena 2009a,b,c). Data sources for each product included plywood (1 mill, none in Ontario), OSB (4 mills, 1 in Ontario), particleboard (3 mills, none in Ontario), and MDF (4 mills, 1 in Ontario). Average data from these surveys were used as representative samples of energy use in Ontario mills. As with lumber products, regional variations in fuel inputs to board product manufacture were not accounted for due to lack of data. Upstream emissions associated with producing energy inputs were evaluated using Ontario-specific data where possible.
Table 6. Energy inputs to board product manufacture and associated greenhouse gas emissions.
Inputs/emissions Plywood OSB Particleboard MDF
Energy inputs per m3¶
Electricity (kWh)Diesel (L)Gasoline (L)Natural gas (m3)Propane (L)Fuel oil (L) Biomass, internal (GJ)Biomass, external (GJ)Pulping liquor (GJ)
1001.20§
160.30
1.500
1041.20§
2.10.10.11.900
1504.40
1.900
1.31.10
4331.40§
4300
1.71.10
Greenhouse gas emissions per m3 (grams)CO2
CH4
N2O
CO2eq.
50,500707
54,200
22,400408
25,800
41,0006011
45,700
151,00018013
159,600¶Energy input data from Athena (2009a,b,c).§Zero value due to rounding.
2.3.3.3 Pulp and paper productsEnergy use and associated GHG emissions were estimated for major final products including mechanical (Table 7)
and chemical (kraft) pulp (Table 8), newsprint, paper, and paperboard.
Energy use data for pulp and paper products were derived from an energy-use benchmarking study of the Canadian pulp and paper sector (NRCan 2008). National data reported by NRCan (2008) were used because Ontario-specific data related to the energy efficiency of pulp and paper mills were not available. Energy use data associated with individual production processes were combined to estimate total energy demand for the selected pulp and paper products. Processes considered for each pulp and paper end product are illustrated in figures 2 and 3. Median energy use data obtained from NRCan (2008) for each production step were used to model ‘average’ pulp and paper mills. Variability of collected data and opportunities to improve energy efficiency of these processes were not addressed. Incorporating better knowledge of pulp and paper manufacturing methods in Ontario, which could be accomplished by adding or removing process steps or improving estimates of energy consumption associated with each step, would improve model results. For example, the results shown here assume that all pulp and paper products were bleached; depending on the end product, the bleaching process represents 3 to 17% of manufacturing energy demand. Modelling the production of unbleached pulp and paper products is possible by simply removing this stage from the model.

CLIMATE CHANGE RESEARCH REPORT CCRR-39 7
Figure 2. Processes modelled to determine energy consumption involved in manufacture of pulp and paper products via mechanical pulping.
Figure 3. Processes modelled to determine energy consumption involved in manufacture of pulp and paper products via sulphate (kraft) pulping.
Electricity is assumed to be provided by a mix of grid electricity (import to mill), and on-site generation in a combined heat and power system. Thermal energy is assumed to be generated from a mix of natural gas, fuel oil, wood residues, pulp residues (sludge), and black liquor (chemical pulp only). Ontario-specific data related to energy sources employed in pulp and paper mills were not available. Thermal energy data available from black liquor combustion were quantified using values provided by NRCan (2008). The mix of fuels supplying the remaining thermal energy demand was estimated based on values reported by Adès et al. (2012), and assumed a similar fuel input mix in Ontario as in Québec. Similarly, the portion of electricity provided by on-site generation and import from the grid was assumed to be the same as that reported by Adès et al. (2012). The GHG emissions of imported electricity were quantified based on the average electricity mix in Ontario (IESO 2013).

8 CLIMATE CHANGE RESEARCH REPORT CCRR-39
In general, pulp and paper products produced via mechanical pulping are more energy intensive than similar products produced via kraft pulping due to greater electricity inputs. Fuel consumption associated with kraft pulp-derived products is also reduced due to the recovery of process energy from black liquor boilers.
Table 7. Energy inputs to mechanical pulp and paper product manufacture and associated greenhouse gas emissions.
Inputs/emissions Mechanical pulp, dry
Mechanical pulp, wet lap
Mechanical newsprint
Mechanical paper
Mechanical board
Energy inputs per adt¶
Electricity (kWh)Diesel (L)Gasoline (L)Natural gas (m3)Propane (L)Fuel oil (L) Biomass, internal (GJ)Biomass, external (GJ)Pulping liquor (GJ)
2,13000
490
50200
1,920003030*00
3,55000
920
95500
3,77000
730
75400
2,53000
840
87400
Greenhouse gas emissions per adt (grams)CO2
CH4
N2O
CO2eq.
556,00050016
573,000
262,000170
5
268,000
986,00092030
1,020,000
905,00081026
933,000
810,00079025
837,000¶ Air-dried tonne (10% moisture).* Zero value due to rounding
Table 8. Energy inputs to chemical pulp and paper product manufacture and associated greenhouse gas emissions.
Inputs/emissions Sulphate pulp, dry
Sulphate pulp, wet lap
Sulphate pulp, newsprint
Sulphate (Kraft)paper
Sulphate pulp, board
Energy inputs per adt¶
Electricity (kWh)Diesel (L)Gasoline (L)Natural gas (m3)Propane (L)Fuel oil (L) Biomass, internal (GJ)Biomass, external (GJ)Pulping liquor (GJ)
62000
290
5720
29
5450000000
29
99500
320
6420
29
1,41000
480
9540
29
98600350682029
Greenhouse gas emissions per adt (grams)CO2
CH4
N2O
CO2eq
347,000620125
399,000
70,00017559
92,000
424,000680128
480,000
622,000895139
686,000
423,000705128
500,000¶ Air-dried tonne (10% moisture).

CLIMATE CHANGE RESEARCH REPORT CCRR-39 9
3. Comparing Results with Other Studies and Data Sources
3.1 Lumber and board productsOur model results for lumber and board products are compared with those from the Athena studies in terms of
GHG emissions related to “forest-to-mill gate” activities. While energy use data for HWP manufacturing processes were identical, in this study Ontario-specific database values were used to represent the production of energy inputs. Table 9 presents GHG emissions for HWP manufacture, inclusive of activities related to primary and secondary fibre supply. Note that where multiple products are co-produced, GHG emissions were not allocated between mill products. Differences in GHG emissions results between the present study and the Athena reports can be attributed to energy use related to forest operations and upstream emissions attributed to energy inputs (particularly electricity).
Based on model results, forest operations consumed 6.8 L diesel per m3 harvested wood, corresponding to forest operations energy use data reported by Athena (2009a) for eastern Canada. In contrast, Athena (2010) reported less than half this fuel use for hardwood harvest, resulting in approximately 30% lower GHG emissions associated with hardwood lumber production than was estimated in this study. Plywood manufacture energy use modelled by Athena was based on data from a single mill in British Columbia; the lower emissions reported likely resulted from lower energy use associated with roundwood supply in western Canada (Athena 2009a), and possibly from lower GHG emissions associated with a hydroelectric-dominated electricity supply mix (CEA 2013). Conversely, MDF manufacture is attributed lower GHG emissions in the current study. The GHG emissions associated with MDF manufacture are mainly related to electricity consumption. The lower MDF GHG emissions reported here are likely the result of differences between the 2012 Ontario grid mix (used here) and that employed by Athena to model MDF manufacture at sites across Canada (British Columbia, Alberta, Ontario, and New Brunswick).
Table 9. Comparison of greenhouse gas emissions associated with lumber and board product manufacture (kg CO2eq.m-3).
Source Softwood lumber
Hardwood lumber
Plywood OSB Particleboard MDF
This study 89 148 100 56 81 204Athena¶ 90 100§ 76 66 88 284
¶Athena (2010) (hardwood lumber) and Athena (2009a) (all other lumber and board products). § Reported results were adjusted to enable comparison with the present study by reversing the allocation of emissions between mill products.
3.2 Pulp and paper productsEnergy use results for pulp and paper manufacture were compared to Ecoinvent (2013) database values (Figure
4). In addition to the median value employed in this study, a range of electricity and thermal energy consumption values are presented for pulp and paper mills based on 25th and 75th percentiles for Canadian mills reported in NRCan (2008). To be comparable to the Ecoinvent data, on-site combustion of residues (e.g., wood waste and pulping liquor) for process energy generation were not included in these values.
In general, electricity use documented in this study exceeds that reported by Ecoinvent (2013), particularly for mechanical pulp-derived paper. Thermal energy use more closely matches the range for Canadian mills, with the exception of mechanical pulp-derived newsprint. Direct comparison of results, however, is complicated by several factors. Energy efficiency of mills can vary significantly within and among countries (NRCan 2008). As Ecoinvent data represents production in Europe, differences in results also include differences in energy efficiency between pulp and paper industries in Europe and Canada. Further, the data provided by Ecoinvent accounts only for external fuel inputs to manufacturing processes, so the use of in-house process residues for thermal energy or in a cogeneration system (i.e., producing heat and electricity) would require reductions in reported energy.

10 CLIMATE CHANGE RESEARCH REPORT CCRR-39
Figure 4. Variation in electricity and thermal energy consumption associated with pulp and paper production processes modelled in this study compared with values reported by Ecoinvent (2013), excluding internal use of process residues (e.g., wood waste, pulping liquor). Ranges presented for electricity and thermal energy use considered in the present study represented the 25th and 75th percentile values from NRCan (2008). For each production step, median energy use data were obtained from NRCan (2008). Ecoinvent datasets (and equivalent designations) are: “stone groundwood” pulp (mechanical pulp, dry); paper, newsprint, 0% deinked pulp (mechanical newsprint); paper, wood-containing, super calendered (mechanical paper); sulphate pulp, bleached and sulphate pulp, unbleached (sulphate pulp); and solid bleached board (sulphate pulp, paperboard).
4. Model Limitations
Limitations of data specific to HWP manufacture in Ontario necessitated the use of national and regional data as proxies for several important life cycle stages in this study. As such, results must be interpreted with caution. In particular, energy use and associated GHG emissions may vary substantially among mills and therefore the results presented here should not be considered an estimate of a particular producer’s outputs. As well, all pulp and paper products were assumed to be bleached, but minor refinements to the model would allow unbleached products to be assessed.
CLIMATE CHANGE RESEARCH REPORT CCRR-39 11
5. Summary and Recommendations
In this report, we summarized a “forest-to-mill gate” life cycle energy use and associated GHG emissions model for HWP manufacture in Ontario. The model represents Ontario’s forest products sector. Understanding the energy and associated GHG implications of HWP production can assist forest managers, HWP manufacturers, and policymakers by providing a more comprehensive understanding of the role of Canada’s forests in managing atmospheric GHGs.
Recommendations are as follows:
1. Improve current estimates by using actual mill data related to inputs (materials and fuels) and production processes.
2. Increase collaboration, both to improve data quality employed in this life cycle model and to assist mill managers in understanding the energy use and emissions implications of their production processes.
3. Include GHG emissions generated by the production and use of pulping chemicals in future analyses.4. Modify the model to allow assessment of energy use and emissions associated with unbleached products.5. Integrate a module to evaluate energy use and emissions associated with recycled paper products.
6. References
Adès J., J.T. Bernard and P. Gonzalez. 2012. Energy use and GHG emissions in the Quebec pulp and paper industry, 1990-2006. Can. Public Pol. 38: 71-90.
Athena. 2009a. Status of energy use in the Canadian wood products sector. Athena Sustainable Materials Institute, Ottawa, ON. Project No. 6014 Final Report. 59pp.
Athena. 2009b. A cradle-to-gate life cycle assessment of Canadian softwood lumber. Athena Sustainable Materials Institute, Ottawa, ON. 143pp. Available at: http://www.athenasmi.org/resources/publications/#lca_studies; Accessed 10/10/2013.
Athena. 2009c. A cradle-to-gate life cycle assessment of Canadian softwood plywood sheathing. Athena Sustainable Materials Institute, Ottawa, ON. 86pp. Available at: http://www.athenasmi.org/resources/publications/#lca_studies; Accessed 10/10/2013.
Athena. 2009d. A cradle-to-gate life cycle assessment of Canadian oriented strand board. Athena Sustainable Materials Institute, Ottawa, ON.87pp. Available at: http://www.athenasmi.org/resources/publications/#lca_studies; Accessed 10/10/2013.
Athena. 2009e. A cradle-to-gate life cycle assessment of Canadian medium density fibreboard. Athena Sustainable Materials Institute, Ottawa, ON. 95pp.Available at: http://www.athenasmi.org/resources/publications/#lca_studies; Accessed 10/10/2013.
Athena. 2009f. A cradle-to-gate life cycle assessment of Canadian particleboard. Athena Sustainable Materials Institute, Ottawa, ON. 93pp. Available at: http://www.athenasmi.org/resources/publications/#lca_studies; Accessed 10/10/2013.
Athena. 2010. A cradle-to-gate life cycle assessment of Canadian hardwood lumber. Athena. 35pp. Available at: http://www.athenasmi.org/resources/publications/#lca_studies; Accessed 10/10/2013.
[CEA] Canadian Electricity Association. 2013. Key Canadian Electricity Statistics. Can. Electricity Assoc. Available at: www.electricity.ca/media/IndustryData/KeyCanadianElectricityStatistics21May2013.pdf; Accessed 10/10/2013.
Chen J, S.J. Colombo, M.T. Ter-Mikaelian and L. Heath. 2010. Carbon budget of Ontario’s managed forests and harvested wood products, 2001-2100. For. Ecol. Manage. 259:1385-1398.
Chen J., S.J. Colombo and M.T. Ter-Mikaelian. 2013. Carbon stocks and flows from harvest to disposal in harvested wood products from Ontario and Canada. Ont. Min. Nat. Res., Sault Ste. Marie, ON, Clim. Change Res. Rep. CCRR-33. 41 pp.
Ecoinvent. 2013. Ecoinvent database Version 3. Available at: www.ecoinvent.org/; Accessed 10/10/2013.
[IESO] Independent Electricity System Operator. 2013. Supply Overview.Independent Electricity System Operator Ontario. Available at: www.ieso.ca/imoweb/media/md_supply.asp Accessed 10/10/2013.
McKechnie J., S. Colombo, J. Chen, W. Mabee and H.L. MacLean. 2011. Forest bioenergy or forest carbon? Assessing trade-offs in greenhouse gas mitigation with wood-based fuels. Environ. Sci. Technol. 45: 789-795.
[NRCan] Natural Resources Canada. 2008. Benchmarking Energy Use in Canadian Pulp and Paper Mills.Natural Resources Canada, Ottawa, ON. 66pp.

12 CLIMATE CHANGE RESEARCH REPORT CCRR-39
[NRCan] Natural Resources Canada. 2012. GHGenius– a model for life cycle assessment of transportation fuels, Version 4.02. Natural Resources Canada, Ottawa, ON.
[OMNR] Ontario Ministry of Natural Resources. 2005. Ontario’s Forest Industry: Facility (Mill) Statistics, 1999-2003.Ontario Ministry of Natural Resources, Toronto, ON. 267pp.
Perez-Garcia J, B. Lippke, J.Comnick and C. Manriquez.2006. An assessment of carbon pools, storage, and wood products market substitution using life cycle analysis results. Wood and Fiber Sci.37: 140-148.
Sathre, R. and J. O’Connor. 2010. Meta-analysis of greenhouse gas displacement factors of wood product substitution. Environ. Sci. Policy 13: 104-114.
Zhang Y., J. McKechnie, D. Cormier, R.Lyng, W. Mabee, A. Ogino and H.L. MacLean. 2010. Life cycle emissions and cost of producing electricity from coal, natural gas, and wood pellets in Ontario, Canada. Environ. Sci. Technol. 44: 538–544.


Climate Change Research Publication Series Reports
CCRR-01 Wotton, M., K. Logan and R. McAlpine. 2005. Climate Change and the Future Fire Environment in Ontario: Fire Occurrence and Fire Management Impacts in Ontario Under a Changing Climate.
CCRR-02 Boivin, J., J.-N. Candau, J. Chen, S. Colombo and M. Ter-Mikaelian. 2005. The Ontario Ministry of Natural Resources Large-Scale Forest Carbon Project: A Summary.
CCRR-03 Colombo, S.J., W.C. Parker, N. Luckai, Q. Dang and T. Cai. 2005. The Effects of Forest Management on Carbon Storage in Ontario’s Forests.
CCRR-04 Hunt, L.M. and J. Moore. 2006. The Potential Impacts of Climate Change on Recreational Fishing in Northern Ontario.
CCRR-05 Colombo, S.J., D.W. McKenney, K.M. Lawrence and P.A. Gray. 2007. Climate Change Projections for Ontario: Practical Information for Policymakers and Planners.
CCRR-06 Lemieux, C.J., D.J. Scott, P.A. Gray and R.G. Davis. 2007. Climate Change and Ontario’s Provincial Parks: Towards an Adaptation Strategy.
CCRR-07 Carter, T., W. Gunter, M. Lazorek and R. Craig. 2007. Geological Sequestration of Carbon Dioxide: A Technology Review and Analysis of Opportunities in Ontario.
CCRR-08 Browne, S.A. and L.M Hunt. 2007. Climate Change and Nature-based Tourism, Outdoor Recreation, and Forestry in Ontario: Potential Effects and Adaptation Strategies.
CCRR-09 Varrin, R. J. Bowman and P.A. Gray. 2007. The Known and Potential Effects of Climate Change on Biodiversity in Ontario’s Terrestrial Ecosystems: Case Studies and Recommendations for Adaptation.
CCRR-11 Dove-Thompson, D. C. Lewis, P.A. Gray, C. Chu and W. Dunlop. 2011. A Summary of the Effects of Climate Change on Ontario’s Aquatic Ecosystems.
CCRR-12 Colombo, S.J. 2008. Ontario’s Forests and Forestry in a Changing Climate.
CCRR-13 Candau, J.-N. and R. Fleming. 2008. Forecasting the Response to Climate Change of the Major Natural Biotic Disturbance Regime in Ontario’s Forests: The Spruce Budworm.
CCRR-14 Minns, C.K., B.J. Shuter and J.L. McDermid. 2009. Regional Projections of Climate Change Effects on Ontario Lake Trout (Salvelinus namaycush) Populations.
CCRR-15 Subedi, N., M. Sharma, and J. Parton. 2009. An Evaluation of Site Index Models for Young Black Spruce and Jack Pine Plantations in a Changing Climate.
CCRR-16 McKenney, D.W., J.H. Pedlar, K. Lawrence, P.A. Gray, S.J. Colombo and W.J. Crins. 2010. Current and Projected Future Climatic Conditions for Ecoregions and Selected Natural Heritage Areas in Ontario.
CCRR-17 Hasnain, S.S., C.K. Minns and B.J. Shuter. 2010. Key Ecological Temperature Metrics for Canadian Freshwater Fishes.
CCRR-18 Scoular, M., R. Suffling, D. Matthews, M. Gluck and P. Elkie. 2010. Comparing Various Approaches for Estimating Fire Frequency: The Case of Quetico Provincial Park.
CCRR-19 Eskelin, N., W. C. Parker, S.J. Colombo and P. Lu. 2011. Assessing Assisted Migration as a Climate Change Adaptation Strategy for Ontario’s Forests: Project Overview and Bibliography.
CCRR-20 Stocks, B.J. and P.C. Ward. 2011. Climate Change, Carbon Sequestration, and Forest Fire Protection in the Canadian Boreal Zone.
CCRR-21 Chu, C. 2011. Potential Effects of Climate Change and Adaptive Strategies for Lake Simcoe and the Wetlands and Streams within the Watershed.
CCRR-22 Walpole, A and J. Bowman. 2011. Wildlife Vulnerability to Climate Change: An Assessment for the Lake Simcoe Watershed.
CCRR-23 Evers, A.K., A.M. Gordon, P.A. Gray and W.I. Dunlop. 2012. Implications of a Potential Range Expansion of Invasive Earthworms in Ontario’s Forested Ecosystems: A Preliminary Vulnerability Analysis.
CCRR-24 Lalonde, R., J. Gleeson, P.A. Gray, A. Douglas, C. Blakemore and L. Ferguson. 2012. Climate Change Vulnerability Assessment and Adaptation Options for Ontario’s Clay Belt – A Case Study.
CCRR-25 Bowman, J. and C. Sadowski. 2012. Vulnerability of Furbearers in the Clay Belt to Climate Change.
CCRR-26 Rempel, R.S. 2012. Effects of Climate Change on Moose Populations: A Vulnerability Analysis for the Clay Belt Ecodistrict (3E-1) in Northeastern Ontario.
CCRR-27 Minns, C.K., B.J. Shuter and S. Fung. 2012. Regional Projections of Climate Change Effects on Ice Cover and Open-Water Duration for Ontario Lakes
CCRR-28 Lemieux, C.J., P. A. Gray, D.J. Scott, D.W. McKenney and S. MacFarlane. 2012. Climate Change and the Lake Simcoe Watershed: A Vulnerability Assessment of Natural Heritage Areas and Nature-Based Tourism.
CCRR-29 Hunt, L.M. and B. Kolman. 2012. Selected Social Implications of Climate Change for Ontario’s Ecodistrict 3E-1 (The Clay Belt).
CCRR-30 Chu, C. and F. Fischer. 2012. Climate Change Vulnerability Assessment for Aquatic Ecosystems in the Clay Belt Ecodistrict (3E-1) of Northeastern Ontario.
CCRR-31 Brinker, S. and C. Jones. 2012. The Vulnerability of Provincially Rare Species (Species at Risk) to Climate Change in the Lake Simcoe Watershed, Ontario, Canada
CCRR-32 Parker, W.C., S. J. Colombo and M. Sharma. 2012. An Assessment of the Vulnerability of Forest Vegetation of Ontario’s Clay Belt (Ecodistrict 3E-1) to Climate Change.
CCRR-33 Chen, J, S.J. Colombo, and M.T. Ter-Mikaelian. 2013. Carbon Stocks and Flows From Harvest to Disposal in Harvested Wood Products from Ontario and Canada.
CCRR-34 J. McLaughlin, and K. Webster. 2013. Effects of a Changing Climate on Peatlands in Permafrost Zones: A Literature Review and Application to Ontario’s Far North.
CCRR-35 Lafleur, B., N.J. Fenton and Y. Bergeron. 2013. The Potential Effects of Climate Change on the Growth and Development of Forested Peatlands in the Clay Belt (Ecodistrict 3E-1) of Northeastern Ontario.
CCRR-36 L. Nituch, and J. Bowman. 2013. Community-Level Effects of Climate Change on Ontario’s Terrestrial Biodiversity.
CCRR-37 Douglas, A., C. Lemieux, G. Nielson, P. Gray, V Anderson and S. MacRitchie. Responding to the Effects of Climate Change in the Lake Simcoe Watershed: A Pilot Study to Inform Development of an Adaptation Strategy on a Watershed Basis.
CCRR-38 Furrer, M., M. Gillis, R. Mussakowski, T. Cowie and T. Veer.Monitoring Programs Sponsored by the Ontario Ministry of Natural Resources and their Relevance to Climate Change.

62824(0.2k P.R.,14 04 15)ISBN 978-1-4606-3668-8 (print)ISBN 978-1-4606-3669-5 (pdf)