energy systems scenario modelling and long term...
TRANSCRIPT

General rights Copyright and moral rights for the publications made accessible in the public portal are retained by the authors andor other copyright owners and it is a condition of accessing publications that users recognise and abide by the legal requirements associated with these rights
bull Users may download and print one copy of any publication from the public portal for the purpose of private study or research bull You may not further distribute the material or use it for any profit-making activity or commercial gain bull You may freely distribute the URL identifying the publication in the public portal
If you believe that this document breaches copyright please contact us providing details and we will remove access to the work immediately and investigate your claim
Downloaded from orbitdtudk on Sep 07 2018
Energy Systems Scenario Modelling and Long Term Forecasting of Hourly ElectricityDemand
Alberg Oslashstergaard Poul Moslashller Andersen Frits Kwon Pil Seok
Published inInternational Journal of Sustainable Energy Planning and Management
Link to article DOI105278ijsepm201578
Publication date2015
Document VersionPublishers PDF also known as Version of record
Link back to DTU Orbit
Citation (APA)Alberg Oslashstergaard P Moslashller Andersen F amp Kwon P S (2015) Energy Systems Scenario Modelling andLong Term Forecasting of Hourly Electricity Demand International Journal of Sustainable Energy Planning andManagement 7 99-116 DOI 105278ijsepm201578
1 Introduction
Danish energy policy is committed to the short termobjective of having more than 35 of the final energyconsumption covered by renewable energy sources(RES) by the year 2020 with the more detailedstipulations that 10 of the transportation demandshould be covered by RES and approximately 50 ofthe electricity demand should be covered by windpower [1] By 2030 oil for heating should be phasedout as well as the entire coal demand By 2035
International journal of Sustainable Energy Planning and Management Vol 07 2015 99
electricity and heating should rely completely on RES[2] In the long term the objective is to have a 100RES penetration in the energy and transport sectors by2050 [1] with the aim of combatting climate change [34] Denmark is a country of limited supply of storableRES [5] so high RES penetration is inevitably connectedto large-scale exploitation of wind power and windpower has thus also hitherto played a pivotal role in thedevelopment of the Danish energy system [4] with a2013 share of 336 of domestic electricity supply [6]
Corresponding author e-mail poulplanaaudk
International Journal of Sustainable Energy Planning and Management Vol 07 2015 99-116
Energy Systems Scenario Modelling and Long Term Forecasting ofHourly Electricity Demand
131313
13 13$amp()+
ABSTRACT
The Danish energy system is undergoing a transition from a system based on storable fossil fuelsto a system based on fluctuating renewable energy sources At the same time more and more ofthe energy system is becoming electrified transportation heating and fuel usage in industry andelsewhere
This article investigates the development of the Danish energy system in a medium year 2030situation as well as in a long-term year 2050 situation The analyses are based on scenariodevelopment by the Danish Climate Commission In the short term it is investigated what theeffects will be of having flexible or inflexible electric vehicles and individual heat pumps and inthe long term it is investigated what the effects of changes in the load profiles due to changingweights of demand sectors are The analyses are based on energy systems simulations usingEnergyPLAN and demand forecasting using the Helena model
The results show that even with a limited short term electric car fleet these will have asignificant effect on the energy system the energy systemrsquos ability to integrate wind power andthe demand for condensing power generation capacity in the system Charging patterns andflexibility have significant effects on this Likewise individual heat pumps may affect the systemoperation if they are equipped with heat storages
The analyses also show that the long term changes in electricity demand curve profiles have littleimpact on the energy system performance The flexibility given by heat pumps and electric vehiclesin the long term future overshadows any effects of changes in hourly demand curve profiles
Keywords
Scenarios analysesEnergy system simulationDemand curve projectionsHeat pumpsElectric vehicles
URL
dxdoiorg105278ijsepm201578
100 International Journal of Sustainable Energy Planning and Management Vol 07 2015
Energy Systems Scenario Modelling and Long Term Forecasting of Hourly Electricity Demand
This introduces a complexity into the future Danishenergy system which has made Denmark an interestingcase for analyses of high-RES energy systems as well asthe centre point of a number of analyses focusing onhigh wind power scenarios [7-9] the role of electricvehicles in integrating wind power[10] the general roleof the transport sector in future energy systems [11]limited biomass availability [5] large-scale use ofcogeneration of heat and power (CHP) for districtheating (DH) supply [12-14] smart energy systems [15]the role of storage in integrating wind power [16] andmeans of integrating wind power into national energysystems [17 18]
The ENSYMORA project (Energy systemsmodelling research and analysis) has targeted the futurechallenges of the Danish energy system through anintegrated focus on methods and models for energysystems analysis including both methods and tools forsupply scenario analysis as well as methods and tools forelectricity demand projections Research hasinvestigated and compared high-RES scenarios [5 19]short term projections of fluctuating RES includingwind power [20] and wave power [21] long termforecasting of electricity demand using a combination ofeconometrics and high resolution existing demandpattern [22 23] as well as policy implications of thetransition to high RES energy supply [24 25]
Many national scenario analyses including [5 19]however have been based on existing demand curveprofiles combined with demand curve profiles from newelectricity demands including electric heating throughheat pumps and electric vehicles Electricity demandcurve profiles will change though as a consequence ofshifts between the relative weight of different demandsectors as well as due to the introduction of newtechnologies and behavioural changes over the comingdecades Therefore energy scenario analyses cannotfocus on designing and simulating energy systemscapable of meeting the demand variations of today butmust focus on designing and simulating energy systemsthat are sufficiently robust to meet the demand variationsof the future For this reason this article simulates a high-RES energy scenario for Denmark under different longterm demand curve profile projections
Secondly with the required shifts in technology invehicles and heating the energy system is progressivelybecoming more and more based on electricity throughelectric heat pumps and electric vehicles Thisintroduces new and potentially controllable loads
In this article we thus analyse A the energy systemimpacts of projected changes in hourly electricitydemand variations in a long term scenario based on a2050 100 RES scenario for Denmark At this point intime we assume that electric vehicles and individualheat pumps are flexible ie may be dispatchedaccording to momentary energy system needs and Bthe energy system impacts in intermediate 2030 ofhaving flexible or inflexible Electrical vehicles andindividual heat pumps
Research has already addressed future demandvariations mdash eg based on price sensitivity of demands[26 27] mdash however in this article we focus on systemeffects of changes in demand curve profiles Demandcurve profiles change due to changes in the compositionof demand and especially due to the introduction ofelectrical vehicles and individual heat pumps If demandby electrical vehicles and individual heat pumps isflexible this may partly balance variations in supplyfrom fluctuating RES like wind power However todayincentives for being flexible customers are lacking andif electrical vehicles and individual heat pumps are notflexible the integration of these new technologies mayconsiderably increase the demand for peak capacity
Section 2 introduces the tools and methods applied inthe article the hourly energy systems simulation modelEnergyPLAN as well as a model for hourly demandcurve forecasts Section 3 details the construction offorecasted demand curves Section 4 introduces a highRES scenario developed by the Danish ClimateCommission and based on the scenario and demandcurve forecasts introduced in Section 3 the systemresponses to different demand forecasts are analyses inSections 5 and 6 Finally Section 7 concludes on theanalyses
2 Methodology
This section describes the main methodologies appliedin this article energy systems analyses using theEnergyPLAN model and electricity demand forecastingusing the Helena model
21 Energy systems analyses using the EnergyPLANmodel
A simulation model with a high temporal resolution isrequired for conducting simulations of an energy systemlike the Danish with fluctuating energy sources playinga pivotal role in both the current and in the future energy
system Secondly the Danish energy system ischaracterised by a very high degree of CHP productionfor DH and electricity generation Thirdly these CHP-DH systems are equipped with thermal storage allowingthem to shift production of heat from times of increasedelectricity needs to times of reduced electricity needsFurthermore the system is experiencing a slow butgradual transitions towards electric vehicles or vehiclesbased on synthetic fuels which in turn affects electricitydemands and electricity demand patterns heatproduction and biomass usage patterns Finally theenergy system is becoming increasingly complexthrough exploitation of other synergies in the energysystem ndash waste heat streams from industrial producersuse of heat pumps or resistance heaters in individual orDH applications One simulation model that is capableof adequately handling these issues is the EnergyPLANmodel (see comparison to other models in [28]) TheEnergyPLAN has the following model characteristics
bull Focus on the integration of RES in energysystems The model gives particular attention tothe various fluctuating energy sources that maybe utilised to cover electric and heat demandsincluding wind power off-shore wind powerphoto voltaics (PV) geothermal power plantshydro plants with and without dams solarcollectors for heat production either individualor DH connected
bull Entire energy system The model includes theentire energy system with electric heat coolingtransport and industrial demands as well as thetechnologies to supply the different energystreams
bull CHP DH heat pumps storages The modelincludes CHP plants of two types back-pressureplants for small DH system as well as extractionplants for large-scale DH systems
bull Aggregated All demands and productions arerepresented as one single unit with the average ortotal characteristics of the stock units of thevarious types
bull DH is modelled in three groups to representsmall-scale boiler-based systems (Group 1) localCHP plants (Group 2) and large-scale systemsbased on extraction plants (Group 3)
bull Deterministic ndash as opposed to probabilisticbull One hour resolution one year simulation horizonbull Endogenous priorities The system gives highest
priorities to production of a use-it-or-lose-it
nature (wind solar wave) and minimum priorityto the least efficient dispatchable units (boilersfor heat generation and condensing mode powerplants for power generation)
bull Technical or economic optimisation A range oftechnical operation strategies determine whetherthe model make CHP plants follow heatdemands follow a fixed profile or produce in away to match both heat and electricity needs inthe best possible ways With economicoptimisation EnergyPLAN dispatchesdispatchable units in the optimal way on a user-defined electricity market
The model operates with a number of electricitydemands First and foremost what might be denoted theconventional electricity demand described with anannual aggregate and distribution indexes for each hourof the year Secondly inflexible electric heating andcooling demands that are also stated as an annualaggregate combined with hourly distribution indexesThirdly electric vehicles which may be described in themanner of the two first categories ndash but which may alsohave flexible charging or even Vehicle-to-Grid (V2G)capability Lastly a number of energy system internalelectricity demands ndash including heat pumps for DHelectrolysers for hydrogen generation charging ofelectricity storages
In the analyses in this article various means offlexibility are investigated however it should bestressed that these analyses are performed using the one-hour resolution of EnergyPLAN The flexibility of egheat pumps and electric vehicles is clearly limited by thefrequency at which these can be turned on and offwithout efficiency losses or excessive wear and tearhowever any such constraints are under the one hourlevel
Outputs include yearly monthly and hourlyproductions and demands of all energy carriers from allmodelled units as well as RES shares carbon dioxideemissions and aggregated and annual investment costsoperation and maintenance costs fuel costs andemission costs in case costs are included
It should be noted that EnergyPLAN is a single-node(ldquocopperplaterdquo) model thus any actual physical gridlimitations within the system will not affect theoperation as simulated in EnergyPLAN This is asimplification however as demonstrated in previouswork [12142930] optimal operation of local CHPsand local integration lower demands of the transmission
International Journal of Sustainable Energy Planning and Management Vol 07 2015 101
Poul Alberg Oslashstergaard Frits Moslashller Andersen and Pil Seok Kwon
grid as well as transmission grid losses The grid(transmission as well as distribution) will be affected bya move towards an energy system which relies more onelectricity however since this move is alreadyundergoing and should occur the grid will need toadapt This however goes beyond the current analyses
Another potential shortcoming of the model and theschool of models is represent is the fact that it does notendogenously handle probability or input variabilitysuch variations must be handled exogenously if requiredIn particular when performing long-term scenarioanalyses as in this case with on the one hand expectedclimate changes and on the other hand naturallyoccurring shifts in demand these have to be captured tobe adequately reflected in the modelling Climaticvariations affecting productions (wind power PV-production wave power production CHP production)and demands (heating and cooling needs) wouldoptimally be included These expected changes causedby climate change are small compared to variations fromyear to year though From 2010 to 2014 the averageyearly Danish wind energy varied from 896 and1060 of the long-term average (see [31]) Thus inter-annual variations are considerable and cause significantfluctuations in productions Since these analyses are tiedto a certain scenario this is not reflected here as outputsare adjusted to reflect externally given scenario outputs(using the correction factor in EnergyPLAN see [32] fordetails) In addition previous analyses have revealed thatthe exact shape of the wind distribution profile is notpertinent for the evaluation of scenarios Scenarios thatintegrate wind power well with the distribution profile ofone year will also perform well with a distribution curvefrom another year
Demand changes inflicted by climate change are notreflected in the modelling As for the demand curvevariations occurring through shifts in behaviour andthrough shifts between sectors these are reflectedthough the Helena forecasting (see Section 22)
EnergyPLAN has been used in a series of articles onsupra-national energy scenarios (eg Europe [33])national energy systems scenarios (eg China [34]Ireland [35] Croatia [36] and Romania [37]) regional orlocal energy scenarios[3839] as well as in worksdetailing the performance of specific technologies inenergy systems [4041] The model has been applied innearly 100 peer-reviewed journal papers [42]
22 Hourly demand curve projections using theHelena forecasting model
From hourly metering of demand by individualcustomers we know that categories of customers havequite distinct demand profiles and contribute quitedifferently to the aggregate load For one week in 2012Figure 1 shows the aggregate load profile and thecontribution by categories of customers and Figure 2shows the seasonal variation in the demand profiles bycategories of customersFrom Figures 1 and 2 key observations are
bull The total demand has two daily peaks a day-time and an evening peak
bull Demand is high on workdays and lower inweekend
bull Production sectors mainly consume during theday-time on workdays and households mainlyconsume at evenings and in weekends
bull The day-time peak is shortest for Publicservices Industry has a longer day-time peakand Private services have the longest day-timepeak
bull Public services also have a small evening peakall days This is due to public lighting
bull Friday has a shorter aggregate day-time peakthan other workdays Mainly Industry andPublic services have a shorter day-time peak onFridays
bull Over the year the level of demand is high duringwinter and low during the summer
bull The evening peak disappears during thesummer
102 International Journal of Sustainable Energy Planning and Management Vol 07 2015
Energy Systems Scenario Modelling and Long Term Forecasting of Hourly Electricity Demand
4
3
2
1
0Mon Mon
0
1
2
3
4
5
6
Tue Wed Thu
Cat
egor
ies
[GW
]
Tota
l [G
W]
Fri Sat Sun
AgriculturePublic services
IndustryTotal
HouseholdsPrivate services
Figure 1 Hourly electricity demand by categories of customers
January 16 to 22 2012 (data source Panel data [54])
International Journal of Sustainable Energy Planning and Management Vol 07 2015 103
Poul Alberg Oslashstergaard Frits Moslashller Andersen and Pil Seok Kwon
[GW]
25
20
15
10
05
001 4 7 10
Households
13 16 19 22
Jan Feb Mar Apr May JunJul Aug Sep Oct Nov Dec
[GW]
60
50
40
30
20
10
001 4 7 10
Total
13 16 19 22
Jan Feb Mar Apr May JunJul Aug Sep Oct Nov Dec
[GW]
05
0404
03030202010100
1 4 7 10
Agriculture
13 16 19 22
Jan Feb Mar Apr May JunJul Aug Sep Oct Nov Dec
[GW]
16
12
14
10
08
06
04
02
001 4 7 10
Industry
13 16 19 22
Jan Feb Mar Apr May JunJul Aug Sep Oct Nov Dec
[GW]
12
10
08
06
04
02
001 4 7 10
Private services
13 16 19 22
Jan Feb Mar Apr May JunJul Aug Sep Oct Nov Dec
[GW]
10
0506070809
0403020100
1 4 7 10
Public services
13 16 19 22
Jan Feb Mar Apr May JunJul Aug Sep Oct Nov Dec
Figure 2 Average hourly electricity demand on workdays in 2012 for different categories of customers in Denmark
(Data source Panel data [54])
bull Seasonal variation in the aggregate load ismainly due to variation within Households andPublic services (Demand by Industry and Publicservices is low in July This is mainly due tocompanies having closed for summer holidays 1to 3 weeks in July)
Modelling hourly electricity demand for each of thecategories of customers shown in Figure 2 on data for2010 we estimate the equation
(1)
where ct is the electricity demand at hour t for a givencategory of customers and Dt
d Dtm Dt
h are a number ofzeroone variables representing various types of days(d)dagger 12 months (m) and 24 hours (h) respectively andαd αdm αdmh are coefficients The αdmh coefficientsdescribe the shape of the daily demand profile for a
c a D a D a Dtd d
t
dd m
mmt
d mt
t= +sum sum sum hh
h ε
given month (the shape of one curve in Figure 2) theadm coefficients describe the monthly level of demand(the relative positionlevel of one curve in Figure 2) andad describes the average hourly demand (average overthe year) for the type of day (the absolute level of onecurve) That is for a given hour demand is determinedas ad bull adm bull admh Finally coefficients are normalizedby imposing the restrictions
that is the arithmetic mean of the coefficients is 10 andfor a given h and m if the admh is 12 for this hourdemand is 20 larger than the average demand of themonth and if the adm for this month is 15 demand in thishour and this month is 80 (12 bull 15 = 18) larger thanthe annual average for the type of day d For details on theestimations and the estimated coefficients see [22]
3 Forecasting hourly Danish electricity demand
Using the model for projections we assume that theprofile (that is the estimated coefficients) per category ofcustomers is constant As the weight of customerschange and as the categories of customers contributedifferently to the aggregate load the profile for theaggregate load will change
Mathematically the aggregate load (hourly demandhour t) in a future year T is calculated as
(2)
where are the annualdemand by category i in the base year B and the forecastyears T respectively and ct
i is the hourly demand bycategory i modelled by Eq(1) kT
i expresses the relativechange in demand by category i from the base year tillthe year of projection Projections of the annualelectricity demand by categories of customers (ET
i inEq(2)) are provided by the EMMA model [43] EMMAforecasts annual energy demand by types of energy andlinks demand by categories of customers to economicindicators like prices income and production in sectors
k E EiT E
E iB
iTi
T
iB= and and
C k ct TiT
iit = sdotsum
for all
and for all
dd m
m
d and md m h
a
a
=
=
=sum 12
24
1
12
hh=sum
1
24
It is an annual econometric model that describes generaleffects of population GDP production income pricesand substitution between goods and types of energy Themodel distinguishes 22 production sectors three typesof households and seven types of energy and has formany years been used for official forecasts of energyand electricity demand by the Danish Energy Agencyand the Danish TSO Energinetdk respectively Thelatest version of the model is documented in [43] Atypical equation in EMMA links the annual climatecorrected demand of a specific type of energy to anactivity variable (eg the production in a sector or thenumber of households and income per household)energy prices capturing the substitution between typesof energy and includes a trend variable to describechanges in energy efficiencies Equations are specifiedas log-linear with an error-correction-mechanism todescribe long term equilibrium and annual adjustmentstowards the equilibrium allowing short- and long termelasticities to differ
The latest baseline forecast of the annual electricitydemand by the Danish TSO Energinetdk is shown inTable 1 For conventional demand the baselineprojection reflects a central projection of the economicdevelopment by the Danish Ministry of Finance the oilprice projected by the international Energy Agency inWorld Energy Outlook 2013 [44] and a continuation ofpast trends and behaviour From 2012 to 2020 GDP isexpected to increase by 2 pa and from 2021 to 2030by 13 pa The oil price is expected to increase fromabout 100$bbl in 2013 to 140 $bbl in 2035 Thebaseline also includes a projection of the introduction ofelectrical vehicles and individual heat pumps Clearlywith a changing energy system and further focus onenergy savings projection of conventional demand isuncertain and especially the introduction of newconsuming technologies like electrical vehicles andindividual heat pumps is uncertain However in thisanalysis the projections are mainly used to illustratequalitative effects of likely changes in the aggregateddemand profile So although the absolute level ofdemand is uncertain the baseline may serve to illustratequalitative changes
From Table 1 it is seen that demand by householdsand agriculture is expected to increase moderately thatdemand by industry and private service is expected toincrease considerably and that demand by publicservices is expected to decrease In addition it isexpected that the introduction of electrical vehicles and
104 International Journal of Sustainable Energy Planning and Management Vol 07 2015
Energy Systems Scenario Modelling and Long Term Forecasting of Hourly Electricity Demand
individual heat pumps in 2030 will add approximately4 to the electricity demand
It should be noted that the data in Table 1 are notcomparable to the scenario by the Climate Commissionfrom Section 4 which is targeting a society fuelled 100by RES mdash and where transportation and individualheating to a large extent is shifted to electricity
Looking at Figure 2 industry and private servicesmainly contribute to the demand during day-time onworkdays Assuming unchanged profiles per customercategory the projected development in the annual demandimplies that mainly the day-time peak increases Lookingat conventional demand Figure 3 shows the projectedprofiles for January and July for the years 2012 2020 and2030 Although the day-time demand increases more thanthe evening peak in January the projected daily peak isstill the evening peak and in general the aggregateddemand profile changes only marginally
Including the new demands by electrical vehicles andindividual heat pumps and assuming that these demands
are not flexible individual heat pumps are expected tohave a demand profile identical to a normal heatingprofile in Denmark and in the simple (but also mostextreme) case electrical vehicles will be plugged in afterwork from 6 pm and be fully charged after 4 hoursHowever as Danish taxes on electricity consumed byhouseholds are considerably higher than taxes paid bycompanies charging at work will be a perfect employerbenefit Therefore as an alternative we analyse a profilewhere 12 of the electrical vehicles are charged at workfrom 8 am and the other 12 is charged at home from 6pm That is compared to the most extreme case demandby electrical vehicles is split between two periodsreducing the peak demand by electrical vehicle to thehalf For 2030 the effects on the hourly demand inJanuary and July are shown in the Figures 4 and 5
As seen from Figure 4 while changes in theconventional demand changes the level of the demandprofile the introduction of new demand categorieschanges both the level and the hourly demand profile
International Journal of Sustainable Energy Planning and Management Vol 07 2015 105
Poul Alberg Oslashstergaard Frits Moslashller Andersen and Pil Seok Kwon
Projected electricity Change consumption [GWh] [coefficient ki
T] in Eq (2)
2012 2020 2030 2012ndash2020 2012ndash2030Households 9750 9774 10042 10025 10299Agriculture 1847 1818 1895 09841 10255Industry 7309 7983 8419 10922 11520Private service 9604 9937 10801 10346 11246Public service 2412 2272 2355 09418 09763
30922 31783 33512 10278 10837Electrical vehicles 0 140 660Individual heat pumps 73 431 778Total 30995 32355 34949 10439 11276
Table 1 Projected electricity demand for aggregated categories of customers in Denmark
Source [45] and own calculations in [46]
7
[GW] Workday
6
5
4
3
20 5 10 15 20 25
2030 Jan2020 Jan2012 Jan2030 Jul2020 Jul2012 Jul
7
[GW] Non-workday
6
5
4
3
20 5 10 15 20 25
2030 Jan2020 Jan2012 Jan2030 Jul2020 Jul2012 Jul
Figure 3 The hourly demand profile for existing categories of customers 2012 2020 and 2030 January and July
106 International Journal of Sustainable Energy Planning and Management Vol 07 2015
Energy Systems Scenario Modelling and Long Term Forecasting of Hourly Electricity Demand
7
[GW] Workday
6
5
4
3
20 5 10 15 20 25
JanConv + HPJulConv + HP
JanConvJulConv
JanConv + HP + ElvJulConv + HP+ Elv
7
[GW] Non - Workday
6
5
4
3
20 5 10 15 20 25
JanConv + HPJulConv + HP
JanConvJulConv
JanConv + HP + ElvJulConv + HP+ Elv
Figure 4 Effects on the hourly demand from the introduction of individual heat pumps (HPs) and electrical vehicles
(EVs) charged after work in 2030
JanConv + HPJulConv + HP
JanConvJulConv
JanConv + HP + Elv (alt)JulConv + HP+ Elv (alt)
7
[GW] Workday
6
5
4
3
20 5 10 15 20 25
JanConv + HPJulConv + HP
JanConvJulConv
JanConv + HP + Elv (alt)JulConv + HP+ Elv (alt)
7
[GW] Workday
6
5
4
3
20 5 10 15 20 25
Figure 5 Effects on the hourly demand from allowing half of the electrical vehicles to be charged at work (EV(alt)) in 2030
Individual heat pumps mainly change the seasonaldemand profile demand increases considerable duringthe winter (represented by the profile for January wheredemand is already very high) while the demand duringsummer is almost unchanged Electrical vehicles mainlychange the daily profile while seasonal variations arelimited In the worst case where all electrical vehiclesare charged after work the evening peak increases app10 (shown in Figure 4) while this is reduced to anincrease of app 5 if half of the vehicles are charged atwork (shown in Figure 5) That is seen from theperspective of the electricity system charging part of thevehicles at work is preferable but this reduces the taxrevenue considerably
Combining Figures 3 4 and 5 Table 2 shows thedemand in January at 7 pm assuming differentcharging profiles for individual heat pumps andelectrical vehicles If heat pumps and electrical vehiclesare flexible customers and therefore not using electricity
Cur
tailm
ent f
ract
ion
[]
0 - 10
- 8
- 6
- 4
- 2
0
2
Janu
ary
Feb
ruar
y
Mar
ch
Apr
il
May
June
July
Aug
ust
Sep
tem
ber
Oct
ober
Nov
embe
r
Dec
embe
r
5
10
15
20
25
2050_DC12
2050_DC50Change
Figure 6 Curtailment fraction for off-shore wind in CC2050 with
electricity demand curves from 2012 (2050_DC12) and 2050
(2050_DC50) Note the change between the curves shown along
the right axis is not in percentage point but in percent
at peak hours due to increased conventional demand thepeak in January at 7 pm is expected to increase about5 only If individual heat pumps follow a standardheating profile in Denmark heat pumps are expected toincrease the peak demand by additional 3 In the worstcase where all electrical vehicles are charged after workfrom 2012 till 2030 the average peak at 7 pm in Januaryincreases from 572 GW to 665 GW or about 16 InJuly the daily peak at 7 pa increases from 385 GW to460 GW or about 19 That is the -change is larger inthe summer than in winter but the absolute change is 25larger in the winter than in the summer As is seen fromTable 1 the aggregate demand is expected to increase128 from 2012 to 2030 That is in the worst case thepeak demand increases somewhat more If only 12 of theelectrical vehicles are charges after work the increase at 7pm is reduced to about 12 That is depending on theflexibility of individual heat pumps and electrical vehiclesthe expected demand at 7 pm in January 2030 is between5 and 16 larger than in 2012
For the subsequent analyses of 2050 we only applythe shape of the demand profile not the actual size as wecombine the shapes with the electricity demand of thementioned scenario by the Climate Commission Oneelement which has not been included in the assessment ofthe demand profile is energy savings with an impact onthe temporal distribution of the electricity demandwhere some electricity demands like refrigerationfreezing and stand-by demands are relatively stablethroughout the 24h of the day other demands are morerelated to behavioural pattern mdash cooking entertainmentdomestic hot water (DHW) (if produced by electricity)ventilation and washingdrying - or external factors suchas the presence of daylight and thus notably indoor andoutdoor illumination Savings in different areas will thusimpact the demand profile differently
For the analyses of 2030 hourly variations curves forthe classic electricity demand the individual heat pumpsand electric vehicles will be used
4 High-RES scenario for Denmark
Denmark has a long-term objective of beingindependent of fossil fuels in the energy and transportsectors by 2050[1] With that aim the DanishGovernment established a so-called ClimateCommission in 2008 given the task of makingsuggestions as to how this vision might be reached[47] This work resulted in a series of suggestionsincluding increasing deployment of REStransportation based on electricity and biofuels focuson energy efficiency and a smart and flexibleelectricity system The work also included holisticscenario design and energy systems simulations thoughonly for limited simulation periods
41 The Danish Climate Commissionsrsquo year 2050100 Scenario
Two different scenarios were established by the ClimateCommission for 2050 (CC2050) the Ambitious and theUnambitious mdash labelled Future A and Future Urespectively In this article we use Future A as ourreference system This scenario has been adapted to theEnergyPLAN model in previous work [48] where it isdescribed in detail thus in this article only the mainparameters are included One important aspect of theCC2050 scenarios the scenarios do not detail theelectricity demand by sectors nor by temporaldistribution
In the CC2050 Future A scenario the electricitydemand is 885 TWh (See Table 3) compared to 357TWh in 2010 for all demands [49] The significant
International Journal of Sustainable Energy Planning and Management Vol 07 2015 107
Poul Alberg Oslashstergaard Frits Moslashller Andersen and Pil Seok Kwon
2012 2030
Conventional Conventional
individual heat individual heat pumps
Conventional and pumps and electrical and electrical vehicles
total individual heat vehicles charged charged at work anf
[GW] Conventional [GW] pumps [GW] after work [GW] after work [GW]
Januar at 7 pm 572 603 620 665 642-change from 2012 54 84 163 123
Table 2 Aggregated demand January at 7 pm in GW assuming different demand profiles by individual heat
pumps and electrical vehicles
increase is due to the electrification of new sectors InTable 3 the first two columns show the demand sectorsas listed in the original scenario where the separate gridlosses are a noticeable component EnergyPLAN treatsall electricity (and DH) demands as supplied ex worksthus electricity demands must include grid losses Thusthe separately given grid losses are distributedproportionally on specific demands In addition certaincategories are aggregated to reflect the aggregation levelin EnergyPLAN Final demands modelled inEnergyPLAN are thus shown in the two last columnsDH demands amount to 369 TWh including DH gridlosses Individual heat demands (ie non-DH covered
space heating and Domestic Hot Water (DHW)production) amount to 1674 TWh covered by 195 TWhof biomass boilers (η = 07) and 410 TWh of electricityfor HPs (COP = 375)
The production system is characterised by a largeshare of wind power both off-shore and on land Wavepower and photo voltaics also play major roles mdash seeTable 4 for details The scenario has a large increase inthe interconnection capacity to neighbouring SwedenNorway and Germany however since our goal is toanalyse the impacts on the energy system performanceand flexibility the system is modelled in island-modeOne reasons is that including the planned 12 GW of
108 International Journal of Sustainable Energy Planning and Management Vol 07 2015
Energy Systems Scenario Modelling and Long Term Forecasting of Hourly Electricity Demand
Table 4 Scenario parameters for CC2050 Information based on [47485051]
Installed capacity
Unit [MWe] Characteristics
Off-shore wind 14600 Production 597 TWh ~ 4090 full-load hoursOn-shore wind 4000 Production 143 TWh ~ 3568 full-load hoursWave power 450 Production 100 TWhy ~ 2222 full-load hoursPhotovoltaic 3250 Production 300 TWhy ~ 923 full-load hours Condensing mode capacity 15000 ηe=45 Sized to be able to function as backupCHP capacity 2500 ηe=40 ηh=50 Annual DH demand 369 TWh (also
covered by DH HP and waste incineration CHP)Waste incineration 365 Fixed fuel input 12 TWhy ηe=267 ηh=773 DH HP 4500 COP 375Individual HP 837 COP 375 Annual individual heat demand of 169 TWh
covered by solar 08 TWh biomass boilers 13 TWh andHP 147 TWh (the latter is based on the electricity
demand in Table 3 - excl grid loss)Electrolyser synthetic fuel 3100 η=68 Capacity is twice the capacity required for base-
load production of the annual hydrogen demandInterconnection capacity (12000) To Norway Sweden and Germany
Annual demand Annual demandDemand sector [TWh] Aggregated sectors [TWh]
Electric vehicles and trains 205 Electric vehicles amp weighted grid loss 212Geothermal energy 05 District heating HP and Absorption HP 56District heating HP 47 (AHP) amp weighted grid lossCommercial HP 06 Individual HP amp weighted grid loss 41Residential HP 33Industrial processes 171 Demands following a fixed curve 484Industry - other 63 Including trains amp weighted grid lossCommercial - other 118Residential - other 99Biofuel production 87 Biofuels (assumed hydrogen-based) amp
weighted grid loss 92Grid losses 51 mdashTotal 885 885
Table 3 Danish electricity demand in 2050 according to the Ambitious Scenario of the Danish Climate Commission AHPs are
absorption HPs typically utilising low-temperature (60-80degC) geothermal reservoirs Based on [50]
interconnection capacity would not test the energysystemrsquos flexibility to any extent and a second reason isthat while nominal interconnection capacity might besignificant useable interconnection capacity would besignificantly less during the relevant windy periodsassuming similar developments in neighbouringcountries In EnergyPLAN terms the system is thusmodelled in a technical regulation strategy 3 where themodel seeks to balance both heat and electricity systemswithout the use of importexport
The scenario lacks details on EV technologycharging battery and potential discharging hence thesame ratio between aggregate annual demand andinstalled battery capacitycharging power as in the 2030Scenario are used (see next section) It is assumed thatEVs may discharge back to the grid (so-called V2GVehicle to Grid) with a cycle efficiency of 081 (=092)The sensitivity of using this ability is investigatedfurther in the 2030 scenarios
While this scenario is a specific case with a specificcomposition of the energy system it is very muchaligned with independent work by researchers in eg theCEESA project [5253] the Danish Society of Engineers(IDA)[54-56] as well as with official Danish targets ofhaving a 100 RES-based electricity and heat supply by2035 mdash primarily based on wind power and a 100RES-based energy system by 2050 In all scenarioswind power plays the dominant role heating andtransportation is switched to electricity where possibleand biomass use is strongly restrained Thus whileresults naturally apply only to the specific case they doapply more generally to the Danish energy future as wellas to energy futures of countries with a similarcomposition as Denmark It is however impossible tomake generally valid statements based on a caseconsidering that all areas have different energycircumstances and that transition to 100 RES-supplyshould be adapted to local conditions
42 Intermediate 2030 scenarioIn order to make the 2030 analyses a correspondingscenario is set up for this year Electricity demands arebased on the forecast described in Section 3 mdash see Table5 As stated in Section 1 by 2030 the ambition is to havephased out coal entirely and have phased out oil fromheating The projection in Section 3 reveals a heat demandfor individual heat pumps of 16 TWh by 2030 howeverthis projection is based on trends rather than the target ofan oil-free heating supply in 2030 Thus we apply thehourly variation from Section 3 but the aggregated totalfrom the 2050 Scenario mdash ie 41 TWh cf Table 3
The projection does not detail district heating heatpumps the same level as the 2050 scenario is used
The EVs demand for 2030 in Table 5 is modestcompared to the level in 2050 the remainder isassumed fossil-based and does not impact the workingsof the rest of the energy system The EV demandcorresponds to 300 000 vehicles each using 22 MWhannually + 57 grid losses For comparison thenumber of personal vehicles in Denmark January 1st
2015 was 233 million in addition to which comes 044million vanslorriesroad tractors and 13408 busses[57]For the analyses a charging capacity of 10 kW and abattery capacity of 30 kWh is use in line with[58]Thus there is a total charging capacity of 3 GW and atotal battery capacity of 9 GWh for the 2030 ScenarioIt should furthermore be noted that it is assumed thatthe electricity demands are measured at the grid-side ofthe battery charger for both the 2030 and the 2050Scenario
It should be noted that the electricity demand forelectric vehicles in the 2050 scenario is very large (20TWh[50] or 212 TWh incl grid losses) compared to the2030 scenariorsquos 07 TWh Contributing factors includethat in the 2050 scenario EVs have a 90 penetration interms of fuel demand for personal vehicles and 70 forbusses and lorries[50]
International Journal of Sustainable Energy Planning and Management Vol 07 2015 109
Poul Alberg Oslashstergaard Frits Moslashller Andersen and Pil Seok Kwon
Table 5 Danish electricity demand in 2030 according to 2015 prognosis Including the same relative grid loss as in 2050
Demand categories Annual demand
[TWh]
Electric vehicles amp weighted grid loss 070District heating HP and Absorption HP (AHP) amp weighted grid loss ndashIndividual HP amp weighted grid loss 091 Demands following a fixed curve Including trains amp weighted grid loss 3851Biofuels (assumed hydrogen-based) amp weighted grid loss 0Total 4012
Photo voltaics and wave power are modelled at halfthe level of the 2050 Scenario mdash ie 1625 MW and 225MW and as 2030 is close to year 2035 at which point allelectricity should be RES-based The installed capacityof on-shore wind power is kept at 4000 MW in line withthe 2050 scenario Off-shore wind power is 9000 MWcorresponding to an un-curtailed annual production of3681 TWh
All other factors are identical to the 2050 scenarioFurthermore for both the 2050 and the 2030 scenarioselectricity production variation on wind turbines are basedon actual 2014 data for off-shore and on-shore windturbines respectively from the Danish TSO[6] whilephoto voltaic and wave-power demand variations aregeneric Danish variations from the EnergyPLANlibrary Newer data was regrettably not available
Using generic data for solar and wave power doesintroduce an element of error as wind and wave clearly isstrongly correlated though with a production up till sixhours out of phase Wind and solar is also slightlycorrelated but mainly in out-of-the-ordinary very high-wind situations For this work distributions of wavepower were available for measurements from 1999 and2001 (see [59] for methodology) To test the impact of thechoice scenarios were modelled with three differentdistributions the 2001 (which is used in all other analyses
in this article) the 1999 distribution and a constantdistribution Aggregated annual results were generally notaffected by the choice of distribution Approximately 1 permilless off-shore wind power was curtailed when using aconstant production from wave-power than when usingthe 1999 or 2001 distribution Observing individualhours effects are naturally larger however this articlefocuses on aggregated annual effects A primary reasonfor this negligible effect of the distribution curve is thefact that wave power in the scenarios generate 05 TWhper year while wind power generate approximately 50TWh per year thus the share pales by comparison
District heating demand variations are based a casefrom Aalborg with a 30 demand reduction in roomheating demand (see [38])
43 Scenario OverviewThe 2030 and the 2050 scenarios are modelled as listedin Table 6
For individual houses using HPs the same heatdemand curve is used across scenarios In the 2030 Fixthere is no flexibility thus electricity demands followsheat demand exactly (and the electricity demand is infact included into the classic demand) ndash but for theother scenarios HPs are dispatchable from the
110 International Journal of Sustainable Energy Planning and Management Vol 07 2015
Energy Systems Scenario Modelling and Long Term Forecasting of Hourly Electricity Demand
Scenario Demand Production Hourly Variation profile
2050_DC12 As in CC As in CC 2050 EV and HP dispatched by EnergyPLAN2050 100 RE Normal demand according to fixed hourly demand
curve for 20122050_DC50 As in CC As in CC 2050 EV and HP dispatched by EnergyPLAN
2050 100 RE Normal demand according to fixed hourly demandcurve for 2050
2030 Flex As in 2030 100 RE in heat and EV and HP dispatched by EnergyPLANprognosis electricity Normal demand according to fixed hourly demand
curve for 20302030 Fixed As in 2030 100 RE in heat and EV and HP according to fixed demand curves
prognosis electricity HP with one temperature-derived curveEVs with three alternative demand curves
-Charging during night-Charging from 18-21 in the evening-Charging half from 8 - half from 18
Normal demand according to fixed hourly demandcurve for 2030
Table 6 Scenarios DC12 and DC50 signify Demand Curve 2012 and 2050 respectively
International Journal of Sustainable Energy Planning and Management Vol 07 2015 111
Poul Alberg Oslashstergaard Frits Moslashller Andersen and Pil Seok Kwon
EnergyPLAN model which utilises a storage tominimise electricity exports Unless otherwise notedthe storage corresponds to seven days of average heatdemand
Mathiesen et al state ldquoSmart Energy System focuseson merging the electricity heating and transportsectors in combination with various intra-hourhourly daily seasonal and biannual storage optionsto create the flexibility necessary to integrate largepenetrations of fluctuating renewable energyrdquo[53]This is in line with the Flex-scenario where EVs andHP are dispatched according to momentary system
needs The traditional electricity demand is notflexible in this scenario however as Kwon amposlashstergaard has determined effects of this are verylimited indeed[48]
5 System response to demand forecasts for2050
The energy plan model gives priority to electricityproduction made from use-it-or-lose-it RES productionand subsequently production in CHP mode whereaselectricity made in condensing mode is avoided ifpossible The level of condensing mode operation is thus
Table 7 District heating production for CC2050 with 2012 electricity distribution (2050_DC12) and forecasted 2050 electricity
distribution (2050_DC50) Numbers 1ndash3 refer to the district heating groups in EnergyPLAN
District heating
[TWh] 2050_DC12 2050_DC50
Boiler 1 268 268Heat Pumps 2 596 596Boiler 2 005 005CHP 2 217 216Waste 2 332 332Solar 2 090 090Heat Pumps 3 1193 1194CHP 3 000 000Waste 3 595 595Solar 3 162 162Boiler 3 001 001Industrial CHP 3 245 245Sum 3704 3704
Table 8 Electricity generation for 2050 with 2012 electricity demand curve (2050_DC12) and forecasted 2050
electricity demand curve (2050_DC50)
Electricity
[TWh] 2050_DC12 2050_DC50
Industrial CHP 370 370Wind Off-shore 5595 5594Wind on-shore 1429 1429Wave 100 100PV 300 300CHP 174 173Condensing mode powerplants 1319 1320Import 000 000Export 000 000Sum 9287 9286
112 International Journal of Sustainable Energy Planning and Management Vol 07 2015
Energy Systems Scenario Modelling and Long Term Forecasting of Hourly Electricity Demand
Table 9 Electricity production and corrected fuel consumption for scenarios 2030 Fixed and 2030 Flex
Import and export in all scenarios is zero
an indication on how well a system integratesfluctuating renewable energy sources as also discussedin [6061] Similarly within heating priority is given touse-it-or-lose-it technologies followed by HP CHP andboilers
Effects on the system performance according tochoice of demand curve (DC12 or DC50) are marginalaccording to the EnergyPLAN simulations Heatproduction is practically unaffected on an aggregateannual basis and so is the electricity system (See Tables7 and 8)
In the analysis any excess that cannot be integratedthrough dispatching dispatchable units appropriately isreduced through three chosen successive steps a) CHPis replaced by boiler production b) boiler production isreplaced by electric boiler production and c) off-shorewind power production is curbed
The first two steps render little assistance thuscurbing or curtailing off-shore wind power productiondominates The curtailment fraction (see [42]) variesover the year with monthly averages ranging from nil tonearly 23 (See Figure 5)
One difference between the two scenarios is that thecurtailment fraction tends to be higher with the 2050demand profile during the winter months and vice versahigher during the summer months with the 2012 profileas a result of slight change in the annual distribution ofthe electricity demand
6 System response to flexible or staticoperation of EVs and HPs in 2030
The second set of analyses take their starting point in a2030 situation with less electric transportation and less
electric heating Meanwhile the system is analysedunder four different circumstances as listed in Table 6with heat pumps and electric vehicles dispatched byEnergyPLAN and using three defined demand profilesone fixed for heat pumps and two alternative EVcharging patterns Furthermore the scenarios whereEVs and HPs are dispatched by EnergyPLAN are alsoanalysed for sensitivity to key input factors EV batterysize EV charging capacity V2G ability and storagesfor heat pumps in individual dwellings
Using a fixed demand profile for HPs and EVsreduces the off-shore wind utilisation while moreelectricity will be produced on dispatchable thermalplants ndash CHP and condensing mode plants The lowestutilisation of off-shore wind power ndash and thus thehighest curbing ndash is in the case where EVs are chargedin the evening from 18-21 corresponding to a chargingpattern where people return from work and plug in thevehicle Compared to this off-shore wind power has amarginally higher utilisation with the other EV fixedcharging profiles For the flexible scenariosutilisation is between 14 and 55 higher Thelowest effect is under the standard conditions asdefined in Section 4 and with 50 higher chargingcapacity (thus 4500 MW) and with 50 additionalbattery capacity (thus 135 GWh) Adding seasonalheat storage enables a 29 higher utilisation of off-shore wind power but even a storage with a contents ofone average week increases the utilisation of off-shore wind power by 22 Note of course that suchstorage need not be a fully conventional storage with afluid storage liquid the building mass in itself has alarge storage capacity What really increases the
Fixed HP and EV Flexible HP and EV
V2G + EV 4500 Battery
EV 18 EV morn+ Standard Heat Heat Battery 135
[TWh] 21 evening V2G storage storage 135 V2G 4500
Industrial CHP 37 37 37 37 37 37 37 37 37Wind Off-shore 188 1882 1907 1955 1935 198 1907 1907 1983Wind on-shore 1426 1426 1426 1426 1427 1427 1426 1426 1426Wave 05 05 05 05 05 05 05 05 05PV 15 15 15 15 15 15 15 15 15CHP 144 144 141 141 141 141 141 141 141Condensing mode power plants 506 504 482 444 466 431 482 482 422Sum 4526 4526 4526 4536 4539 4549 4526 4526 4542Corrected Fuel consumption 5644 5641 5586 5504 5552 5475 5475 5585 5454
International Journal of Sustainable Energy Planning and Management Vol 07 2015 113
Poul Alberg Oslashstergaard Frits Moslashller Andersen and Pil Seok Kwon
integration of off-shore wind power is the utilisationof V2G which also reduces condensing mode powergeneration significantly up to 166 with additionalchargingdischarging capacity of 4500 MW andadditional battery capacity of 135 GWh
Thus even with the limited demands for EVs and HPsin this 2030 scenario there is a significant flexibility tobe harnessed and exploited for the purpose of optimisingthe integration of wind power which on the one handdecreases the curtailment of wind power and on the otherhand decreases the use of condensing power generation
Another observation from Table 9 is that whether allEVs are charged during the evening or half of the EVsare charged at work from 8 am has little effect for thesystem However allowing half of the EVs to becharged at work considerably reduces the tax revenuefrom electricity taxes
In the systems analyses condensing mode powerproduction capacity is merely included at the levelrequired to satisfy any discrepancy between electricitydemands and productions based on fluctuating RESand CHP Thus the installed capacity and thusassociated costs vary between the scenarios ChargingEVs between 18 and 21 in the evening sets the highestrequirement for condensing mode capacity at 5652MW followed by charging in the morning andevening at 5415 MW The flexible HP and EVscenarios range from 5060 MW for the two scenarioswith large heat storage to 5249 MW for the otherflexible scenarios Thus capacity reductions between237 and 592 MW (42 to 105) may be realised by aspreading the fixed charging pattern of EVs bintroducing flexible charging of EVs and cintroducing flexible dispatch of individual heat pumpscombined with heat storages
7 Conclusion
This article has investigated the evolution of the Danishelectricity demand in the medium term (2030) and thelong term (2050) based on energy systems simulationsof an energy system with 100 RES in heating andelectricity (2030) and with 100 RES in heatingtransportation and electricity supply (2050)
In the medium term it is found that the flexibility ofindividual HPs and EVs may assist in the integration ofwind power even though the individual heat pumps onlycover the part of the heat demand (34 TWh) that is notcovered by district heating (369 TWh) and that only300 000 private vehicles are converted to electricity
Curtailment of off-shore wind power is reducedelectricity production in condensing mode is decreasedinstalled capacity of same may be reduced as willprimary energy supply
In condensing mode power generation capacityreductions between 237 and 592 MW may thus berealised depending on how EVs and HPs are introducedto the energy system In the worst of the cases analysedonly 188 TWh out of an uncurtailed off-shore windpower production of 3681 TWh is used while in thebest case with V2G and extra battery this number is1983 Thus an extra TWh of electricity is integrated bythis means It should be noted though that the installedoff-shore wind power capacity is not adjusted to matchthe annual demand it does actually produce too muchThus with a closed island system there will inevitablybe off-shore wind power curtailment
Changing the EV charging schedule from a fixed18ndash21 in the evening to a morning plus eveningcharging decreases wind power curtailment andcondensing mode power operation but making themflexible to the extent of even enabling V2G operationmaybe increase benefits considerably Of coursecharging vehicles at work will have derived effects inthe form of reduced tax revenues mdash assuming vehiclesare charged at work with low-tax electricity
In the long term (2050) the entire personal vehiclefleet will be changed to electricity adding even moreflexibility to the system The changes in the traditionalelectricity demand coming as a consequence of shifts inthe weights of consumption sectors will have verylimited effects on the energy system performance ndashparticularly since the energy system is characterised bysuch large flexible loads Using off-shore wind powercurtailment as metrics for assessing the systemrsquos abilityto integrate wind power results vary over the yearGenerally the monthly curtailment share is within a 2band when changing from the 2012 load curve (LC_12)to the 2050 load curve (LC_50) One month has achange of more than 8 however this change isbetween two small numbers Observing annualproduction figures slight differences in the order of 001TWh exists between some production and demandcategories with LC_12 compared to with LC_50 Thisrelates to off-shore wind power CHP condensing modepower production and heat pump demand With LC_12off-shore wind power CHP production and HP demandare all 001 TWh higher while condensing mode powergeneration is 001 TWh less with LC_2012 Thesenumbers should be taken with caution though as
114 International Journal of Sustainable Energy Planning and Management Vol 07 2015
Energy Systems Scenario Modelling and Long Term Forecasting of Hourly Electricity Demand
differences represent the last significant digit inEnergyPLAN simulation outputs
Acknowledgements
This study is part of the ENSYMORA project(wwwensymoradk) funded by the Danish Council forStrategic Research
References
[1] Danish Ministry of Climate and Energy Accellerating green
energy towards 2020 - The Danish Energy Agreement of
March 2012 2012 URLhttp wwwens dksitesensdk
filesdokumenterpublikationerdownloadsaccelerating
_green_ energy_ towards_2020pdf
[2] Klima- EoB Energipolitisk Redegφrelse 2013 2013
URLhttpwwwensdksitesensdkfilesdokumentersideen
ergipolitisk_redegoerelse_2013-1pdf
[3] Oslashstergaard PA Sperling K Towards sustainable energy
planning and management Int J Sustainable Energy Plan
Manage 201411-5 URLhttpdx doiorg105278
ijsepm201411
[4] Parajuli R Looking into the Danish energy system Lesson to
be learned by other communities Renewable and Sustainable
Energy Reviews 2012162191-9 URLhttpdxdoi
org101016 jrser201201045
[5] Kwon PS Oslashstergaard PA Priority order in using biomass
resources - Energy systems analyses of future scenarios for
Denmark Energy 2013 URLhttpdxdoiorg 101016j
energy 201310005
[6] Energinetdk Download of market data 2010
[7] Oslashstergaard PA Geographic aggregation and wind power
output variance in Denmark Energy 2008331453-60
URLhttpdx doiorg101016jenergy200804016
[8] Oslashstergaard PA Ancillary services and the integration of
substantial quantities of wind power Applied Energy
200683451-63 URLhttpdx doiorg101016japenergy
2005 04007
[9] Lund H Large-scale integration of wind power into different
energy systems Energy 2005302402-12 URLhttp
dxdoiorg 101016jenergy200411001
[10] Pillai JR Bak-Jensen B Integration of vehicle-to-grid in the
Western Danish power system IEEE Transactions on
Sustainable Energy 2011212-9 URLhttpdxdoiorg
101109 TSTE2010 2072938
[11] Mathiesen BV Lund H NOslashrgaard P Integrated transport and
renewable energy systems Utilities Policy 200816107-16
URLhttpdxdoiorg101016jjup200711007
[12] Lund H Oslashstergaard PA Electric grid and heat planning
scenarios with centralised and distributed sources of
conventional CHP and wind generation Energy
200025299-312 URLhttpdxdoiorg101016S0360-
5442(99)00075-4
[13] Andersen AN Lund H New CHP partnerships offering
balancing of fluctuating renewable electricity productions
Journal of Cleaner Production 200715288-93
URLhttpwww sciencedirectcomsciencearticleB6VFX-
4JN2NR9-3262fc50eb14e04ef306c3609f6750dca7
[14] Oslashstergaard PA Regulation strategies of cogeneration of heat
and power (CHP) plants and electricity transit in Denmark
Energy 2010352194-202 URLhttpdxdoiorg
101016jenergy 201002005
[15] Lund H Andersen AN Oslashstergaard PA Mathiesen BV
Connolly D From electricity smart grids to smart energy
systems mdash A market operation based approach and
understanding Energy 20124296-102 URLhttp
dxdoiorg 101016jenergy2012 04003
[16] Oslashstergaard PA Comparing electricity heat and biogas
storagesrsquo impacts on renewable energy integration Energy
201237255-62 URLhttpdxdoiorg 101016jenergy
201111039
[17] Oslashstergaard PA Wind power integration in Aalborg
Municipality using compression heat pumps and geothermal
absorption heat pumps Energy 201349502-8
URLhttpdxdoiorg101016j energy201211030
[18] Hedegaard K Mathiesen BV Lund H Heiselberg P Wind
power integration using individual heat pumps - Analysis of
different heat storage options Energy 201247284-93
URLhttpdxdoiorg101016jenergy201209030
[19] Kwon PS Oslashstergaard PA Comparison of future energy
scenarios for Denmark IDA 2050 CEESA and Climate
Commission 2050 Energy 201246275-82 URLhttpdxdoi
org101016jenergy201208022
[20] Pinson P Girard R Evaluating the quality of scenarios of
short-term wind power generation Appl Energy 20129612-
20 URLhttpwwwsciencedirect comsciencearticle
piiS0306261911006994
[21] Pinson P Reikard G Bidlot J- Probabilistic forecasting of the
wave energy flux Appl Energy 201293364-70 URLhttp
wwwsciencedirectcomsciencearticlepiiS0306261911008361
[22] Andersen FM Larsen HV Boomsma TK Long-term
forecasting of hourly electricity load Identification of
consumption profiles and segmentation of customers Energy
Conversion and Management 201368244-52 URLhttp
dxdoiorg101016jenconman201301018
[23] Andersen FM Larsen HV Gaardestrup RB Long term
forecasting of hourly electricity consumption in local areas in
International Journal of Sustainable Energy Planning and Management Vol 07 2015 115
Poul Alberg Oslashstergaard Frits Moslashller Andersen and Pil Seok Kwon
Denmark Appl Energy 2013110147-62 URL httpdxdoi
org 101016japenergy201304046
[24] Kitzing L Mitchell C Morthorst PE Renewable energy
policies in Europe Converging or diverging Energy Policy
201251192-201 URLhttpwwwsciencedirectcomscience
articlepiiS030142151200746X
[25] Kitzing L Risk implications of renewable support
instruments Comparative analysis of feed-in tariffs and
premiums using a meanmdashvariance approach Energy
URLhttpwww sciencedirectcom sciencearticlepii
S0360544213008414
[26] Gottwalt S Ketter W Block C Collins J Weinhardt C
Demand side managementmdashA simulation of household
behavior under variable prices Energy Policy 2011398163-74
URLhttp wwwsciencedirectcom sciencearticlepii
S0301421511008007
[27] Song M Alvehag K Wideacuten J Parisio A Estimating the
impacts of demand response by simulating household
behaviours under price and CO2 signals Electr Power Syst
Res 2014111103-14 URLhttpwww sciencedirectcom
sciencearticlepiiS0378779614000534
[28] Connolly D Lund H Mathiesen BV Leahy M A review of
computer tools for analysing the integration of renewable
energy into various energy systems Appl Energy
2010871059-82 URLhttpdxdoiorg101016japenergy
200909026
[29] Oslashstergaard PA Transmission-grid requirements with scattered
and fluctuating renewable electricity-sources Applied Energy
200376247-55 URLhttpdxdoiorg101016S0306-
2619(03) 00065-5
[30] Oslashstergaard PA Modelling grid losses and the geographic
distribution of electricity generation Renewable Energy
200530977-87 URLhttpdxdoiorg101016jrenene
200409007 [31] Energy and Environmental Data Wind Energy in Denmark
(Vindenergi i Danmark) 2015 (In Danish) URLhttpwww
vindstatdk[32] Lund H EnergyPLAN - Advanced Energy Systems Analysis
Computer Model February 2009 - Documentation Version72 2009
[33] Connolly D Lund H Mathiesen BV Werner S Moumlller B
Persson U et al Heat Roadmap Europe Combining district
heating with heat savings to decarbonise the EU energy
system Energy Policy 201465475-89 URLhttp
dxdoiorg101016 jenpol201310035
[34] Liu W Lund H Mathiesen BV Large-scale integration of
wind power into the existing Chinese energy system Energy
2011364753-60 URLhttpwwwsciencedirectcomscience
articlepiiS0360544211003227
[35] Connolly D Lund H Mathiesen BV Leahy M The first step
towards a 100 renewable energy-system for Ireland Appl
Energy 201188502-7 URLhttpdxdoiorg101016j
apenergy201003006
[36] Cosic B Krajacic G Duic N A 100 renewable energy
system in the year 2050 The case of Macedonia Energy
20124880-7 URLhttpwwwscience- direct comscience
articlepiiS0360544212005300[37] Gota D- Lund H Miclea L A Romanian energy system
model and a nuclear reduction strategy Energy 2011366413-9 URLhttpdxdoiorg101016jenergy201109029
[38] Oslashstergaard PA Mathiesen BV Moumlller B Lund H Arenewable energy scenario for Aalborg Municipality based onlow-temperature geothermal heat wind power and biomassEnergy 2010354892-901 URLhttpdxdoi org101016
jenergy 201008041[39] Oslashstergaard PA Lund H A renewable energy system in
Frederikshavn using low-temperature geothermal energy fordistrict heating Appl Energy 201188479-87 URLhttp
dxdoiorg101016japenergy201003018[40] Pillai JR Heussen K Oslashstergaard PA Comparative analysis of
hourly and dynamic power balancing models for validatingfuture energy scenarios Energy 2011363233-43 URLhttp
dxdoiorg101016jenergy201103014 [41] Mathiesen BV Duic N Stadler I Rizzo G Guzovic Z The
interaction between intermittent renewable energy and theelectricity heating and transport sectors Energy 2012482-4URLhttpdxdoiorg101016 jenergy201210001
[42] Oslashstergaard PA Reviewing EnergyPLAN simulations andperformance indicator applications in EnergyPLANsimulations Appl Energy 2015154921-33 URLhttp
dxdoiorg101016 japenergy201505086
[43] Andersen FM Pade LL Bender AL Olsen C Larsen CMV
Thomsen T EMMA-10 URLhttpwwwensdkda-DK
InfoTalOgKortFremskrivningermodelleremmaSiderForsi
deaspx
[44] IEA World Energy Outlook 2013 Paris France International
Energy Agency 2013
[45] Energinetdk Energinetdkrsquos analyseforudsaetninger 2015-
2035 2015 URLhttpenerginet dkSiteCollectionDocuments
Danske20dokumenter ElEnerginetdk27s 20
analyseforudsaetninger202015-203520-20ekstern
20versiondocx 202516716_2 _1pdf
[46] Andersen FM Elprognose 2014 Lyngby Denmark
Technical University of Denmark 2014
[47] Klimakommissionen Green energy the road to a Danish
energy system without fossil fuels summary of the work
results and recommendations of the Danish Commission on
Climate Change Policy [Kbh] Danish Commission on
Climate Change Policy 2010
116 International Journal of Sustainable Energy Planning and Management Vol 07 2015
Energy Systems Scenario Modelling and Long Term Forecasting of Hourly Electricity Demand
[48] Kwon PS Oslashstergaard P Assessment and evaluation of
flexible demand in a Danish future energy scenario Appl
Energy 2014134309-20 URLhttp wwwsciencedirectcom
sciencearticlepiiS0306261914008472
[49] Danish Energy Authority Energy Statistics 2010
(Energistatistik 2010) 2011 (In Danish)
[50] EA Energianalyse RISOslash DTU Baggrundsnotat om
referenceforlOslashb A og fremtidsforlOslashb A AmbitiOslashst
fremtidsforlOslashb uden mulighed for nettoimport af biomasse
2010 URLhttpwwwensdksitesensdkfilespolitikdansk-
klima-energipolitikklimakommissionengroenenergibagg
rundsrapporterBaggrundsnotat_om20ambitioes_reference
20_og_fremtidsforloebpdf
[51] Danish Commission on Climate Change Policy
Dokumentationsdelen til Klimakommissionens samlede rapport
GROslashN ENERGI vejen mod et dansk energisystem uden
fossile braendsler 2010 URLhttp wwwensdksitesens
dkfilespolitikdansk-klima-energipolitik klimakommissionen
groen-energiDOK 20MASTER 20FINAL20u
20bilag 20520okt 201020E-optpdf
[52] CEESA CEESA - Coherent Energy and Environmental
System Analysis 20102010
[53] Mathiesen BV Lund H Connolly D Wenzel H Oslashstergaard
PA Moumlller B et al Smart Energy Systems for coherent 100
renewable energy and transport solutions Appl Energy
2015145139-54 URLhttpwwwsciencedirectcomscience
articlepiiS0306261915001117
[54] Fonnesbech B Hagedorn-Rasmussen P The IDA Climate
Plan 2050 2009153[55] Mathiesen BV Lund H Karlsson K 100 Renewable energy
systems climate mitigation and economic growth Appl Energy201188488-501 URLhttpwww sciencedirectcomsciencearticleB6V1T-4YRGJJ7-129d0323c437007c60f462f3d67d76be00
[56] Lund H Mathiesen BV Energy system analysis of 100renewable energy systemsmdashThe case of Denmark in years 2030and 2050 Energy 200934524-31 URLhttpwwwsciencedirectcomsciencearticleB6V2S-4SHN0BG-124b5bc0d4ccded911f21c69a42a08c4ad
[57] Statistics Denmark Transport Equipment nd URLhttpwwwdstdkenStatistikemnertransporttransportmidleraspx
[58] Lund H Kempton W Integration of renewable energy intothe transport and electricity sectors through V2G EnergyPolicy 2008363578-87 URLhttpwwwsciencedirectcomscience articleB6V2W-4T1SKHR-12e6e94a671249a54c97469a0e 51866015
[59] Lund H Excess electricity diagrams and the integration of
renewable energy International Journal of Sustainable
Energy 200323149-56
[60] Oslashstergaard PA Reviewing optimisation criteria for energy
systems analyses of renewable energy integration Energy
2009341236-45 URLhttpdxdoiorg 101016jenergy
2009 05004
[61] Lund H EnergyPLAN - Advanced Energy Systems Analysis
Computer Model - Documentation version 9 2011
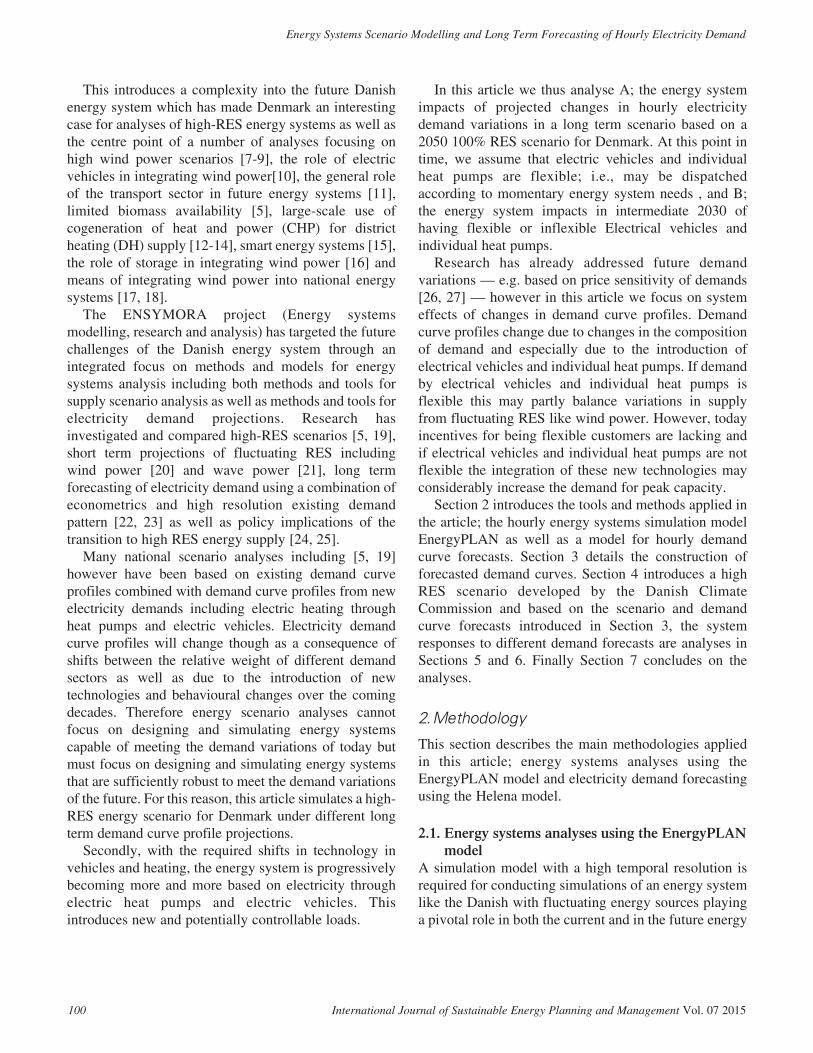
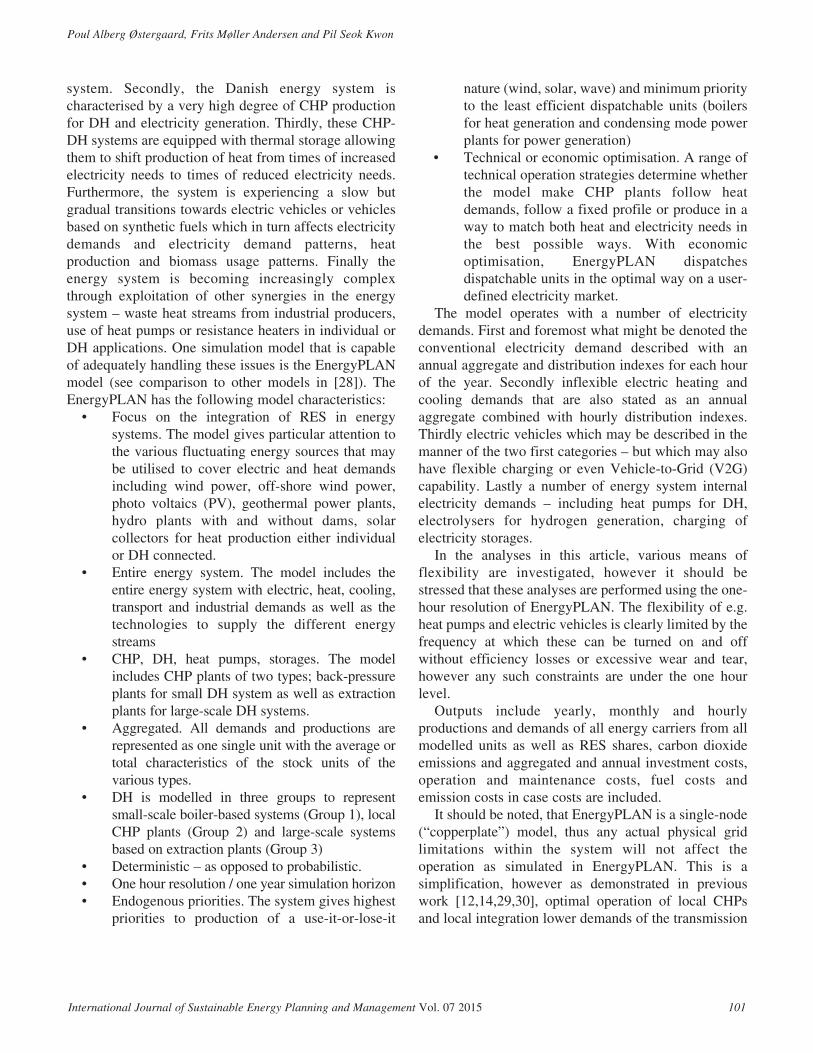
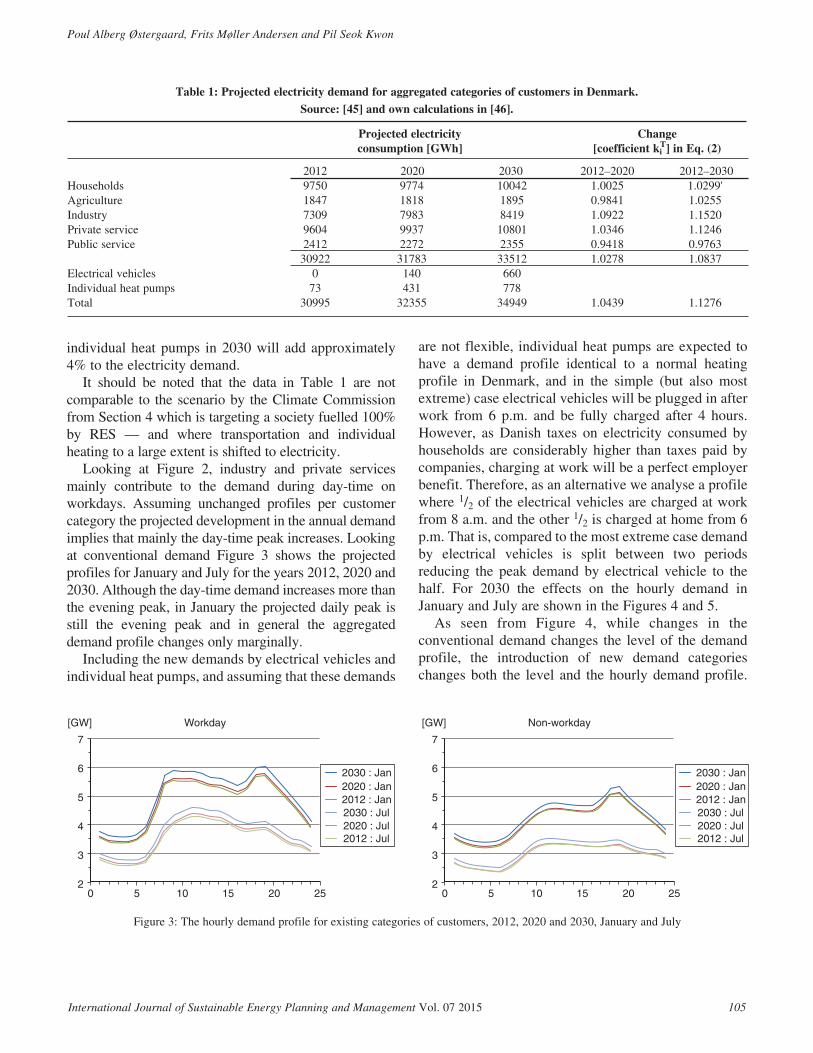
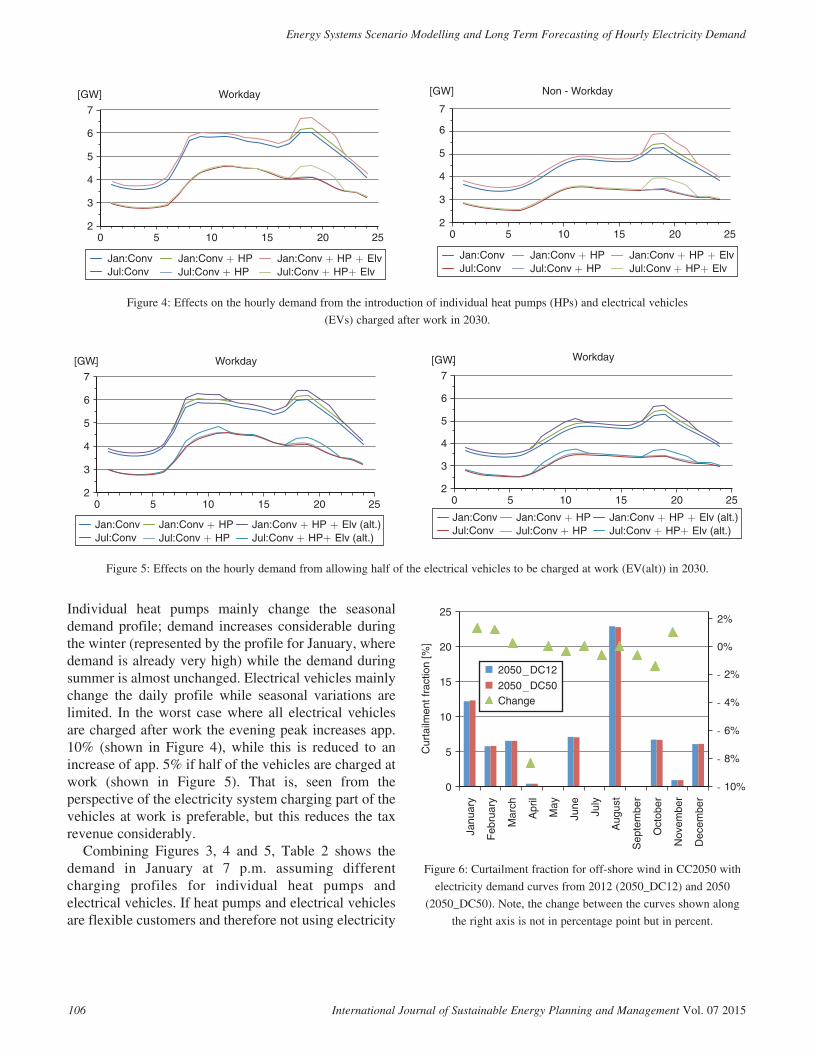
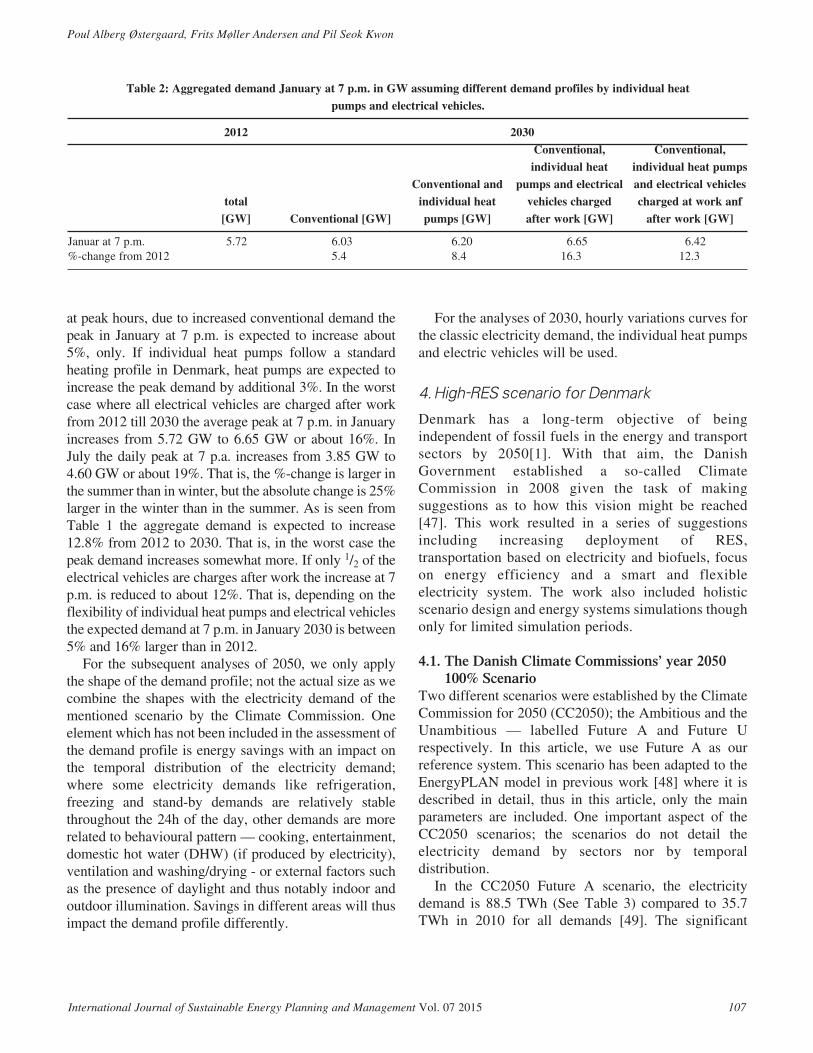
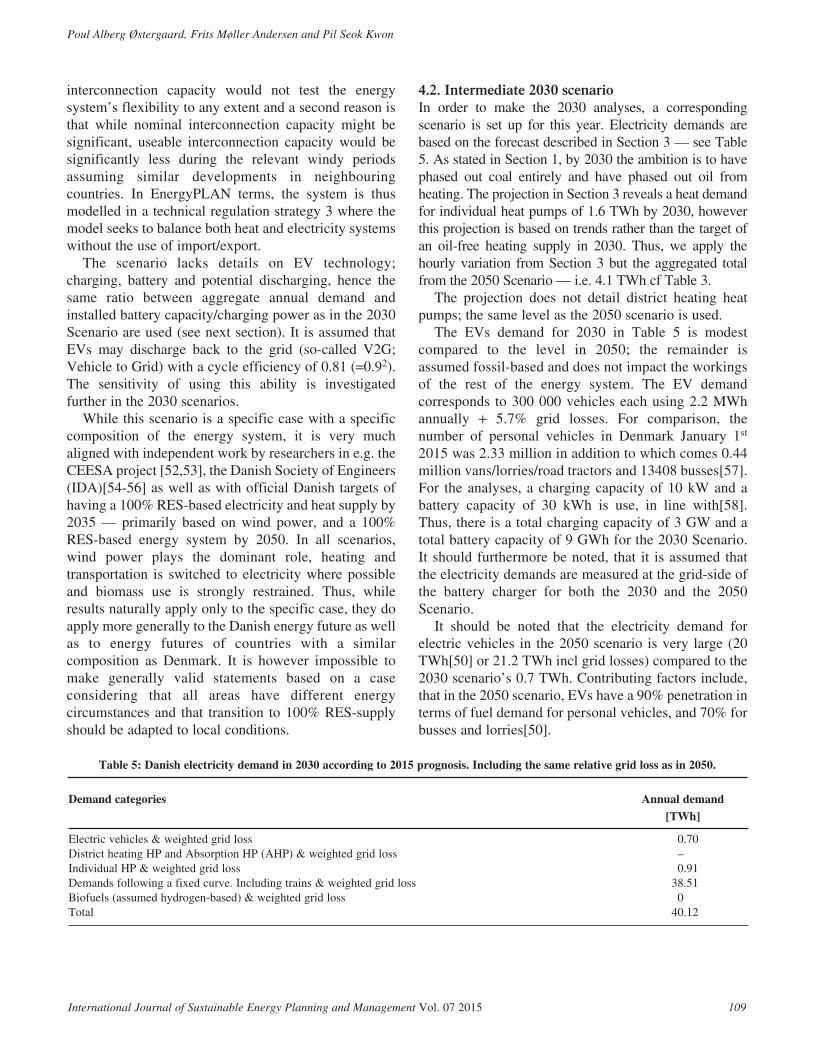
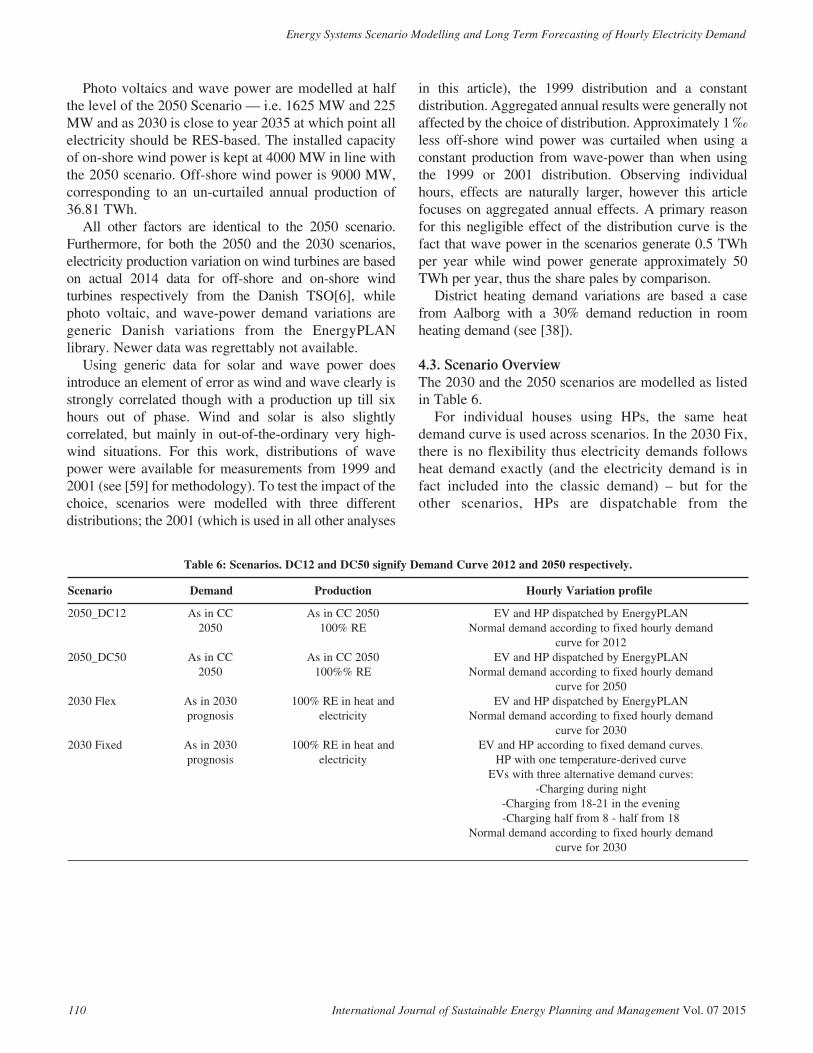
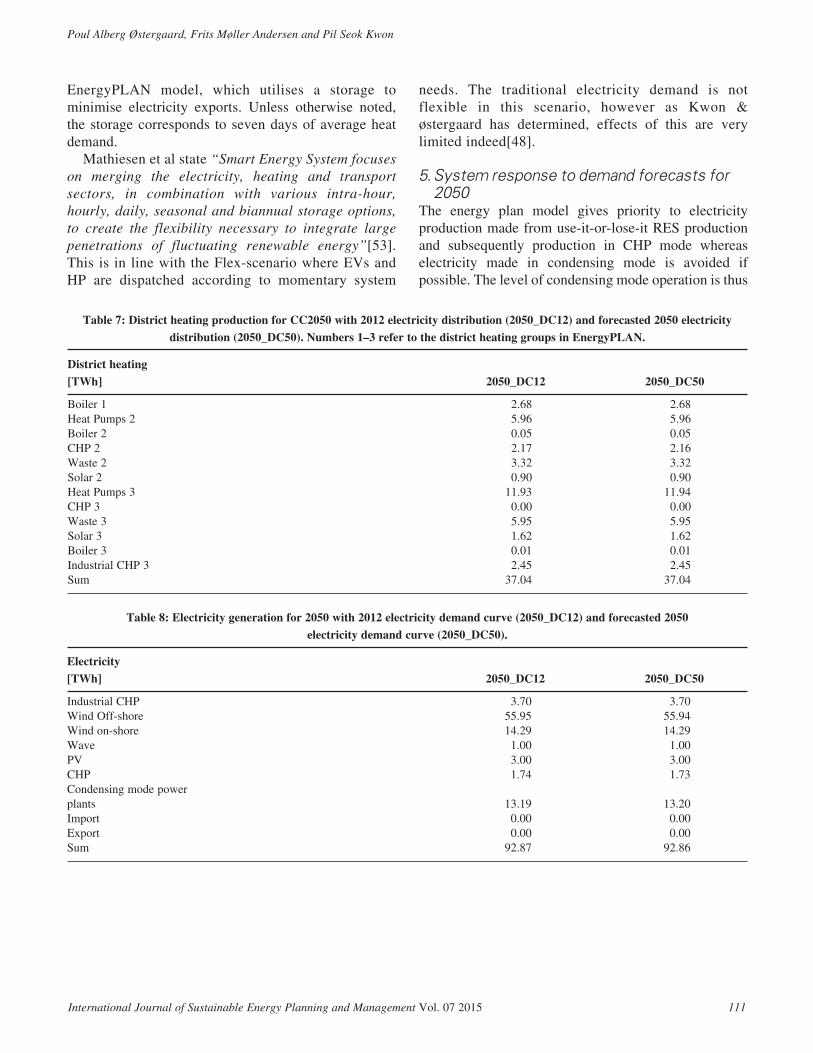
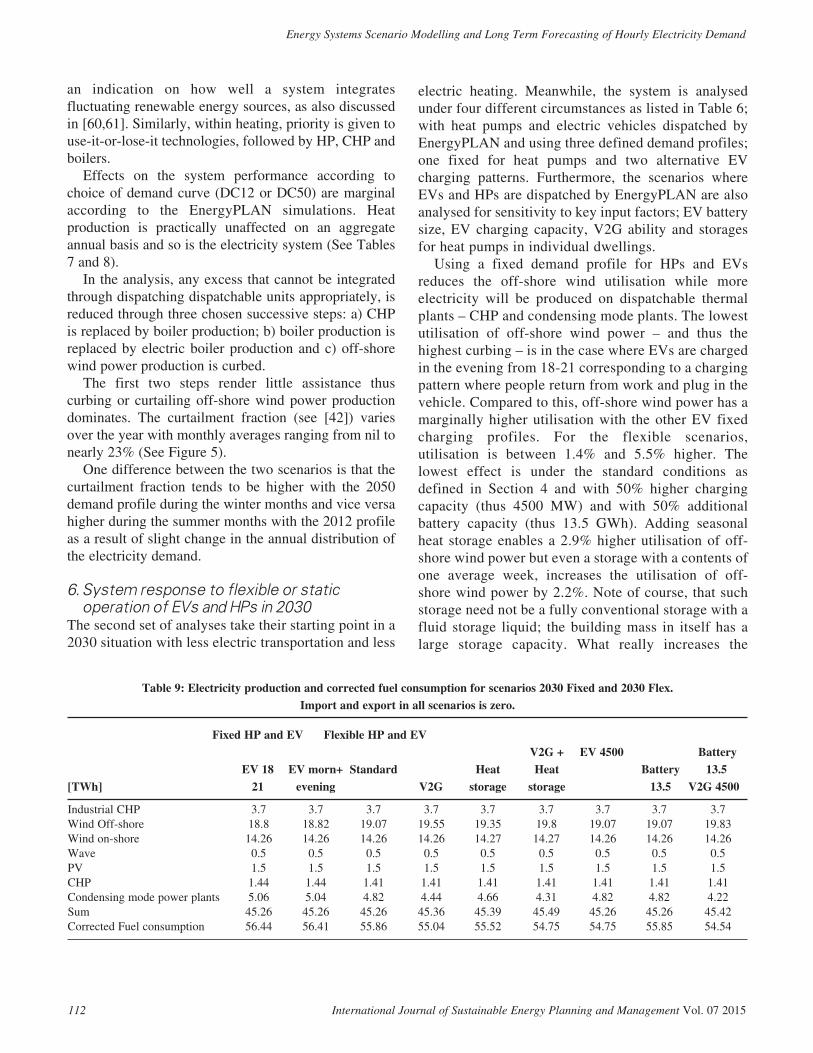