energy storage in maryland storage in maryland - 2018.pdf · to all without regard to race, color,...
TRANSCRIPT

ENERGY STORAGE IN MARYLAND
2018
Policy and regulatory options for promoting energy storage and its benefits
A Publication of the Maryland Power Plant Research Program
PPSE-ES-2018-01DNR Publication No. DNR 12-102218-100
PPRP

Larry Hogan, Governor
Mark Belton, Secretary Maryland Department of Natural Resources
Power Plant Research Program580 Taylor Avenue
Annapolis, MD 21401 dnr.maryland.gov
410-260-8660
Additional Contact InformationToll free in Maryland: 1-877-620-8DNR x8660
Outside Maryland: 1-410-260-8660TTY users call via the Maryland Relay
www.dnr.maryland.gov
The facilities and services of the Maryland Department of Natural Resources are available to all without regard to race, color, religion, sex, sexual orientation, age, national origin or
physical or mental disability. This document is available in alternative format upon request from a qualified individual with disability.

i |
ACKNOWLEDGEMENTSThis report was prepared by Exeter Associates, Inc. under the direction of David Tancabel and Helen Stewart of the Maryland Department of Natural Resources’ Power Plant Research Program. Steven Estomin, Ph.D. of Exeter Associates was the Project Manager. Rebecca Widiss was the principal author. Important contributions to the report were made by the following Exeter Associates employees: Kevin Porter, Matthew Hoyt, Stacy Sherwood, and Cali Clark. Likewise, Steven Miller and Aditya Saxena of Mondre Energy contributed to the report. The authors would also like to thank the members and interested parties of the Power Plant Research Advisory Committee (PPRAC) for insightful comments, questions, and suggestions.
The Maryland Public Service Commission (along with its consultants at the Regulatory Assistance Project) provided feedback to assist in the preparation and accuracy of this report. The Commission takes no position with respect to any of the regulatory or policy options or recommendations presented.

ii | ENERGY STORAGE IN MARYLAND
CONTENTSACKNOWLEDGEMENTS .............................................................................................................. i
REPORT ABSTRACT .................................................................................................................. xi
INTRODUCTION & EXECUTIVE SUMMARY .........................................................................ES-1
The Grid without Storage ............................................................................................ES-1
Diverse Roles for Storage ......................................................................................... ES-2
The Cost and Value of Storage Projects ................................................................... ES-6
The Status of Storage in Maryland ..........................................................................ES-10
Barriers to Storage ....................................................................................................ES-11
Federal and Other States’ Actions to Promote Storage ..........................................ES-12
Maryland’s Options ..................................................................................................ES-13
Conclusion .................................................................................................................ES-18
1. ENERGY STORAGE OVERVIEW ........................................................................................... 1-1
1.1. Storage and Electricity Fundamentals .................................................................. 1-1
1.2. Storage Technologies ............................................................................................ 1-2
1.3. Storage Performance Characteristics .................................................................. 1-7
1.4. Applications of Storage .........................................................................................1-9
1.5. Conclusion ............................................................................................................ 1-11
1.6. Key Takeaways...................................................................................................... 1-12
2. COSTS AND BENEFITS OF ENERGY STORAGE ................................................................. 2-1
2.1. Storage Costs and Trends ...................................................................................... 2-2
2.2. Storage Benefits.....................................................................................................2-4
2.3. Trade-offs Among Benefits ................................................................................. 2-14
2.4. The Need for Storage: Comparing Maryland with Selected Other States ........ 2-17
2.5. Conclusion ............................................................................................................ 2-19
2.6. Key Takeaways ..................................................................................................... 2-19
3. STATUS OF ENERGY STORAGE IN MARYLAND ...............................................................3-1
3.1. Deployments in Maryland ...................................................................................... 3-1
3.2. Advanced Battery Technologies ...........................................................................3-5
3.3. Existing State Incentives and Activities ................................................................3-6
3.4. System Planning ....................................................................................................3-9

iii |
3.5. Barriers to Storage ............................................................................................... 3-10
3.6. PC 44 Activities .................................................................................................... 3-12
3.7. Conclusion ............................................................................................................ 3-17
3.8. Key Takeaways ..................................................................................................... 3-17
4. ENERGY STORAGE POLICIES AND INITIATIVES IN OTHER STATES ...............................4-1
4.1. Rebates ...................................................................................................................4-2
4.2. Grants and Loans ...................................................................................................4-5
4.3. Tax Credits ..............................................................................................................4-8
4.4. State Storage Targets ............................................................................................4-8
4.5. Distribution System Planning .............................................................................. 4-11
4.6. Conclusion ............................................................................................................ 4-14
4.7. Key Takeaways ...................................................................................................... 4-14
5. OPTIONS AND DISCUSSION ...............................................................................................5-1
5.1. Options Overview ....................................................................................................5-2
5.2. Regulatory and Rate Design Updates ...................................................................5-5
5.3. Policy Options ...................................................................................................... 5-11
5.4. Planning ............................................................................................................... 5-18
5.5. PJM-level Reforms ...............................................................................................5-20
5.6. Conclusion ............................................................................................................5-22
Appendix A: PC 44 Memorandum to PPRP on Utility Ownership and Regulation of FOM Storage in Maryland .........................................................................A-1
Appendix B: Storage Cost Estimates From Lazard’s Levelized Cost of Energy Storage 3.0 ............................................................B-1
Appendix C: A.F. Mensah Retail and Wholesale Coordination Memo ..................................C-1
Appendix D: California and New York Distribution Planning Initiatives ...............................D-1
Glossary ................................................................................................................................... E-1
List of Acronyms ..................................................................................................................... F-1

iv | ENERGY STORAGE IN MARYLAND
LIST OF TABLESTable ES-1. Availability of Compensation
for Energy Storage Services Across Markets ............................................... ES-8
Table ES-2. State Policy Approaches for Energy Storage ...............................................ES-13
Table 1-1. Key Performance Characteristics of Selected Energy Storage Technologies .......................................................1-8
Table 1-2. Key Applications for Selected Operational U.S. Energy Storage Technologies .................................................................. 1-11
Table 2-1. Illustrative Energy Storage Use Cases ..............................................................2-5
Table 2-2. Estimates of Non-monetized Energy Storage System Benefits in Addition to Capacity Value .......................................................................... 2-15
Table 2-3. Comparison of Fuel on the Margin in PJM During On-peak and Off-peak Hours (2017) ................................................... 2-17
Table 2-4. Comparison of Relevant Statistics in Recent Energy Storage Studies......... 2-18
Table 3-1. MEA Game Changers Awardees Incorporating Energy Storage ..................... 3-7
Table 4-1. State Policy Approaches for Energy Storage ...................................................4-2
Table 4-2. State Activities with Cost-Benefit Studies, IRPs, and Distribution Planning with Regard to Energy Storage ..............................4-3
Table 4-3. State Rebate Programs Where Energy Storage Is Eligible ..............................4-4
Table 4-4. State Grant and Loan Programs Where Energy Storage Is Eligible ................4-6
Table 4-5. Maryland’s Tax Credits for Energy Storage ......................................................4-9
Table 4-6. Energy Storage Targets by State .................................................................... 4-10
Table 4-7. State Electric Distribution Planning Activities ............................................... 4-13
Table 5-1. California SGIP Energy Storage Incentives ($/watt-hour) ............................ 5-15
Table 5-2. Illustrative Prescriptive Rebates for Thermal Storage .................................. 5-16

v |
LIST OF FIGURESFigure ES-1. Hourly Demand in the BGE Territory
with Peak Demand Highlighted (2017) (MW) ................................................ES-1
Figure ES-2. Size Ranges for Energy Storage, Depending on Grid Location .................... ES-2
Figure ES-3. Energy Storage Applications .......................................................................... ES-3
Figure ES-4. Projected Capital Cost Declines for Lithium-ion Batteries............................ES-7
Figure ES-5. Idealized Stacked Benefits Illustration ...........................................................ES-7
Figure ES-6. Illustrative Value Stacks ($/kW-yr) ................................................................ ES-9
Figure 1-1. Common Energy Storage Methods and Select Storage Technologies .......... 1-2
Figure 1-2. Recent & Forecasted U.S. Grid-enabled Energy Storage Capacity Additions (2012-2023)........................................................................ 1-3
Figure 1-3. Historical U.S. Grid-enabled Energy Storage Additions (New Capacity) by Storage Method, Excluding Pumped Hydro (2006-2017) ...........................1-3
Figure 1-4. Operational Energy Storage Projects in PJM by Technology, Excluding Pumped Hydro (as of November 2017) ...........................................1-4
Figure 1-5. Diagram of a Battery ..........................................................................................1-4
Figure 1-6. Comparison of Select Energy Storage ............................................................. 1-7
Figure 1-7. Size Ranges for Energy Storage, Depending on Grid Location .......................1-9
Figure 1-8. Storage Applications ....................................................................................... 1-10
Figure 2-1. Idealized Stacked Benefits Illustration ............................................................. 2-1
Figure 2-2. Illustrative Installed Costs of a Battery Project ...............................................2-2
Figure 2-3. Illustrative Comparison of Thermal and Battery Storage Capacity and Installed Costs ...........................................................................................2-3
Figure 2-4. Projected Capital Cost Declines for Lithium-ion Batteries..............................2-3
Figure 2-5. Massachusetts Demand Curve after Energy Storage Deployment ................2-6
Figure 2-6. PJM Transmission Zones .................................................................................. 2-7
Figure 2-7. Estimated Revenue from U.S. Deferral Projects ($/kW-yr) ..............................2-9
Figure 2-8. Non-wires Alternatives Capacity by Technology ........................................... 2-10
Figure 2-9. Illustrative Value Stacks ($/kW-yr) ................................................................. 2-11
Figure 2-10. RTO/ISO Wholesale Revenue Streams (2016) ($/kW-yr) ............................... 2-12
Figure 2-11. Using Energy Storage to Mitigate Reverse Power Flows ............................... 2-13

Figure 2-12. Comparison of Monetized and Non-Monetized Benefits of Energy Storage to Massachusetts ............................................................. 2-15
Figure 2-13. Selected Energy Storage-specific Modeling Tools ........................................ 2-16
Figure 3-1. States with the Greatest Energy Storage Deployment ....................................3-1
Figure 3-2. Pepco Radial Distribution Feeder Hosting Capacity Map ............................. 3-17
Figure 4-1. Notable State Initiatives (Excluding Targets) Concerning Energy Storage ..............................................................................4-1
Figure 4-2. Elements of Integrated Distribution Planning ................................................ 4-11
Figure 5-1. Clean Peak Standard Concept ........................................................................ 5-12
LIST OF FIGURES continued

viiENERGY STORAGE IN MARYLAND |
REPORT ABSTRACTIn 2017, the Maryland General Assembly enacted HB 773, calling for the Maryland Department of Natural Resources (DNR) Power Plant Research Program (PPRP) to conduct a study of regulatory reforms and market incentives that may be “necessary or beneficial” to increase the use of energy storage in the state. This report reviews the range of storage technologies available today, their diverse applications, the status of storage in Maryland, the barriers that discourage more widespread use of storage in the state, and several approaches to promoting storage used by other states. (Because most state-led efforts to increase storage development are quite recent, little is known about their long-term impacts.) The report then discusses steps Maryland could take to increase the use of storage. Many steps involve the Maryland Public Service Commission updating rate designs and regulations that pre-date the rise of storage and currently may inhibit utilities, third-party project developers, and customers from deploying storage systems or utilizing them fully. The Commission could also take a more active role in overseeing distribution system planning, which may promote the use of storage as a grid asset and foster the growth of distributed resources, including storage. In addition, the General Assembly could use targets and incentives in an effort to attract commercial activity, accelerate real-world learning from storage deployments, help push storage further down the cost curve, and compensate storage owners for a portion of the benefits that might otherwise flow to the system as a whole.
Due to various constraints, including time and funding, this report lays out potential actions for the state without making value claims regarding which options would be appropriate to pursue. PPRP encountered diverse views on many of these options. Regarding targets and incentives, it is critically important to note that the degree of system benefits (or public benefits) available from storage depends on a host of factors, including timing; prior investments (in storage and other electric power infrastructure); market prices for energy, capacity, and ancillary services; and the composition of the industry in the state (which affects the value of resiliency). These factors dictate that before any major program or major program elements are settled upon, a cost-benefit analysis should be conducted, just as a cost-benefit analysis is presently employed for EmPOWER Maryland programs.


ES-1INTRODUCTION AND EXECUTIVE SUMMARY |
In 2017, the Maryland General Assembly enacted HB 773, calling for the Maryland Department of Natural Resources (DNR) Power Plant Research Program (PPRP) to conduct a study of regulatory reforms and market incentives that may be “necessary or beneficial” to increase the use of energy storage in the state. This report reviews the range of storage technologies available today and their diverse applications, which blur traditional boundaries between generation, transmission, distribution, and load. The report then evaluates policies in Maryland and across the country to provide a wide range of options that could be enacted to increase the use of energy storage in Maryland in the short term.
To create this report, PPRP formed a working group and consulted with a wide range of stakeholders including: the Maryland Public
Service Commission (PSC), the Office of People’s Counsel (OPC), the Maryland Energy Administration (MEA), the U.S. Department of Defense (DoD), environmental organizations, electric companies, third-party providers of storage devices, the University of Maryland Energy Innovation Institute, the Maryland Clean Energy Center (MCEC), developers and owners of electricity generation, and other interested parties. PPRP encountered a healthy diversity of opinions ranging from spirited optimism to concern that storage not be pursued “solely for the sake of storage.”
The Grid without StorageHistorically, a simple operating model governed the grid: generation follows load. Electricity was produced as needed to meet constantly shifting levels of demand, because energy could not be
INTRODUCTION & EXECUTIVE SUMMARY
0.0
Jan
2017
Feb
2017
Mar
201
7
Apr
201
7
May
201
7
Jun
2017
Jul 2
017
Aug
2017
Sep
2017
Oct
201
7
Nov
201
7
Dec
201
7
700.0
1,400.00
2,100.00
2,800.00
3,500.00
4,200.00
Syst
em L
oad
(MW
)
4,900.00
5,600.00 Peak Demand6,300.00
7,000.00
Hourly Demand
Figure ES-1. Hourly Demand in the BGE Territory with Peak Demand Highlighted (2017) (MW) Note: Historically, generation, transmission, and distribution systems have all been sized to meet periods of peak demand, shown here in yellow.Source: Adapted from PJM Zonal Instantaneous Load Data. Adapted from Massachusetts Department of Energy Resources, State of Charge – Massachusetts Energy Storage Initiative, September 2016, link, ii.

ES-2 | ENERGY STORAGE IN MARYLAND
stored in significant amounts. (Pumped hydro was historically the only cost-effective means of storing electrical energy, and geography limited its use.) Finally, steady load growth meant there was little reason to worry that new assets would not be fully utilized over time.
Today, our grid reflects this history. As a nation, we have only enough energy storage to meet 20 minutes’ worth of demand. By contrast, every other critical network in the country (food, oil, gasoline, water, natural gas) can store at least four days’ worth of demand, providing a buffer against supply disruptions.1 Without this flexibility, it is only natural that every portion of the grid (generation, transmission and distribution) has been sized to meet brief periods of peak demand, as shown in Figure ES-1. Much of this capacity sits idle at other times. The limited utilization of certain resources is most visible in energy markets, where peaking plants are designed to recoup their expenses during the few hours in which they run. For example, the 10 percent of the hours during which demand was at its highest in 2017 accounted for between
i Based on PJM electricity prices and usage data. For each hour in 2016, PPRP multiplied the appropriate zone’s Day-Ahead Hourly locational marginal price (LMP) by real-time load to calculate an hourly cost of electricity. PPRP summed hourly costs for both the 1 and 10 percent of hours with the highest costs, and divided this by the sum of all hourly costs for the year. PPRP repeated this process for 2017 and averaged the results.
21 to 28 percent of annual wholesale electricity costs in the state.i (Note that wholesale electricity costs underlie retail rates, but the latter do not typically fluctuate on an hourly basis.)
Diverse Roles for Storage Over the past decade, a variety of newer energy storage technologies (including water- or salt-based thermal storage, compressed air energy storage, batteries and flywheels) have emerged. These are collectively known as “advanced” energy storage technologies, and they hold the potential to increase the grid’s storage capacity and flexibility, especially if technological advances and recent price declines continue. Storage systems now range in size from small, on-site units to utility-scale systems that interconnect to the bulk power grid, as shown in Figure ES-2. Depending on the technology used and project size, advanced energy storage systems can discharge at their full capacity for 15 minutes to days. Some storage projects can be developed in months rather than years, and can be sized precisely to meet demand. Small, behind-the-meter (BTM) systems in homes
Customer-Sited Storage:2 kW to 2 MW or more
Distribution Storage:10 kW to 10 MWBulk Storage:
10s to 100s of MW
Figure ES-2. Size Ranges for Energy Storage, Depending on Grid LocationSource: Adapted from Ben Kaun, “Energy Storage Update,” EPRI, Presentation to Maryland PSC Storage Work Group, July 15, 2017, 35.

ES-3INTRODUCTION AND EXECUTIVE SUMMARY |
and businesses can potentially be aggregated and controlled to create “virtual power plants,” though to date there are relatively few real-world examples. Storage devices are often tailored to serve specific grid or utility needs, such as providing ancillary services. Figure ES-2 illustrates where storage systems of different sizes can be located on the grid. Figure ES-3 lists specific applications for storage.
Storage applications can be grouped according to their general purpose:
• Reducing Costs and Peak Shaving – Instead of relying on natural gas or coal peaking plants during times of high electricity demand, energy storage can release energy that was stored during off-peak periods when electricity prices are lower. Grid operators can dispatch storage instead of generation during times of high demand. Alternatively, customers or electric distribution utilities can independently discharge storage to lower
ii Throughout this report, electric distribution utilities are referred to simply as “utilities.”
peak demand.ii Power producers can also use storage to price arbitrage.
• Reliability/Resiliency – Storage can enhance reliability for customers by providing backup power during an outage or interruption. In some cases, storage is built into a “microgrid” configuration, meaning a self-sufficient electricity grid, containing a generation resource, that can operate on a small scale even if temporarily disconnected from the bulk electric system. Pairing storage with PV can also to keep critical loads running in homes and businesses. At the grid level, storage can enhance resiliency (i.e., the capacity to recover quickly from natural disasters and/or preserve or restore critical infrastructure). For example, utilities have demonstrated that storage can provide ‘black-start’ service, firing up a traditional generator that has gone idle during a blackout.
BULK ELECTRIC SYSTEM APPLICATIONS
BULK ENERGY SERVICESElectric Time ShiftElectric Supply Capacity Renewables IntegrationFirmingCurtailment Avoidance
ANCILLARY SERVICESFrequency Response & RegulationRamping/Load FollowingVoltage/VAR SupportBlack StartSpinning and Non-Spinning ReservesPower Quality
BEHIND-THE-METER APPLICATIONS
PEAK DEMAND REDUCTION
ENERGY MANAGEMENT SERVICESTime-Varying Rate ManagementDemand Charge Management
RELIABILITY SERVICESBack-up Power
INFRASTRUCTURE APPLICATIONS
TRANSMISSION SERVICESNetwork CapacityCongestion Relief
DISTRIBUTION SERVICESNetwork CapacityVoltage/VAR Support
T&D UPGRADE DEFERRAL
INCREASED HOSTING CAPACITY
AREA REGULATION
Figure ES-3. Energy Storage ApplicationsNote: See the glossary for definitions of these applications.Source: Adapted from IREC, “Charging Ahead: An Energy Storage Guide for Policymakers,” April 2017, link, 5.

ES-4 | ENERGY STORAGE IN MARYLAND
• Infrastructure Deferral – Storage can be used to avoid or delay generation, transmission, and distribution upgrades that would otherwise be necessitated by system constraints or reliability requirements. For example, storage could be used to supply peak demand in place of adding generation capacity or expanding transmission from existing supply. This capability is especially useful to strategically address the infrastructure needs of growing demand in localized load pockets.
• Ancillary Services – Storage can provide services to ensure reliable transmission of electricity and reliable operation of the bulk electric system. These services include frequency and voltage regulation, load following and ramping, black start, and spinning and non-spinning reserve capacity. These applications each serve specific requirements of electricity provision, such as managing the volatility of electric current and the constant balancing of supply and demand over multiple timeframes, from seconds to minutes to hours.
• Integrating Renewable Energy Resources – Storage can be used to smooth out intermittency or absorb excess production from wind and solar resources. Energy storage can help transform a renewable facility into a “firm,” meaning more predictable, source of generation by supplying stored power whenever the renewable energy resource experiences an interruption; for instance, when the wind stops blowing or clouds block the sun. It can also minimize the curtailment of renewable energy generation, especially during negative price periods, which can occur when supply exceeds demand.
The sample projects below illustrate how storage is being used for each of these applications.
GMP: BTM Batteries for Peak Shaving and Backup Power
In 2017, Green Mountain Power (GMP) and Tesla launched a program to install, and then aggregate, up to 2,000 batteries in customer homes in Vermont. For $15 per month or a $1,500 one-time fee, customers receive backup power for ten years. Meanwhile, GMP will dispatch the batteries to reduce system-wide peak load by up to 10 MW, which will lower costs for all its customers by reducing the utility’s transmission and capacity charges. GMP also anticipates using the storage network to provide capacity, grid stability, and wholesale market services.2
Tesla PowerwallSource: Green Mountain Power, link.
Sterling’s BatterySource: Sterling Municipal Light Department, link.

ES-5INTRODUCTION AND EXECUTIVE SUMMARY |
Sterling Coop: Solar+Storage for Resiliency and Bill Management
In 2016, the Municipal Light Department of Sterling, Massachusetts took advantage of a $1.5 million state resiliency grant to purchase a 2 MW/3.9 MWh lithium-ion battery that is paired with a pre-existing 3.4-MW PV system. The solar+storage system will provide 12 days of backup power for Sterling’s police headquarters and reduce charges based the town’s monthly and annual peak demand. Sterling anticipates a roughly 7-year payback period, not counting grants.3
APS: Utility-scale Batteries for Infrastructure Upgrade Deferral
In 2017, Arizona Public Service announced plans to purchase two (2) 1-MW/4-MWh batteries for less than half the up-front cost of a traditional distribution system upgrade for Punkin, a small town near Phoenix. The batteries will provide power on the ~25 days when local and system peaks would otherwise strain the grid. During the rest of the year, the storage system will provide ancillary services and store negatively priced energy for later use. A traditional solution would have entailed upgrading 20 miles of 21-kV cables through hilly terrain. This alternative, incremental step manages APS’s current needs without risking an overbuild.4
HECO: An Energy Storage Network for Renewables Integration
As of 2016, solar penetration had reached 8.8 percent in Hawaii (compared to 2.3 percent in Maryland). Furthermore, 89 percent of Hawaii’s PV generation is BTM.5 In response, Hawaiian Electric Companies (HECO) has more than 17 energy storage projects underway or planned to integrate renewable energy while maintaining reliable service. Five of these projects are third-party owned; the rest are utility-owned. HECO selects different types of energy storage based on the particular service needed, including frequency regulation, voltage regulation, and energy time shift.6
Mosaic Power: BTM Water Heaters for Ancillary Services and Bill Management
Mosaic Power, based in Frederick, Maryland, has created a network of 13,000 water heaters (representing roughly 13 MWh of thermal storage) on multi-family affordable housing properties that are located throughout PJM. Using small load controllers and disconnect boxes on the electric lines that serve each water heater, Mosaic synchronizes electricity demand from its network in real-time. This allows Mosaic to both provide frequency regulation and shift
Example of Remote TerrainSource: Charles Vaughn, “APS to Use Energy Storage in Place of Traditional Infrastructure on the Distribution Grid, Fluence Energy Blog, August 10, 2017, link.
HECO Current and Planned Storage ProjectsSource: “Energy Storage,” HawaiianElectric.com, link (accessed June 2017, webpage now defunct).

ES-6 | ENERGY STORAGE IN MARYLAND
bulk demand from expensive on-peak hours to inexpensive off-peak hours without interrupting customers’ hot water consumption. Mosaic provides quarterly payments to water heater owners. For affordable housing properties, these payments amounted to roughly $100/year per water heater in 2016.7
Energy storage has been called the “Swiss Army knife of the energy world.”8 It can offer services traditionally provided by a generator, a transmission asset, or a distribution asset. Whether and when it makes financial sense to invest in storage is influenced not only by storage system costs, but also by customer priorities, grid system needs, and market structures, among other factors.
The Cost and Value of Storage ProjectsTotal storage system costs over a lifetime of use include installed costs, system charging, operations and maintenance, extended warranties, financing, taxes, decommissioning, and disposal. Emphasis tends to be placed on the installed costs of storage; i.e., the costs on Day 1, since they are simplest to track and account for a major
portion of the cost of a storage system, thus greatly influencing a project’s ability to be built.
Storage system costs vary widely depending on the technology used, system size, and application. Though rarely in the spotlight, thermal technologies, including ice storage, chilled water storage, and water heaters, are more efficient (when used for thermal applications) than electrical storage, and are often less costly. Representatives and publications from the thermal storage community point out that their products are frequently pigeon-holed (based on their long tradition of providing pre-programmed, load-shifting/peak load management services) and overlooked for newer applications, such as providing ancillary services or integrating renewable generation.
Much of the interest in energy storage today is due to rapid declines in the capital cost of quick-responding electrochemical storage technologies that can be scaled to projects of different sizes and deployed more quickly than standard plants. Steep price declines for lithium-ion batteries have been driven, in large part, by a surge in worldwide demand for battery-powered electric vehicles and associated economies of scale. Price declines are expected to continue, though more slowly, as illustrated in Figure ES-4.
Storage has the technical capability to realize value across multiple applications. This concept is known as “value stacking,” and is illustrated in Figure ES-5. For example, a 10-MW battery located at a distribution system substation could be used ten days per year for transmission deferral, ten days per year to displace “peak” generation, and the remaining 345 days per year for ancillary services. (It is important to be sure
Mosaic’s Maryland FootprintSource: Mosaic Power, link.

ES-7INTRODUCTION AND EXECUTIVE SUMMARY |
$0
$200
2016 2017 2018 2019 2020
Inst
alle
d C
ost (
$/kW
)
$400
$600
$800
$1,000
$1,200
$1,400
$1,600
$1,800
$2,000
LCOS Non-MonetizedValue Stream
“Missing Money”
Profitability Total SocialValue
Revenue Stream 1
Revenue Stream 2
Revenue Stream 3
Tota
l Rev
enue
Total Value
Figure ES-4. Projected Capital Cost Declines for Lithium-ion BatteriesSource: Adapted from Energy Storage Association, Including Advanced Energy Storage in Integrated Resource Planning: Cost Inputs and Modeling Approaches, v1.1, November 2016, link, 5.
Figure ES-5. Idealized Stacked Benefits IllustrationNote: Levelized Cost of Storage (LCOS) is the net present value of the cost of stored energy output over the life of an energy storage facility.Source: Adapted from Lazard’s Levelized Cost of Storage Analysis—Version 3.0, link.

ES-8 | ENERGY STORAGE IN MARYLAND
that all revenue streams would be available to a project before stacking the benefits. In some cases, if a storage unit is going to provide one service, it will not be available to provide another.)
As Figure ES-5 suggests, many potential applications for storage have market value today (at least in some portions of the country), either as a source of revenue or as a means of avoiding costs that would otherwise be borne by end-users. Table ES-1 summarizes whether storage is able to provide selected services in Maryland and/or PJM.
Figure ES-6 shows the likely viability of five battery storage projects in other states that have prioritized grid modernization. Four of the five projects rely on resource adequacy/capacity payments, meaning that they are compensated for committing to serve loads during the few times each year when the grid is most taxed, usually due to severe weather. (Current market rules make it difficult for energy storage to participate in PJM’s capacity market due to requirements that a resource be available for any emergency, regardless of its duration.) Two of the
iii In Maryland, the cost of reducing greenhouse gas emissions enough to comply with the Regional Greenhouse Gas Initiative (RGGI) is incorporated into electricity prices.
five projects receive incentive payments. Note that the two “not viable” use cases, residential storage and a microgrid, provide reliability benefits to end-use customers that were assigned no dollar value in this exercise.
Using storage can also provide system-wide benefits that often have no market value but could potentially save ratepayers money. The Interstate Renewable Energy Council (IREC), a non-profit organization that promotes clean, efficient, and sustainable energy, has compiled the following list of these benefits:
• Increased efficiency of traditional generators (e.g., avoided fuel costs, avoided start-up/shutdown costs, increased heat rates);
• Reduced reserve requirements (e.g., avoided peak capacity and operating reserves);
• Enhanced risk management (e.g., black start/outage mitigation, fuel-hedging value);
• Reduced emissions (e.g., local air quality permitting);iii
SERVICE POTENTIAL SOURCE(S) OF DIRECT COMPENSATION
STATUS IN MARYLAND/PJM
Supply Time-shift / Arbitrage PJM / Utilities Yes – primarily via PJM today
Capacity PJM No – due to PJM market rules
Ancillary Services (e.g., frequency regulation, load-following / spinning reserve)
PJM Yes
Network Services (e.g., upgrade deferral, increased power quality, congestion relief)
PJM / Utilities Under consideration
Table ES-1. Availability of Compensation for Energy Storage Services Across MarketsSource: Adapted from IREC, “Charging Ahead: An Energy Storage Guide for Policymakers,” April 2017, link, 9.

ES-9INTRODUCTION AND EXECUTIVE SUMMARY |
• Reduced risks of unnecessary grid infrastructure investments; and
• Increased resiliency.9
Every resource used by PJM or a utility contributes to the overall efficiency of the system. Ideally, non-monetized benefits represent a small portion of a resource’s value stack. Yet, this may not be the case. For example, a recent cost-benefit study conducted on behalf of the Massachusetts Department of Energy Resources (DOER) and the Massachusetts Clean Energy Center (MassCEC) concluded that non-monetized system benefits for energy storage outweighed monetized benefits by roughly a 2:1 ratio. Due to this inversion of an idealized value stack, the authors wrote:
The biggest challenge to achieving more storage deployment in Massachusetts is the lack of clear market mechanisms to transfer some portion of the system benefits (e.g. cost savings to ratepayers) created to the storage developer.10
It is critically important to note that the degree of system benefits (or public benefits) available from storage depends on a host of factors, including timing; prior investments (in storage and other electric power infrastructure); market prices for energy, capacity, and ancillary services; and the composition of the industry in the state (which affects the value of resiliency). Also, there may be significant tradeoffs between storage benefits:
$50
Peaker Replacementin CAISO
BQDM Program
Potentially Viable
$100
$150
$200
$250
$300
$350
$400
$450
$500
Distribution Deferralin NYISO
Viable
Microgrid in ISO-NE
Not Viable
Commercialin CAISO
Viable
Residentialin CAISO
Not Viable
Bill Management IncentiveResource Adequacy/Capacity Frequency Regulation
DR-UtilityEnergy Arbitrage
Figure ES-6. Illustrative Value Stacks ($/kW-yr)Note: Projects are considered viable if they generate leveraged returns over 10 percent. The Brooklyn-Queens Demand Management (BQDM) Program represents T&D deferral payments. DR = demand response.Source: Adapted from Lazard’s Levelized Cost of Storage Analysis—Version 3.0, link, 26.

ES-10 | ENERGY STORAGE IN MARYLAND
• Emissions vs. Cost Savings – Charging storage systems during the least expensive times of the day may actually increase greenhouse gas (GHG) emissions, depending on the fuel mix of the underlying grid. For example, a 2016 review of California’s Self-Generation Incentive Program (SGIP) for BTM storage concluded that SGIP systems, on average, are helping to reduce system peak demand and associated costs, but are increasing GHG emissions.11
• Customer vs. Grid Benefits – Utility representatives point out that storage systems can add (rather than alleviate) stress to the distribution system if they are charged and discharged by customers solely for their personal benefit. Many of these issues could potentially be avoided with rate designs that align customer and grid benefits.
The Status of Storage in MarylandAdvanced energy storage is just beginning to be deployed in Maryland. The largest advanced energy storage unit in Maryland is a 10-MW lithium ion battery. It belongs to Fluence Energy and provides ancillary services to PJM Interconnection (PJM), which administers the region’s bulk electricity system. Over a dozen other projects in the state reflect the diversity of storage technologies and applications. They involve both stand-alone thermal and battery storage projects, as well as systems that aggregate each of these resources. They are sited in affordable housing units, community centers, private homes and businesses, government buildings, academic institutions, and at least one U.S. Department of Defense (DoD) facility.
With its large concentration of biomedical, defense, and aerospace industries, Maryland also has a niche market for high-performance batteries intended for unconventional applications. Such applications may require a very long life and high reliability, with cost less of a concern. The University of Maryland has an energy research and development center that attracts major federal funding for advanced batteries. Also, Saft America, a subsidiary of the gas and oil company Total, owns a high-tech battery manufacturing and research facility in Cockeysville, Maryland. The facility manufactures rechargeable lithium-ion batteries for satellites, weather balloons, rocket ships, military vehicles, fighter jets, and Formula One race cars, among others. It is possible that synergies might be found between the expertise and equipment needed to produce specialized, high-performance batteries and the expertise and equipment needed to produce batteries for grid applications.
Several current or recent policy and regulatory initiatives in the state have promoted, or have relevance to, storage. Maryland is the first, and so far the only, state to enact an income tax credit for storage systems. This credit went into effect in January 2018. The state has also funded demonstration projects involving storage paired with renewable energy systems, conducted an in-depth investigation of microgrids, and worked with utilities to install advanced metering infrastructure in homes to enable two-way communication about energy prices and usage. Additionally, the Maryland PSC is in the midst of an 18-month investigation, Public Conference 44 (PC 44), to consider five grid modernization topics: rate design, electric vehicles, competitive markets and customer choice, interconnection process, and energy storage. System

ES-11INTRODUCTION AND EXECUTIVE SUMMARY |
planning may also be considered if time and budget permit.iv
Representatives from the state’s five largest utilities indicate that they have identified a few cases where storage may be a cost-effective choice as a grid asset. They have also cautioned that there may not be widespread need for storage projects to address distribution system issues in the near term. Yet, much work can be done now, so that Maryland is best prepared to optimally identify, invest in, and operate energy storage solutions on a broader scale if the costs of storage continue to decline.
Barriers to StorageTo better understand barriers to storage in Maryland, PPRP conducted one-on-one conversations with numerous industry stakeholders between June 2017 and February 2018, as well as meetings with the PPRAC Energy Storage Work Group. Through these conversations and meetings, a dozen major barriers to the growth of energy storage were identified:
Costs, Compensation, and System Ownership1. System Costs – The cost of advanced
storage technologies may be declining rapidly, but it is still high relative to the cost of many of the mature technologies with which they compete, often on an application by application basis.
2. Financing – Many smaller storage developers report having difficulty securing project loans from banks due to uncertainty surrounding long-term revenue sources and long-term performance of new technologies.
iv Note: References to PC 44 in this report are being updated as decisions are made by the PSC.
3. Ownership – Nothing in existing law explicitly prohibits utilities in Maryland from owning and operating storage assets. However, Maryland statute does prohibit “the generation, supply, and sale of electricity, including all related facilities and assets” from being regulated as an electric company service or function. Depending on how storage is classified, it is unclear whether it should be regulated (i.e., subject to ratepayer recovery) and whether utilities should be able to participate in available PJM markets with storage projects.
4. Rate Designs – Maryland’s basic retail electricity rates fold demand-related expenses into per-kWh charges and mask the real-time cost of energy. This gives customers little incentive to minimize their usage at times of peak demand, eliminating one of the key potential benefits of customer-sited storage. Similarly, net metering is compensated at the retail electricity rate, whether the generation is stored or not.
5. PJM Services – Storage faces major obstacles to providing capacity services or transmission deferral services to PJM due to its market rules and planning processes. In addition, BTM storage may only participate in PJM’s markets as a demand response resource.
6. Market Value – Receiving compensation from multiple value streams is key to storage economics. Many of the benefits of storage result in system-wide cost savings, but have no recognized market value. From a developer’s perspective, storage projects may not be economically justified unless

ES-12 | ENERGY STORAGE IN MARYLAND
more of these benefits are monetized by policymakers, regulators, and/or PJM.
Access to the Grid7. Interconnection – The interconnection
process for BTM storage is evolving. Currently, questions remain about the level of utility review that is needed for storage systems that will not export power, or whether gross or net capacity should be used when an interconnection study is being conducted. The cost and time required to interconnect storage systems can significantly impact whether storage projects are able to secure financing.
8. Multi-use Protocols – Regulatory and operational hurdles exist towards providing multiple services using a single system, including services at both the wholesale and retail level. There is no clear definition of the dispatch priority and protocols for storage simultaneously providing multiple services (e.g., wholesale market services vs. transmission and distribution services vs. customer benefits).
9. Permitting – Building and fire codes do not currently address storage and permitting staff are not always familiar with storage projects.
Planning10. System Planning – Presently, Maryland
utilities conduct distribution planning as a standard course of business; their distribution system investments, including investments in storage, are subject to review during a PSC rate case proceeding. This means there is no process in place for the PSC and the public to understand how
the state’s utilities are evaluating storage projects in the pre-investment stage.
11. Evaluation – Because advanced energy storage technologies and applications are relatively new, unexpected costs and benefits may result from projects. This makes it difficult to compare storage to other more traditional resources.
Knowledge12. Awareness – Many industry and non-profit
representatives believe the conversation about storage is dominated by batteries at the expense of other technologies, such as compressed air or thermal storage, and other options, such as energy efficiency.
Federal and Other States’ Actions to Promote StorageMany different actors are working to make it possible for storage to provide benefits to wholesale markets, the transmission system, the distribution system, and customers. In February 2018, the Federal Energy Regulatory Commission (FERC) took steps to give storage greater access to wholesale markets. FERC Order No. 841 compels PJM and other regional transmission organizations (RTOs) and independent system operators (ISOs) to revise their market rules to facilitate the participation of energy storage resources in their energy, ancillary service, and capacity markets. The Order requires RTOs/ISOs to revise bidding structures to account for storage’s technical capabilities and to permit storage to establish clearing prices, among other changes. PJM has indicated that it will file a compliance plan by spring 2019.
In at least 20 states (nine of which are restructured), regulatory and legislative bodies

ES-13INTRODUCTION AND EXECUTIVE SUMMARY |
are considering strategies to spur growth in energy storage.v Ten of these states are offering financial incentives or policy support in the form of grants, loans, rebates, tax credits, and storage targets. Of these, seven states have or are offering grants amounting to nearly $2 billion for eligible technologies, including storage, with California alone accounting for nearly $1.3 billion. Four states have offered rebates totaling over $600 million, with California again providing the bulk of the funds. Three states have or will provide loans to eligible technologies, including storage, representing over $250 million. Six states (Arizona, California, Massachusetts, New Jersey, New York, and Oregon) have enacted storage targets. Note that these are targets, not procurement mandates, to which these policies are sometimes referred.vi Table ES-2 provides an overview of policy approaches for storage that different states are pursuing or have pursued. Note that the table does not include policies that are under consideration, such as potential storage targets in Nevada.
In addition to, or in advance of, providing support for storage through targets/incentives, many states are seeking to quantify the potential benefits of storage and identify specific use cases worth facilitating. states
v Restructured states have retail electric competition. In this report, Washington, D.C. is treated as a state. California is not considered restructured, though there is limited customer choice in the state. Also, the tallies of states pursuing a given action include Maryland.
vi Mandates typically require compliance and specify penalties for non-compliance; targets generally do not, though there is still an expectation that utilities will make a good-faith effort to meet their portion of a target.
are addressing these questions by conducting storage cost-benefit studies or asking their utilities to incorporate storage into integrated resource plans (in regulated states) and/or distribution system planning. At least 16 states (including ten restructured states) are re-examining or adding to distribution planning practices that will impact energy storage and other distributed energy resources.
Maryland’s Options A combination of factors influences the suitability of approaches used elsewhere, such as a state’s generation resource mix and regulatory structure. While solar has nearly tripled in Maryland since 2015, and Maryland is in the top quartile of states for solar deployment, wind and solar currently make up a very small portion of the generation mix in Maryland. This is in part due to the fact that most of the wind used to fulfill Maryland’s renewable energy portfolio standard comes from other states. This minimizes the need for flexible resources such as storage to integrate variable wind and solar generation. Also, Maryland is not facing certain pressures that other states are grappling with, such as potential resource shortages and high demand charges. Finally, unlike states where utilities remain vertically
MD* AZ CA CT* MA* NJ* NV NY* OR* WA*
Grants and Loans ✔ ✔ ✔ ✔ ✔ ✔ ✔ ✔
Rebates ✔ ✔ ✔ ✔
Tax Credits ✔
Storage Targets ✔ ✔ ✔ ✔ ✔ ✔
Table ES-2. State Policy Approaches for Energy Storage[a]
[a] Includes state initiatives or programs that are no longer in effect; see Chapter 4 for details. Starred states have restructured electricity markets.

ES-14 | ENERGY STORAGE IN MARYLAND
integrated, the primary responsibility for generation and transmission planning/review lies with PJM. Maryland is most able to facilitate energy storage at the distribution and customer level.
This section presents numerous options available to Maryland, on both regulatory and legislative fronts, to increase the use of storage in the state. It also highlights key changes that PJM could make to increase the use of storage in the region. Together, these options represent the actions most frequently raised during discussions with industry, agency, and non-governmental organization (NGO) representatives and in the literature PPRP reviewed. The options specific to Maryland fall into three basic categories:
1. Removing barriers to storage by updating rate designs and regulations;
2. Supporting storage through targets, incentives, and/or financing; and
3. Taking a more active role in overseeing distribution system planning.
There is widespread agreement that it is important to update or adapt rate designs and regulations, such as interconnection protocols, that pre-date the rise of storage and may hinder utilities, third-party project developers, and customers from deploying storage systems or utilizing them fully to reduce customer and grid costs. Unless otherwise noted, these actions can be considered near-term priorities. Once regulatory reform has progressed, it will greatly enhance the ability of incentive and targets to increase the use of energy storage in the state. The Public Conference 44 (PC 44) Storage,
Interconnection, and Rate Design Work Groups are each addressing key barriers to energy storage by recommending pilot projects and revisions to the Code of Maryland Regulations (COMAR). These efforts are reflected in the discussion below.
Other options, such as targets or financial incentives, are available to more actively promote storage should policymakers in Maryland wish to take these steps. There is considerably more division among stakeholders in Maryland as to whether such measures are necessary. There are several arguments for focusing on regulatory reforms first:
• It would be inefficient and may be unnecessarily costly to spur storage deployment before regulations and rates have been updated.
• Once barriers have been addressed, market forces should drive storage deployment when and where it is cost-effective. If not, Maryland can take action at a later date.
• Maryland can learn from other states that are promoting storage.
Likewise, there are several arguments for pursuing reforms and promoting storage simultaneously:
• There is no substitute for “learning-by-doing.” Targets and incentives help states learn how best to use storage.
• In the long run, Maryland will benefit from helping, albeit modestly, to increase the market for storage and push storage down the cost-curve.

ES-15INTRODUCTION AND EXECUTIVE SUMMARY |
• Targets and incentives can catalyze projects that are cost-effective, if system-wide savings are taken into account, just as EmPOWER Maryland projects avoid more costs than they incur.
As stressed earlier, the degree of system benefits (or public benefits) available from storage depends on a host of factors that differ greatly among the states that are considering and using storage. These factors dictate that before any major policy program or program elements are settled upon, a cost-benefit analysis should be conducted, just as cost-benefit analysis is presently employed for EmPOWER Maryland programs.
Differences of opinion also exist among stakeholders with regard to devoting resources to increasing Maryland. Some view such oversight as unnecessarily burdensome, both for customer and public utility commissions. Others view such oversight as an important way for states to encourage due consideration of storage as potential grid assets and to foster the growth of distributed energy resources, including storage.
These considerations should be kept in mind when reviewing the options summarized below and discussed more in-depth in Chapter 5.
Regulatory and Rate Design Updates1. Utility ownership and cost recovery –
Determining whether utilities may own BTM storage and/or front-of-the-meter (FOM) storage that participates in wholesale markets will eliminate a major source of uncertainty for utilities and third-party project developers. The PC 44 Energy Storage Work Group (Storage WG) leader
laid groundwork for this step by producing an informal memorandum on the legal aspects of utility ownership of FOM storage and exploring possible hybrid ownership options (see Chapter 3 and Appendix A). If Maryland ultimately permits utilities to own and use storage for purposes other than as a distribution system asset, then steps may need to be taken to promote a competitive market where utilities, third parties and customers have ample opportunities to procure storage resources/provide storage-based services. Either the General Assembly or the PSC will need to resolve these questions.
2. Interconnection processes – Standardizing and streamlining the interconnection process for distributed energy resources (DERs), including storage, will make BTM storage more attractive to customers and to companies that develop residential and commercial storage projects. At a rulemaking session (RM61) in April 2018, the PSC adopted several changes that had been proposed by the PC 44 Interconnection Work Group (Interconnection WG). The Interconnection WG is considering several additional concepts that are specific to storage in Phase II of its efforts, which is not forecast to end until 2019. These changes include allowing net capacity (as opposed to aggregated gross capacity) to be used when an interconnection study is being conducted, which could lower the cost of interconnections. Also, allowing small levels of inadvertent export from storage devices would allow energy storage devices to be more fully utilized. However, these changes raise reliability concerns that the Interconnection WG is also considering.

ES-16 | ENERGY STORAGE IN MARYLAND
3. Multi-use protocols – Enabling customers to use BTM storage, not only for their own benefit but also to provide services to utilities and PJM, will maximize the value of these systems to their owners and the grid. Together, with the state’s utilities and PJM, the PSC could develop standard protocols for how such systems should be metered, controlled, and serviced. As best practices and protocols for storage O&M emerge, utilities could create a set of guidelines for government agencies and other customers to use with third-party storage providers. The PSC and the state’s utilities could develop protocols for communicating with and dispatching BTM systems, via a third-party aggregator, to provide utility services. Such protocols could likely be adapted for individual BTM storage devices.
4. TOU electricity rates – Promoting rate designs that reflect the time-varying costs of generating and delivering electricity will incentivize and reward storage owners for shifting their consumption patterns to benefit the grid. The PC 44 Rate Design Work Group (Rate Design WG) has proposed a two-year, time-of-use (TOU) rate design pilot project for both utility distribution and supply for residential customers. If this pilot is given a favorable evaluation, the PSC could require that customers with storage be served under TOU rates. However, it is understood that many residential customers cannot adjust their consumption to avoid peak hours. For such customers, a mandatory TOU tariff would result primarily in higher electricity costs, not grid benefits. Over the longer term, and in accordance with any evolution in distribution system planning, the PSC and utilities may work together to create more
granular time- and (perhaps) location-based rates to address specific grid needs.
5. Net metering – Clarifying how net metering applies to storage will pave the way for customers with PV to adopt storage. For example, other states have specified that net metering applies to stored energy that was generated by on-site PV, but not energy that was drawn from the grid. The Rate Design WG is also planning to work on a TOU rate design pilot project specifically for net-metered customers. It may make sense to hold off on making any changes to net metering, or creating a next-generation incentive, until the results of this pilot project are known.
6. Battery safety – Updating building and fire codes to address the siting of large-scale batteries will help to avoid site-specific reviews and unnecessary confusion. Though these codes fall under the purview of local authorities throughout the state, they could benefit from state guidance. The General Assembly could designate a state agency to assist local authorities by gathering suitable boilerplate language from storage project developers and manufacturers. The same agency could also provide boilerplate language for the responsible decommissioning of battery projects.

ES-17INTRODUCTION AND EXECUTIVE SUMMARY |
Policy Options7. Targets – Setting a storage-related target
may prompt market creation and enable a wide range of market participants to “learn by doing.” Cost-benefit modeling can be used to identify a “no regrets” target level, or smaller targets can be set on the assumption that costs would be minimal and the results would inform future policy choices. Questions of utility ownership would need to be addressed in conjunction with setting a target or explored further within the context of a target.
8. “Bridge” incentives – Offering rebates, grants, and/or tax incentives may provide temporary support for storage, assuming that costs continue to fall and some combination of new rates, regulations, and policy initiatives take effect. Several current or previously proposed programs run by the state’s utilities and MEA could be expanded, extended, or launched to promote storage. (Note that the General Assembly might need to authorize specific changes to programs to include storage.) Pairing incentives with price signals (such as TOU rates) can help to encourage customers to modify their consumption patterns in ways that benefit the grid.
9. Financing – Lowering the cost of financing may help advanced energy storage compete with more mature technologies. Maryland can help to attract third-party financing indirectly by providing enough revenue streams to reduce the risk of innovative storage investments. In addition, independent or state-led loan programs could be created or expanded to provide funding at favorable
interest rates or with better terms than standard loans with market-based interest rates and terms.
Planning10. Distribution system planning – By
taking a more active role in overseeing distribution system planning, the PSC may be able to promote the consideration of storage as a grid asset and foster the growth of distributed resources, including storage. However, there are also significant operational/regulatory costs to requiring pre-investment reviews. To minimize the burden on regulators and utilities, this effort could focus on system upgrades above a specified cost threshold. For example, the PSC could require that when utilities are considering such upgrades, they make an informational filing that contains a brief project description and rationale. The filing would not require approval by the PSC, but rather give the PSC an opportunity to request more information, if desired. Alternatively, the PSC could require that utilities conduct a formal analysis of “non-wires alternatives.” Several other states, including California, Maine, New Hampshire, New York, and Vermont, now require such analyses.
ES-18 | ENERGY STORAGE IN MARYLAND
PJM-level Reforms11. Wholesale markets and transmission
planning – Enabling storage to participate more fully in PJM’s wholesale markets (including its capacity market) could increase storage revenue opportunities and improve grid system efficiency. In addition, storage could be used to defer transmission line upgrades, increasing opportunities for storage deployment. With input from MEA, the PSC could work with PJM to seek market and transmission planning reforms. The PSC (as well as MEA) could also encourage PJM to reform its load forecasting methodology, which relies heavily on historical load data that often predates successful peak-shaving programs in Maryland and other states. This arguably inflates the requirements that PJM places on individual utilities to make capacity purchases in order to ensure that their system loads can be met. Since PJM is in the process of developing plans to comply with FERC Order 841, comments to PJM about the ability of energy storage to participate in capacity markets are time-sensitive.
ConclusionMaryland faces numerous decisions regarding the treatment of energy storage and various methods for eliminating barriers to its use. Yet, Maryland has the advantage of not being under pressure to address certain problems that storage can help to mitigate, such as constraints on fossil fuel supplies, widespread curtailment of utility-scale wind and solar plants, or significant upward pressure on transmission and distribution costs due to load growth. These circumstances provide Maryland with the luxury to thoughtfully increase storage’s access to the grid, facilitate its participation in electric power markets, and provide compensation for
a wider range of the benefits that storage can provide. Such changes will both enable storage to compete with other technologies and address market shortcomings that necessarily result in suboptimal levels of storage investment.
Over the long term, increases in energy storage in Maryland, and in regions that affect Maryland, can potentially provide direct employment opportunities primarily related to installation and maintenance; lower overall costs by deferring distribution system upgrades and reducing peak demand; and improve environmental quality by enabling solar and wind resources to more effectively contribute to the regional energy supply. The administrative, regulatory, and legislative options enumerated in this report, along with the recommendations emerging from the PSC’s PC 44 process, provide a basis for Maryland to pursue these benefits without exposing the state’s ratepayers to large and long-term additional costs.

ES-19INTRODUCTION AND EXECUTIVE SUMMARY |
Endnotes1 Sam Wilkinson, Reaching peak performance: What the electric power sector can learn from society’s other vital networks, IHS Markit (in
partnership with AES Energy Storage), 2017, https://cdn.ihs.com/www/pdf/IHS-Markit-Whitepaper-Reaching-Peak-Performance.pdf, 2.
2 Green Mountain Power, “GMP Launches New Comprehensive Energy Home Solution from Tesla to Lower Costs for Customers,” May 12, 2017, https://greenmountainpower.com/press/gmp-launches-new-comprehensive-energy-home-solution-tesla-lower-costs-customers/.
3 Jeff St. John, “The 2017 Grid Edge Awards: Projects Defining the Future Integrated, Interactive Electric Grid,” Greentech Media, April 7, 2017, https://www.greentechmedia.com/articles/read/the-2017-grid-edge-awards#gs.x56Gaxg.
4 Julian Spector, “APS Buys Storage From AES for Less Than Half the Cost of a Transmission Upgrade,” Greentech Media, August 9, 2017, https://www.greentechmedia.com/articles/read/aes-buys-energy-storage-for-less-than-half-the-cost-of-a-wires-upgrade#gs.JHJ_wsM.
5 Hannah Polikov, “New Business Models for Storage,” Advanced Energy Economy, presentation to the Maryland PC 44 Energy Storage Work Group, June 11, 2018, slide 5.
6 “Energy Storage,” Hawaiian Electric, https://www.hawaiianelectric.com/clean-energy-hawaii/producing-clean-energy/other-routes-to-clean-energy/energy-storage (accessed June 2017, webpage now defunct).
7 Mosaic Power, “Grid Operators,” https://mosaicpower.com/grid-operators/; and Maryland Affordable Housing Coalition, “2016 Award Winners,” https://www.mdahc.org/resources/Pictures/2016AwardWinners_3.pdf.
8 Herman K. Trabish, “What’s the value of energy storage? It’s Complicated,” Utility Dive, October 20, 2015, https://www.utilitydive.com/news/whats-the-value-of-energy-storage-its-complicated/407498/.
9 Interstate Renewable Energy Council, “Charging Ahead: An Energy Storage Guide for Policymakers,” April 2017, https://irecusa.org/publications/charging-ahead-an-energy-storage-guide-for-policymakers/.
10 Massachusetts Department of Energy Resources, State of Charge – Massachusetts Energy Storage Initiative, September 2016, https://www.mass.gov/files/documents/2016/09/oy/state-of-charge-report.pdf, xiii.
11 Itron, 2016 SGIP Advanced Energy Storage Impact Evaluation, August 31, 2017, http://www.cpuc.ca.gov/WorkArea/DownloadAsset.aspx?id=6442454964, Forward.

ES-20 | ENERGY STORAGE IN MARYLAND

1-1ENERGY STORAGE OVERVIEW |
1.1. Storage and Electricity Fundamentals
Energy storage is, most simply, a set of technologies used to capture energy produced at one time and reserve it for later use. Electricity, which enables many aspects of modern life, is the product of physical processes that create an electrical charge. This charge is most often described in terms of power or energy. Power is the amount of electricity produced at one moment in time, usually measured in watts. Energy is the total level of power produced over a period of time, usually measured in watt-hours. For example, 60 watts is the amount of power required to turn-on a typical light bulb and 60 watt-hours is the amount of energy required to leave the light bulb on for an hour. See the “Power vs. Energy: Example” graphic on the following page for additional explanation.
Electricity is served to consumers over a grid consisting of interconnected power generators, long-distance transmission wires, and local distribution wires that connect to end-use consumers. The generation and transmission portion of the grid is often referred to as the
bulk electric system. Due to the physical characteristics of electricity, the total level of power production must always equal the total level of power consumption in an electricity grid (i.e., supply and demand must balance). The periods with the greatest demand for electricity are usually referred to as “peak” times; wholesale electricity prices tend to be highest during these times as the grid’s most expensive power generators are brought online. Another important characteristic of electricity is that its current flows to the point of least resistance, much like water flows downhill. Disruption to the rate of the waves of electric current or resistance that impedes its flow can cause damage to grid-connected equipment or prevent power from reaching its intended destination.
Storage has the potential to serve multiple purposes on the electric grid. Storage can replace more expensive peaking generation with less expensive energy saved from earlier, off-peak periods and thereby “flatten” peak demand. Energy storage can also “shave,” or reduce, peak demand in specific locations. Strategically placed storage can decrease or defer the need to invest in transmission and/or distribution system upgrades. Storage can also reduce the volatility of electric current by regulating the rate of waves (i.e., frequency) and the pressure that guides power (i.e., voltage) across the grid. Storage also acts as a backup when grid power is unavailable, as a power reserve that can quickly address shifts in supply or demand, and as a “kick-start” resource to restore the grid following power outages (i.e., black start), among other applications. Many of these activities are referred to as “ancillary”
1. ENERGY STORAGE OVERVIEW
Common Energy and Power Units:
1 kilowatt (kW) = 1,000 watts1 megawatt (MW) = 1,000 kW1 gigawatt (GW) = 1,000 MW1 kilowatt-hour (kWh) = 1,000 watt-hours1 megawatt-hour (MWh) = 1,000 kWh1 gigawatt-hour (GWh) = 1,000 MWh

1-2 | ENERGY STORAGE IN MARYLAND
services. As all these examples show, energy storage has a significant role to play in ensuring safe, reliable, and affordable power.
Maryland belongs to a regional energy market and bulk electric system operator known as the PJM Interconnection (PJM). PJM manages the grid balancing process by dispatching generators and other resources in real-time. The passage of power to end-use consumers is supported by local utilities, such as Baltimore
Gas & Electric Company (BGE), Potomac Electric Power Company (Pepco), and Southern Maryland Electric Cooperative (SMECO). Local utilities oversee local grid operations and make the investments necessary to support power provision. Consumers also participate in the electric grid by both providing power and changing their consumption. For example, PJM offers “demand response” programs that pay customers to change their consumption level in response to grid conditions. Declining storage costs and improvements in performance have made energy storage a consideration for a growing number of applications relevant to the above participants.
1.2. Storage TechnologiesGrid-enabled energy storage technologies operate on a larger scale than the energy storage sources encountered in everyday life, such as the batteries powering flashlights and cell phones. Grid-enabled energy storage devices are often differentiated according to energy storage method. A storage method is the way by which the device stores potential energy between charge and discharge. The four predominant methods for grid-enabled energy storage are mechanical, electrical, chemical, and thermal storage. These methods are often combined, as is the case for electrochemical and thermochemical storage. See Figure 1-1 for an
Power vs. Energy: Example
The difference between power and energy is akin to the difference between speed and distance as seen on a car dashboard. The speedometer (i.e., power) measures how fast the car is traveling at any given moment, while the odometer (i.e., energy) measures the total distance the car travels. Energy is a product of power and time, just as the distance a car travels is a product of speed and time.
X =
Time
2 Hours60 WattsDistance
Speed Power
120 Watt-hours
Energy
MECHANICALPhysical motion or
positionSource of Energy:
Technologies:
CHEMICALBreak-down of
chemical bonds
ELECTRICALMovement of
electric current
ELECTROCHEMICALFlow batteries
(e.g., vanadium redo and zinc-bromine)
Solid Rechargeable Batteries
(e.g., lithium-ion, lead acid, and sodium sulfur)
Hydrogen Fuel Cells
Synthetic Natural Gas
Ice, Heat and Chilled Water
Molten Salt
THERMALTransfer of heat
Supercapacitor
Superconducting Magnetic Energy Storage (SMES)
Compressed Air Energy Storage
(CAES)
Flywheel
Pumped Hydro
Figure 1-1. Common Energy Storage Methods and Select Storage Technologies
1-3ENERGY STORAGE OVERVIEW |
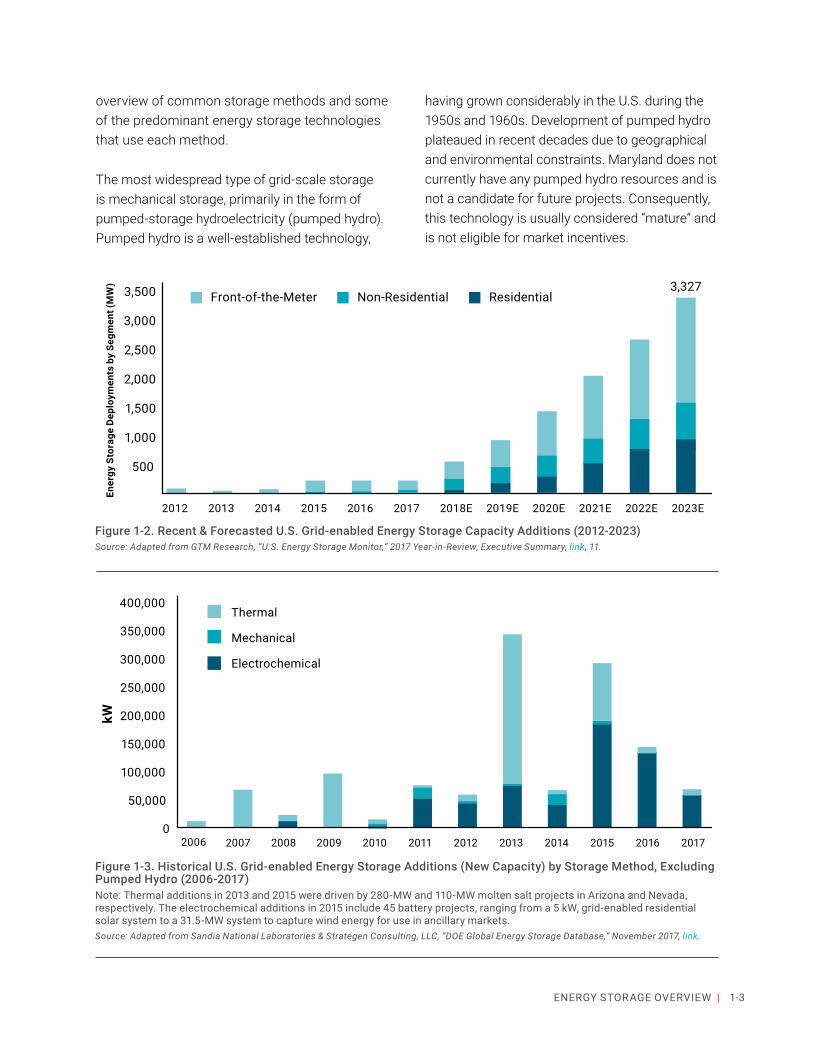
overview of common storage methods and some of the predominant energy storage technologies that use each method.
The most widespread type of grid-scale storage is mechanical storage, primarily in the form of pumped-storage hydroelectricity (pumped hydro). Pumped hydro is a well-established technology,
having grown considerably in the U.S. during the 1950s and 1960s. Development of pumped hydro plateaued in recent decades due to geographical and environmental constraints. Maryland does not currently have any pumped hydro resources and is not a candidate for future projects. Consequently, this technology is usually considered “mature” and is not eligible for market incentives.
Ener
gy S
tora
ge D
eplo
ymen
ts b
y Se
gmen
t (M
W)
3,500
3,000
2,500
2,000
1,500
1,000
500
2012 2013 2014 2015 2016
3,327
2017 2018E 2019E 2020E 2021E 2022E 2023E
Front-of-the-Meter Non-Residential Residential
400,000
350,000
300,000
250,000
200,000
150,000
100,000
50,000
0
Thermal
Mechanical
Electrochemical
2006 2007 2008 2009 2010 2011 2012 2013 2014 2015 2016 2017
kW
Figure 1-2. Recent & Forecasted U.S. Grid-enabled Energy Storage Capacity Additions (2012-2023)Source: Adapted from GTM Research, “U.S. Energy Storage Monitor,” 2017 Year-in-Review, Executive Summary, link, 11.
Figure 1-3. Historical U.S. Grid-enabled Energy Storage Additions (New Capacity) by Storage Method, Excluding Pumped Hydro (2006-2017)Note: Thermal additions in 2013 and 2015 were driven by 280-MW and 110-MW molten salt projects in Arizona and Nevada, respectively. The electrochemical additions in 2015 include 45 battery projects, ranging from a 5 kW, grid-enabled residential solar system to a 31.5-MW system to capture wind energy for use in ancillary markets. Source: Adapted from Sandia National Laboratories & Strategen Consulting, LLC, “DOE Global Energy Storage Database,” November 2017, link.

1-4 | ENERGY STORAGE IN MARYLAND
The presence of grid-energy storage technologies in the U.S. continues to expand each year, with an even higher growth trajectory projected for the next five years (2018-2023) and beyond, as shown in Figure 1-2. This growth has largely been concentrated in a handful of “advanced” mechanical, electrochemical, and thermal storage types, as illustrated in Figure 1-3. The predominance of advanced storage, especially electrochemical storage, is expected to continue. These storage types and technologies are the focus of the subsequent overview.
Although the technologies discussed in the following pages differ in terms of stage of deployment, all have reached some stage of commercial development and could be used in Maryland. Some storage technologies have achieved greater penetration, often due to specific technical and performance characteristics that are discussed further in later sections of this report. In PJM, the regional energy market serving Maryland and all or part of 11 other states, nearly 90 percent of operational storage capacity (excluding pumped hydro) is from electrochemical storage, as presented
in Figure 1-4. The current energy storage breakdown for PJM provides some indication of which storage technologies are most viable in Maryland. Several other technologies contribute disproportionate levels of storage capacity relative to the number of projects, as also demonstrated in Figure 1-4.
Electrochemical StorageA well-known example of electromechanical storage is batteries. All batteries rely on the same basic design and electrochemical process, regardless of size and application. Each battery has three parts: an anode, a cathode, and an electrolyte, as shown in Figure 1-5. The anode and cathode, also known as electrodes, hold
Lithium-based Battery
Percent of Total Capacity Rating
Supercapacitor
Flow BatteryChilled Water Storage
Flywheel
Ice Storage
Heat Storage
Lead-acid Battery
Sodium-based Battery
0.6%
0.6%
0.1%0%
1.2%2.8%
3.5%
6.3%
84.7%
Cathode (+)
Electrolyte
Anode (-)
e*
e*V
Battery Charging
Li+ Li+Li+
e*
Cathode (+)
Electrolyte
Anode (-)
e*
e*V
Battery Discharging
Li+ Li+
Li+
e*
Figure 1-4. Operational Energy Storage Projects in PJM by Technology, Excluding Pumped Hydro (as of November 2017)Source: Adapted from Sandia National Laboratories & Strategen Consulting, LLC, “DOE Global Energy Storage Database,” November 2017, link.
Figure 1-5. Diagram of a BatterySource: Adapted from “Lithium Ion Battery Primer,” May 20, 2013, link.
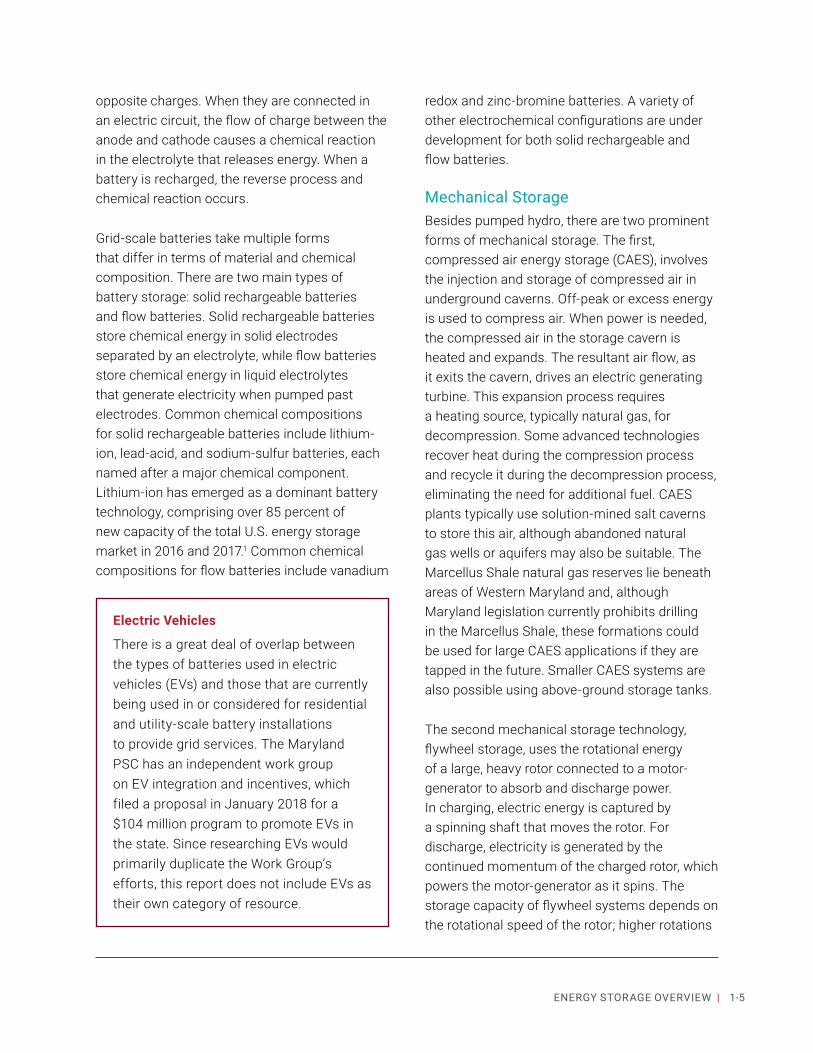
1-5ENERGY STORAGE OVERVIEW |
opposite charges. When they are connected in an electric circuit, the flow of charge between the anode and cathode causes a chemical reaction in the electrolyte that releases energy. When a battery is recharged, the reverse process and chemical reaction occurs.
Grid-scale batteries take multiple forms that differ in terms of material and chemical composition. There are two main types of battery storage: solid rechargeable batteries and flow batteries. Solid rechargeable batteries store chemical energy in solid electrodes separated by an electrolyte, while flow batteries store chemical energy in liquid electrolytes that generate electricity when pumped past electrodes. Common chemical compositions for solid rechargeable batteries include lithium-ion, lead-acid, and sodium-sulfur batteries, each named after a major chemical component. Lithium-ion has emerged as a dominant battery technology, comprising over 85 percent of new capacity of the total U.S. energy storage market in 2016 and 2017.1 Common chemical compositions for flow batteries include vanadium
redox and zinc-bromine batteries. A variety of other electrochemical configurations are under development for both solid rechargeable and flow batteries.
Mechanical StorageBesides pumped hydro, there are two prominent forms of mechanical storage. The first, compressed air energy storage (CAES), involves the injection and storage of compressed air in underground caverns. Off-peak or excess energy is used to compress air. When power is needed, the compressed air in the storage cavern is heated and expands. The resultant air flow, as it exits the cavern, drives an electric generating turbine. This expansion process requires a heating source, typically natural gas, for decompression. Some advanced technologies recover heat during the compression process and recycle it during the decompression process, eliminating the need for additional fuel. CAES plants typically use solution-mined salt caverns to store this air, although abandoned natural gas wells or aquifers may also be suitable. The Marcellus Shale natural gas reserves lie beneath areas of Western Maryland and, although Maryland legislation currently prohibits drilling in the Marcellus Shale, these formations could be used for large CAES applications if they are tapped in the future. Smaller CAES systems are also possible using above-ground storage tanks.
The second mechanical storage technology, flywheel storage, uses the rotational energy of a large, heavy rotor connected to a motor-generator to absorb and discharge power. In charging, electric energy is captured by a spinning shaft that moves the rotor. For discharge, electricity is generated by the continued momentum of the charged rotor, which powers the motor-generator as it spins. The storage capacity of flywheel systems depends on the rotational speed of the rotor; higher rotations
Electric Vehicles
There is a great deal of overlap between the types of batteries used in electric vehicles (EVs) and those that are currently being used in or considered for residential and utility-scale battery installations to provide grid services. The Maryland PSC has an independent work group on EV integration and incentives, which filed a proposal in January 2018 for a $104 million program to promote EVs in the state. Since researching EVs would primarily duplicate the Work Group’s efforts, this report does not include EVs as their own category of resource.

1-6 | ENERGY STORAGE IN MARYLAND
per minute equal higher energy output. This technology is often used as a short-term buffer to smooth power fluctuations.
Thermal StorageCommon forms of thermal storage are grid-connected ice, heat, and chilled water systems, sometimes referred to as “customer thermal.” These forms of storage are often deployed at a building or household level and function by using off-peak or excess energy to produce heating or cooling that can be deployed later. For example, an office building might create ice at night using low-cost power, then use the cooling capacity of the ice during the day for air conditioning purposes. Similarly, heating for a residential home can be produced off-peak and then stored in an insulated area, such as a steel pressure tank, until it can be used on-peak. This form of load management can displace more expensive energy, reduce peak load, and help to integrate renewable generation.
Pairing thermal storage with advanced communications software opens up new opportunities for improving grid operations. For example, rather than simply relying on set schedules, so-called grid-interactive water heaters (GIWH) can charge in response to signals for low-cost electricity or temporary oversupply from renewable generation. In addition, GIWHs can perform nearly all the grid balancing functions of fast-ramp flywheels and batteries.
A more advanced application of thermal storage is molten salt storage systems, which are often paired with concentrating solar. Concentrating solar generates electricity by using mirrors or lenses to direct sunlight to a small, specific area, such as a tower. This area is heated by the sun and the resultant thermal energy boils
Mature Technology: Pumped Hydroelectric Storage
Pumped hydro is the largest source of grid-enabled energy storage in the world and comprises over 93 percent of operational U.S. storage power capacity. This includes 5,473 MW of pumped hydro capacity in PJM.[1] It works by using low-cost power to pump water from a low-elevation reservoir to a high-elevation reservoir. The water can then be “stored” until, when power is needed, the water is released. The downward flow of water spins a hydroelectric turbine that produces electricity. Pumped hydro, unlike a traditional hydroelectric power plant, is a net consumer of electricity due to energy and water losses incurred when pumping and storing water. Nevertheless, utilities and grid operators value pumped hydro for its flexibility and ability to store energy over long timeframes. Despite these benefits, facilities are constrained to areas with the appropriate geographic terrain, including a body of water and changing elevation. Additionally, altering terrain for pumped hydro raises environmental concerns.
The Muddy Run Pumped Hydro Facility, originally constructed in 1966 and located along the Susquehanna River just north of Maryland, provides 1,070 MW of power into PJM. Source: Ibid.
[1] Sandia National Laboratories & Strategen Consulting, LLC, “DOE Global Energy Storage Database,” November 2017, link.
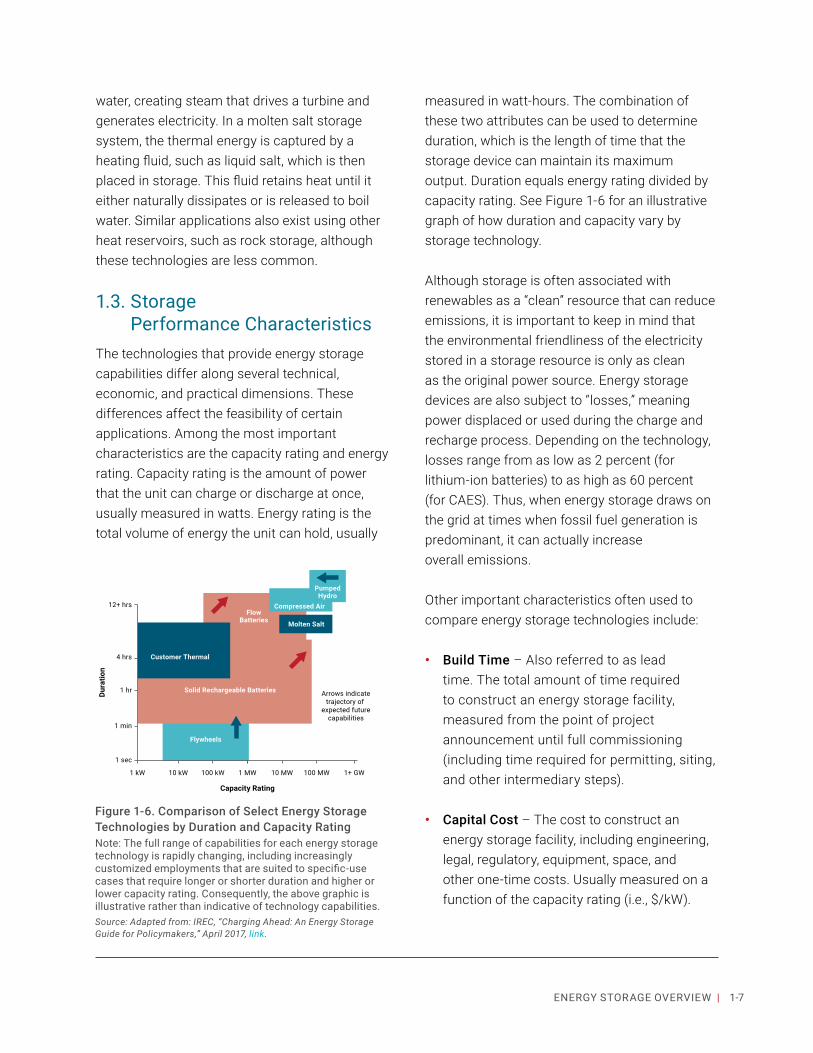
1-7ENERGY STORAGE OVERVIEW |
water, creating steam that drives a turbine and generates electricity. In a molten salt storage system, the thermal energy is captured by a heating fluid, such as liquid salt, which is then placed in storage. This fluid retains heat until it either naturally dissipates or is released to boil water. Similar applications also exist using other heat reservoirs, such as rock storage, although these technologies are less common.
1.3. Storage Performance Characteristics
The technologies that provide energy storage capabilities differ along several technical, economic, and practical dimensions. These differences affect the feasibility of certain applications. Among the most important characteristics are the capacity rating and energy rating. Capacity rating is the amount of power that the unit can charge or discharge at once, usually measured in watts. Energy rating is the total volume of energy the unit can hold, usually
measured in watt-hours. The combination of these two attributes can be used to determine duration, which is the length of time that the storage device can maintain its maximum output. Duration equals energy rating divided by capacity rating. See Figure 1-6 for an illustrative graph of how duration and capacity vary by storage technology.
Although storage is often associated with renewables as a “clean” resource that can reduce emissions, it is important to keep in mind that the environmental friendliness of the electricity stored in a storage resource is only as clean as the original power source. Energy storage devices are also subject to “losses,” meaning power displaced or used during the charge and recharge process. Depending on the technology, losses range from as low as 2 percent (for lithium-ion batteries) to as high as 60 percent (for CAES). Thus, when energy storage draws on the grid at times when fossil fuel generation is predominant, it can actually increase overall emissions.
Other important characteristics often used to compare energy storage technologies include:
• Build Time – Also referred to as lead time. The total amount of time required to construct an energy storage facility, measured from the point of project announcement until full commissioning (including time required for permitting, siting, and other intermediary steps).
• Capital Cost – The cost to construct an energy storage facility, including engineering, legal, regulatory, equipment, space, and other one-time costs. Usually measured on a function of the capacity rating (i.e., $/kW).
Capacity Rating
Dura
tion
1 kW
1 sec
4 hrs
10 kW 100 kW 1 MW
Arrows indicatetrajectory of
expected futurecapabilities
10 MW 100 MW 1+ GW
1 min
1 hr
12+ hrs
Customer Thermal
FlowBatteries
Compressed Air
Molten Salt
Solid Rechargeable Batteries
Flywheels
PumpedHydro
Figure 1-6. Comparison of Select Energy StorageTechnologies by Duration and Capacity RatingNote: The full range of capabilities for each energy storage technology is rapidly changing, including increasingly customized employments that are suited to specific-use cases that require longer or shorter duration and higher or lower capacity rating. Consequently, the above graphic is illustrative rather than indicative of technology capabilities.Source: Adapted from: IREC, “Charging Ahead: An Energy Storage Guide for Policymakers,” April 2017, link.

1-8 | ENERGY STORAGE IN MARYLAND
• Cycle Life – Also referred to as project life or useful life. Number of charge and discharge cycles that a facility can continue to provide power and energy before its capacity falls below 80 percent of its original capacity rating. Sometimes measured as the years until the storage machinery requires replacement.
• Energy Density – Energy rating per unit of volume (e.g., kWh/m3).
• Environmental Impact – Effect on the natural environment, including land alteration, disruption to wildlife, emissions from combustion, and toxic byproducts or remains.
• Levelized Cost of Energy (LCOE) – Net present value of the cost of stored energy output over the cycle life of an energy storage facility, usually represented as a function of the energy rating (i.e., $/kWh). Calculated by
summing the total, time-value adjusted capital and operating cost and dividing by the total potential energy output of the energy storage facility. An equivalent, levelized benefit of energy (LBOE) is created by replacing costs with benefits; e.g., the value of energy services provided or the energy output. The LCOE and LBOE of a technology can differ based on the proposed use of the storage device as well as inclusion or exclusion of policy incentives, such as subsidies.
• Maturity – Level of commercial readiness of an energy storage technology, reflective of the amount of additional development required before a technology can be widely deployed.
• Operating Cost – Variable cost to operate and maintain the energy storage facility, including labor, materials, and other day-to-day expenses. Usually measured on a function of the energy rating (i.e., $/kWh).
Table 1-1. Key Performance Characteristics of Selected Energy Storage TechnologiesSources: Adapted from: (1) Massachusetts Department of Energy Resources, State of Charge – Massachusetts Energy Storage Initiative, September 2016, link; (2) Sandia National Laboratories & Strategen Consulting, LLC, “DOE Global Energy Storage Database,” November 2017, link; (3) Deloitte, Energy storage: Tracking the technologies that will transform the power sector, March 2016, link; and (4) Lazard’s Levelized Cost of Storage Analysis 2.0, December 2016, link.
ELECTROCHEMICAL MECHANICAL THERMAL
CHARACTERISTIC Lead-acid Battery
Lithium-ion Battery
Sodium-Sulfur Battery
Flow Battery Flywheel CAES Molten
Salt
Capacity Rating (MW) 0.01-10 0.01-30+ 0.01-4+ 0.01-2+ 0.001-20 0.1-290 10-360
Duration (hours) 2-6 1 min – 8 hrs+
1 min – 8 hrs+ 1-2 sec – hrs 2-30 1-15
Build Time (mos.) 6-12 6-12 6-18 6-12 12-24 36-120 24-36
Space Medium Small Medium Medium Small Large Large
Capital Cost Low Medium Medium High Medium Low Medium
Operating Cost High Low Medium Medium Low Medium Medium
RTE (%) 70-85 85-98 70-90 60-85 60-95 40-75 90-95
Cycle Life500 – 2,000 cycles
1,000 – 10,000 cycles
2,500 – 5,000 cycles
5,000 – 14,000 cycles
20,000 – o 100,000 cycles
20–40 years
20–40 years

1-9ENERGY STORAGE OVERVIEW |
• Response Time – Also referred to as latency. Amount of time required to deploy an energy storage facility in response to a request for its use. Differs by energy storage method and intended device use.
• Round-trip Efficiency (RTE) – Efficiency of the energy storage facility, calculated as the total percent of energy input (i.e., charge) that can ultimately be recovered during energy output (i.e., discharge). RTE accounts for energy losses due to the storage method.
• Space – Physical area required to host the energy storage facility.
• Specific Energy – Energy rating per unit of weight (e.g., kWh/ton).
• Storage Period – Length of time energy can be stored, ranging from seconds (e.g., flywheels) to months (e.g., molten salt thermal storage), before the charge naturally dissipates.
Table 1-1 presents an overview of select characteristics for the storage technologies described earlier.
1.4. Applications of StorageThe performance characteristics and attributes of energy storage technologies allow them to serve diverse applications, which are often interchangeable, although storage devices can also be optimized for specific uses. “Behind-the-meter” (BTM) systems, meaning devices located on a customer’s property, are often tailored to provide benefit to an end-user, such as lower utility costs. These same consumers generally own or lease the system. In comparison, “front-of-the-meter” (FOM) systems, which can be located almost anywhere on the bulk electric or distribution system, are usually owned and managed by a utility or a third party. These devices are often tailored to serve specific grid or utility needs, such as providing ancillary services. Figure 1-7 illustrates where storage systems of different sizes can be located on the grid. Figure 1-8 lists specific applications for storage.
Customer-Sited Storage2 kW to 2 MW or more
Distribution Storage10 kW to 10 MWBulk Storage
10s to 100s of MW
Figure 1-7. Size Ranges for Energy Storage, Depending on Grid LocationSource: Adapted from Ben Kaun, “Energy Storage Update,” EPRI, Presentation to Maryland PSC Energy Storage Work Group, July 15, 2017, 35.

1-10 | ENERGY STORAGE IN MARYLAND
Storage applications can be grouped, according to their purpose:
1. Reducing Costs and Peak Shaving – Instead of relying on natural gas peaking plants during times of high electricity demand, energy storage can release energy that was stored during off-peak periods when electricity prices are lower. Grid operators can dispatch storage instead of generation. Alternatively, customers or utilities can independently discharge storage to lower peak demand. Additionally, power producers can use storage to price arbitrage.
2. Reliability/Resiliency – Storage can enhance reliability for customers by providing backup power during an outage or interruption. In some cases, storage is built into a “microgrid” configuration, meaning a self-sufficient electricity grid, containing a generation resource, that can operate on a small scale even if temporarily disconnected from the bulk electric system. Pairing storage with PV can also to keep critical loads running in homes
and businesses. At the grid level, storage can enhance resiliency (i.e., the capacity to recover quickly from natural disasters and/or preserve or restore critical infrastructure). For example, utilities have demonstrated that storage can provide ‘black-start’ service, firing up a traditional generator that has gone idle during a blackout.
3. Infrastructure Deferral – Storage can be used to avoid or delay generation, transmission, and distribution upgrades that would otherwise be necessitated by system constraints or reliability requirements. For example, storage could be used to supply peak demand in place of adding generation capacity or expanding transmission from existing supply. This capability is especially useful to strategically address the infrastructure needs of growing demand in localized load pockets.
4. Ancillary Services – Storage can provide services to ensure reliable transmission of electricity and reliable operation of the bulk electric system. These services include
BULK ELECTRIC SYSTEM APPLICATIONS
BULK ENERGY SERVICESElectric Time ShiftElectric Supply Capacity Renewables IntegrationFirmingCurtailment Avoidance
ANCILLARY SERVICESFrequency Response & RegulationRamping/Load FollowingVoltage/VAR SupportBlack StartSpinning and Non-Spinning ReservesPower Quality
BEHIND-THE-METER APPLICATIONS
PEAK DEMAND REDUCTION
ENERGY MANAGEMENT SERVICESTime-Varying Rate ManagementDemand Charge Management
RELIABILITY SERVICESBack-up Power
INFRASTRUCTURE APPLICATIONS
TRANSMISSION SERVICESNetwork CapacityCongestion Relief
DISTRIBUTION SERVICESNetwork CapacityVoltage/VAR Support
T&D UPGRADE DEFERRAL
INCREASED HOSTING CAPACITY
AREA REGULATION
Figure 1-8. Storage ApplicationsSee the glossary for definitions of these applications.Source: Adapted from IREC, Charging Ahead: An Energy Storage Guide for Policymakers, April 2017, link, 5.

1-11ENERGY STORAGE OVERVIEW |
frequency and voltage regulation, load following and ramping, black start, and spinning and non-spinning reserve capacity. These applications each serve specific requirements of electricity provision, such as managing the volatility of electric current and the constant balancing of supply and demand over multiple time frames (e.g., seconds, minutes, and hours).
5. Integrating Renewable Energy Resources – Storage can be used to smooth out intermittency or absorb excess production from wind and solar resources. Energy storage can help transform a renewable facility into a “firm,” meaning more predictable, source of generation by supplying stored power whenever the renewable energy resource experiences an interruption (e.g., when the wind stops blowing or the sun sets). It can also minimize curtailment of renewable energy generation, especially during negative price periods (i.e., supply exceeds demand).
The various uses of energy storage intersect and draw from common energy storage characteristics. Most notable is energy storage’s ability to “time-shift,” meaning shift energy consumption or production from one period to another. Unsurprising given this shared foundation, the benefits from storage are “stackable,” meaning a system can be designed to tap into multiple value streams at once using several functions. Table 1-2 shows which of the above applications is most common for each major storage technology. See the sidebar below for an introduction to two important technologies that enable many of the above applications.
1.5. ConclusionEnergy storage has been called the “Swiss Army knife of the energy world.”2 It can provide services traditionally provided by a generator, a transmission asset, or a distribution asset. Whether and when it makes financial sense to use storage is influenced not only by storage system costs, but also by customer priorities, grid system needs, and market structures,
Table 1-2. Key Applications for Selected Operational U.S. Energy Storage TechnologiesSource: Adapted from Sandia National Laboratories & Strategen Consulting, LLC, “DOE Global Energy Storage Database,” November 1, 2017, link.
ELECTROCHEMICAL MECHANICAL THERMAL
APPLICATION
Lith
ium
-ion
Batt
ery
Lead
-aci
d Ba
tter
y
Sodi
um-s
ulfu
r Ba
tter
y
Flow
Bat
tery
CA
ES
Flyw
heel
Chi
lled
Wat
er
Stor
age
Ice
Stor
age
Hea
t Sto
rage
Mol
ten
Salt
Integrating Renewables
Ancillary Services
Reducing Costs and Peak Shaving
Resiliency
Infrastructure Deferral
Key: Application in ≥25% of operational units Application in 10% to 25% of operational units Application in ≤10% of operational units Not currently applied
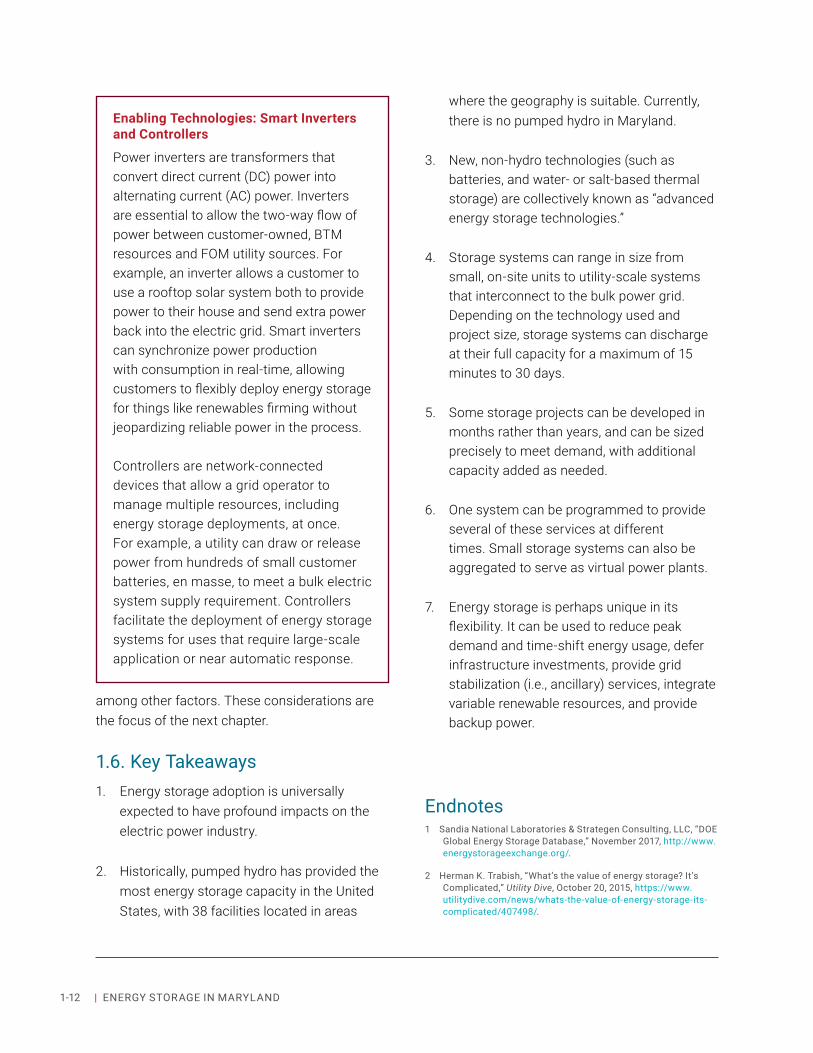
1-12 | ENERGY STORAGE IN MARYLAND
among other factors. These considerations are the focus of the next chapter.
1.6. Key Takeaways1. Energy storage adoption is universally
expected to have profound impacts on the electric power industry.
2. Historically, pumped hydro has provided the most energy storage capacity in the United States, with 38 facilities located in areas
where the geography is suitable. Currently, there is no pumped hydro in Maryland.
3. New, non-hydro technologies (such as batteries, and water- or salt-based thermal storage) are collectively known as “advanced energy storage technologies.”
4. Storage systems can range in size from small, on-site units to utility-scale systems that interconnect to the bulk power grid. Depending on the technology used and project size, storage systems can discharge at their full capacity for a maximum of 15 minutes to 30 days.
5. Some storage projects can be developed in months rather than years, and can be sized precisely to meet demand, with additional capacity added as needed.
6. One system can be programmed to provide several of these services at different times. Small storage systems can also be aggregated to serve as virtual power plants.
7. Energy storage is perhaps unique in its flexibility. It can be used to reduce peak demand and time-shift energy usage, defer infrastructure investments, provide grid stabilization (i.e., ancillary) services, integrate variable renewable resources, and provide backup power.
Enabling Technologies: Smart Inverters and Controllers
Power inverters are transformers that convert direct current (DC) power into alternating current (AC) power. Inverters are essential to allow the two-way flow of power between customer-owned, BTM resources and FOM utility sources. For example, an inverter allows a customer to use a rooftop solar system both to provide power to their house and send extra power back into the electric grid. Smart inverters can synchronize power production with consumption in real-time, allowing customers to flexibly deploy energy storage for things like renewables firming without jeopardizing reliable power in the process.
Controllers are network-connected devices that allow a grid operator to manage multiple resources, including energy storage deployments, at once. For example, a utility can draw or release power from hundreds of small customer batteries, en masse, to meet a bulk electric system supply requirement. Controllers facilitate the deployment of energy storage systems for uses that require large-scale application or near automatic response.
Endnotes1 Sandia National Laboratories & Strategen Consulting, LLC, “DOE
Global Energy Storage Database,” November 2017, http://www.energystorageexchange.org/.
2 Herman K. Trabish, “What’s the value of energy storage? It’s Complicated,” Utility Dive, October 20, 2015, https://www.utilitydive.com/news/whats-the-value-of-energy-storage-its-complicated/407498/.

2-1COSTS AND BENEFITS OF ENERGY STORAGE |
It is widely thought that energy storage must provide multiple services, a practice known as “value stacking,” to be cost-effective. Optimizing a storage system in this fashion involves crossing boundaries between elements of the electrical grid (such as wholesale markets, the transmission system and the distribution system) whose needs are typically evaluated in isolation. Storage-based solutions are frequently more costly than solutions that serve just one element of the grid, and have historically been passed over for this reason. Due to the limitations of traditional evaluation methods, there is growing interest in focusing instead on whether a storage system’s “value stack” is greater than its cost, as shown in Figure 2-1. Theoretically, the further “out” on the
grid a system is located, the more value streams a storage system can stack. For example, only behind-the-meter (BTM) systems can provide customer services, as well as distribution system and bulk energy services. However, larger systems benefit from economies of scale.
The cost of energy storage only has meaning relative to the expected services and performance it will provide. Determining whether storage is cost-effective requires an answer to the question, “Cost-effective for providing which services?”
– IREC, Charging Ahead
2. COSTS AND BENEFITS OF ENERGY STORAGE
LCOS Non-MonetizedValue Stream
“Missing Money”
Profitability Total SocialValue
Revenue Stream 1
Revenue Stream 2
Revenue Stream 3
Tota
l Rev
enue
Total Value
Figure 2-1. Idealized Stacked Benefits IllustrationNote: Levelized Cost of Storage (LCOS) is the net present value of the cost of stored energy output over the cycle life of an energy storage facility.Source: Adapted from Lazard’s Levelized Cost of Storage Analysis—Version 3.0, November 2017, link, 4.
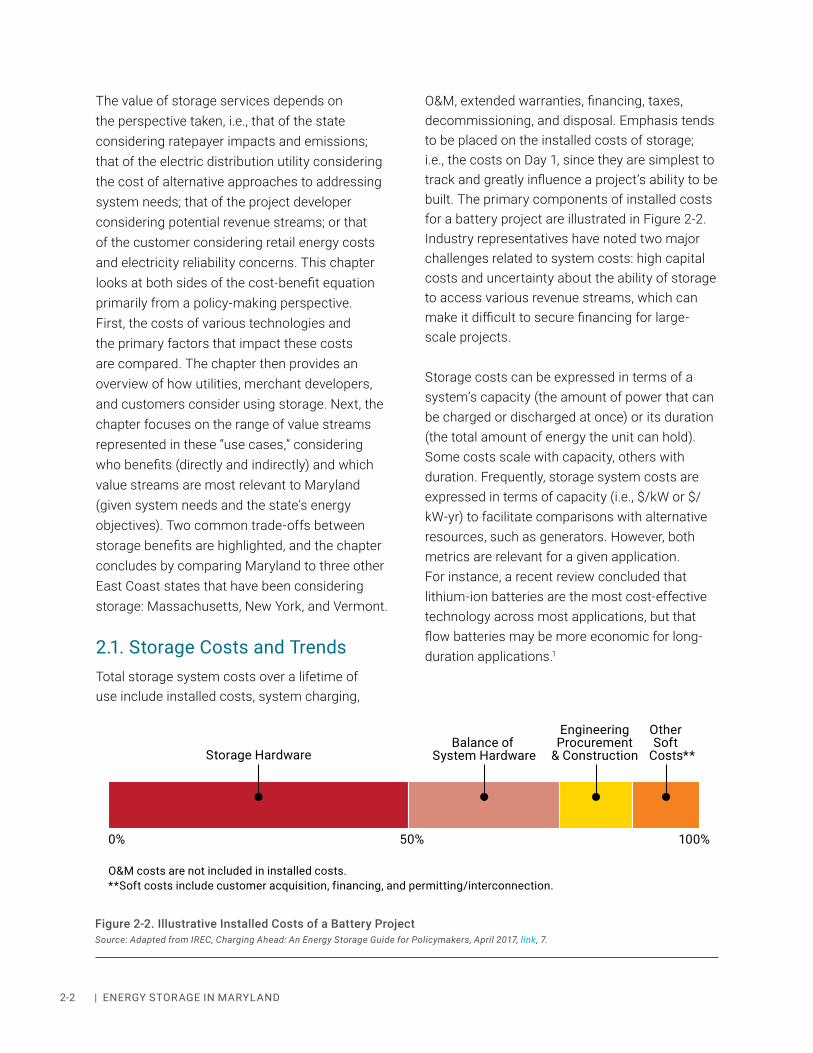
2-2 | ENERGY STORAGE IN MARYLAND
The value of storage services depends on the perspective taken, i.e., that of the state considering ratepayer impacts and emissions; that of the electric distribution utility considering the cost of alternative approaches to addressing system needs; that of the project developer considering potential revenue streams; or that of the customer considering retail energy costs and electricity reliability concerns. This chapter looks at both sides of the cost-benefit equation primarily from a policy-making perspective. First, the costs of various technologies and the primary factors that impact these costs are compared. The chapter then provides an overview of how utilities, merchant developers, and customers consider using storage. Next, the chapter focuses on the range of value streams represented in these “use cases,” considering who benefits (directly and indirectly) and which value streams are most relevant to Maryland (given system needs and the state’s energy objectives). Two common trade-offs between storage benefits are highlighted, and the chapter concludes by comparing Maryland to three other East Coast states that have been considering storage: Massachusetts, New York, and Vermont.
2.1. Storage Costs and TrendsTotal storage system costs over a lifetime of use include installed costs, system charging,
O&M, extended warranties, financing, taxes, decommissioning, and disposal. Emphasis tends to be placed on the installed costs of storage; i.e., the costs on Day 1, since they are simplest to track and greatly influence a project’s ability to be built. The primary components of installed costs for a battery project are illustrated in Figure 2-2. Industry representatives have noted two major challenges related to system costs: high capital costs and uncertainty about the ability of storage to access various revenue streams, which can make it difficult to secure financing for large-scale projects.
Storage costs can be expressed in terms of a system’s capacity (the amount of power that can be charged or discharged at once) or its duration (the total amount of energy the unit can hold). Some costs scale with capacity, others with duration. Frequently, storage system costs are expressed in terms of capacity (i.e., $/kW or $/kW-yr) to facilitate comparisons with alternative resources, such as generators. However, both metrics are relevant for a given application. For instance, a recent review concluded that lithium-ion batteries are the most cost-effective technology across most applications, but that flow batteries may be more economic for long-duration applications.1
0% 50% 100%
Storage Hardware
O&M costs are not included in installed costs.**Soft costs include customer acquisition, financing, and permitting/interconnection.
Balance of System Hardware
EngineeringProcurement
& Construction
OtherSoft
Costs**
Figure 2-2. Illustrative Installed Costs of a Battery ProjectSource: Adapted from IREC, Charging Ahead: An Energy Storage Guide for Policymakers, April 2017, link, 7.

2-3COSTS AND BENEFITS OF ENERGY STORAGE |
Storage system costs vary widely depending on the technology used, system size, and application. Though rarely in the spotlight, thermal technologies, including ice storage, chilled water storage, and water heaters, are more efficient (when used for thermal applications) than electrical storage and often less costly, as
i Also, the amount of the ITC for a storage system is limited to the percentage of the charging energy provided by renewable energy. For example, if 90 percent of the energy used to charge the storage system is sourced from a solar energy system, then the storage system is eligible for only 90 percent of the ITC.
illustrated in Figure 2-3. Industry representatives and publications from the thermal storage community point out that their products are frequently pigeon-holed (based on their long tradition of providing pre-programmed load-shifting/peak load management services) and overlooked for dynamic, new applications, such as providing ancillary services or integrating renewable generation. For example, a recent study observed, “Electric water heaters are essentially pre-installed thermal batteries that are sitting idle in more than 50 million homes across the U.S.”2
Pairing storage with renewable energy generation allows for potential cost savings. Currently, storage paired with solar generation qualifies for the federal investment tax credit (ITC) for renewable generation, as long as at least 75 percent of the energy used to charge the storage system comes from a renewable energy system.i Also, the cost of some system control equipment can be shared, as can siting and interconnection expenses.
$0
$200
2016 2017 2018 2019 2020
Inst
alle
d C
ost (
$/kW
)
$400
$600
$800
$1,000
$1,200
$1,400
$1,600
$1,800
$2,000
Figure 2-4. Projected Capital Cost Declines for Lithium-ion BatteriesSource: Adapted from Energy Storage Association, Including Advanced Energy Storage in Integrated Resource Planning: Cost Inputs and Modeling Approaches v1.1, November 2016, link, 5.
Figure 2-3. Illustrative Comparison of Thermal and Battery Storage Capacity and Installed Costs Source: Adapted from Kelly Murphy, “Water Heating Driving 100% Renewables in Hawaii,” Steffes, November 30, 2017, slide 15.
Steffes Hydro Plus10 kWh/day ~$1,500
Tesla Powerwall13 kWh (AC) ~$6,500

2-4 | ENERGY STORAGE IN MARYLAND
Much of the interest in energy storage today is due to rapid declines in the capital cost of quick-responding electrochemical storage technologies that can be scaled to projects of different sizes and deployed more quickly than standard plants. Steep price declines for lithium-ion batteries, as shown in Figure 2-4, are being driven, in large part, by a surge in worldwide demand for battery-powered electric vehicles and associated economies of scale. Despite cost declines, storage projects involving batteries often fall shy of profitability today. Some industry analysts expect that capital costs for a range of new battery technologies will continue to fall swiftly. Others see non-lithium ion batteries falling behind, unable to prove that they have the real-world experience to win new projects, which prevents economies of scale from emerging.3 (Additional cost information about electrochemical storage technologies is provided in Appendix B.)
2.2. Storage BenefitsSince policies and regulations are shaped around real-world actors, it can be helpful to think about storage in the context of projects with specific end-users, locations, and applications. While there are several permutations of these three factors, many projects fall under the set of 11 “use cases” in Table 2-1, which categorizes projects by end-user and primary application(s). The end-users belong to five categories: utilities, munis/coops, merchant developers, customers, and microgrid hosts.
Note that the number of scenarios per end-user bears no relationship to the number of projects that would be most beneficial to the grid. For example, a recent cost-benefit study conducted on behalf of the Massachusetts Department of Energy Resources (DOER) and
the Massachusetts Clean Energy Center (CEC) recommended that 50 percent of all storage capacity be grid-scale systems deployed by investor-owned utilities (IOUs) and munis/co-ops, even though these represent just two use cases.4
The primary applications in Table 2-1 echo the list introduced at the end of Chapter 1: Peak Shaving/Reducing Costs, Resiliency, Infrastructural Deferral, Ancillary Services, and Integrating Renewable Energy Resources. Peak Shaving (or Peak Demand Management) is the most common application; it appears in six scenarios that include utility, customer, and microgrid end-users (Use Cases B, G, H, I, J, K). Infrastructure Deferral shows up in the example of a utility end-user (Use Case A). Resiliency is a primary application in two customer end-user scenarios as well as the microgrid scenario (Use Cases I, J, K). Finally, Renewables Integration shows up in utility, merchant, and customer end-user scenarios (Use Cases A, D, G).
It is important to consider whether Maryland/PJM has near-term needs for the services that storage can provide, and how easily storage could meet these needs. The remainder of this section explores these questions by looking at each of the primary purposes for storage individually, even though real-world projects would likely stack applications.
Peak Shaving and Reducing Costs As the EmPOWER Maryland program has long demonstrated (using traditional load controls), peak shaving is a powerful tool for avoiding electricity costs. Storage is another resource for such efforts. In a recent cost-benefit study, Massachusetts concluded that using storage for additional peak shaving, as shown in Figure 2-5, could avoid an estimated $1.093 billion

2-5COSTS AND BENEFITS OF ENERGY STORAGE |
USE CASE END-USER DESCRIPTION OF PRIMARY APPLICATION(S)
A Investor Owned Utility[a]
An IOU owns and dispatches storage systems, which are often located at substations, to address local needs, including high demand, reliability threats, and backflows from distributed PV.
B Muni/Co-opA muni or co-op owns and dispatches a storage system in its service territory to provide backup power and lower the utility’s peak demand, capacity, and transmission costs.
C
Merchant
Regulation Resource[a] A merchant developer owns and operates a storage system to provide frequency regulation in PJM.
D Solar/Wind + StorageA solar/wind project developer owns and operates a storage system in order to sell “dispatchable” and firm energy better aligned with peak demand.
E Peaker Replacement
A merchant developer owns and operates a storage or solar+storage system to provide peaking power. This has become cost-effective in a few urban areas outside PJM where siting traditional plants is challenging.
F Traditional plant + storage
A gas generator owns and operates a storage system to help the plant run at optimal heat rate levels and avoid numerous on/off cycles. This can cut plant emissions by an estimated 60 percent.
G
BTM
C&I Solar + Storage[a]
A commercial or industrial customer with on-site solar owns and operates a storage system to firm its solar energy and reduce its reliance on the grid during peak times.
H C&I Storage[a],[b]One or many C&I customers rely on thermal storage to provide cooling in their buildings, trimming their peak demand and related costs.
I Residential / C&I[a] A residential or C&I customer owns a storage system for backup power during outages and for bill management.
J Residential dispatched by a utility or third party
Similar to the use case above, but the utility or third party would be able to dispatch the storage system to capture the grid benefits of peak demand reduction.[b]
K Microgrid / Resiliency[a]A municipality, university, or other localized energy user owns and operates a storage system to provide peak demand reduction and backup power.
Table 2-1. Illustrative Energy Storage Use CasesSource: Adapted from Massachusetts Department of Energy Resources, State of Charge – Massachusetts Energy Storage Initiative, September 2016, link, xv.
[a] Real-world projects already exist in Maryland. See Chapter 3 for further details.
[b] This is akin to the vision for community storage put forth by a broad coalition of industry participants (including American Public Power Association, Edison Electric Institute, National Rural Electric Cooperative Association, Natural Resources Defense Council, and Peak Load Management Alliance) who have launched a Community Storage Initiative. The group defines community storage as “grid-interactive behind-the-meter storage technologies like electric water heaters, thermal storage, electric vehicles, and batteries [that] are located in homes and businesses and are aggregated & controlled for the benefit of the community, the utility and the grid.”

2-6 | ENERGY STORAGE IN MARYLAND
in peaking plant costs (for the year 2020) by deferring the need for new peaking plants and reducing capacity market costs. This level of savings would be most likely, the report noted, if peak shaving were coordinated by the Independent System Operator of New England (ISO-NE) or by utilities, to fully utilize storage for peak reduction. Peak shaving by storage would become much more difficult beyond the region shaded in red below, which corresponds to the 4 hour duration limits of many lithium-ion batteries.
Using storage for peak shaving in Maryland may have similar potential to save money, with two important differences. Peak demand is growing 1.5 percent per year in Massachusetts, while in Maryland peak demand is growth is nearly flat, due, at least in part, to EmPOWER Maryland.5,6 Massachusetts represents roughly half of ISO-NE’s load; it can expect to heavily influence ISO-NE’s capacity market prices through unilateral action. Maryland, in contrast, accounts for about 8 percent of PJM’s demand; Maryland is unlikely to significantly affect PJM’s capacity
market prices. The following sections look at the likely impacts of Maryland’s IOUs, munis/coops, and end-use customers using peak shaving in response to the price signals they receive, many of which originate with PJM.
IOU Peak ShavingPJM runs a capacity market, known as the Reliability Pricing Model (RPM), to ensure that the entire region has enough generating capacity. The RPM includes a forward auction and several incremental auctions. PJM assigns a portion of RPM auction costs to each Maryland IOU based on its share of PJM’s projected summer peak load, also known as PJM’s coincident peak (CP). Theoretically, Maryland’s IOUs could use storage to lower their system-wide peak demand, and associated capacity and transmission costs, on behalf of their customers. When Tesla spoke about a similar program in Vermont (see sidebar) at a PPRAC Storage Work Group meeting, interest was high from utility representatives and customers alike. However, several challenges associated with this possibility should be kept in mind:
9,000
10,000
11,000
12,000
Dem
and
(MW
)
13,000
14,000
15,000
12:00 AM2:00 AM
4:00 AM6:00 AM
8:00 AM
10:00 AM
12:00 PM2:00 PM
4:00 PM6:00 PM
8:00 PM
10:00 PM
Energy Storage Charge/Discharge Peak Without Storage Peak With Storage
Almost 10% in peak reduction
by 2020Storage Charging
Storage DischargingPeak
New Peak
Figure 2-5. Massachusetts Demand Curve after Energy Storage DeploymentSource: Adapted from Massachusetts Department of Energy Resources, State of Charge – Massachusetts Energy Storage Initiative, September 2016, link, 91.

2-7COSTS AND BENEFITS OF ENERGY STORAGE |
PJM and Storage
PJM is responsible for dispatching and coordinating the flow of electricity across the bulk electric grid throughout Maryland and all or parts of 11 other states (see Figure 2 6 for a map of PJM’s transmission zones). PJM also manages the high-voltage transmission grid in this territory. Because PJM participates in interstate commerce, it is regulated by the FERC, whose primary role is to ensure that rates are just and reasonable and that energy markets or transmission service are not discriminatory.
PJM’s four primary markets and sub-markets are shown in the table at right. In addition, PJM provides cost-of-service compensation for non-market services such as black start generation. To maintain transmission reliability, PJM conducts an annual modeling exercise, which identifies potential issues over a 15-year horizon. Currently, PJM cannot impose generation or demand-based solutions, such as storage; instead, PJM authorizes construction and cost recovery of transmission upgrades to address areas of concern.
PJM is credited with being the first ISO/RTO to revise its frequency regulation market rules to reward fast-responding resources such as batteries and flywheels. Moreover, nearly every storage system interconnected with PJM (roughly 300 MW) has relied almost exclusively on the regulation market for revenues. Although energy storage may technically participate in PJM’s other markets, either market conditions make participation economically unattractive or market rules make participation unviable. For example,
relatively new capacity market rules require resources to be available for the entire duration of an emergency, regardless of its length, or face stiff penalties. This rule effectively precludes storage from participating in the capacity market.
In February 2018, FERC issued Order No. 841, which is intended to level the playing field for storage in all RTO energy, ancillary service, and capacity markets. The Order requires PJM (and its fellow RTOs/ISOs) to revise bidding structures to account for storage’s technical capabilities and permit storage to establish clearing prices, among other changes. PJM has announced plans to submit a compliance filing by March 31, 2019.
ZONE
Duquesne LightEast Kentucky Power Cooperative
PECO Energy
Jersey Central Power and Light CompanyMetropolitan Edison CompanyPPL Electric Utilities
Pennsylvania Electric CompanyPotomac Electric Power CompanyPublic Service Electric and Gas CompanyRockland Electric Company
American Transmission Systems
Baltimore Gas and Electric CompanyCommonwealth EdisonDayton Power and Light Company
Duke Energy Ohio and KentuckyDominion
American Electric Power CompanyAllegheny Power Systems
Delmarva Power and Light Company
Atlantic City Electric Company
Figure 2-6. PJM Transmission ZonesSource: Adapted from PJM, Transmission Zones Map, link.
MARKET MARKET TYPES/PRODUCTS
EnergyReal-time Energy Market
Day-ahead Energy Market
Capacity Reliability Pricing Model (RPM)
Ancillary Services
Regulation Market
Synchronized Reserve Market
Non-synchronized Reserve Market
Day-ahead Schedule Reserve Market (DASR)
Financial Transmission Rights
Financial Transmission Rights (FTR)
Auction Revenue Rights (ARR)

2-8 | ENERGY STORAGE IN MARYLAND
• PJM’s load forecasting model heavily discounts peak-shaving efforts. In fact, it uses daily peak loads from all summer days over the span of 18 years to determine an IOU’s likely load.7 PJM uses these forecasts to determine how much capacity is needed overall in its RPM auctions. Therefore, collectively, peak-shaving programs can do little to minimize the amount of capacity that PJM procures, and these costs must be borne by all PJM members. (PJM has established a task force called the Summer-Only Demand Response Task Force (SODRTF) that is looking at ways to incorporate summer-only DR into its load forecast. If the Task Force’s recommendations are approved by PJM, they may be sent to FERC to be approved for the next annual auction.)8
• Predicting PJM’s CP is becoming more difficult as distributed energy resources
ii Maryland’s munis and coops also frequently have their own generation and/or separate contracts with generators. Thus, this discussion only applies to the cost of power delivered by IOUs.
(DERs) come online. IOUs would need to reserve storage capacity for peak shaving on a broader set of “likely” CPs, in the hopes of catching the true CP. Even so, they might well miss it, which would limit cost savings.9
• An IOU must recoup transmission upkeep costs, but can avoid transmission expansion costs on behalf of its customers. IOUs do not face transmission charges from PJM or its members for the delivery of energy to their territory; instead, IOUs work with PJM to fairly allocate their own costs (i.e., the cost of maintaining the portion of the bulk transmission system in their respective regions) to all customers in their territory. By avoiding or slowing the growth of peak demand, utilities can avoid the cost of expanding transmission capacity in their respective territory.
Municipal and Co-op Peak ShavingMunis and coops can also discharge storage at times of peak demand to minimize both capacity and transmission charges on behalf of their customers. This works in Maryland and several other states because the IOUs that deliver power to munis and coops treat them as large customers.ii Capacity charges for munis and coops are typically based on their demand levels during the five periods when load peaks in PJM each summer, also known as PJM’s 5CPs. Meanwhile, transmission charges are based on the date and time when each IOU reaches its non-coincident peak each month.
In the long run, peak load shaving on the part of munis and coops (as well as IOUs and customers) should limit the need for future transmission and capacity projects, thus resulting in savings for all PJM ratepayers. Yet, as with IOUs, predicting the 5CPs and monthly
GMP: BTM Systems for Resiliency and Bill Management
In 2017, Green Mountain Power (GMP) and Tesla launched a program to install, and then aggregate, up to 2,000 batteries in customer homes in Vermont. For $15 per month or a $1,500 one-time fee, customers receive backup power for 10 years. Meanwhile, the utility will dispatch the batteries to reduce system-wide peak load by up to 10 MW, which will lower costs for all its customers by reducing the utility’s transmission and capacity charges. GMP also anticipates using the storage network to provide capacity, grid stability, and wholesale market services.
Source: Green Mountain Power, “GMP Launches New Comprehensive Energy Home Solution from Tesla to Lower Costs for Customers,” May 12, 2017, link.

2-9COSTS AND BENEFITS OF ENERGY STORAGE |
regional peaks is an art. Also, in the near term, avoiding transmission charges is a zero-sum game. Transmission charges cover the cost of maintaining today’s bulk transmission system. If one utility customer’s transmission costs go down, the money must be found elsewhere, perhaps through raising rates.10
Customer Bill ManagementStorage (or storage paired with a generation resource) used for bill management may be cost-effective for customers on time-of-use (TOU) rates or tariffs characterized by high demand charges, neither of which is particularly common in Maryland. A recent National Renewable Energy Laboratory (NREL) study characterized high demand charges as $15/kW or greater. NREL surveyed the country for regions where at least some tariffs for commercial customers contain demand charges at or above $15/kW. Western Maryland is one such region.11 However, demand charges for commercial customers are typically based on their individual peak demand each
month, which may not correlate with utility- wide peaks.
Infrastructure DeferralUtility-level T&D Deferral ProjectsUtility-level infrastructure deferral projects offer a promising revenue stream for storage and other DERs. Figure 2-7 shows a sampling of revenue estimates for transmission and distribution (T&D) deferral projects from around the country, based on both actual projects and studies. Setting aside the Brooklyn-Queens Demand Management (BQDM) Program (which is replacing an exceptionally costly traditional upgrade), the estimates below range from about $20 to $300/kW-yr. In comparison, the cost of a lithium-ion battery used for T&D deferral purposes is estimated to be $272 to $338/kW yr.12
Deferral projects are not a new phenomenon, but their use is gaining popularity. In 2016, the T&D deferral pipeline grew by 200 percent, as
$0
BQDM High
BQDM Low
AEP TexasAPS
Central Hudson High
Central Hudson Low
New England High
New England LowSandia
RAP - WECC High
RAP - WECC Low
$100
$200
$300
$1,000
Projects Utility Planning Estimates Academic Estimates
$/kW
-yr$
/kW
-yr
BQDM = Brooklyn-Queens Demand Management Program
APS = Arizona Public Service
RAP - WECC = Regulatory Assistance Project – Western Coordinating Council
Figure 2-7. Estimated Revenue from U.S. Deferral Projects ($/kW-yr)Source: Adapted from Lazard’s Levelized Cost of Storage Analysis—Version 3.0, November 2017, link, 23.

2-10 | ENERGY STORAGE IN MARYLAND
30 projects were announced in California, New York, and Oregon, all states where requirements to evaluate so-called “non-wires alternatives” (NWAs) to traditional grid upgrades are in effect (see Chapter 4).iii Overall, there are currently 133 NWA projects in the U.S., representing 1,960 MW of capacity. NWA projects rely more on energy efficiency measures than all other DERs combined, but storage is in the mix, as shown in Figure 2-8.13
Several utility representatives have cautioned that there may not be widespread need for storage projects in Maryland to address distribution system issues in the near term. For example, in the context of PC 44 discussions, the Exelon utilities have said they collectively see cost-effective opportunities for only about 10 MW of total storage in their Maryland service territories. However, they stress that the cost-effectiveness of storage depends on how
iii In Oregon, a Bonneville Power Administration requirement for NWAs applies to deferral projects.
much they can stack values by participating in wholesale markets when storage is not being used as a grid asset. (See the “Utility Ownership/Cost Recovery” section of Chapter 5 for a fuller discussion of this last point.)
APS: Utility-scale Batteries for Infrastructure Upgrade Deferral
In 2017, Arizona Public Service announced plans to purchase two 1-MW/4-MWh batteries for less than half the up-front cost of a traditional distribution system upgrade for Punkin, Arizona. The batteries will provide power on the ~25 days when local and system peaks would otherwise strain the grid. The storage system will also provide ancillary services and store negatively priced energy for later use. A traditional solution would have entailed upgrading 20 miles of 21-kV cables.
Source: Charles Vaughn, “APS to Use Energy Storage in Place of Traditional Infrastructure on the Distribution Grid, Fluence Energy Blog, August 10, 2017, link.
PG&E: DERs for Transmission Deferral
In 2017, Pacific Gas and Electric (PG&E) and the California Independent System Operator (CAISO) announced that they would implement enough DERs over the next five years to offset any transmission reliability issues resulting from the phase out of a 168-MW, diesel-fired power plant in Oakland, which runs approximately 35 days per year. As part of this initiative, PG&E is seeking 20 to 40 MW of DERs in lieu of building new transmission lines.
Source: Jeff St. John, “A California First: Enlisting Distributed Energy for the Transmission Grid,” Greentech Media, December 7, 2017, link.
TBD
DG (TBD fuel)
EE
DG (Wind)
DR
Storage
DG (Diesel)
DG (Natural Gas)
DG (Solar PV)
CVR
DG (Biomass)
1,960 MW
19%
55%
14%
12%
5%
3%2%
133 Projects
Source: GTM Research
TBD
DG (TBD fuel)
EE
DG (Wind)
DR
Storage
DG (Diesel)
DG (Natural Gas)
DG (Solar PV)
CVR
DG (Biomass)
1,960 MW
19%
55%
14%
12%
5%
3%2%
133 Projects
Source: GTM Research
TBD
DG (TBD fuel)
EE
DG (Wind)
DR
Storage
DG (Diesel)
DG (Natural Gas)
DG (Solar PV)
CVR
DG (Biomass)
1,960 MW
19%
55%
14%
12%
5%
3%2%
133 Projects
Source: GTM Research
TBD
DG (TBD fuel)
EE
DG (Wind)
DR
Storage
DG (Diesel)
DG (Natural Gas)
DG (Solar PV)
CVR
DG (Biomass)
1,960 MW
19%
55%
14%
12%
5%
3%2%
133 Projects
Source: GTM Research
Figure 2-8. Non-wires Alternatives Capacity by TechnologySource: Adapted from Jeff St. John, “A Snapshot of the US Gigawatt-Scale Non-Wires Alternatives Market,” Greentech Media, August 22, 2017, link.
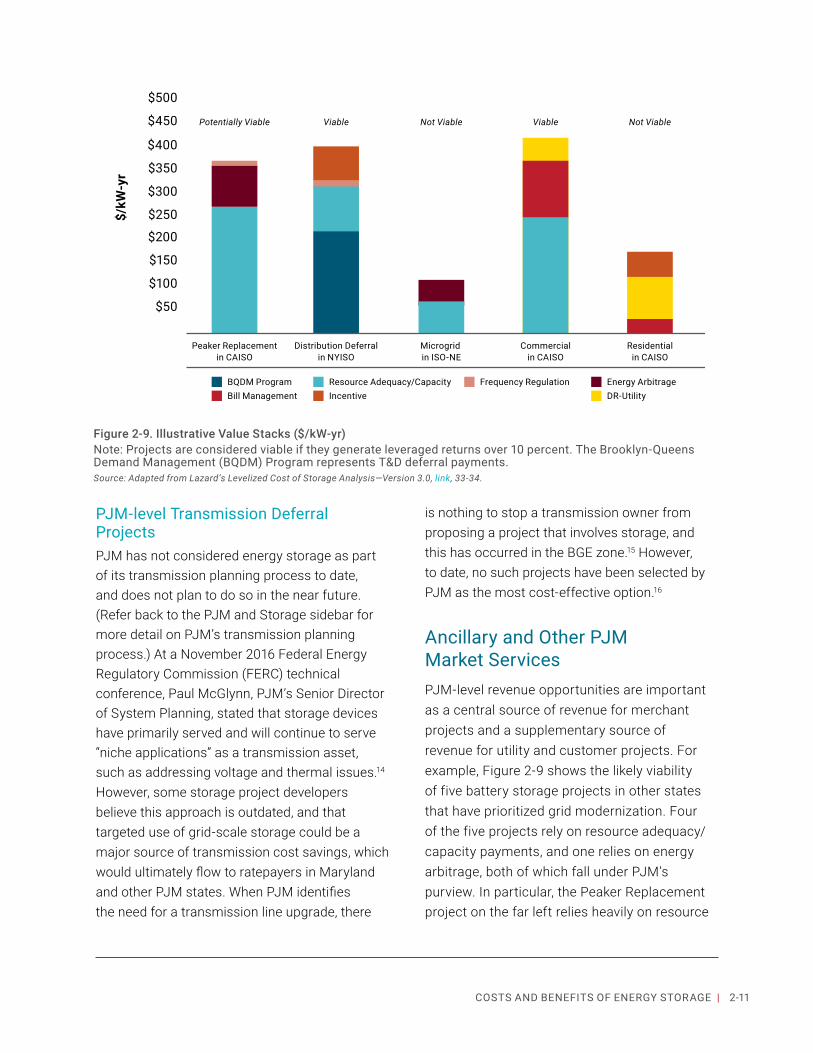
2-11COSTS AND BENEFITS OF ENERGY STORAGE |
PJM-level Transmission Deferral ProjectsPJM has not considered energy storage as part of its transmission planning process to date, and does not plan to do so in the near future. (Refer back to the PJM and Storage sidebar for more detail on PJM’s transmission planning process.) At a November 2016 Federal Energy Regulatory Commission (FERC) technical conference, Paul McGlynn, PJM’s Senior Director of System Planning, stated that storage devices have primarily served and will continue to serve “niche applications” as a transmission asset, such as addressing voltage and thermal issues.14 However, some storage project developers believe this approach is outdated, and that targeted use of grid-scale storage could be a major source of transmission cost savings, which would ultimately flow to ratepayers in Maryland and other PJM states. When PJM identifies the need for a transmission line upgrade, there
is nothing to stop a transmission owner from proposing a project that involves storage, and this has occurred in the BGE zone.15 However, to date, no such projects have been selected by PJM as the most cost-effective option.16
Ancillary and Other PJM Market ServicesPJM-level revenue opportunities are important as a central source of revenue for merchant projects and a supplementary source of revenue for utility and customer projects. For example, Figure 2-9 shows the likely viability of five battery storage projects in other states that have prioritized grid modernization. Four of the five projects rely on resource adequacy/capacity payments, and one relies on energy arbitrage, both of which fall under PJM’s purview. In particular, the Peaker Replacement project on the far left relies heavily on resource
$50
Peaker Replacementin CAISO
BQDM Program
Potentially Viable
$100
$150
$200
$250
$300
$350
$400
$450
$500
Distribution Deferralin NYISO
Viable
Microgrid in ISO-NE
Not Viable
Commercialin CAISO
Viable
Residentialin CAISO
Not Viable
Bill Management IncentiveResource Adequacy/Capacity Frequency Regulation
DR-UtilityEnergy Arbitrage
$/kW
-yr
Figure 2-9. Illustrative Value Stacks ($/kW-yr)Note: Projects are considered viable if they generate leveraged returns over 10 percent. The Brooklyn-Queens Demand Management (BQDM) Program represents T&D deferral payments.Source: Adapted from Lazard’s Levelized Cost of Storage Analysis—Version 3.0, link, 33-34.

2-12 | ENERGY STORAGE IN MARYLAND
adequacy/capacity payments. Note that the two “not viable” use cases, residential storage and a microgrid, provide reliability benefits that were assigned no dollar value in this exercise.
Current opportunities for storage to generate revenue in PJM’s markets are modest, though market conditions have changed dramatically over the past few years and could well change again in the near future. Figure 2-10 shows a snapshot of revenue streams commonly available to storage from PJM and other ISOs/RTOs. In PJM, frequency regulation was an accessible and attractive market for storage projects for about eight years. However, the market is small, and new rules enacted in January 2017 have made it less lucrative for fast-responding resources, including flywheels and batteries.iv Energy arbitrage and spinning reserve revenue streams in PJM are relatively low, reflecting ample or excess supply and low price volatility. PJM’s capacity market is absent from this figure (see “PJM and Storage” sidebar earlier in this chapter for further details). In comparison, in the most recent RPM auction,
iv PJM purchases ~700 MW per hour of frequency response, while average hourly load in PJM in 2016 was ~86,000 MW.
clearing prices for capacity in the PJM regions to which Maryland belongs were between $27 and $69/kW-yr. In past years, capacity prices have been significantly higher.
Reliability/ResiliencyPerhaps the most prized, non-monetized (or rarely monetized) benefit of energy storage is providing backup power when outages occur due to severe weather or other causes. The electricity industry typically relies on Value of Lost Load (VOLL) analyses to quantify the impact of grid outages on different customers. For some residential customers, losing power may be more of an inconvenience, involving lost food and medicine, than a source of major economic losses. However, for C&I customers, VOLL can be as much as $20,000/MWh. For data centers and server farms, lost power can cost more than $9,000/minute.17 Maryland also has state and federal government entities and high-technology businesses that need reliable power flows and could be potential hosts for, or sponsors of, microgrid projects equipped with storage. Although the cost of creating a microgrid or
PJM
$0 $20 $40 $60 $80 $100 $120 $140 $160
NYISO
MISO
ISO-NE
ERCOT
CAISO
Spinning Reserve
Energy Arbitrage
Demand Response
Frequency Regulation
$/kW
-yr
Figure 2-10. RTO/ISO Wholesale Revenue Streams (2016) ($/kW-yr)Source: Adapted from Lazard’s Levelized Cost of Storage Analysis—Version 3.0, link.

2-13COSTS AND BENEFITS OF ENERGY STORAGE |
equipping a standalone storage system to island from the grid can be high, it may be worthwhile where reliability of electric service is paramount.
Renewables IntegrationAs described in Chapter 1, energy storage is one of many resources that can be useful in integrating renewable power on different time
scales, ranging from smoothing real-time fluctuations in renewable energy generation to storing such generation until it is more valuable to the grid. The need/opportunity for such services in Maryland is limited today, and may continue to be modest for some time.
At the PJM level, variable wind and solar generation is not yet a significant portion of the generation mix. In 2017, renewable energy (including hydro) made up just 4.8 percent of PJM’s generation.18 Should all state RPS policies within PJM remain unchanged, PJM would receive 14.8 percent of its generation from renewable and alternative energy resources in 2028.19 In 2012, a report prepared by GE Energy found that with transmission expansion and additional regulation reserves, PJM could incorporate up to 30 percent of its energy from wind and solar without significant reliability issues.20
Exelon representatives report that they have identified a handful of distribution lines in Maryland where reverse power flows from BTM PV systems are an issue. This occurs when generation exceeds load on a circuit and must be exported, but the grid cannot handle such exports.
Sterling Co-op: Bill Management and Resiliency
In 2016, the Municipal Light Department of Sterling, Massachusetts took advantage of a $1.5 million state resiliency grant to purchase a 2 MW/3.9 MWh lithium-ion battery that paired with a pre-existing 3.4-MW PV system. The solar+storage system will provide 12 days of backup power for Sterling’s police headquarters and reduce charges based on Sterling’s monthly and annual peak demand. Sterling anticipates a roughly 7-year payback period, not counting grants.
Source: Jeff St. John, “The 2017 Grid Edge Awards: Projects Defining the Future Integrated, Interactive Electric Grid,” Greentech Media, April 7, 2017, link.
PO
WER
(MW
)
Reverse Flow Problem
0
30
20
10 PO
WER
(MW
)
0
30
20
10
Energy Storage Solution to Reverse Flow
12:0
0 AM
2:00
AM
4:00
AM
6:00
AM
8:00
AM
10:0
0 AM
12:0
0 PM
2:00
PM
4:00
PM
6:00
PM
8:00
PM
10:0
0 PM
12:0
0 AM
2:00
AM
4:00
AM
6:00
AM
8:00
AM
4:00
PM
6:00
PM
8:00
PM
10:0
0 PM
Demand Solar Surplus Solar Energy Storage Charge/Discharge
Storage Charging
StorageDischarging
10:0
0 AM
12:0
0 PM
2:00
PM
Figure 2-11. Using Energy Storage to Mitigate Reverse Power FlowsSource: Adapted from Massachusetts Department of Energy Resources, State of Charge – Massachusetts Energy Storage Initiative, September 2016, link.

2-14 | ENERGY STORAGE IN MARYLAND
A battery could be used at the corresponding substations to alleviate these issues, as shown in Figure 2-11. However, Maryland currently puts the onus on customers to pay for any upgrades made necessary by the addition of their DER installation. Changing this principle could be viewed as socializing the cost of integrating customer DER systems. On the other hand, projects that are catalyzed by the addition of a DER can go far beyond “DER mitigation” by providing other services, such as peak demand reduction (which benefits all ratepayers) or temporary support to a nearby microgrid.
System-wide BenefitsUsing storage can also provide system-wide benefits that could save ratepayers money, but are not generally compensated, and thus would not benefit storage project owners. These savings include reduced startup and shutdown of traditional generators, reduced emissions, and reduced exposure to fuel price volatility. Estimates of these avoided costs are shown in Table 2-2.
It should be noted that every resource that PJM utilizes contributes to the overall efficiency of the system. Ideally, these non-monetized benefits represent a small portion of a resource’s value stack. Yet, in Massachusetts’ recent cost-benefit analysis, non-monetized system benefits outweighed monetized benefits by a roughly 2:1 ratio, as illustrated in Figure 2-12.
Due to this inversion of an idealized value stack (recall Figure 2-1), Massachusetts concluded:
The biggest challenge to achieving more storage deployment in Massachusetts is the lack of clear market mechanisms to transfer some portion of the system benefits (e.g. cost
savings to ratepayers) created to the storage developer.21
It is critically important to note that the degree of system benefits (or public benefits) available from storage depends on a host of factors, including timing; prior investments (in storage and other electric power infrastructure); market prices for energy, capacity, and ancillary services; and the composition of the industry in the state (which affects the value of resiliency). These factors point to the relevance of cost-benefit modeling, when considering storage policies.
2.3. Trade-offs Among BenefitsThere are two important ways that the benefits of storage can come into conflict, discussed below.
Emissions vs. Cost SavingsCharging storage systems at the least expensive times of the day may actually increase greenhouse gas (GHG) emissions, depending on the fuel mix of the underlying grid. For example, in the Midcontinent Independent System Operator (MISO), coal is the predominant fuel source at night, when demand is lowest. Charging energy storage at this time increases coal generation, even if wind projects are also generating power. When this energy is discharged during times of peak demand, it displaces cleaner natural gas generation.22 California is also grappling with this challenge. A 2016 review of the state’s Self-Generation Incentive Program (SGIP) for BTM storage concluded that SGIP systems, on average, are helping to reduce system peak demand but increasing GHG emissions.23
To gain a high-level sense of how PJM’s fuel mix varies with wholesale market prices, PPRP analyzed which types of fuels were on the

2-15COSTS AND BENEFITS OF ENERGY STORAGE |
Total Storage Cost= $967M - $1.35B
Sales
ReducedPeak
T&D CostReduction
IncreasedRenewableIntegration
Energy CostReduction
Maintenance
Cost Range
Cost
Wholesale Market Cost Reduction
Ancillary Services Cost Reduction
Capital Costs + Maintenance
$3,500
$3,000
$2,500
$2,000
$1,500
$1,000
$500
$0
Benefits + Market Sales
$3,500m
$3,000
$2,500
$2,000
$1,500
$1,000
$500
$0
Benefits to Mass.Ratepayers from
System Cost Savings= $2.3B
Revenues to Storage Resource
= $1.1B
Mill
ions
of D
olla
rs
Mill
ions
of D
olla
rs
Figure 2-12. Comparison of Monetized and Non-Monetized Benefits of Energy Storage to MassachusettsNote: Nearly half the system benefits that Massachusetts identified are labeled “Reduced Peak” in this figure. This represents cost savings due to energy storage providing peaking capacity, which defers capital investments in traditional peaker plants and reduces costs in the capacity market. These savings are specific to the rules and needs of the ISO-NE system, which differ from PJM. Source: Adapted from Massachusetts Department of Energy Resources, State of Charge – Massachusetts Energy Storage Initiative, September 2016, link, xiii.
Table 2-2. Estimates of Non-monetized Energy Storage System Benefits in Addition to Capacity ValueSource: Adapted from Energy Storage Association, Including Advanced Energy Storage in Integrated Resource Planning: Cost Inputs and Modeling Approaches, November 2016, link, 4.
BENEFIT ILLUSTRATIVE VALUE
Avoided Capacity and Energy Values
Avoided generator startup/shutdown $20.10-$46.70/kW-yr, 10% system reduction
Avoided generator fuel and O&M costs $11.90-$61.00/kW-yr, 0.5% system reduction
Reduced reserve requirements 30% regulating reserve reduction
Other System Values
Reduced wholesale prices $0.19-$0.29/MWh
Fuel hedging value $21/kW-yr for doubling of gas prices
Environmental Values
Avoided NOx 60-70 g/MWh
Avoided CO2 600 MTCO2e/MW, 0.1-0.3 MCTO2e/MWh

2-16 | ENERGY STORAGE IN MARYLAND
Storage-specific Grid ModelsBecause storage is able to provide benefits over divers time-scales (from milliseconds to multiple years) and contexts (from BTM to wholesale markets), quantifying all of its potential benefits is a challenge. To date, most of the literature on storage evaluation challenges has focused on integrated resource plans, which are not directly applicable to Maryland. Early in the research phase of this report, the PC 44 and PPRAC Storage Work Groups jointly received a webinar presentation from the Electric Power Research Group (EPRI) about the storage valuation tools it has developed, among other resources. The EPRI presenter stressed the importance of integrating such methodologies with the evaluation tools that utilities rely upon already.
Numerous other organizations, both public and private, have developed storage-specific modeling tools. Figure 2-13 shows a sampling of these tools
and the benefits that each is designed to capture. Two of these models, NREL’s REopt and Alevo’s Advanced Storage Optimization Tool (ASOT), simulate wholesale market operations using a built-in production cost model. The other models use historical market prices or independently simulated prices, and thus are referred to as “price-taker” models. Such models cannot evaluate how storage operations might affect wholesale market prices or power system costs, and therefore often only simulate the impact of an incremental amount of storage. Storage-specific models also typically assume that independently scheduled storage acts with perfect foresight of market prices; that assumption tends to result in an overstatement of revenue potential. Depending on the context in which storage is being considered (e.g., creating a storage target, distribution system planning, or designing new retail electricity rates), different grid services/benefits will be of relevance.
Figure 2-13. Selected Energy Storage-specific Modeling ToolsNote: Terms used in this table are defined in the report glossary. EPRI has a newer tool, Storage Valuation Estimation Tool (StorageVET) that is not shown here. Alevo has filed for Chapter 7 bankruptcy. Randell Johnson, Alevo Analytics’ former Chief Analyst, has formed a new analytics company called Acelerex. Source: Adapted from IREC, “Charging Ahead: An Energy Storage Guide for Policymakers,” April 2017, link, 14.
GRID SERVICES/BENEFITS
TOOL
Ener
gy T
ime-
Shif
t (A
rbitr
age)
Reso
urce
Ade
quac
y/Su
pply
Cap
acit
y
Load
Fol
low
ing
Freq
uenc
y Re
gula
tion
Elec
tric
Sup
ply
Rese
rve
Cap
acit
y
Volta
ge R
egul
atio
n
Tran
smis
sion
Upg
rade
Def
erra
l
Dis
trib
utio
n U
pgra
de D
efer
ral
Tran
smis
sion
Sup
port
Tran
smis
sion
Con
gest
ion
Relie
f
Subs
tatio
n O
n-si
te P
ower
TOU
Ener
gy C
ost M
anag
emen
t
Dem
and
Cha
rge
Man
agem
ent
Relia
bilit
y (B
acku
p Po
wer
)
Pow
er Q
ualit
y
Rene
wab
le E
nerg
y Ti
me
Shif
t
Rene
wab
les
Cap
acit
y Fi
rmin
g
Blac
k St
art
Win
d G
rid In
tegr
atio
n
Gre
enho
use
Gas
Impa
cts
EPRI ESVT ✔ ✔ ✔ ✔ ✔
ES-SelectTM ✔ ✔ ✔ ✔ ✔ ✔ ✔ ✔ ✔ ✔ ✔ ✔ ✔ ✔ ✔ ✔
NREL REopt ✔ ✔ ✔ ✔ ✔ ✔ ✔
PNNL ESS Tool ✔ ✔ ✔ ✔
Navigant ESCT ✔ ✔ ✔ ✔ ✔ ✔ ✔ ✔ ✔ ✔ ✔ ✔ ✔ ✔ ✔ ✔ ✔ ✔ ✔
Alevo ASOT ✔ ✔ ✔ ✔ ✔ ✔ ✔ ✔

2-17COSTS AND BENEFITS OF ENERGY STORAGE |
margin (meaning generators relying on these fuels would be tapped to ramp up production if demand increased) throughout PJM during on-peak and off-peak hours in 2017. PPRP also looked at which fuels were on the margin, PJM-wide, during the top 10 percent most expensive and bottom 10 percent least expensive hours in the BGE zone during July 2017. Results for the main fuel types in play are shown below in Table 2 3. There was very little difference between on-peak and off-peak hours overall, but a modest difference between the most/least expensive hours. This “back of the napkin” analysis suggests that charging during the least expensive hours and discharging during the most expensive hours could increase coal (and wind) use and decrease natural gas (and light oil) use, but to a lesser extent than in MISO, for example. This question could be pursued in greater depth in consultation with PJM.v
Customer Choice vs. Grid BenefitsUtility representatives point out that storage systems can add (rather than alleviate) stress to the distribution system if they are charged and discharged by customers solely for their personal benefit. Many of these issues could potentially be avoided with rate designs (such as TOU rates) that align customer and grid benefits. Also, it is
v A PJM report with similar analysis can be found at: https://www.pjm.com/-/media/library/reports-notices/special-reports/20180315-2017-emissions-report.ashx?la=en.
worth noting that the more storage capacity a customer reserves for backup power, the less support it can provide the grid during normal conditions.
2.4. The Need for Storage: Comparing Maryland with Selected Other States
It can be informative to compare relevant statistics from Maryland with the corresponding statistics from other states that have concluded that they either do (e.g., Massachusetts and New York) or do not (e.g., Vermont) see major near-term opportunities for storage. Here are some initial observations based on Table 2-4, which follows these points:
• Meeting peak demand is less costly in Maryland than in Massachusetts. Yet, there is a gap between on- and off-peak wholesale energy costs that storage could help mitigate.
• Roughly 4 percent of PJM’s generation fleet is slated to retire by 2020. Unlike New York City, there is no acute need for locally sited generation in Maryland to replace this capacity.
COAL NATURAL GAS
LIGHT OIL WIND
On-peak vs. Off-peak
Average for Year – On-peak 34.6% 51.8% 5.2% 4.6%
Average for Year – Off-peak 36.5% 51.8% 3.4% 5.0%
Top 10% vs. Bottom 10% LMPs in BGE Zone
Average for July – Top 10% most expensive hours 22.9% 45.0% 16.6% 6.7%
Average for July – Bottom 10% most expensive hours 30.7% 56.6% 0.0% 10.5%
Table 2-3. Comparison of Fuel on the Margin in PJM During On-peak and Off-peak Hours (2017)

2-18 | ENERGY STORAGE IN MARYLAND
APPLICATION STATE STATISTIC MARYLAND EQUIVALENT STATISTIC
Peak Shaving/Infrastructure Deferral
MA
The 1% costliest hours accounted for 8% of wholesale energy costs Top 10% costliest hours account for 40% of wholesale energy costs1
Top 1% costliest hours accounted for 4% of wholesale energy costs for APS, 5% BGE, 6% DPL, 4% Pepco Top 10% costliest hours accounted for 23% for APS, 25% BGE, 28% DPL, 21% Pepco[a]
MA VT
Peak demand growing 1.5% per year (MA)2 and 0.3% per year (VT)3
Summer peak demand forecasted to grow at 0.3% CAGR (net of DSM)4
NYSome of the highest electricity costs/demand charges in the country5
Maryland has relatively high electricity costs, but only Western MD has relatively high demand charges6
Peaker Replacement
MA
ISO-NE planned shutdown of 4,200 MW by 2019, another 6,000 MW at risk of shutdown by 2020, including plants that serve population centers in Eastern MA7
6,936 MW in PJM are planned to retire by 2020, representing 3% of generation capacity. Of this total, 534 MW are in MD. PJM has 10 GW of excess capacity today and 99,450 MW in the queue for construction by 2024. Natural gas represents over half the MW in the PJM queue.8NY
NYC pays over $268 million annually in capacity payments to support old peaker plants. By 2022, 2,860 MW will be past their retirement age in Zone J (NYC), representing 30% of NYC’s fleet9
NY
Transmission system in NYC metro area is highly constrained, requiring that enough local generation is online to serve 80% of NYC’s 11,600-MW forecasted peak10
The transmission system in MD is not highly constrained. For example, the number of hours with transmission constraints in BGE dropped from 11,400 in 2016 to 2,200 to 2017.11
Renewables Integration/Infrastructure Deferral
NYMeeting New York’s RPS will require 25,000 MW of mostly in-state wind and solar12
Maryland is part of one of the world’s largest grid operators, PJM, and because of that, variability of wind and solar is easier to manage both due to PJM’s large amount of generation and load, and the large geographic area of PJM. Maryland is in near full compliance with the state’s solar carve-out; meaning it will only require an additional 108 MW of in-state solar.13 Projects awaiting CPCN licensing will likely exceed this requirement.
MA45,000 distributed PV projects in MA today; 400 installs per week14
460,000 kW of distributed PV in MD today, with an average of 4,300 kW installed per week in 2016.15 Solar tariffs may slow further growth.
Resiliency
MA VT
Risk of major outages from severe weather16 Same as left
MA
ISO-NE also heavily dependent on natural gas, and reliability could be threatened in the event of cold weather or a fuel shortage17
The natural gas delivery system in MD is not constrained at this time
Table 2-4. Comparison of Relevant Statistics in Recent Energy Storage StudiesAPS = Allegany Power.[a] Based on PJM electricity prices and usage data. For each hour in 2016, PPRP multiplied the appropriate zone’s day-ahead, hourly locational marginal price (LMP) by
real-time load to calculate an hourly cost of electricity. PPRP summed hourly costs for both the 1 percent and 10 percent of hours with the highest costs, and divided this by the sum of all hourly costs for the year. PPRP repeated this process for 2017 and averaged the results.
Tabl
e 2-
4 en
dnot
es a
re p
rovi
ded
on p
. 2-2
2. T
hey
are
sepa
rate
from
the
rest
of t
he c
hapt
er’s
end
note
s.

2-19COSTS AND BENEFITS OF ENERGY STORAGE |
• Meeting New York’s 50 percent by 2030 RPS goal will require an estimated 25 GW of renewable energy resources. New York’s strict energy delivery requirements mean that most of these resources will be sited in-state. Maryland’s RPS allows eligible resources to be located in PJM, or outside of PJM if transmitted into PJM. As a result, nearly 99 percent of the wind resources used to meet Maryland’s RPS are located in other states.
• As in numerous other states, distributed PV has been growing rapidly in Maryland. This is not a major concern today, but further growth could result in additional local areas where backflows on the distribution grid could be alleviated with storage.
2.5. ConclusionMaryland has much to gain from energy storage in the long term, assuming the costs of storage continue to decline. Using storage for peak shaving, infrastructure deferral, and resiliency projects could be major sources of cost savings for ratepayers in the state. However, a combination of regulatory, operational, and market barriers currently prevents storage from being deployed in an optimal fashion. Options for addressing these barriers are discussed in detail in Chapter 5.
2.6. Key Takeaways1. Receiving compensation from multiple value
streams is key to energy storage economics. The cost of storage only has meaning relative to the expected services it will provide.
2. Cost declines are opening market applications for “advanced energy storage technologies.” Lithium-ion batteries are
experiencing especially dramatic price declines.
3. Thermal storage technologies (when used for thermal applications) are more efficient than electrical storage technologies.
4. Pairing storage with renewable energy generation has some cost advantages relative to stand-alone systems.
5. It is important to consider whether Maryland/PJM has near-term needs for the services that storage can provide, and how easily storage could meet these needs.
6. Peak-shaving could be a source of major cost savings in the long term, though it is not easy to achieve these savings. IOUs, munis, or coops acting on behalf of their customers must anticipate when price-setting peaks are going to occur each summer. Customers that minimize their own peak demand may not greatly benefit the grid, and may shift transmission upkeep costs to other Maryland customers.
7. Utility representatives have cautioned that there may only be a few cost-effective places for storage to provide distribution deferral services in Maryland today.
8. Current opportunities for storage to generate revenue in PJM’s markets (e.g., by serving as a peaker replacement) are modest. This may change once PJM complies with FERC Order 841, which is intended to provide storage with better access to wholesale energy and capacity markets throughout the country.
9. Variable wind and solar generation is a small percentage of the generation mix in

2-20 | ENERGY STORAGE IN MARYLAND
Maryland. Utility representatives report that there are a few distribution lines in the state that have significant reverse power flow issues today.
10. Resiliency is a prized, yet non-monetized, benefit. In addition to communities with critical facilities, Maryland has state and federal government entities that need reliable power flows and could be potential hosts for, or sponsors of, microgrid projects.
11. Storage can provide system-wide benefits that would save ratepayers money, but are not compensated under current PJM market designs. This market shortcoming is a primary rationale for state-level
storage programs and incentives. Careful consideration of the magnitude of these benefits for Maryland customers would be needed before concluding that state-level programs or incentives are cost-effective.
12. There are potential trade-offs between storage benefits. Using storage to cut costs may increase emissions. Using storage to maximize customer benefits may add stress to the grid.

2-21COSTS AND BENEFITS OF ENERGY STORAGE |
Endnotes1 Lazard’s Levelized Cost of Storage Analysis—Version 3.0, November 2017, https://www.lazard.com/media/450338/lazard-levelized-cost-of-
storage-version-30.pdf, 17.
2 The Brattle Group, The Hidden Battery – Opportunities in Electric Water Heating, January 2016, http://files.brattle.com/files/7167_the_hidden_battery_-_opportunities_in_electric_water_heating.pdf, i.
3 Bloomberg New Energy Finance, “Emerging Storage Technologies 2017: 14 companies looking beyond lithium ion,” August 16, 2017, 1.
4 Massachusetts Department of Energy Resources (DOER), State of Charge – Massachusetts Energy Storage Initiative, September 2016, http://www.mass.gov/eea/docs/doer/state-of-charge-report.pdf, xvi.
5 Ibid, vii.
6 Maryland Public Service Commission (PSC), Ten-Year Plan (2016-2025) of Electric Companies in Maryland, November 2016, http://dlslibrary.state.md.us/publications/Exec/PSC/PU7-201(a)_2016-2025.pdf, 46.
7 PJM Interconnection (PJM), “Questions on 5CPs and Peak Shaving,” May 6, 2015, http://www.pjm.com/~/media/committees-groups/task-forces/scrstf/20160506/20160506-item-01b-faqs-for-5cps-and-peak-shaving.ashx.
8 PJM, “Opportunities to recognize and value summer-only Demand Response resources,” 2017, http://www.pjm.com/-/media/committees-groups/task-forces/sodrstf/postings/sodrstf-problem-statement.ashx?la=en.
9 State of Vermont Department of Public Service (DPS), Act 53 Report: A Report to the Vermont General Assembly on the Issue of Deploying Storage on the Vermont Electric Transmission and Distribution System, November 15, 2017, https://legislature.vermont.gov/assets/Legislative-Reports/Storage-Report-Final.pdf, 13.
10 VT DPS, Act 53 Report, 14-15.
11 National Renewable Energy Laboratory (NREL), “Identifying Potential Markets for Behind-the-Meter Battery Energy Storage: A Survey of U.S. Demand Charges,” August 2017, accessed March 30, 2018.
12 Lazard’s 3.0, 30.
13 Greentech Media, “A Snapshot of the US Gigawatt-Scale Non-Wires Alternatives Market,” August 22, 2017, https://www.greentechmedia.com/articles/read/gtm-research-non-wires-alternatives-market#gs.5uGmlpA.
14 Amanda Durish Cook, “RTOs See Storage as ‘Niche’ Player in Transmission,” RTO Insider, November 13, 2016, https://www.rtoinsider.com/rtos-energy-storage-34121.
15 ITC Mid-Atlantic Development LLC, 17RTEP1-210 Proposal, February 27, 2017, https://www.pjm.com/-/media/planning/rtep-dev/expan-plan-process/ferc-order-1000/rtep-proposal-windows/2016-2017-1-20h-itc-public-peach-bottom-old-post-230kv-plus-battery.ashx?la=en, 4.
16 Conversation with Scott Baker, Business Solutions Analyst for PJM, August 15, 2018.
17 Energy Storage Association, 35x25: A Vision for Energy Storage, November 2017, http://energystorage.org/vision2025, 4.
18 Monitoring Analytics, PJM State of the Market 2017, “Environmental and Renewable Energy Regulations,” http://www.monitoringanalytics.com/reports/PJM_state_of_the_Market/2017/2017-som-pjm-sec8.pdf, 354.
19 Ibid.
20 PJM, “Renewable Integration Study Reports,” http://www.pjm.com/committees-and-groups/subcommittees/irs/pris.aspx.
21 MA DOER, State of Charge, xiii.
22 Jason Deign, “Battery Storage Could Boost Coal Consumption,” Greentech Media, February 26, 2018, https://www.greentechmedia.com/articles/read/batteries-could-boost-coal-consumption#gs.pabK4hU.
23 Jason Deign, “Battery Storage Could Boost Coal Consumption,” Greentech Media, February 26, 2018, https://www.greentechmedia.com/articles/read/batteries-could-boost-coal-consumption#gs.pabK4hU.

2-22 | ENERGY STORAGE IN MARYLAND
Table 2-4 Endnotes1 MA DOER, State of Charge, i, ii.
2 Ibid, vii.
3 VT DPS, Act 53 Report, 9.
4 MD PSC, Ten-Year Plan, 43.
5 NYBEST, Energy Storage Roadmap for New York’s Electric Grid, January 2016, https://www.ny-best.org/sites/default/files/type-page/39090/attachments/NY-BEST%20Roadmap_2016_finalspreads.c.pdf, 2; and NREL, “Identifying Potential Markets,” accessed March 30, 2018, 3.
6 NREL, “Identifying Potential Markets,” accessed March 30, 2018.
7 MA DOER, State of Charge, vii.
8 Monitoring Analytics, PJM State of the Market 2017, http://www.monitoringanalytics.com/reports/PJM_State_of_the_Market/2017/2017-som-pjm-sec12.pdf, 3, 540-546.
9 Official Nebraska Government Website, “Annual Average Electricity Price Comparison by state,” http://www.neo.ne.gov/statshtml/204.htm, accessed March 30, 2018.
10 Ibid.
11 Monitoring Analytics, PJM State of the Market 2017, http://www.monitoringanalytics.com/reports/PJM_State_of_the_Market/2017/2017-som-pjm-sec3.pdf, 133.
12 NYBEST, Energy Storage Roadmap, 36.
13 DRAFT Maryland RPS Inventory. Results subject to change.
14 MA DOER, State of Charge, ix.
15 MD PSC, Report on the Status of Net Energy Metering in the State of Maryland, August 2017, http://www.psc.state.md.us/wp-content/uploads/Final-2016-Net-Metering-Report.pdf, 3.
16 MA DOER, State of Charge, ix; VT DPS, Act 53 Report, 27.
17 MA DOER, State of Charge, 130.

3-1STATUS OF ENERGY STORAGE IN MARYLAND |
3.1. Deployments in MarylandAs of early 2018, energy storage is just beginning to be deployed in Maryland, as shown in Figure 3-1, which ranks U.S. states by volume of storage deployed/planned. Maryland’s relatively high standing, 18th in the country, is somewhat misleading. Of the current 10.54 MW of storage in Maryland registered with the U.S. Department of Energy (DOE), 10 MW belong to a single project, described below, that solely serves PJM’s ancillary services markets.
Still, a handful of storage projects in Maryland demonstrate its potential applications. These projects also identify some of the key storage technologies currently being considered in the
state, as well as the range of grid participants evaluating storage.
Fluence Energy: Grid-scale Batteries and Ancillary ServicesMaryland’s largest energy storage system is a 10 MW, grid-scale, lithium-ion battery deployment owned by Fluence Energy (formerly known as AES Energy Storage Solutions). The project is located at the Warrior Run Installation in Cumberland, Maryland, and is co-located with the 205-MW, coal-fired Warrior Run Plant. Fluence’s batteries utilize a unique “modular” design, meaning they can be separated into multiple configurations. Potential configuration capacity ratings and duration range from 100 kW to over one MW and from 15 minutes to four hours,
3. STATUS OF ENERGY STORAGE IN MARYLAND
CaliforniaTexas
ArizonaNevadaIllinois
AlabamaPennsylvania
New YorkWest Virginia
HawaiiAlaska
OhioFlorida
Puerto RicoIndiana
MaineNorth Carolina
MarylandWashington
ArizonaDelawareColorado
100 200 300 400 500 600 700 800 900 1000 1100 1200
Operational
Under Construction/Repair
Planned
MW
Figure 3-1. States with the Greatest Energy Storage DeploymentNote: Does not include pumped hydro. Source: Adapted from U.S. Department of Energy’s Global Energy Storage Database, accessed February 6, 2018, link.

3-2 | ENERGY STORAGE IN MARYLAND
respectively. The project was first commissioned in November 2015 and is interconnected at a transmission level. The batteries are used for frequency regulation and as spinning reserve in PJM’s ancillary services market.
Baltimore District Energy: Ice/Chilled Water Storage and Bill ManagementOver 50 customers in Baltimore’s downtown corridor (including critical care facilities, commercial properties, municipal buildings, and the Baltimore Convention Center) rely on a central thermal ice system and four interconnected chilled water plants to stay cool. Ice produced at night, when electricity costs are lowest, is then used to provide reliable, low-cost cooling throughout the day, while taking pressure
off the electric grid. The shared system relies on ten miles of pipeline, 75,000 ton-hours of ice storage capacity, and 48 million ton-hours of low-temperature water to service 12 million square feet of space in downtown Baltimore.1
Chesapeake College: Solar+Storage for Resiliency and Ancillary ServicesChesapeake College, located on Maryland’s Eastern Shore, in conjunction with solar developer SolarCity, battery developer A.F. Mensah, Inc. and Pepco Holdings, Inc. (PHI), is constructing a pilot microgrid project that uses solar+storage to provide multiple grid and customer services. The project consists of an existing 2.18-MW solar system, in service since May 2016, and a new, 1-MW, 750 kWh lithium-ion battery system. MEA provided a $250,000 grant to fund the battery portion of the project. The battery will operate both behind-the-meter (BTM) and in front-of-the-meter (FOM). During an outage, the battery will act as a source of power into a microgrid. At other times, the battery will provide ancillary services intended to optimize the local distribution system, including reducing line losses, controlling voltage, reducing equipment operations, and more. The project, initially slated for completion in late 2017, will undergo testing over the next two years to assess functionality, controls, and benefits. The figure below indicates the location of the microgrid, as well as the constituent solar and battery systems, on a Chesapeake College map.
MTA: Supercapacitors and Bill ManagementThe Maryland Transit Administration (MTA) is planning regenerative braking systems for trains in the Baltimore Metro system, as inspired by the success of a similar storage project in Pennsylvania. Regenerative braking
Fluence’s 10-MW Warrior Run Energy Storage SystemSource: Sandia National Laboratories & Strategen Consulting, LLC, “Warrior Run 10 MW Advancion Energy Storage – AES,” accessed December 7, 2017, link.
Baltimore’s District Energy SystemSource: Veolia North America, “Keep Your Cool at the Baltimore Convention Center,” link (accessed June 2017, webpage now defunct).

3-3STATUS OF ENERGY STORAGE IN MARYLAND |
uses supercapacitors, which are fast charge and discharge storage systems, to convert the rapid bursts of waste heat caused by braking into stored energy. This energy, which can be stored for approximately 20 minutes, is later used to power departing trains. MTA is working with energy service provider Constellation New Energy to develop the project, and is planning to bundle the system with lighting upgrades. The
bundled project has an estimated capital cost of $5 million and payback of 7.8 years. The system will take less than a year to construct after the service contract is complete, likely in early 2018. The storage system will have a capacity rating of approximately 1 MW and is estimated to cut energy consumption by 426,000 kWh per month. MTA officials believe that the project, if successful, is replicable at other Metro stations in Maryland.
Konterra Realty: Solar+Storage for Renewables Integration and Ancillary ServicesKonterra Realty (Konterra), as part of its environmental stewardship goals, commissioned a grid-interactive storage system co-located with a solar canopy carport at its headquarters in Laurel, Maryland. The storage component has a capacity rating of 500 kW and an energy rating of 300 kWh, and is paired with an approximately
Solar
Microgrid
Battery
G
F
E
6
5
4 3
212
13
7
8
9
11
DC
B
A
1
Konterra Realty Energy Storage SystemSource: Sandia National Laboratories & Strategen Consulting, LLC, “Konterra Realty HQ ESS,” November 27, 2017, link.
Chesapeake College Campus Map with System Call-outsNote: The completed microgrid will serve building loads at the Caroline Center [2] and Learning Resource Center [12] during a service interruption. The battery is adjacent to these buildings and connected to the solar system grid tie-in, located on the western portion of the campus.Source: Adapted from: Chesapeake College, “Campus Map,” November 2017, link; and Pepco Holdings, Inc., “PC 44 – Comments of Pepco Holdings: Technical Considerations for Transforming the Electric Grid,” December 9, 2016.

3-4 | ENERGY STORAGE IN MARYLAND
400-kW solar array. The total project cost $2.5 million in capital expenditure and received a $250,000 “Game Changers” grant from the MEA. The total system produces over 500,000 kWh annually and supplies as much as 20 percent of Konterra’s energy needs. The project was commissioned in October 2013 and is used for renewables firming and frequency regulation.
Mosaic Power: Water Heaters as Community Storage for Affordable HousingMosaic Power (Mosaic), based in Frederick, Maryland, has created a network of 13,000 water heaters (representing roughly 13 MWh of thermal storage) on multi-family affordable housing properties located throughout PJM. Using small load controllers and disconnect boxes on the electric lines that serve each water-heater, Mosaic synchronizes electricity
Storage Oversight and Facilitation
Storage activity in Maryland is overseen and guided by a mix of state, regional, and federal entities.
• The Maryland General Assembly sets energy and environmental goals and/or requirements for the state and enacts supporting policies, such as incentives, and targets/mandates.
• The Maryland PSC oversees all activities by the state’s utilities, including any investments in storage. The PSC also codifies interconnection rules for BTM resources and is often tasked with writing regulations for new legislation, such as RPS requirements.
• MEA administers the state tax incentive for storage created by the General Assembly, provides the Governor’s perspective on proposed storage policies and regulations, and may be tasked with writing regulations for new legislation, such as the state tax incentives for storage.
• The Maryland Clean Energy Center (MCEC) promotes economic development through the adoption of clean energy and energy efficiency products, services, and technologies. MCEC is able to serve as a loan guarantor for small projects.
• The state’s utilities are responsible for the safe, reliable, and affordable delivery of electricity in their territories. They oversee the interconnection of BTM storage projects. They also invest directly in storage assets to support the distribution grid (and possibly provide additional services).
• PJM administers wholesale energy markets and high-voltage transmission facilities in all or part of 14 states, including Maryland. It oversees the interconnection of storage projects connected to the transmission grid, the dispatch of any storage project serving wholesale energy markets, and transmission planning.
• FERC oversees interstate energy commerce, including the wholesale energy markets and transmission facilities administered by PJM.

3-5STATUS OF ENERGY STORAGE IN MARYLAND |
demand from its network to meet the needs of the electric grid automatically, and in real-time. This allows Mosaic both to operate in PJM’s Frequency Regulation Market and to shift bulk demand from expensive on-peak hours to inexpensive off-peak hours without interrupting individual customers’ hot water consumption. Mosaic provides quarterly payments to water-heater owners. For affordable housing properties, these payments amounted to roughly $100/year per water-heater in 2016, when Mosaic received an Innovation award from the Maryland Affordable Housing Coalition.2
Fort Detrick: On-site Generation and Storage for Biodefense LabsA project to provide secure and reliable power to the National Interagency Biodefense Campus (NIBC) at Fort Detrick represents one of the first uses of the U.S. Army Corps of Engineers (USACE) Enhanced Use Leasing (EUL) program. The program enables public and private sector entities to lease land for the development of projects located on military installations. The NIBC project includes a central utility plant and a 2.5-million gallon, 27,000 ton-hour thermal energy storage tank, which have both been in service since 2008. With a price tag of $105 million, the project required Fort Detrick and USACE to explore diverse financing options. In the end, a public-private partnership was formed between USACE, Fort Detrick, Chevron Energy Solutions (Chevron), and Keenan Development Associates. The partnership issued a 25-year private revenue bond to finance the plant.3,4
3.2. Advanced Battery Technologies
With its large concentration of biomedical, defense, and aerospace industries, Maryland has a unique market for niche storage applications.
This includes extreme batteries, meaning advanced battery technologies intended for unconventional applications, including in outer space or for uses that require a very long useful life and high reliability, with cost less of a concern. Potentially, these applications could accelerate storage innovation down the cost curve, opening up more markets for storage. Below are summaries of two major Maryland entities at the leading edge of this field.
Energy Innovation Institute at the University of MarylandThe University of Maryland is home to the Maryland Energy Innovation Institute (MEI2), which helps incubate advanced storage technologies. MEI2 hosts the Center for Research in Extreme Batteries (CREB), which manufactures batteries suited for “extreme performance, environments, and properties,” and the Nanostructures for Electrical Energy Storage (NEES) research center, which conducts fundamental research studying battery characteristics. MEI2 receives major federal funding for advanced batteries R&D. In September 2017, for example, NEES was leading or partnering on grants totaling roughly $50 million from Advanced Research Projects Agency-Energy (ARPA-E) alone.
In 2017, MEI2 spun off two in-state battery storage companies. VersaVolt Electronics, LLC (VersaVolt) of Silver Spring, Maryland makes a flexible battery “cloth” about ¾ mm thick. The batteries convert seawater and oxygen into energy. VersaVolt’s products deliver slow, sustained power to small “smart” devices. Ion Storage Systems (Ion) has developed a high-performance, solid state battery that is smaller than a coin. The battery has a ceramic electrolyte that is completely nonflammable. Ion is focused on commercializing its product.

3-6 | ENERGY STORAGE IN MARYLAND
Saft Battery FactorySaft America, Inc. (Saft), a subsidiary of the gas and oil company Total, owns a high-tech battery manufacturing and research facility in Cockeysville, Maryland. The facility manufactures rechargeable lithium-ion batteries for satellites, weather balloons, rocket ships, military vehicles, fighter jets, and Formula One race cars, among others. About 275 employees work on site, including an R&D team that has collaborated with the Edison Electric Institute (EEI) on enhancing battery performance. Saft also currently manufactures lithium-ion batteries for grid applications in Jacksonville, Florida. That plant specializes in high-powered, fast-response systems that are especially useful for: weak, isolated grids such as Puerto Rico’s; municipal utilities and rural electric cooperatives that have just one point of interconnection to the surrounding grid; and microgrids.
3.3. Existing State Incentives and ActivitiesMaryland is the first state to enact an income tax credit for storage systems. This credit, and several other initiatives aimed at promoting storage in the state, are described briefly below.
Investment Tax CreditIn January 2018, Maryland’s new storage tax credit went into effect and is in place until the end of 2022. The credit is for up to $5,000 for residential applications and is limited to the lesser of $75,000 or 30 percent of the installed system costs for commercial customers. A statewide annual tax credit cap of $750,000 is also imposed. The tax credit is likely too small to serve as a significant catalyst for storage deployment. (For example, if all the funds were applied to commercial systems,
and each system were to claim its maximum credit, only ten projects would be funded.)5 The tax credit does, however, provide a modest boost to storage implementation, while at the same time protecting taxpayers from bearing significant costs.6,7 As of mid-March 2018, seven residential applications have been received for systems ranging in size from 5 kW to 15 kW. All the systems are paired with solar, and only one intends to engage in wholesale markets.
Maryland PSC Public Conference 44 on Grid ModernizationIn January 2017, the Maryland PSC launched a Public Conference (PC) to consider six grid modernization topics: rate design, electric vehicles, competitive markets and customer choice, interconnection process, storage, and (if time and funding permits) distribution system planning. With the exception of distribution system planning, each topic is being explored by a work group whose objective is to consider demonstrable actions, such as starting and assessing pilot programs (with defined scopes, timelines, and exit strategies) and drafting regulations as appropriate. The PC 44 Storage, Interconnection, and Rate Design work groups are addressing key barriers to storage identified by stakeholders consulted for this report. Their efforts are discussed in detail in the final section of this chapter, as context for the report’s options.
MDOT Renewable Energy RFP In June 2017, the Maryland Department of Transportation (MDOT) issued a 96-page request for proposals (RFP) for qualified contractors to design, construct, commission, finance, operate, and maintain renewable energy facilities at MDOT locations throughout the state. The RFP explicitly permitted offerors to propose storage
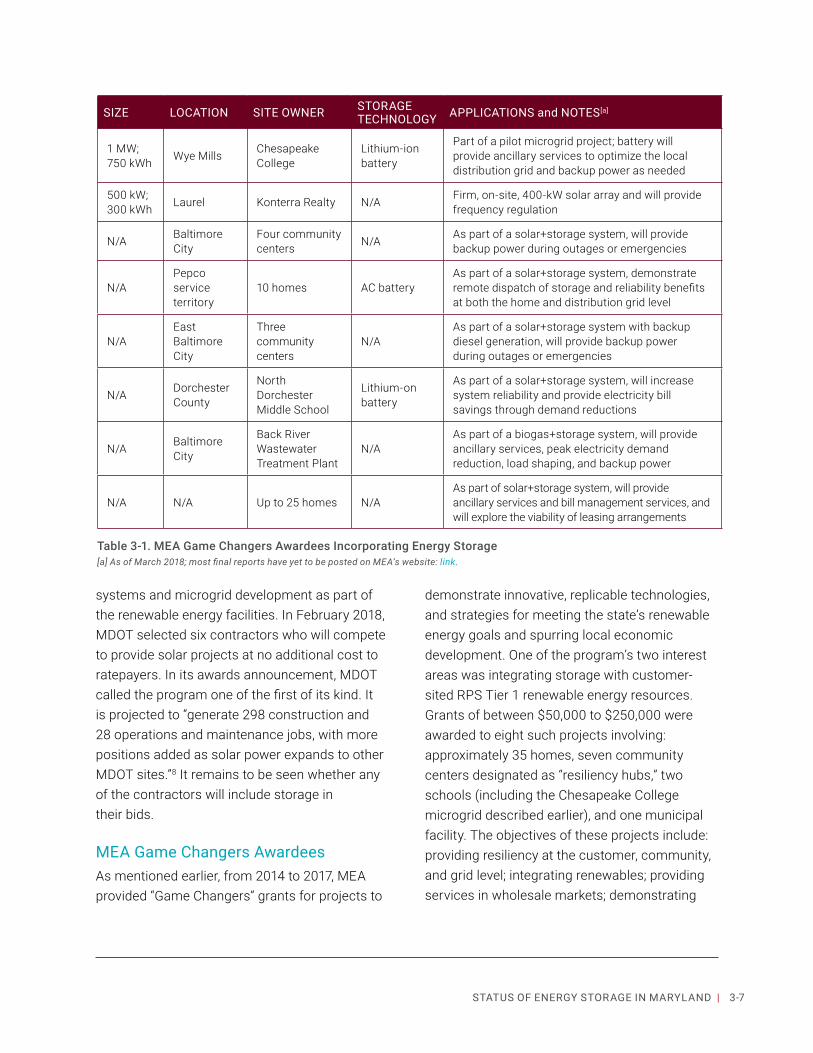
3-7STATUS OF ENERGY STORAGE IN MARYLAND |
systems and microgrid development as part of the renewable energy facilities. In February 2018, MDOT selected six contractors who will compete to provide solar projects at no additional cost to ratepayers. In its awards announcement, MDOT called the program one of the first of its kind. It is projected to “generate 298 construction and 28 operations and maintenance jobs, with more positions added as solar power expands to other MDOT sites.”8 It remains to be seen whether any of the contractors will include storage in their bids.
MEA Game Changers AwardeesAs mentioned earlier, from 2014 to 2017, MEA provided “Game Changers” grants for projects to
demonstrate innovative, replicable technologies, and strategies for meeting the state’s renewable energy goals and spurring local economic development. One of the program’s two interest areas was integrating storage with customer-sited RPS Tier 1 renewable energy resources. Grants of between $50,000 to $250,000 were awarded to eight such projects involving: approximately 35 homes, seven community centers designated as “resiliency hubs,” two schools (including the Chesapeake College microgrid described earlier), and one municipal facility. The objectives of these projects include: providing resiliency at the customer, community, and grid level; integrating renewables; providing services in wholesale markets; demonstrating
Table 3-1. MEA Game Changers Awardees Incorporating Energy Storage[a] As of March 2018; most final reports have yet to be posted on MEA’s website: link.
SIZE LOCATION SITE OWNER STORAGE TECHNOLOGY APPLICATIONS and NOTES[a]
1 MW; 750 kWh Wye Mills Chesapeake
CollegeLithium-ion battery
Part of a pilot microgrid project; battery will provide ancillary services to optimize the local distribution grid and backup power as needed
500 kW; 300 kWh Laurel Konterra Realty N/A Firm, on-site, 400-kW solar array and will provide
frequency regulation
N/A Baltimore City
Four community centers N/A As part of a solar+storage system, will provide
backup power during outages or emergencies
N/APepco service territory
10 homes AC batteryAs part of a solar+storage system, demonstrate remote dispatch of storage and reliability benefits at both the home and distribution grid level
N/AEast Baltimore City
Three community centers
N/AAs part of a solar+storage system with backup diesel generation, will provide backup power during outages or emergencies
N/A Dorchester County
North Dorchester Middle School
Lithium-on battery
As part of a solar+storage system, will increase system reliability and provide electricity bill savings through demand reductions
N/A Baltimore City
Back River Wastewater Treatment Plant
N/AAs part of a biogas+storage system, will provide ancillary services, peak electricity demand reduction, load shaping, and backup power
N/A N/A Up to 25 homes N/AAs part of solar+storage system, will provide ancillary services and bill management services, and will explore the viability of leasing arrangements

3-8 | ENERGY STORAGE IN MARYLAND
the dispatch of BTM storage; and demonstrating innovative demand management software. The projects are summarized in Table 3-1.
Among other benefits, these projects have helped participants to identify practical questions that arise when storage is meant to serve multiple purposes. For instance, a project intended to aggregate BTM storage for providing frequency regulation prompted PJM to reconsider and rescind a requirement that BTM systems use separate service lines connecting the systems to the grid for retail and wholesale transactions.9
Advanced Metering InfrastructureAdvanced Metering Infrastructure (AMI) is an integrated network of smart meters, communication networks, and data management systems that allow for two-way communication between customers and utilities. AMI gives customers accurate information regarding their on-site generation and/or use of storage. It also enables utilities to offer new, time-based rate programs and incentives that encourage customers to reduce peak demand as well as manage energy consumption and costs. The Maryland PSC approved AMI initiatives for BGE and Pepco in 2010, Delmarva in 2012, and SMECO in 2013. The first phase of these initiatives, installation, is well underway. As of September 30, 2016, approximately 2.7 million electric and gas smart meters have been installed across the state. Choptank Electric Cooperative independently completed installing AMI for its 50,000+ customers in 2017. In addition, in January 2017, the PSC directed PC 44 to develop a proposal that enables utilities that have deployed AMI to begin instituting a data-sharing system in order to allow customer and third-party provider access to consumer interval-data.10
Microgrid ActivitiesIn June 2014, a Maryland microgrid task force, convened by the state, issued a comprehensive report on microgrids. Much of the report is focused on a legal and regulatory discussion of utility- and third-party-owned microgrids. The task force’s technical and financial recommendations call on the state’s utilities to incorporate microgrids into their planning processes and on the state itself to develop incentives for microgrids and storage.11 In February 2018, to comply with a stipulation of the Pepco-Exelon merger, Pepco submitted two public-purpose microgrid proposals to the Maryland PSC. The proposed microgrids were to be located in Prince George’s and Montgomery Counties for a total cost of $63 million, while saving $13.4 million by deferring two substation projects.12 In September 2018, the Maryland PSC denied Pepco’s proposal, without prejudice, because it was not deemed to be in the public interest. The PSC encouraged Pepco to submit a different microgrid proposal in the future.
3.4. System PlanningThe deregulation of Maryland’s electric utilities in 1999 has had a profound impact on system planning. Unlike states where utilities remain vertically integrated, Maryland no longer has primary responsibility for overseeing investments in generation or transmission, PJM does. As a direct result, Maryland’s utilities no longer submit integrated resource plans (IRPs) with detailed explanations of their long-term system needs and investment strategies. Instead, Maryland’s utilities conduct long-term “wires only” planning as a regular course of business, making investments (potentially including investments in energy storage) as needed. These investments are then subject to review during rate case proceedings.
3-9STATUS OF ENERGY STORAGE IN MARYLAND |
Energy Storage and Jobs
An indirect benefit of energy storage is its economic impact, in terms of state and local job creation. Several factors make measurement of job creation challenging. First, the industry is still relatively small. The best, most recent statistics suggest that the U.S. energy storage industry employed 90,831 individuals in 2016, compared to 6.4 million Americans working in the traditional energy and energy efficiency sectors.1 Second, many storage jobs are in legacy storage businesses, principally pumped hydro. Out of total energy storage employment in 2016, approximately one-quarter self-identified as working in pumped hydro jobs. Third, isolating job impacts is difficult, as changing local, state, and federal policies provide multiple, often competing signals to job creators. Finally, the industry is evolving and, in many cases, tracking and measurement of economic impact has not yet caught up.
Despite these challenges, the storage industry is rapidly growing, both creating new jobs and changing existing utility sector jobs. Over half of U.S. energy storage industry jobs are now related to battery storage, and the number of storage jobs more than tripled from 2015 to 2016. These include jobs in R&D, engineering, construction, O&M, sales, management, and more. 2016 employment figures indicate approximately 275 new U.S. jobs for each 1 MW of additional storage capacity.2
Policymakers and regulators should take caution when projecting future employment based on past job figures. First, the employment impact of new energy storage capacity will likely decrease over time as the industry matures and becomes more efficient. The solar PV industry, for example, cumulatively employed as many as 102 people for each MW of new installed capacity as of 2010.3 This declined to just 24 cumulative jobs per additional MW as of 2016. Second, new job creation over time skews heavily towards project development and installation, as again evidenced in the solar PV industry. Between 2010 and 2016, the number of solar PV project development and installation jobs both more than tripled. Meanwhile, manufacturing experienced a 12 percentage-point decrease in share of solar PV employment.
Additional considerations in terms of job growth include local impact, cost, and sustainability. Storage installation tends to require local employment to serve the “last mile” requirements of integration. Other job types, such as component manufacturing, are often outsourced based on comparative advantage, including mineral resource deposits or low-cost labor. As noted in this chapter, Maryland has a niche market for extreme btteries. The presence of this market, along with major research institutions in the state, suggests potential opportunities for R&D-related job growth. Several states already compete for these jobs. New York, for example, recently offered up to $13.25 million in performance incentives and investment credits to a business consortium committed to investing $130 million and creating 230 new energy storage jobs in the state over the next five years.
1 This and subsequent U.S. energy and energy storage job statistics are derived from DOE’s U.S. Energy and Employment Report, January 2017, link.
2 The U.S. added approximately 64,691 jobs (DOE) and 230 MW of energy storage (GTM Research; other sources).
3 This and subsequent solar industry job statistics are derived from the Solar Foundation’s (SF’s) National Solar Jobs Census, link. The U.S. added approximately 93,502 jobs (SF) and 918 MW of solar PV capacity (NREL, GTM, other sources).

3-10 | ENERGY STORAGE IN MARYLAND
Maryland’s utilities also communicate with regulators regarding needs and investment strategies through special filings and proceedings. For example, as a condition of the Constellation-Exelon merger, each of the Exelon-owned utilities in the state is submitting Distribution Investment Plans to the Maryland PSC over the course of 2017-2018. BGE, Pepco, and Delmarva have submitted their plans, which contain high-level, 1-to-2 paragraph discussions of storage.13 Through these filings, conversations, and presentations, the state’s five largest utilities indicate that they have identified a few cases where storage may be a cost-effective choice, either purely as a grid asset or (if permissible) as a multi-use asset. For example:
• SMECO is looking at storage to alleviate contingency requirements as load growth occurs on a 9-mile, 69-kV transmission line serving a single substation on a peninsula.14
• BGE has begun using storage to manage peak load at a substation that has a narrow, spiky peak that could exceed the operating limit on an associated transformer. 15
• PHI is evaluating several potential storage projects, including one in conjunction with a transmission project. PHI is also collaborating with A.F. Mensah and Chesapeake College on the microgrid pilot described in earlier.16,i
3.5. Barriers to StorageOnly one MW of the about 1,000 MW of energy storage in PJM’s Interconnection Queue is proposed for construction in Maryland.17,ii To better understand barriers to storage in Maryland, PPRP conducted one-on-
i PHI also has a demonstration project underway using electric vehicles (EVs) located at a government agency for frequency regulation and load shifting.
ii PJM indicates that most storage projects in its Queue are proposed to be co-located with wind projects further west that have “headroom” in their interconnection agreements.
one conversations with numerous industry stakeholders between June 2017 and February 2018, as well as conducted meetings with the PPRAC Energy Storage Work Group. Through these avenues, PPRP received feedback from the following organizations:
• Third-party storage manufacturers and/or project developers: Edison Energy, LLC; Flonium LLC; Fluence Energy; Ingersoll Rand, Inc. and CALMAC® Corporation (IRCO); Saft America, Inc.; Tesla, Inc.; Trane, Inc.; WindSoHy, LLC
• U.S. Department of Defense (DoD): U.S. Air Force Office of Energy Assurance (OEA) and DoD’s Environmental Security Technology Certification Program (ESTCP)
• Distributed Energy Resource (DER) developers (renewables): 8minuteenergy Renewables LLC; Sunrun®; Sunverge Energy, Inc.
• DER developer (fuel cells): Bloom Energy
• Competitive energy supplier: NextEra Energy, Inc.
• Microgrid developer: Schneider Electric™
• Utilities: Baltimore Gas and Electric Company (BGE); Exelon; Pepco Holdings, Inc. (PHI); Potomac Electric Power Company (Pepco); Southern Maryland Electric Cooperative (SMECO)
• Maryland state and local governments: Maryland Department of General Services (MDGS); Maryland Department of
3-11STATUS OF ENERGY STORAGE IN MARYLAND |
Transportation (MDOT); Maryland Energy Administration (MEA); Maryland Office of People’s Counsel (OPC); Montgomery County, Maryland – Office of Energy and Sustainability
• Industry associations: American Public Power Association (APPA); American Wind Energy Association (AWEA); Edison Electric Institute (EEI); Energy Storage Association (ESA); National Rural Electric Cooperative Association (NRECA); Solar Energy Industries Association (SEIA)
• Non-governmental organizations: Environment America; Interstate Renewable Energy Council (IREC); Pace Energy and Climate Center
• Other organizations: Alevo Analytics;iii Alexander & Cleaver; California Public Utilities Commission (CPUC) Staff; Geosyntec Consultants; Maryland Clean Energy Center (MCEC); Maryland Energy Innovation Institute (MEI2); PJM Interconnection, L.L.C. (PJM)
Through these conversations and meetings, a dozen major barriers to the growth of energy storage were identified, outlined below.
Costs, Compensation, and System Ownership1. System Costs – The cost of advanced
storage technologies may be declining rapidly, but it is still high relative to the cost of many of the mature technologies with which they compete, often on an application by application basis.
2. Financing – Many smaller storage developers report having difficulty securing
iii Since the teleconference meeting with Alevo Analytics, the company filed for Chapter 7 bankruptcy. Randell Johnson, Alevo Analytics’ former Chief Analyst, has formed a new analytics company called Acelerex.
project loans from banks due to uncertainty surrounding long-term revenue sources and long-term performance of new technologies.
3. Ownership – Nothing in existing law explicitly prohibits utilities in Maryland from owning and operating storage assets. However, Maryland statute does prohibit “the generation, supply, and sale of electricity, including all related facilities and assets” from being regulated as an electric company service or function. Depending on how storage is classified, it is unclear whether it should be regulated (i.e., subject to ratepayer recovery) and whether utilities should be able to participate in available PJM markets with storage projects.
4. Rate Designs – Maryland’s basic retail electricity rates fold demand-related expenses into per-kWh charges and mask the real-time cost of energy. This gives customers little incentive to minimize their usage at times of peak demand, eliminating one of the key potential benefits of customer-sited storage. Similarly, net metering is compensated at the retail electricity rate, whether the generation is stored or not.
5. PJM Services – Storage faces major obstacles to providing capacity services or transmission deferral services to PJM due to its market rules and planning processes. In addition, BTM storage may only participate in PJM’s markets as a demand response resource.
6. Market Value – Receiving compensation from multiple value streams is key to storage economics. Many of the benefits of storage

3-12 | ENERGY STORAGE IN MARYLAND
result in system-wide cost savings, but have no recognized market value. From a developer’s perspective, storage projects may not be economically justified unless more of these benefits are monetized by policymakers, regulators, and/or PJM.
Access to the Grid7. Interconnection – The interconnection
process for BTM storage is evolving. Currently, questions remain about the level of utility review that is needed for storage systems that will not export power, or whether gross or net capacity should be used when an interconnection study is being conducted. The cost and time required to interconnect storage systems can significantly impact whether storage projects are able to secure financing.
8. Multi-use Protocols – Regulatory and operational hurdles exist towards providing multiple services using a single system, including services at both the wholesale and retail level. There is no clear definition of the dispatch priority and protocols for storage simultaneously providing multiple services (e.g., wholesale market services vs. transmission and distribution services vs. customer benefits).
9. Permitting – Building and fire codes do not currently address storage and permitting staff are not always familiar with storage projects.
Planning10. System Planning – Presently, Maryland
utilities conduct distribution planning as a standard course of business; their distribution system investments, including
investments in storage, are subject to review during a PSC rate case proceeding. This means there is no process in place for the PSC and the public to understand how the state’s utilities are evaluating storage projects in the pre-investment stage.
11. Evaluation – Because advanced energy storage technologies and applications are relatively new, unexpected costs and benefits may result from projects. This makes it difficult to compare storage to other more traditional resources.
Knowledge12. Awareness – Many industry and non-profit
representatives believe the conversation about storage is dominated by batteries at the expense of other technologies, such as compressed air or thermal storage, and other options, such as energy efficiency.
3.6. PC 44 ActivitiesEnergy Storage Work GroupIroning out questions related to utility ownership of storage is crucial to the overall success of storage in Maryland. It has been the primary focus of the PC 44 Energy Storage Work Group (Storage WG), whose leader created a memorandum for PPRP summarizing viewpoints on the appropriate legal interpretation of the Code of Maryland Regulations (COMAR) with respect to FOM storage. This memo is a working document that evolves over time. The most recent version is attached as Appendix A and summarized here.
The roots of this discussion date back to the Electric Customer Choice and Competition Act of 1999, which barred Maryland’s utilities from

3-13STATUS OF ENERGY STORAGE IN MARYLAND |
owning generation assets as a means to promote competition in electricity supply. Since storage can perform some of the services characteristic of generation, there has been debate about whether storage should be classified as generation in COMAR, whether utilities can own storage, and whether rate-based storage systems should be allowed to participate alongside other generators in competitive wholesale markets run by PJM.iv
Other restructured states have also addressed this issue. Texas has thus far barred utility ownership of storage that participates in wholesale markets, but has indicated that it will open a rulemaking docket to consider these issues.18 Massachusetts passed legislation in 2017 to explicitly allow utility ownership of storage. New York has called on its utilities to use energy storage and to deploy at least two projects each by December 1, 2018. However, it does not appear that either Massachusetts or New York addressed participation in wholesale markets in these statements.19
The PC 44 Storage WG memorandum divides the views of the Storage WG members into four camps. BGE, Delmarva Power and Pepco (collectively, the “Joint Utilities”) take the view that storage is not generation, meaning it can only store energy generated by another resource. Therefore, utilities should be able to deploy storage as a grid asset and offset a portion of storage systems costs to ratepayers by participating in wholesale markets. MEA and the Center for Renewables Integration (CRI), a non-profit focused on integrating high percentages of renewable energy, suggest that storage should be considered generation if it is providing a generation service as its primary
iv Rate base is the undepreciated value of investment and certain other assets on which a public utility is permitted to earn a Maryland PSC-authorized rate of return.
function. The Maryland OPC recommends keeping all ownership options on the table until further information about the merits of different ownership models is available. Finally, ESA, along with other stakeholders, recommends that Maryland focus less on the definition of storage and more on creating “a competitive framework under which all cost-effective storage resources (including those owned by distribution utilities, and by third-parties and customers) are evaluated and procured.”20 The memorandum concludes that there is generally consensus within the Storage WG that utilities should be allowed to own FOM storage for the purpose of supporting the distribution system but suggests that it would be useful for the General Assembly or the Commission to “provide additional clarity.”21
To further the development of a competitive regulatory framework, the PC 44 Storage WG is considering a pilot program proposal to test various ownership models, including hybrid ownership models that would allow storage to be used as a grid asset by a utility and as a wholesale market asset by a third party. Projects would be assessed for their practicality and benefits. The models originally proposed by the Energy Storage Association for consideration are:
• Multiple Use Project – The purpose is to test multiple applications of storage. For this project, the utilities would either own and operate a storage device or lease a storage asset to a third-party developer for participating in the wholesale market when it is not being used for grid support. Under this scenario, the Maryland PSC would direct the utilities as to how the additional
3-14 | ENERGY STORAGE IN MARYLAND
revenues should be used to drive down costs for ratepayers.
• Ownership Model Project – For this project, the Maryland PSC would test an alternative compensation mechanism that allows utilities to earn a similar return for contracting services from a third-party-owned storage resource as if they rate-based the asset directly. One proposal discussed in the PC 44 Storage WG provides for a rate of return on the contract value, but there are other mechanisms that can be considered. Different arrangements regarding control of the storage device can also be tested for this project.
• Virtual Power Plant Project – This program allows utilities to contract with third-party developers who own and operate a portfolio of BTM resources and synchronize them as a larger, unified, and flexible resource to meet utility needs. Different arrangements regarding operational controls can also be tested for this project.
There has been some skepticism expressed about the pilot projects and they could be changed significantly or not filed at all.
Rate Design Work GroupRate design is essential to engaging more customers in modifying their electricity consumption, with or without the use of storage, to benefit the grid. There are two ways that rates are most often designed to reflect the actual costs of delivering electricity:
1. Time-of-use (TOU) tariffs reflect the daily rise and fall of energy costs (and sometimes actual T&D costs), rather than using a flat per-kWh fee that reflects average energy costs.
2. Demand charges reflect the cost of maintaining the generation, transmission, and distribution capacity needed to serve each customer’s maximum power needs.
At present, neither approach is common in Maryland. Standard Offer Service (SOS) for residential customers is solely a per-kWh charge. No per-kW charge is included in the SOS rate design, though capacity costs and similar costs that are related to peak demand are folded into the per-kWh charge. This is common for residential service since residential loads tend to be similar across customers and this rate approach has avoided the need to use expensive metering at residential customer locations. Additionally, as noted in Chapter 2, Western Maryland is the only region where demand charges for commercial customers are commonly high enough to make storage-based bill management potentially cost-effective.
Currently, BGE and Pepco residential customers receiving SOS can opt for a TOU rate with only very modest differentials between on-peak and off-peak prices. The PC 44 Rate Design Work Group (Rate Design WG) set out to build on this foundation by designing more meaningful TOU pilot projects for residential customers. If adopted, these pilots will introduce a TOU offering for distribution rates paired with offerings for those customers receiving SOS and for customers receiving energy from a competitive retail energy supplier.
The Rate Design WG submitted a final report to the Maryland PSC in February 2018. The report represents near-consensus among Rate Design WG members. However, the Retail Energy Supply Association (RESA) and individual retail suppliers did not participate in the second phase of Rate Design WG discussions, and RESA indicated

3-15STATUS OF ENERGY STORAGE IN MARYLAND |
retail supplier participation in the pilot programs, as outlined in interim documents, may not be feasible. As a result, the Rate Design WG focused on the pilot for SOS customers, including a separate, statistically significant sample of low- and moderate-income (LMI) customers. (TOU rates are often considered unfairly punitive for LMI customers, since they cannot always shift their energy use with ease. Therefore, evaluating the pilot’s impact on LMI customers is vital.)
The Rate Design WG recommended a two-year TOU pilot project with a nearly 4:1 ratio between on- and off-peak costs, in order to genuinely reflect all capacity and transmission costs, which is similar to the methodology used by BGE and Pepco in their electric vehicle (EV) tariffs. Under
this scenario, the resulting price ratios will be similar to those seen below.
The pilot project includes a proposed timeline, including tariff approval, in Summer 2018 and pilot conclusion in fall 2021.
Value of Solar StudyAs part of the PC 44 initiative, the Maryland PSC has commissioned Daymark Consulting LLC (Daymark) to conduct a cost-benefit study of distributed solar in the service territories of the state’s investor-owned utilities (IOUs). (A similar investigation of distributed solar in the service territories of the state’s two electric cooperatives is also underway.) The study is intended to
include an analysis of health and environmental benefits. The PSC also called for the study to focus on location-based considerations (e.g., the cost of lost open land and the grid benefits of load-offsetting generation). The PSC requested that Daymark consider the potential impact of storage on these benefits.
A draft of the study was released in spring 2018. It quantified the benefits of BTM solar and utility-scale solar in each of the IOU territories and calculated the technical potential for BTM and utility PV, as well as the distribution system’s current hosting capacity.
The report includes a qualitative discussion of the additional benefits of pairing PV with storage. It identifies the same benefits discussed in Chapter 1. Specifically, storage can smooth out the intermittency of solar production due to weather, save energy produced when energy prices are low for use or sale when energy prices are higher, minimize backflow issues, and provide services to PJM.
It is expected that Maryland will reach its 1,500-MW cap for net metering in late 2019 or in 2020. When this happens, the Maryland General Assembly will likely decide whether to raise the cap or instruct the PSC to consider other options for compensating distributed PV. Daymark’s findings could be used to inform efforts to design location- and time-varying rates for customers with distributed PV.22
Interconnection Work GroupAn efficient interconnection process is essential to avoid uncertainty and delays that can doom individual BTM projects and discourage storage providers from pursuing opportunities in the state. Inefficiencies in the interconnection
SOS SUPPLY RATIO
DISTRIBUTION RATIO
OVERALL PRICE RATIO
BGE 4.0:1 5.2:1 4.3:1
Delmarva 2.6:1 8.6:1 4.2:1
Pepco 2.7:1 8.1:1 3.9:1

3-16 | ENERGY STORAGE IN MARYLAND
process become increasingly detrimental as the volume of interconnection requests rises.
The PC 44 Interconnection Work Group (Interconnection WG) has been drafting proposed revisions to COMAR Section 20.50.09, which contains rules for interconnecting distributed generation resources. Below are four topics of relevance to storage and their status (as of May 2018).
• Definition – Energy storage was added Section 20.50.09’s definition of a small generator, solely for the purposes of the interconnection process.
• Review Requirements – The level of review that a proposed system requires is based on its capacity. The capacity of small generator projects combined with energy storage systems can either be viewed as the maximum power they could theoretically discharge (nameplate capacity) or the maximum power they are programmed to discharge (net nameplate capacity). (For example, a 50-kW system with a 15 kW battery might be programmed never to export more than 50 kW. Its nameplate capacity would be 65 kW, and its net nameplate capacity would be 50 kW.) The Interconnection WG did not agree on which method is appropriate during Phase I of its workgroup efforts. Proponents say that relying on nameplate capacity adds an unnecessary time and cost burden. Utilities counter that since they do not directly control these systems, they must consider whether/how they would be able to maintain system reliability, especially if system modifications and potential cyber threats are not well-managed by owners. The Interconnection WG
is revisiting this topic during Phase II of its work, which is envisioned to end in 2019.
• Inadvertent Export – Small generator projects combined with energy storage systems may occasionally generate a small amount of energy for export unintentionally. This occurs when a customer’s load drops unexpectedly and on-site generation or batteries cannot respond swiftly enough to avoid a few seconds of energy being exported to the grid. The Interconnection WG proposed that a new term, “inadvertent export,” be added to Section 20.50.09. The proposed regulation for inadvertent export would have established an acceptable limit for such exports. This would allow customers to rely on storage for a greater percentage of their on-site energy needs.23 Utilities are concerned that inadvertent exports would have negative impacts on the grid. The Interconnection WG is revisiting this topic during Phase II of its work, envisioned to end in 2019.
• Hosting Capacity Maps and Interconnection Queues – Hosting capacity maps and interconnection queues provide complementary information that will help customers make informed decisions about whether to invest in storage and other distributed energy resources, such as rooftop PV. Hosting capacity maps show where the grid has “room to grow.” Queues usually have a tabular form, and they indicate how many other applications are pending on different portions of the grid. These tools are important for customers and project developers looking to find low-cost interconnection points, since customers/project developers must pay for any system upgrades that are needed for a given project. The Joint Utilities have either

3-17STATUS OF ENERGY STORAGE IN MARYLAND |
developed, or are in the process of developing, maps that indicate how much additional distributed generation can be interconnected to system lines without causing problems, such as excessive reverse power flows. Figure 3-2 shows a portion of Pepco’s Hosting Capacity Map. In April 2018, the PSC decided that utilities will be required to post their interconnection queues, in tabular from, on their websites. Posting hosting capacity maps will be optional.
3.7. ConclusionMaryland has a tradition of embracing change in the electricity industry, including opting for deregulation, creating and expanding the RPS, and launching the EmPOWER Maryland program. This spirit is reflected in the diversity of projects already online in the state and the diversity of state-led actions that relate to storage. As Maryland contemplates next steps, it is worth noting that none of the barriers to storage highlighted above are unique to the state. This makes it worthwhile to examine efforts to promote storage in other states, which is the focus of Chapter 4.
3.8. Key Takeaways1. Maryland is just beginning to add advanced
energy storage to the grid; it currently ranks 18th in the country by volume of storage deployments per state.
> 1,500 to 10,000
Allowable_PV_kW
> 1,000 to 1,500
> 500 to 1,000
> 250 to 500
> 0.1 to 250
0.1 to 0.1
Figure 3-2. Pepco Radial Distribution Feeder Hosting Capacity MapSource: Adapted from Potomac Electric Power Company, accessed March 14, 2018, link.

3-18 | ENERGY STORAGE IN MARYLAND
2. In addition to a 10-MW lithium ion battery that provides services to PJM, there are over a dozen smaller thermal and battery storage projects in the state located at businesses, residences, academic institutions, and DoD sites.
3. Maryland has an energy R&D center at its flagship university that attracts major federal funding for advanced batteries (used in biomedical, aerospace, and defense applications). Saft America, Inc. runs an R&D and manufacturing facility for such batteries in Cockney, Maryland.
4. Several current or recent policy and regulatory initiatives in the state have promoted, or have relevance to, storage. Maryland is the first, and so far the only, state to enact an income tax credit for storage systems, which went into effect in January 2018. The state has also funded demonstration projects involving storage paired with renewable energy systems,
conducted an in-depth investigation of microgrids, and worked with utilities to install AMI in homes to enable two-way communication on energy prices and usage.
5. Stakeholders have identified a dozen primary barriers to storage in Maryland. None are unique to the state. These barriers primarily relate to: having access to the grid and markets, being able to compete on a level playing field with other resources, and being compensated for a greater portion of the services that storage could provide.
6. Through its Public Conference 44 on Grid Modernization, the Maryland PSC is considering pilot projects and revisions to COMAR that will help to address storage (and other DERs) interconnection challenges, test more meaningful TOU rate designs, and test hybrid ownership models.

3-19STATUS OF ENERGY STORAGE IN MARYLAND |
Endnotes1 Veolia North America, “Keep Your Cool at the Baltimore Convention Center,” https://www.veolianorthamerica.com/sites/g/files/dvc596/f/
assets/documents/2017/09/Baltimore_Convention_Center-Plant_1_Tour_Brochure.pdf (accessed June 2017, webpage now defunct).
2 Mosaic Power, “Grid Operators,” https://mosaicpower.com/grid-operators/; and Maryland Affordable Housing Coalition, “2016 Award Winners,” https://www.mdahc.org/resources/Pictures/2016AwardWinners_3.pdf.
3 Power Surety Incorporated, “Fort Detrick Microgrid,” http://www.powersurety.com/portfolio-items/fort-detrick-microgrid/.
4 Power Surety Incorporated, “34 MWh Utility-Scale Energy Storage,” http://www.powersurety.com/portfolio-items/utility-scale-energy-storage/.
5 David Burton, Isaac Maron, and Binyomin Koff, “Maryland Enacts First in the Nation Energy Storage Tax Credit,” Tax Equity Times, May 10, 2017, https://www.taxequitytimes.com/2017/05/maryland-passes-first-in-the-nation-energy-storage-tax-credit/.
6 Maryland Energy Administration, “Request for Input,” http://news.maryland.gov/mea/wp-content/uploads/sites/15/2017/08/Request-for-input_Energy-Storage-System.pdf.
7 “Income Tax Credit – Energy Storage Systems,” Maryland Senate Bill 758, Chapter 389, http://mgaleg.maryland.gov/2017RS/Chapters_noln/CH_389_sb0758e.pdf.
8 “Maryland DOT Sets Wide-Ranging Plan to Tap Solar Power for Facilities, Cut Utility Bills,” Aashto Journal, February 23, 2018, https://news.transportation.org/Pages/022318mdsolar.aspx.
9 “Retail and Wholesale Coordination,” A.F. Mensa, submitted to the PC 44 Energy Storage Work Group, October 2017.
10 “Notice,” David J. Collins, Executive Secretary of the Maryland Public Service Commission, Docket No. PC 44, January 31, 2017, 10.
11 Maryland Resilience Through Microgrids Task Force Report, http://energy.maryland.gov/documents/marylandresiliencythroughmicrogridstaskforcereport_000.pdf.
12 Pepco, “Updated Proposal for a Pilot Program to Create and Evaluate Public Purpose Microgrids in Prince George’s and Montgomery Counties, Maryland,” Maryland PSC Docket, 9361, February 15, 2018, 2.
13 Distribution Investment Plan, Baltimore Gas and Electric Company, Maryland PSC Docket No. 9406, June 5, 2017, 34; Distribution Investment Plan, Delmarva Power, Maryland PSC Docket No. 9424, February 14, 2018, 38; and Distribution Investment Plan, Potomac Electric Power Company, Maryland PSC Docket No. 9418, November 17, 2017, 37.
14 Conversation with SMECO’s Ken Capps, Senior Vice President, Engineering and Operations, and Chief Operating Officer; and Jeff Shaw, Vice President Distributed Energy and Sustainability, January 25, 2018.
15 Presentation by John Murac, Baltimore Gas and Electric Company, PPRAC Energy Storage Work Group meeting, October 26, 2015.
16 Presentation by Steve Stefel, Pepco Holdings, Inc., PPRAC Energy Storage Work Group meeting, October 26, 2015.
17 PJM Interconnection Queue, https://www.pjm.com/planning/services-requests/interconnection-queues.aspx, accessed February 2018.
18 Public Utility Commission of Texas, Docket No. 46368, Order, “Application of AEP Texas North Company for Regulatory Approvals Related to the Installation of Utility-Scale Battery Facilities,” February 15, 2018, http://interchange.puc.texas.gov/Documents/46368_166_970157.PDF.
19 Memorandum from the PC 44 Energy Storage WG to the Maryland Power Plant Research Program, re: “Utility Ownership and Regulation of Front-of-the-Meter Energy Storage in Maryland,” January 11, 2018.
20 Ibid.
21 Ibid.
22 Conversation with Jon Kucskar, Senior Commission Advisor, Maryland Public Service Commission, March 14, 2018.
23 Energy Storage Association, Updating Distribution Interconnection Procedures to Incorporate Energy Storage, January 2018, http://energystorage.org/interconnection, 4.

3-20 | ENERGY STORAGE IN MARYLAND

4-1ENERGY STORAGE POLICIES AND INITIATIVES IN OTHER STATES |
States are experimenting with a number of different incentives, policies, and approaches for encouraging the growth of energy storage projects. Because market penetration and acceptance of storage is just getting underway, state policies such as targets and incentives also are at an early stage of development and implementation. states are also conducting cost-benefit studies, have directed (or accepted utility proposals for) the incorporation of storage in utility resource plans, or are contemplating the revamping of distribution planning processes.
i Restructured states have retail electric competition. In this report, Washington D.C. is treated as a state. California is not considered restructured, though there is limited customer choice in the state.
Activity in 20 of these states (nine of which are restructured) is depicted in Figure 4-1. This chapter provides an overview of state actions with regards to storage.i
PPRP identified ten states (six of which are restructured) that offer financial incentives or policy support in the form of grants, loans, rebates, tax credits, and storage targets. Of these, eight states have or are offering grants amounting to nearly $2 billion for eligible technologies, including storage, with California
4. ENERGY STORAGE POLICIES AND INITIATIVES IN OTHER STATES
WASHINGTON• Incentives• Formal Statement
Supporting Inclusion in IRP
NEVADA• Bill Requiring
Investigation of Potential Target
• Storage Docket Related to Planning
• Interconnection Standards
ARIZONA• Proposed Storage
Target• Grid Mod Docket• Commission Order for
Load Management Program to Support Storage
TEXAS• Incentives• Interconnection
NEW MEXICO• Task Force• Inclusion in IRP
MINNESOTA• Grid Mod Docket
MISSOURI• Grid Mod
Docket
OHIO• Grid Mod Docket
DC• Grid Mod Docket
NEW HAMPSHIRE• Grid Mod Docket
VERMONT• Grid Mod Docket
MARYLAND• Grid Mod Docket• Tax Credit• Pending Storage
Study
CONNECTICUT• Grid Side
Enhancement Projects and DER Integration Plans Include Storage
MASSACHUSETTS• Aspirational Target• Incentives• Grid Mod Docket• State of Charge Report
NEW YORK• Pending Mandate &
Governor’s Suggested Goal• Grid Mod Docket (REV)
Including Demonstration Projects
• Clean Energy Fund
INDIANA• 7-Year Electric
Transmission, Distribution & Storage System Improvement (“TDSIC”) Plans
ILLINOIS• Grid Mod
Docket
COLORADO• Docket on
Distribution Planning and Interconnection
OREGON• Mandate• Incentives• Formal Statement
Supporting Inclusion in IRP
• Pending Grid Mod Docket
CALIFORNIA• Mandate• Incentives (SGIP)• CA Storage
Roadmap• Working Group• Distribution
Planning• Interconnection
Standards• Expedited Projects
(Aliso Canyon, etc.)
Note: Map illustrates notable policies and is not exhaustive. Grid Mod Docket refers to Grid Modernization Dockets – broad dockets that address changing technologies (usually including storage) and their impacts of utility planning, business models, or regulation. Image source same as previous slide.
State Storage Policy: Active Proceedings
Figure 4-1. Notable State Initiatives (Excluding Targets) Concerning Energy StorageSource: Adapted from Roger Leuken, Judy Chang, Hannes Pfeifenberger, Pablo Ruiz, and Heidi Bishop, “Getting to 50 GW?” presentation, February 22, 2018, link, slide 13.

4-2 | ENERGY STORAGE IN MARYLAND
alone accounting for nearly $1.3 billion. Four states have or are offering rebates totaling over $600 million, with California again providing the bulk of the funds. Three states have or will provide loans to eligible technologies, including storage, representing over $250 million. Six states (Arizona, California, Massachusetts, New Jersey, New York, and Oregon) have enacted storage targets. Note that these are targets, not procurement mandates, to which these policies are sometimes referred. Utilities do not face direct financial penalties, such as fines, for non-compliance, although state regulators may opt to act during a utility rate case. state diversity is apparent even within individual policies. For instance, New York’s storage target is not directed at utilities but is instead focused on sweeping away regulatory and market barriers that could impede achieving the state’s storage goal. Table 4-1 provides an overview of policy approaches for storage that different states are pursuing or pursued. Note that it does not include policies that are under consideration, such as potential storage targets in Nevada.
In addition to (or in advance of) providing support for storage through targets/incentives, many states are seeking to quantify the potential benefits of storage and identify specific use cases worth facilitating. Such questions can be addressed by states conducting cost-benefit studies of storage directly, or asking their
utilities to do so via IRPs (in regulated states) or distribution system planning. A report from the DOE identified four states that are conducting or have conducted cost-benefit analyses of storage, and another dozen that have incorporated storage in IRP processes. IRP is not practiced in Maryland; hence, it is not applicable, but it is an indicator of state and utility interest in storage. Finally, DOE identified at least 16 states (including Maryland) that are re-examining or adding to distribution planning practices that will impact energy storage and other distributed energy resources (DERs). Table 4-2 provides an overview of state activities with regard to cost-benefit studies, integrated resource plans (IRPs), and distribution planning. More information on distribution planning is provided in Section 4-6.
4.1. RebatesRebates are lump-sum payments that cover a part of the capital costs for an eligible project such as storage. States have utilized rebates for many years for various energy technologies, and they differ by what percentage of system cost is covered, what customer classes are eligible, and system size, to cite just a few examples. Rebates can be paid on a dollar-per-watt basis or as a percentage of system cost, capped at a maximum level. In California, storage receives a rebate based on dollar-per-watt-hour, measured by system size, not by how much is discharged.
MD* AZ CA CT* MA* NJ* NV NY* OR* WA*
Grants and Loans ✔ ✔ ✔ ✔ ✔ ✔ ✔ ✔
Rebates ✔ ✔ ✔ ✔
Tax Credits ✔
Storage Targets ✔ ✔ ✔ ✔ ✔ ✔
Table 4-1. State Policy Approaches for Energy Storage[a]
[a] Includes state initiatives or programs that are no longer in effect. Starred states have restructured electricity markets.

4-3ENERGY STORAGE POLICIES AND INITIATIVES IN OTHER STATES |
Rebate amounts can decrease as the cost of an eligible technology decreases, if other state or federal incentives are offered, or if market conditions change. Rebates can be dedicated to specific customer groups (e.g., residential, commercial, industrial) or in certain areas of a state. It is difficult, however, to set rebate levels
that do not over- or under-subsidize eligible energy technologies.1
Rebate programs for storage that have been offered in California, Nevada, New Jersey, and New York are summarized in Table 4-3. California, by far, allocates the most money, collecting $166 million annually from electricity consumers through 2019, of which 80 percent is reserved for storage. Of that 80 percent, 13 percent is allocated for residential projects at 10 kW or less.2 Other requirements in California are that storage systems must be capable of fully discharging at least once per day, have a round-trip efficiency of 69.6 percent or greater in the first year of operation, and have a 10-year round-trip efficiency of 66.5 percent. Storage in California can be paired with a renewable energy resource but must be charged at least 75 percent from the on-site renewable energy generator.3
The factors these states have considered while offering storage rebates are:
• Location – California and New Jersey require storage systems to be installed behind-the-meter (BTM).4,5 Nevada requires the storage system be interconnected to an existing distribution system.
• Eligibility – California requires rebate applicants to disclose all other incentives that have been received or could potentially be received. The rebate will be reduced dollar-for-dollar by incentives funded by investor-owned utility (IOU) ratepayers and by 50 percent for incentives funded by non-IOU ratepayers.6 An applicant that pursues a grant from the New Jersey Resilience Bank will not be eligible for a rebate.7
COST-BENEFIT STUDY IRP DISTRIBUTION
PLANNING
AZ ✔
CA ✔
DC* ✔
FL ✔ ✔
HI ✔ ✔
IL* ✔
IN ✔ ✔
KY ✔
MA* ✔
MD* ✔
MI* ✔ ✔
MN ✔
NC ✔ ✔
NM ✔
NV ✔
NY ✔ ✔
OH* ✔
OR* ✔ ✔ ✔
PA* ✔
RI* ✔
WA ✔ ✔
Table 4-2. State Activities with Cost-Benefit Studies, IRPs, and Distribution Planning with Regard to Energy Storage* Restructured states.Source: Adapted from Energy Storage Association, and Juliet Homer, Alan Cooke, and Lisa Schwartz, et al., State Engagement in Electric Distribution System Planning, U.S. Department of Energy’s Grid Modernization Laboratory Consortium, December 2017, link, iv.

4-4 | ENERGY STORAGE IN MARYLAND
• Claiming Rebates – In California, rebates are paid when milestones such as project completion and field verification have been achieved.8 Similar requirements are in place in Nevada. In New Jersey, rebate payments are made after a post-completion inspection.9
• Electricity Source – In New Jersey, stored electricity must be generated by a renewable energy system to be eligible for a rebate.10
• Other Requirements – Table 4-3 highlights state requirements for rebate eligibility such as serving critical public facilities (New
Table 4-3. State Rebate Programs Where Energy Storage Is Eligible
STATE
PROGRAM TOTAL AMOUNT ($M)
FUNDING LIMIT
DATES IN EFFECT DESCRIPTION
California1,2 $501 $5 million per project 2017-2019
The Self-Generation Incentive Program (SGIP) provides rebates for power generation and storage located BTM. Eighty percent of SGIP funding is allocated to storage. For energy storage, rebates start at $0.50/watt-hour and decrease with the number of subscriptions to a minimum of $0.25/watt-hour. Watt-hour is a measure of the size of the project, not how much energy was discharged. Individual projects must be less than 6 MWh.
Agency: California Public Utilities Commission (CPUC)
Nevada3 $5 50 percent of project cost 2018-
By a recently enacted state law, NV Energy must establish a rebate program for small and large storage projects, to be overseen by the Nevada Public Utilities Commission (PUCN). Residential systems cannot exceed 100 kW; industrial and commercial systems are limited to between 100 kW and 1 MW.
Agency: PUCN
New Jersey4,5,6 $6
Either 30 percent of the project cost or $300,000, whichever is less. Single entity limited to $500,000 overall.
2015-2016
The Renewable Electric Storage Program provided rebates at $300/kWh for storage projects connected to a renewable project BTM of a non-residential customer and systems of at least 100 kWh. The Renewable Electric Storage Program is no longer accepting new applications because of lack of funding.
Agency: New Jersey Board of Public Utilities (BPU)
New York $32
50 percent of installed costs, capped at $1,350/kW for battery storage and $1,700/kW for thermal storage
2018-2019
Thermal storage and battery storage are eligible for rebates. High-efficiency chillers and HVAC systems, and generators and controls used for demand response, are also eligible.7
Agency: New York State Energy Research and Development Authority (NYSERDA)
Not
e: T
able
end
note
s ar
e se
para
te fr
om th
e re
st o
f the
cha
pter
’s e
ndno
tes.
Tab
le e
ndno
tes
begi
n on
pag
e 4-
17.

4-5ENERGY STORAGE POLICIES AND INITIATIVES IN OTHER STATES |
Jersey),11 capability to support up to the host facility’s entire load (California),12 and minimum round-trip efficiency (California).13
4.2. Grants and LoansTwo tools commonly used by states to promote new energy technologies are grants and loans. Simply put, grants are a sum of money for a specific function or application, while loans are an allocation of money that is to be paid back, typically with interest. Grants are generally issued through competitive solicitations or RFPs that can be either highly structured or more open and general in order to encourage innovative and creative ideas. States may also accept unsolicited applications. In addition, grants may be awarded through a reverse auction, whereby winning projects require the smallest amount of funding. Advantages of grants are that they can be designed to emphasize certain technologies, market niches, or geographic areas; pilot or demonstration projects; or they can be less structured to encourage more creative proposals. Grants can also be combined with private capital, such as requiring minimum amounts of co-funding from applicants, to ensure grant dollars extend as far as possible. Disadvantages of grants are high administrative costs, as preparing and review grant applicants is time-consuming for both applicants and application reviewers.14
Loan programs can provide funding for the initial cost of a storage facility at favorable interest rates or with better terms than banks or other sources of financing.15 A loan program can also be self-sustaining (assuming no or limited defaults) through loan repayments that, in turn, can be used for making additional loans. State loan programs may also facilitate co-funding from private lenders or investors who might not have otherwise
provided financing. However, state loan programs incur the risk of loan defaults and also have high administrative costs, since expertise is needed to evaluate project and credit risk, and active loans require loan servicing and monitoring.16
Table 4-4 summarizes state-level grant programs that provide funding for storage. All the programs described in Table 4-4 are currently active except the grant programs in Maryland, New Jersey, and Oregon. Several patterns in funding can be observed:
• System Benefits – Four of the grant programs shown in Table 4-4 (Maryland, Massachusetts, New York, Washington) are/were intended to demonstrate the ability of storage to provide a variety of system benefits, including: integrating renewables, relieving peak demand, and decreasing/deferring transmission and distribution (T&D) system investments.
• Microgrids – Four of the grant programs shown in Table 4-4 (Connecticut, New Jersey, New York, Oregon) are/were intended to fund microgrid projects that support critical facilities. Storage is eligible as part of a microgrid project.17
• Eligible Technologies – New Jersey’s Energy Resilience Bank funded batteries when installed along with solar PV systems as well as thermal storage.18

4-6 | ENERGY STORAGE IN MARYLAND
Table 4-4. State Grant and Loan Programs Where Energy Storage Is Eligible
STATE
PROGRAM TOTAL AMOUNT ($M)
FUNDING LIMIT
DATES IN EFFECT DESCRIPTION
Maryland1,2,3,4
$2 (funding exhausted, no longer available)
30% of project cost 2014-2017
Grants from $50,000-$250,000 were available for projects to reduce the costs or increase the efficiency of renewable energy projects, or to integrate storage with renewable energy projects. Three grants were issued in FY17, all for combined renewable energy and storage projects.
Agency: MEA
California5
$1.3
(from 2012-2020)
Project-specific funding limits can be imposed but have not been to date
2011-2020
The Electric Program Investment Charge (EPIC) program supports investments in clean energy technologies, including storage that is paired with other applications, such as microgrids and renewable energy projects, particularly solar.
Agencies: CPUC; California Energy Commission (CEC)
Connecticut6,7,8 $30$4 million per project; $15 million per year
2012-
The Microgrid Program funds microgrid projects that support critical facilities. Storage (battery or flywheel) must be paired with renewable energy or combined heat and power projects, and grants are limited to no more than $1,000/kW. As of 2017, $20.5 million has been awarded for ten projects; six are operational, four are under construction.
Agency: Connecticut Department of Energy and Environmental Protection
Connecticut9 $5 $2 million for storage 2012-
Limited to critical public facilities. Each applicant qualified to receive grants from Connecticut’s Microgrid Program may apply for a loan of up to $2 million from Connecticut Green Bank.
Mass.10,11,12 $20 $1.25 million per project 2017-
Advancing Commonwealth Energy Storage (ACES) is aimed at piloting storage use case/business models with multiple value streams. In December 2017, $20 million in grants were awarded for 26 storage projects. Combined, the ACES projects total 32 MW and 85 MWh of storage capacity.13
Agencies: Massachusetts Clean Energy Center; Massachusetts Department of Energy Resources (MA DOER)
Mass.14,15,16,17 $40 None 2014-
The Community Clean Energy Resiliency Initiative (CCERI) supports clean energy technology solutions to protect communities from interruptions in energy service. Storage is part of 13 of the 19 awardees from Rounds 1 and 2. Round 3 provided funding to resiliency components of clean energy systems of hospitals.
Agencies: Massachusetts Clean Energy Center; MA DOER

4-7ENERGY STORAGE POLICIES AND INITIATIVES IN OTHER STATES |
Table 4-4. State Grant and Loan Programs Where Energy Storage Is Eligible (cont’d)
STATE
PROGRAM TOTAL AMOUNT ($M)
FUNDING LIMIT
DATES IN EFFECT DESCRIPTION
New Jersey18,19,20
$200 ($5M for storage) (funding exhausted, no longer available)
$500,000 per storage project 2014-2017
The New Jersey Energy Resilience Bank (ERB) supported the installation of resilient energy technologies at critical facilities. Storage was required to be paired with an existing renewable energy source. Funding was provided as a combination of grants/forgivable loans and loans. Available funding has been fully utilized and no additional applications are being accepted.
Agencies: New Jersey BPU; New Jersey Energy Development Authority
New Jersey21 $200 Funding fully utilized 2014-2017
The New Jersey ERB offered funding to public and/or not-for-profit resiliency project applicants, limited to critical public facilities. The ERB offered an amortizing, 2% interest rate loan with a term of up to 20 years.
New York22,23,24,25,26 $40
Ranges from $100,000 for feasibility studies to $20 million for community grid projects
2015-2018
The New York Prize Community Grid Competition supports community microgrids involving at least one critical facility. Any variable renewable resource must be paired with other forms of generation and/or storage.
Agencies: NYSERDA; New York Governor’s Office of Storm Recovery
New York27,28 $6.3
Ranges from $250,000 for early-stage development projects to unlimited for product development
2017-2018
The Energy Storage Technology and Product Development solicitation has closed; the program aims at reducing storage costs, improving system performance, and assessing new and innovative storage technologies.
Agency: NYSERDA
New York29,30 $15.5
Up to $100,000 for feasibility studies; no maximum for demonstration projects
2017-2019
The Demonstrating Distributed Energy Storage for Stacking Customer and Grid Values program supports storage demonstration proposals that can stack two or more value streams for customers and utilities. Up to $100,000 per proposal available with 25% co-funding from proposers in the feasibility stage. In the full proposal demonstration stage, it places no maximum limit on funding, provided 50% of the co-funding comes from the proposer. (PON 3541)
Agency: NYSERDA
New York $200 TBD 2018-
The New York Green Bank’s goal is to stimulate private investment in clean energy through removing financing barriers.31
Agency: NYSERDA

4-8 | ENERGY STORAGE IN MARYLAND
4.3. Tax CreditsTax credits are, as the name implies, a credit against state taxes in a particular year from investments in eligible technologies, and can be based on a percentage of a capital investment or based on power production ($/MWh). In May 2017, Maryland became the first, and so far only, state to provide a state investment tax credit (ITC) for installing storage systems. Eligible technologies include chemical (batteries), thermal (ice/chilled water), and mechanical (flywheels, compressed air).19 (See Table 4-5.)
Tax incentives require minimal state oversight. They can also be modified to reflect changing
market conditions or changes in costs of eligible technologies. Unless carefully designed with an upper limit, as are Maryland’s, tax credits can significantly impact state tax revenue. Furthermore, project developers may not have enough of a tax liability to fully take advantage of a state tax incentive, unless the tax credit can be transferred to other entities who can take advantage of the tax credit.20
4.4. State Storage TargetsA small but growing number of states have set storage targets for utilities, or required utilities to procure storage in addition to new generation. Note that no state has adopted an RPS-type
Table 4-4. State Grant and Loan Programs Where Energy Storage Is Eligible (cont’d)
STATE
PROGRAM TOTAL AMOUNT ($M)
FUNDING LIMIT
DATES IN EFFECT DESCRIPTION
New York32Up to $50M per project
$50 million 2018-The NY Green Bank will consider applications for loans for each winner of Stage 3 from the New York Prize Community Grid Competition.
New York $60 TBD 2018-
NYSERDA’s Clean Energy Fund disburses funding to reduce administration and marketing costs and to support business model pilots,33 product development, field testing, and grid modernization and resiliency.
Agency: NYSERDA
Oregon34 $0.3 One-time grant of $295,000 2015
The Oregon Department of Energy and the U.S. Department of Energy funded the Eugene Water and Electric Board (EWEB) development of three small microgrids with storage and solar, with diesel backup.
Agency: Oregon Department of Energy
Washington35,36 $14.3 TBD 2014-
The Washington Clean Energy Fund (WCEF) funded three storage demonstration projects by Avista Corporation, Puget Sound Energy, and the Snohomish County Public Utility District to help better integrate wind and solar projects and to investigate storage-use cases. The Washington State Legislature gave additional funding to WCEF in 2018, and WCEF is preparing an investment plan.
Agencies: Washington State Department of Commerce; Governor’s Clean Energy Fund

4-9ENERGY STORAGE POLICIES AND INITIATIVES IN OTHER STATES |
mandate for storage. No financial penalties are levied if the targets are not met. In addition to the states listed in Table 4-6 below, the Nevada State Legislature passed legislation in 2017 directing the Nevada Public Utilities Commission (PUCN) to determine by October 1, 2018 whether it is in the public interest to set a storage procurement target for utilities.21 New Jersey has set a storage target of 600 MW by 2021 and 2,000 MW by 2030.22 In January 2018, a commissioner for the Arizona Corporation Commission (ACC) proposed a target goal of 3-GW of storage by 2030. The California Public Utilities Commission (CPUC) recently directed Pacific Gas & Electric (PG&E) to issue an RFP for renewable energy and storage projects as possible replacements for three natural gas-fired peaker plants.23 Table 4-6 describes the provisions in states that have adopted a storage target. Table 4-6 also lists states that have chosen targets to ensure adoption of storage by utilities and their customers. The objectives and approaches of the states for establishing targets can be summarized as follows:
• Setting Goals – The states in Table 4-6 have taken different approaches to establishing storage targets. Massachusetts conducted a study that recommended deployment of 600 MW of storage capacity by 2025.24 However, the Commonwealth eventually set a target
of 200 MWh by 2020 of storage based on feedback from stakeholders.25 Oregon set a target of 5 MWh for Portland General Electric (PGE) and PacifiCorp, and required both utilities to evaluate the storage potential for their respective systems.26 Both utilities submitted storage project proposals exceeding the 5 MWh target. Put another way, Oregon started small and directed its utilities to do evaluation studies, while Massachusetts conducted its study first before setting a target.
• Storage Location – California requires utilities to install storage within three grid domains: transmission-connected, distribution-connected, and customer-side applications.27 Massachusetts and Oregon instructed utilities to inform the respective state of optimal locations.28,29
• Capacity and Technology – All five states in Table 4-6 have emphasized a range of storage technologies at different levels of maturity.30,31,32 Massachusetts, for instance, includes thermal storage technologies such as ice storage or chilled water, both of which provide space cooling when needed, as well as batteries and compressed air technologies.33 California restricts pumped hydro storage projects to 50 MW or less to help prevent preemption of battery and thermal storage technologies.34
MAXIMUM ($) FUNDING LIMIT DATES IN EFFECT DESCRIPTION
$750,000 per year
$5,000/project for residential customers and $75,000/project for commercial customers
2018-2022
Provides 30% tax credit on the installed cost of a storage system for residential or commercial customers, subject to a project and overall cap, as summarized in the columns to the left. The amount of the credit cannot exceed the state income tax liability for the applicant and cannot be transferred from year to year.1,2,3
Agency: MEA
Table 4-5. Maryland’s Tax Credits for Energy Storage
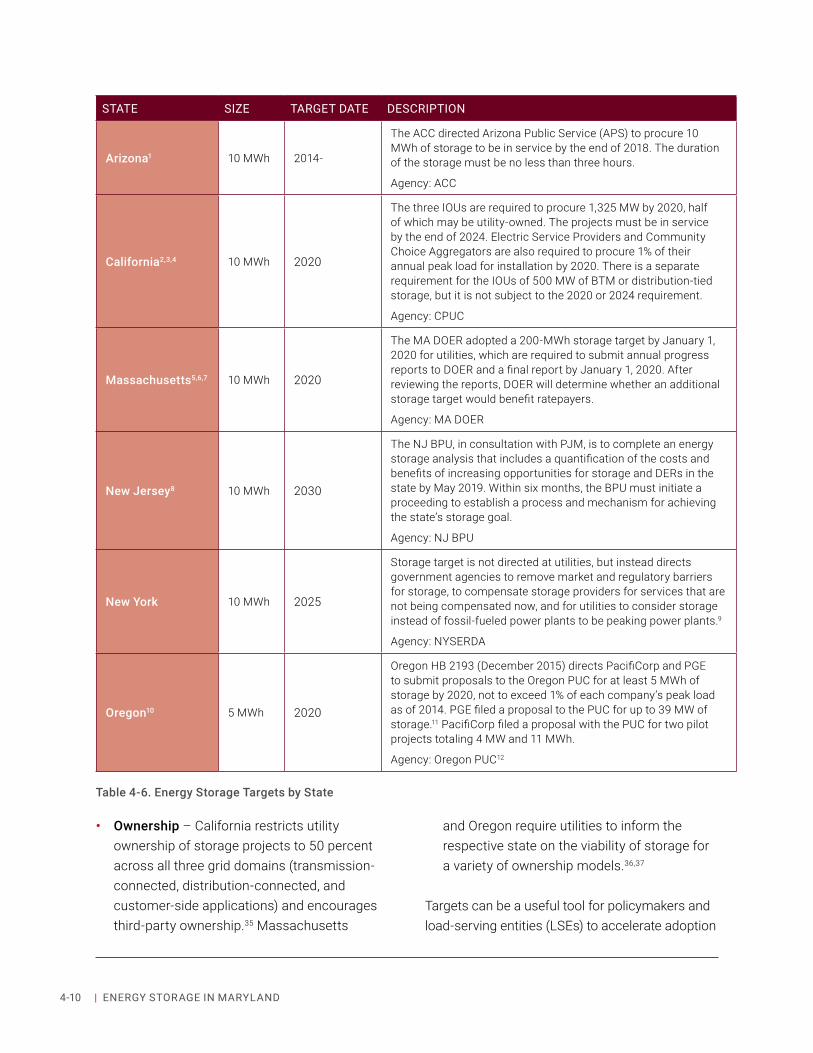
4-10 | ENERGY STORAGE IN MARYLAND
• Ownership – California restricts utility ownership of storage projects to 50 percent across all three grid domains (transmission-connected, distribution-connected, and customer-side applications) and encourages third-party ownership.35 Massachusetts
and Oregon require utilities to inform the respective state on the viability of storage for a variety of ownership models.36,37
Targets can be a useful tool for policymakers and load-serving entities (LSEs) to accelerate adoption
Table 4-6. Energy Storage Targets by State
STATE SIZE TARGET DATE DESCRIPTION
Arizona1 10 MWh 2014-
The ACC directed Arizona Public Service (APS) to procure 10 MWh of storage to be in service by the end of 2018. The duration of the storage must be no less than three hours.
Agency: ACC
California2,3,4 10 MWh 2020
The three IOUs are required to procure 1,325 MW by 2020, half of which may be utility-owned. The projects must be in service by the end of 2024. Electric Service Providers and Community Choice Aggregators are also required to procure 1% of their annual peak load for installation by 2020. There is a separate requirement for the IOUs of 500 MW of BTM or distribution-tied storage, but it is not subject to the 2020 or 2024 requirement.
Agency: CPUC
Massachusetts5,6,7 10 MWh 2020
The MA DOER adopted a 200-MWh storage target by January 1, 2020 for utilities, which are required to submit annual progress reports to DOER and a final report by January 1, 2020. After reviewing the reports, DOER will determine whether an additional storage target would benefit ratepayers.
Agency: MA DOER
New Jersey8 10 MWh 2030
The NJ BPU, in consultation with PJM, is to complete an energy storage analysis that includes a quantification of the costs and benefits of increasing opportunities for storage and DERs in the state by May 2019. Within six months, the BPU must initiate a proceeding to establish a process and mechanism for achieving the state’s storage goal.
Agency: NJ BPU
New York 10 MWh 2025
Storage target is not directed at utilities, but instead directs government agencies to remove market and regulatory barriers for storage, to compensate storage providers for services that are not being compensated now, and for utilities to consider storage instead of fossil-fueled power plants to be peaking power plants.9
Agency: NYSERDA
Oregon10 5 MWh 2020
Oregon HB 2193 (December 2015) directs PacifiCorp and PGE to submit proposals to the Oregon PUC for at least 5 MWh of storage by 2020, not to exceed 1% of each company’s peak load as of 2014. PGE filed a proposal to the PUC for up to 39 MW of storage.11 PacifiCorp filed a proposal with the PUC for two pilot projects totaling 4 MW and 11 MWh.
Agency: Oregon PUC12

4-11ENERGY STORAGE POLICIES AND INITIATIVES IN OTHER STATES |
of storage without financial penalty if for any reason the targets are infeasible to meet. Targets can also be changed, up or down, based on experience or changes in technology economics or market conditions. California, for instance, added of 500 MW of BTM or distribution-tied storage to its previous storage target of 1,325 MW that was adopted in 2013. Targets are also an indirect recognition of benefits of storage that are hard to precisely quantify but stakeholders generally agree are present. Targets, though, can raise concerns about cost impacts, depending on which storage technologies and system applications are pursued.
4.5. Distribution System PlanningIn considering storage, states are using a combination of cost-benefit studies, IRPs, and distribution system planning, the focus of this section. Historically, electric utilities have conducted distribution planning to ensure the local grid maintains reliable service, with minimal involvement by state utility regulators. Several
factors are changing this paradigm, including the emergence of distributed energy resources such as solar PV, the improving economics of storage, potential utility investments to modernize grid distribution assets, and utilities giving customers the opportunity to control their energy costs and sources of energy. As a result, some states are conducting, or at least considering, more comprehensive and intensive planning approaches for utility distribution planning, sometimes termed integrated distribution planning. Figure 4-2 indicates some common elements of an integrated distribution planning process.
Below are definitions of the terms in Figure 4-2:
• Multiple Scenario Forecasts, where multiple growth projections of distributed generation are used to assess current system capabilities, identify incremental infrastructure requirements, and enable analysis of the locational value of distributed generation.
LocationalNet Benefits
Analysis
Resource &Transmission
Planning
MultipleScenarioForecasts
CurrentDistributionAssessment
Annual Long TermDistribution
Planning
InterconnectionStudies
HostingCapacity
Sourcing DERProvidedServices
(Pricing, Programs &
Procurements)
Value of DER
Interconnection Process
Dist
ribut
ion
Engi
neer
ing
Anal
yses
Distribution InvestmentRoadmap
Figure 4-2. Elements of Integrated Distribution PlanningSource: Adapted from Julie Homer, Alan Cooke, and Lisa Schwartz, et al., State Engagement in Electric Distribution System Planning, U.S. Department of Energy’s Grid Modernization Laboratory Consortium, December 2017, link, iii.

4-12 | ENERGY STORAGE IN MARYLAND
• Current Distribution Assessment, consisting of an evaluation of current feeder and substation reliability, condition of grid assets, asset loading and operations is needed along with a comparative assessment of current operating conditions against prior forecasts of load and adoption of distributed generation.
• Hosting Capacity, which is analysis to define a baseline of the maximum amount of distributed generation the existing distribution grid (feeder through substation) can absorb without requiring infrastructure upgrades.
• Annual Long-term Distribution Planning, consisting of multiple scenario-based studies of distribution grid impacts to identify any necessary grid updates, and the identification of solutions such as potential operational changes, infrastructure replacement, and non-wires alternatives.
• Interconnection Studies, defined as engineering studies to determine whether individual or multiple distributed generation facilities can be safely connected to the distribution grid.
• Resource and Transmission Planning, where distribution planning is conducted in conjunction with transmission and integrated resource planning to realize a collective view of system needs.
• Locational Net Benefits Analysis, where the ability and value of distributed generation to provide grid services is assessed by locality, net of infrastructure or operational costs that may be incurred.
• Sourcing DER-provided Services: Some states are currently establishing distribution markets to allow distributed generation to provide services in lieu of certain utility distribution capital investments and operational expenses, such as distribution capacity deferral, steady-state voltage management, transient power quality, reliability and resiliency, and distribution line loss reduction.
• Distribution Investment Roadmap is the creation of a plan to guide the pace and implementation of distributed generation over time.38
Approximately 16 states are implementing at least one element of integrated distribution planning or have proceedings underway to consider integrated distribution planning. Of these, five states (California, Hawaii, Massachusetts, Minnesota, and New York) are the furthest along, having adopted several of the advanced elements of integrated distribution planning, as indicated above in Figure 4-2. (See Appendix D for descriptions distribution system planning in California and New York.) The remaining 11 states, including Maryland, have either statutory or regulatory requirements for integrated distribution planning in place, or are considering them. Table 4-7 depicts a non-comprehensive list of state activities by individual element of integrated distribution planning, divided between the five states that are at a more advanced stage and other states that are just getting underway. Maryland is referenced as having a Maryland PSC requirement for long-term distribution or grid modernization plans and having requirements for storm hardening.

4-13ENERGY STORAGE POLICIES AND INITIATIVES IN OTHER STATES |
STATES WITH ADVANCED PRACTICES OTHER STATE APPROACHES
CA HI MA MN NY DC FL IL IN MD MI OH OR PA RI WI
Statutory requirement for long-term distribution plans or grid modernization plans
✔ ✔ ✔
Commission requirement for long-term distribution plans or grid modernization plans[a]
✔ ✔ ✔ ✔
No planning requirements yet, but proceeding underway or planned
✔ ✔ ✔ ✔
Voluntary filing of grid modernization plans ✔ ✔ ✔
Non-wires alternatives analysis and procurement requirements[b]
✔ ✔ ✔
Hosting capacity analysis requirements ✔ ✔ ✔ ✔
Locational net benefits analysis required ✔ ✔
Smart grid plans required ✔
Required reporting on poor-performing circuits and improvement plans
✔ ✔ ✔ ✔ ✔
Storm hardening requirements ✔ ✔
Table 4-7. State Electric Distribution Planning Activities[a] For one or more utilities.
[b] Other states are also active with non-wires alternative analysis, including Maine, New Hampshire, and Vermont. Additionally, the Bonneville Power Administration, a federal power marketing administration, conducts non-wires alternatives analysis in the Northwestern U.S.
Source: Adapted from Juliet Homer, Alan Cooke, and Lisa Schwartz, et al., State Engagement in Electric Distribution System Planning, U.S. Department of Energy’s Grid Modernization Laboratory Consortium, December 2017, link, iv.

4-14 | ENERGY STORAGE IN MARYLAND
As a precursor to long-term distribution planning, a small number of states are engaged with non-wires alternatives (NWAs) for either transmission, distribution, or both. NWAs are actions intended to defer or eliminate the need for utility transmission and distribution investments. Examples of NWA projects include front-of-the-meter (FOM) and BTM DER and energy storage, and operational practices such as conservation voltage reduction. There are over 130 NWA projects in operation or being planned, representing almost 2 GW of capacity. Four states account for 95 percent of the NWA capacity: New York, Oregon, Vermont, and California.39
4.6. ConclusionStates are renowned for being the “laboratories of democracy,” and at least with energy storage, states are playing their traditional role of experimenting with several policy initiatives. Many of these initiatives are relatively recent or are in progress, but states undoubtedly will take the lessons learned from these initiatives and incorporate them into new or revised policy initiatives.
4.7. Key Takeaways1. At least ten states offer financial incentives
for storage or a storage target for utilities to meet. The majority of these ten states use grants and/or loans as their preferred financial incentive, followed by four states that utilize rebates for storage.
2. Maryland is the only state currently to offer state tax credits for storage.
3. Five states have a storage target, with requirements varying by state such as the size of the target, required compliance entities, and how much utility ownership is permitted.
4. At least 16 states are conducting comprehensive reviews of their distribution system planning processes, and the role of DERs (including storage) in such planning.
5. New planning processes may include: analyzing available capacity to host DERs on specific feeders, assessing the locational net benefits for DERs and storage, and preparing distribution investment roadmaps.

4-15ENERGY STORAGE POLICIES AND INITIATIVES IN OTHER STATES |
Endnotes1 Charles Kubert and Mark Sinclair, Distributed Renewable Energy Finance and Policy Toolkit, Clean Energy States Alliance, December 2009,
https://cesa.org/assets/Uploads/CESA-renewableenergy-FinancePolicy-toolkit2009.pdf.
2 Autumn Proudlove, Brian Lips, David Sarkisian, and Achyut Shrestha, 50 states of Grid Modernization: Q3 2017 Quarterly Report, North Carolina Clean Energy Technology Center, November 2017.
3 California Public Utilities Commission (CPUC), Self-Generation Incentive Program Handbook, December 18, 2017, https://www.pge.com/pge_global/common/pdfs/solar-and-vehicles/your-options/solar-programs/self-generation-incentive-program/SGIP-Handbook.pdf, 42-46.
4 CPUC, “Self-Generation Incentive Program,” http://www.cpuc.ca.gov/sgip/.
5 New Jersey Board of Public Utilities (NJ BPU) Office of Clean Energy, Renewable Energy Incentive Program (REIP) – Fiscal Year 2015, October 23, 2014, http://www.njcleanenergy.com/files/file/Renewable_Programs/EnergyStorage/FY2015_Renewable_Electric_Storage_Solicitation_FINAL_%20with_Appendices_A-E_10_9_14.pdf, 6.
6 CPUC, Self-Generation Incentive Program Handbook, 30.
7 NJ BPU, REIP – Fiscal Year 2015, 8.
8 CPUC, Self-Generation Incentive Program Handbook, 18-19.
9 NJ BPU, REIP – Fiscal Year 2015, 19.
10 Ibid., 8.
11 Ibid., 6.
12 CPUC, Self-Generation Incentive Program Handbook, 41.
13 Ibid.
14 Charles Kubert and Mark Sinclair, Distributed Renewable Energy Finance.
15 United States Environmental Protection Agency, Energy and Environment Guide to Action, 2015, https://www.epa.gov/sites/production/files/2015-08/documents/guide_action_full.pdf, 3-8.
16 Charles Kubert and Mark Sinclair, Distributed Renewable Energy Finance.
17 New Jersey Economic Development Authority (NJEDA), New Jersey Energy Resilience Bank Grant and Loan Financing Program Guide, August 8, 2017, http://www.njeda.com/pdfs/ERB/ERB-Program-Guide-8_25_17.aspx, 10.
18 Ibid.
19 MEA, “Energy Storage Systems Income Tax Credit Program,” August 3, 2017, http://news.maryland.gov/mea/2017/08/03/energy-storage-systems-income-tax-credit-program/.
20 Charles Kubert and Mark Sinclair, Distributed Renewable Energy Finance.
21 Nevada State Legislature, Senate Bill No. 204, Requires the Public Utilities Commission of Nevada to investigate and establish a requirement for certain electric utilities to procure energy storage systems under certain circumstances. (BDR 58-642), February 22, 2017, https://www.leg.state.nv.us/Session/79th2017/Bills/SB/SB204.pdf.
22 Andy Colthorpe, “New Jersey’s approval of 2GW energy storage target applauded,” Energy Storage News, May 24, 2018, https://www.energy-storage.news/news/new-jerseys-approval-of-2gw-energy-storage-target-applauded.
23 CPUC, Resolution E-4909: Authorizing PG&E to Procure Energy Storage or Preferred Resources to Address Local Deficiencies and Ensure Local Reliability, January 11, 2018, http://docs.cpuc.ca.gov/PublishedDocs/Published/G000/M205/K280/205280070.PDF.
24 MA DOER, State of Charge, xvi.
25 MA EOEEA, “Baker-Polito Administration Sets 200 Megawatt-Hour Energy Storage Target.”
26 Public Utility Commission of Oregon (PUC), “Guidelines and Requirements Adopted to Implement HB 2193,” December 28, 2016, http://apps.puc.state.or.us/orders/2016ords/16-504.pdf, 1.
27 CPUC, “Order Instituting Rulemaking D.13-10-040,” https://www.sce.com/wps/wcm/connect/435ea164-60d5-433f-90bc-b76119ede661/R1012007_StorageOIR_D1310040_AdoptingEnergyStorageProcurementFrameworkandDesignProgram.pdf?MOD=AJPERES, 71.

4-16 | ENERGY STORAGE IN MARYLAND
28 MA EOEEA, “Baker-Polito Administration Sets 200 Megawatt-Hour Energy Storage Target.”
29 Oregon PUC, “Guidelines and requirements adopted to implement to HB 2193,” 3-4.
30 CPUC, “Order Instituting Rulemaking D.13-10-040,” 35.
31 Massachusetts CEC, “(ACES) Program,” 1.
32 Oregon PUC, “Guidelines and requirements adopted to implement to HB 2193,” 3-4.
33 Massachusetts CEC, “(ACES) Program,” 2.
34 CPUC, “Order Instituting Rulemaking D.13-10-040,” 35.
35 Ibid., 51.
36 MA EOEEA, “Baker-Polito Administration Sets 200 Megawatt-Hour Energy Storage Target,” 2.
37 Oregon PUC, “Guidelines and requirements adopted to implement to HB 2193,” 5-6.
38 Julie Homer, Alan Cooke, and Lisa Schwartz, et al., State Engagement in Electric Distribution System Planning, U.S. Department of Energy’s Grid Modernization Laboratory Consortium, December 2017, https://emp.lbl.gov/sites/default/files/state_engagement_in_dsp_final_rev2.pdf.
39 Daniel Muñoz-Álvarez, Non-Wires Alternatives Projects, GTM Research, June 2017, https://www.vermontspc.com/library/document/download/5936/GTMR_-_Non-Wires_Alternatives_Projects.pdf, accessed March 2018. (Note: link has since been removed from website.)

4-17ENERGY STORAGE POLICIES AND INITIATIVES IN OTHER STATES |
Table 4-3 Endnotes 1 Ibid., 9, 10, 19, 24, 26, 29, 40.
2 CPUC, Self-Generation Incentive Program, 2017-2019 Budgets.
3 Nevada Public Utilities Commission (PUCN), Proposed Regulation, Docket No. 17-08021, January 22, 2018, http://pucweb1.state.nv.us/PDF/AxImages/DOCKETS_2015_THRU_PRESENT/2017-8/27035.pdf.
4 NJ BPU, REIP – Fiscal Year 2015, 5, 7, 9.
5 Will Thorne, “New Jersey’s Energy Storage Incentive,” SOLSYSTEMS, February 29, 2016, https://www.solsystems.com/blog/2016/02/29/new-jerseys-energy-storage-incentive/.
6 NJ BPU, New Jersey’s Clean Energy Program, “Renewable Electric Storage – Program Status,” http://www.njcleanenergy.com/storage.
7 ConEdison, Technical Data Requirements for the 2019 Demand Management Program, January 26, 2018, https://www.coned.com/-/media/files/coned/documents/save-energy-money/rebates-incentives-tax-credits/demand-management-incentives/technical-requirements-2019.pdf?la=en.
Table 4-4 Endnotes1 Maryland Energy Administration (MEA), “Maryland Energy Administration Announces New Game Changers Program,” September 20, 2016,
http://news.maryland.gov/mea/2016/09/20/maryland-energy-administration-announces-new-game-changers-program/.
2 MEA, “Funding Opportunity Announcement (FOA) 5.0: GAME CHANGERS PROGRAM,” September 2016, http://energy.maryland.gov/Business/Documents/GameChangers_FOA.pdf, 1.
3 Database of State Incentives for Renewables & Efficiency (DSIRE), “Game Changer Competitive Grant Program,” November 20, 2015, http://programs.dsireusa.org/system/program/detail/5559.
4 MEA, Maryland Strategic Energy Investment Fund: Report on Fund Activities FY 2017, http://energy.maryland.gov/Documents/2017%20Maryland%20Strategic%20Energy%20Investment%20Energy%20Fund%20Report%20FINAL.pdf, 12.
5 California Energy Commission, “Frequently Asked Questions about the Electric Program Investigation Charge Program (EPIC),” http://www.energy.ca.gov/research/epic/faq.html; and EPIC Proposed 2018-2020 Triennial Investment Plan, April 28, 2017, http://www.energy.ca.gov/research/epic/17-EPIC-01/.
6 Connecticut Department of Energy & Environmental Protection (CT DEEP), “Instructions for Completing a Microgrid Program Funding Application,” September 14, 2017, http://www.dpuc.state.ct.us/DEEPEnergy.nsf/c6c6d525f7cdd1168525797d0047c5bf/4f41cd7bd11a705f8525816f0066c478/$FILE/9-14-17%20FINAL%20Round%204%20APPLICATION%20instructions.pdf, 1, 9, 11, 18.
7 CT DEEP, “DEEP Accepting Applications for Microgrid Projects Grants and Loans Available to Provide Power to Critical Facilities,” August 3, 2017, http://www.ct.gov/deep/cwp/view.asp?Q=595114&A=4918.
8 State of Connecticut, Substitute Senate Bill No. 23, Public Act No. 12-148, https://www.cga.ct.gov/2012/ACT/Pa/pdf/2012PA-00148-R00SB-00023-PA.pdf.
9 CT DEEP, “Instructions for Completing a Microgrid Program Funding Application,” 1-2.
10 Massachusetts Executive Office of Energy and Environmental Affairs (MA EOEEA), “Baker-Polito Administration Sets 200 Megawatt-Hour Energy Storage Target,” June 30, 2017, http://www.mass.gov/eea/pr-2017/doer-sets-200-megawatt-hour-energy-storage-target.html.
11 Massachusetts Clean Energy Center (MA CEC), “Advancing Commonwealth Energy Storage (ACES) Program – Request for Proposals,” March 9, 2017, http://files.masscec.com/Advancing%20Commonwealth%20Energy%20Storage%20%28ACES%29%20RFP%202017.pdf, 1.
12 Commonwealth of Massachusetts, “Baker-Polito Administration Awards $20 Million for Energy Storage Projects,” December 7, 2017, https://www.mass.gov/news/baker-polito-administration-awards-20-million-for-energy-storage-projects.
13 Peter Maloney, “Six months after target adoption, Massachusetts sees energy storage growth, challenges,” Utility Dive, January 23, 2018, https://www.utilitydive.com/news/6-months-after-target-adoption-massachusetts-sees-energy-storage-growth-c/515353/.

4-18 | ENERGY STORAGE IN MARYLAND
14 Massachusetts Department of Energy Resources (MA DOER), “CCERI Previous Grant Awards,” https://www.mass.gov/service-details/cceri-previous-grant-awards.
15 MA DOER, “Community Clean Energy Resiliency Initiative (CCERI) Round 3 Grant Awards,” https://www.mass.gov/service-details/community-clean-energy-resiliency-initiative-cceri-round-3-grant-awards.
16 MA DOER, “Community Clean Energy Resiliency Initiative: Round 1 Project Implementation Awards,” https://www.mass.gov/files/2017-07/project-implementation-application-summary.pdf.
17 MA DOER, “Community Clean Energy Resiliency Initiative: Round 2 Project Implementation Awards,” https://www.mass.gov/files/2017-07/project-implementation-application-summary-round-2.pdf.
18 New Jersey Economic Development Authority (NJEDA), New Jersey Energy Resilience Bank, “Our Mission,” http://www.njeda.com/erb/erb-(1).
19 State of New Jersey Department of Environmental Protection, “New Jersey Energy Resilience Bank: Sustainable Business Initiative,” October 31, 2014, http://www.nj.gov/dep/sage/docs/sbi20141031-nj-energy-resilience-bank.pdf, 1, 8, 15.
20 NJEDA, New Jersey Energy Resilience Bank, “ERB FUNDING: HOSPITALS AND RELATED HEALTHCARE FACILITIES,” April 12, 2016, http://www.njeda.com/pdfs/ERB/ERB_Hospitals_Funding_Program_Guide_4_21_16.aspx, 1, 3-4.
21 NJEDA, New Jersey Energy Resilience Bank, “Our Mission.”
22 New York State Energy Research & Development Authority (NYSERDA), “NY Prize Community Grid Competition Request for Proposal (RFP) 3044,” April 2015, https://www.nyserda.ny.gov/-/media/Files/FO/Closed-Opportunities/2015/3044summary.pdf.
23 NYSERDA, “NY Prize Community Grid Competition – Stage 2, Request for Proposal (RFP) 3044.”
24 NYSERDA, “Governor Cuomo Announces $11 Million Awarded for Community Microgrid Development Across New York,” March 23, 2017, https://www.nyserda.ny.gov/About/Newsroom/2017-Announcements/2017-03-23-Governor-Cuomo-Announces-11-Million-Awarded-for-Community-Microgrid-Development.
25 NYSERDA, “Competition Structure,” https://www.nyserda.ny.gov/All-Programs/Programs/NY-Prize/Competition-Structure.
26 NYSERDA, “Awarded Feasibility Studies,” https://www.nyserda.ny.gov/All-Programs/Programs/NY-Prize/Opportunity-Zones-Map.
27 NYSERDA, “Funding Opportunity Detail, Energy Storage – Product Development (PON 3585),” https://portal.nyserda.ny.gov/servlet/servlet.FileDownload?file=00Pt0000007X58fEAC.
28 Andy Colthorpe, “NYSERDA’s US$6.3m funding for commercial development of energy storage technologies,” Energy Storage News, June 22, 2017, https://www.energy-storage.news/news/nyserdas-us6.3m-funding-for-commercial-development-of-energy-storage-techno.
29 NYSERDA, “Demonstrating Distributed Energy Storage for ‘Stacking’ Customer and Grid Values Program Opportunity Notice (PON) 3541,” May 31, 2017, https://portal.nyserda.ny.gov/CORE_Solicitation_Detail_Page?SolicitationId=a0rt0000000QoO1AAK.
30 Ibid.
31 Julian Spector, “The Best News Yet for Energy Storage in New York,” Greentech Media, January 10, 2018, https://www.greentechmedia.com/articles/read/new-york-storage-industry-cash-target#gs.pL4U=mQ; and New York Green Bank, Clean Energy Financing Arrangements Request for Proposals, May 2017, https://portal.greenbank.ny.gov/servlet/servlet.FileDownload?file=00Pt0000005Hfo5EAC.
32 NYSERDA, “Governor Cuomo Announces $11 Million…”
33 NYSERDA, Clean Energy Fund Investment Plans: Energy Storage Chapter, revised November 1, 2017, https://www.nyserda.ny.gov/About/Clean-Energy-Fund.
34 Oregon Department of Energy, “Energy Storage,” http://www.oregon.gov/energy/energy-oregon/Pages/Energy-Storage.aspx.
35 Office of the Governor, Washington, “State pursues new smart grid projects to capture, store more solar and wind power,” July 8, 2014, http://www.governor.wa.gov/news-media/state-pursues-new-smart-grid-projects-capture-store-more-solar-and-wind-power.
36 Washington State Department of Commerce, “Clean Energy Fund,” http://www.commerce.wa.gov/growing-the-economy/energy/clean-energy-fund/.

4-19ENERGY STORAGE POLICIES AND INITIATIVES IN OTHER STATES |
Tabe 4-5 Endnotes1 General Assembly of Maryland, “Senate Bill 758, Income Tax Credit – Energy Storage Systems,” http://mgaleg.maryland.gov/2017RS/bills/sb/
sb0758e.pdf.
2 Julian Spector, “Maryland Passes First-of-a-Kind Tax Credit for Residential and Commercial Storage,” Greentech Media, April 12, 2017, https://www.greentechmedia.com/articles/read/maryland-passes-tax-credit-for-residential-and-commercial-energy-storage#gs.znHiam0.
3 Michael Vinci, “Maryland’s Energy Storage Tax Credit: Gaining Momentum Across America?,” Renewable Energy World, April 19, 2017, http://www.renewableenergyworld.com/articles/2017/04/maryland-s-energy-storage-tax-credit-gaining-momentum-across-america.html.
Table 4-6 Endnotes1 Arizona Corporation Commission, “APS and RUCO Joint request for review,” Docket No. L-00000D-14-0292-00169, September 26, 2014,
http://images.edocket.azcc.gov/docketpdf/0000156123.pdf.
2 CPUC, “Order Instituting Rulemaking to Integrate and Refine Procurement Policies and Consider Long-Term Procurement Plans,” D.14-03-004, March 13, 2014.
3 CPUC, “More Information on Authorizing Procurement,” http://www.cpuc.ca.gov/General.aspx?id=9148.
4 CPUC, “Order Instituting Rulemaking D.13-10-040,” 73-76, Appendix A, 2.
5 MA DOER, State of Charge.
6 Ibid.
7 MA EOEEA, “Baker-Polito Administration Sets 200 Megawatt-Hour Energy Storage Target.”
8 John F. McKeon, Nancy J. Pinkin, et al., “Act 3723”, April 5, 2018, http://www.njleg.state.nj.us/2018/Bills/A4000/3723_S1.PDF.
9 Julian Spector, “The Best News Yet for Energy Storage in New York.”
10 Oregon PUC, “Guidelines and requirements adopted to implement HB 2193,” 1, 8.
11 Portland General Electric, “PGE submits storage plan to Oregon Public Utilities Commission,” November 1, 2017, https://www.portlandgeneral.com/our-company/news-room/news-releases/2017/11-01-2017-pge-submits-storage-plan-to-opuc.
12 Pacific Power, UM 1857 – PacifiCorp’s Revised Draft Storage Potential Evaluation and Draft Storage Project Proposals, December 29, 2017, http://edocs.puc.state.or.us/efdocs/HAH/um1857hah142659.pdf.

4-20 | ENERGY STORAGE IN MARYLAND

5-1OPTIONS AND DISCUSSION |
This section presents numerous options available to Maryland, on both regulatory and legislative fronts, to increase the use of storage in the state. It also highlights key changes that PJM could make to increase the use of storage in the region. Together, these options represent the actions most frequently raised during discussions with industry, agency, and non-governmental organization (NGO) representatives and in the literature PPRP reviewed.
A combination of factors influences the suitability of approaches used elsewhere, such as a state’s generation resource mix and regulatory structure. While solar has nearly tripled in Maryland since 2015, and Maryland is in the top quartile of states for solar deployment, wind and solar currently make up a very small portion of the generation mix in Maryland. This is in part due to the fact that most of the wind used to fulfill Maryland’s renewable energy portfolio standard comes from other states. This minimizes the need for flexible resources such as storage to integrate variable wind and solar generation. Also, Maryland is not facing certain pressures that other states are grappling with, such as potential resource shortages and high demand charges. Finally, unlike states where utilities remain vertically integrated, the primary responsibility for generation and transmission planning/review lies with PJM. Maryland is most able to facilitate energy storage at the distribution and customer level. The options most relevant to Maryland fall into three basic categories:
1. Removing barriers to storage by updating rate designs and regulations;
2. Supporting storage through targets and/or incentives; and
3. Taking a more active role in overseeing distribution system planning.
There is widespread agreement that it is important to update or adapt rate designs and regulations, such as interconnection protocols, that pre-date the rise of storage and may hinder utilities, third-party project developers, and customers from deploying storage systems or utilizing them fully to reduce customer and grid costs. Unless otherwise noted, these actions can be considered near-term priorities. Once regulatory reform has progressed, it will greatly enhance the ability of incentive and targets to increase the use of energy storage in the state. The Public Conference 44 (PC 44) Storage, Interconnection, and Rate Design Work Groups are each addressing key barriers to energy storage by recommending pilot projects and revisions to the Code of Maryland Regulations (COMAR). These efforts are reflected in the discussion below.
Other options, such as targets or financial incentives, are available to more actively promote storage should policymakers in Maryland wish to take these steps. There is considerably more division among stakeholders in Maryland as to whether such measures are necessary. There are several arguments for focusing on regulatory reforms first:
• It would be inefficient and may be unnecessarily costly to spur storage deployment before regulations and rates have been updated.
5. OPTIONS AND DISCUSSION
5-2 | ENERGY STORAGE IN MARYLAND
• Once barriers have been addressed, market forces should drive storage deployment when and where it is cost-effective. If not, Maryland can take action at a later date.
• Maryland can learn from other states that are promoting storage.
Likewise, there are several arguments for pursuing reforms and promoting storage simultaneously:
• There is no substitute for “learning-by-doing.” Targets and incentives help states learn how best to use storage.
• In the long run, Maryland will benefit from helping, albeit modestly, to increase the market for storage and push storage down the cost-curve.
• Targets and incentives can catalyze projects that are cost-effective (if system-wide savings are taken into account) just as EmPOWER Maryland projects avoid more costs than they incur.
It is critically important to note that the degree of system benefits (or public benefits) available from storage depends on a host of factors, including timing; prior investments (in storage and other electric power infrastructure); market prices for energy, capacity, and ancillary services; and the composition of the industry in the state (which affects the value of resiliency). These factors dictate that before any major program or major program elements are settled upon, a cost-benefit analysis should be conducted, just as cost-benefit analysis is employed for EmPOWER Maryland programs.
Differences of opinion also exist among stakeholders with regard to devoting resources to increasing Maryland oversight of distribution system planning. Some view such oversight as unnecessarily burdensome, both for utilities and public utility commissions. Others view such oversight as an important way for states to encourage due consideration of distributed energy resources, including storage, as potential grid assets.
These considerations should be kept in mind when reviewing the options summarized below and discussed more in-depth in the remainder of Chapter 5.
5.1. Options OverviewRegulatory and Rate Design Updates1. Utility ownership and cost recovery –
Determining whether utilities may own behind-the-meter (BTM) and/or front-of-the-meter (FOM) storage that participates in wholesale markets will eliminate a major source of uncertainty for utilities and third-party project developers. The PC 44 Energy Storage Work Group (Storage WG) leader laid groundwork for this step by producing a memorandum on the legal aspects of utility ownership of FOM storage and exploring possible hybrid ownership options (see Chapter 3 and Appendix A). If Maryland ultimately permits utilities to own and use storage for purposes other than as a distribution system asset, then steps may need to be taken to promote a competitive marketplace, where utilities, third parties, and customers have ample opportunities to procure storage resources and provide storage-based services. Either the General Assembly or the PSC will need to resolve these questions.

5-3OPTIONS AND DISCUSSION |
2. Interconnection processes – Standardizing and streamlining the interconnection process for distributed energy resources (DERs), including storage, will make BTM storage more attractive to customers and to companies that develop residential and commercial storage projects. At a rulemaking session (RM61) in April 2018, the PSC adopted several changes that had been proposed by the PC 44 Interconnection Work Group (Interconnection WG). The WG is considering several additional concepts that are specific to storage in Phase II of its efforts, which is not forecast to end until 2019. These changes include allowing net capacity (as opposed to aggregated gross capacity) to be used when an interconnection study is being conducted, which could lower the cost of interconnections. Also, allowing small levels of inadvertent export from storage devices would allow energy storage devices to be more fully utilized.i However, these changes raise reliability concerns that the Interconnection WG is also considering.
3. Multi-use protocols – Enabling customers to use BTM storage not only for their own benefit but also to provide services to utilities and PJM will maximize the value of these systems to the grid. Together, with the state’s utilities and PJM, the PSC could develop standard protocols for how such systems should be metered, controlled, and serviced. As best practices and protocols for storage O&M emerge, utilities could create a set of guidelines for government agencies and other customers to use with third-party storage providers. The PSC and the state’s utilities could also develop protocols for communicating with and dispatching BTM
i Inadvertent exports occur when customer load drops suddenly and a storage device cannot ramp down energy discharges as quickly. If such exports are penalized, storage owners may be reluctant to use their storage devices to follow load closely.
systems, via a third-party aggregator, to provide utility services. Such protocols could likely be adapted for individual BTM storage devices.
4. TOU electricity rates – Promoting rate designs that reflect the time-varying costs of generating and delivering electricity will incentivize and reward storage owners for shifting their consumption patterns to benefit the grid. The PC 44 Rate Design Work Group (Rate Design WG) has proposed a two-year, time-of-use (TOU) rate design pilot project for both for utility distribution and supply for residential customers. If this pilot is given a favorable evaluation, the PSC could require that customers with storage be served under TOU rates. However, it is understood that many residential customers cannot adjust their consumption to avoid peak hours. For such customers, a mandatory TOU tariff would result primarily in higher electricity costs, not grid benefits. Over the longer term, and in accordance with any evolution in distribution system planning, the PSC and utilities may work together to create more granular time- and (perhaps) location-based rates to address specific grid needs.
5. Net metering – Clarifying how net metering applies to storage will pave the way for customers with PV to adopt storage. For example, other states have specified that net metering applies to stored energy that was generated by on-site PV, but not energy that was drawn from the grid. The Rate Design WG is also planning to work on a TOU rate design pilot project specifically for net-metered customers. It may make

5-4 | ENERGY STORAGE IN MARYLAND
sense to hold off on making any changes to net metering, or creating a next-generation incentive, until the results of this pilot project are known.
6. Battery safety – Updating building and fire codes to address the siting of large-scale batteries will help to avoid site-specific reviews and unnecessary confusion. Though these codes fall under the purview of local authorities throughout the state, they could benefit from state guidance. The General Assembly could designate a state agency to assist local authorities by gathering suitable boilerplate language from storage project developers and manufacturers. The same agency could also provide boilerplate language for the responsible decommissioning of battery projects.
Policy Options7. Targets – Setting a storage-related target
may prompt market creation and enable a wide range of market participants to “learn by doing.” Cost-benefit modeling can be used to identify a “no regrets” target level, or smaller targets can be set on the assumption that costs would be minimal and the results would inform future policy choices. Questions of utility ownership would need to be addressed in conjunction with setting a target or explored further within the context of a target.
8. “Bridge” incentives – Offering rebates, grants, and/or tax incentives may provide temporary support for storage, assuming that costs continue to fall and some combination of new rates, regulations and policy initiatives take effect. Several current or previously proposed programs run by the state’s utilities and MEA could be expanded, extended, or launched
to promote storage. (Note that the General Assembly might need to authorize specific changes to programs to include storage.) Pairing incentives with price signals (such as TOU rates) can help to encourage customers to modify their consumption patterns in ways that benefit the grid.
9. Financing – Lowering the cost of financing may help advanced energy storage compete with more mature technologies. Maryland can help to attract third-party financing indirectly by providing enough revenue streams to reduce the risk of innovative storage investments. In addition, independent or state-led loan programs could be created or expanded to provide funding at favorable interest rates or with better terms than standard loans with market-based interest rates and terms.
Planning10. Distribution system planning – By
taking a more active role in overseeing distribution system planning, the PSC may be able to promote the consideration of storage as a grid asset and foster the growth of distributed resources, including storage. However, there are also significant operational/regulatory costs to requiring pre-investment reviews. To minimize the burden on regulators and utilities, this effort could focus on system upgrades above a specified cost threshold. For example, the PSC could require that when utilities are considering such upgrades, they make an informational filing that contains a brief project description and rationale. The filing would not require approval by the PSC, but rather give the PSC an opportunity to request more information, if desired. Alternatively, the PSC could require that utilities conduct a formal analysis of

5-5OPTIONS AND DISCUSSION |
“non-wires alternatives.” Several other states, including California, Maine, New Hampshire, New York, and Vermont, now require such analyses.
PJM-level Reforms11. Wholesale markets and transmission
planning – Enabling storage to participate more fully in PJM’s wholesale markets (including its capacity market) could increase storage revenue opportunities and improve grid system efficiency. In addition, storage could be used to defer transmission line upgrades, increasing opportunities for storage deployment. With input from MEA, the PSC could work with PJM to seek market and transmission planning reforms. The PSC (as well as MEA) could also encourage PJM to reform its load forecasting methodology, which relies heavily on historical load data that often predates successful peak-shaving programs in Maryland and other states. This arguably inflates the requirements that PJM places on individual utilities to make capacity purchases in order to ensure their system loads can be met. Since PJM is in the process of developing plans to comply with FERC Order 841, comments to PJM about the ability of energy storage to participate more fully in wholesale markets are time-sensitive.
5.2. Regulatory and Rate Design Updates
Utility Ownership/Cost RecoveryIt is vital that either the General Assembly or the PSC resolve the questions that exist regarding utility ownership of storage systems. Specifically, Maryland needs to decide whether it
ii Steps may need to be taken to comply with PUA §7-505(b)(3), §7-505 (b)(10)(iii), and §7-509 (a)(1).
is legal and appropriate for the state’s regulated utilities to rate base, own, and operate energy storage for uses outside of their state-granted monopoly franchise. As a starting point, the PSC could clarify whether, within the COMAR, storage should be treated as generation, not treated as generation, or have its treatment based on what function the storage is providing. The Storage WG has prepared a memorandum summarizing legal viewpoints on these matters (see Appendix A).
As noted in the discussion of utility ownership in Chapter 3, two other deregulated states, New York and Massachusetts, have recently authorized and encouraged utility ownership of storage without explicitly addressing questions of wholesale market participation. If Maryland decides to allow utilities to own and use storage for purposes other than distribution system asset, then the focus will likely shift to ensuring a competitive marketplace where utilities, third parties, and customers have the ability to procure storage/provide storage-based services and the most cost-effective solutions are pursued.ii During the course of PC 44 discussions and conversations specific to this report, numerous industry and agency representatives suggested steps that the state could take to foster this environment. They are summarized here with respect to both FOM and BTM storage.
Front of the Meter
Beyond the fundamental questions about utility ownership discussed earlier, two concerns have been raised regarding utility ownership of front-of-the-meter storage. First, because the energy storage marketplace is diverse and rapidly changing, utilities seeking to use storage

5-6 | ENERGY STORAGE IN MARYLAND
to improve grid reliability or efficiency may not anticipate the type of storage resource that would be most cost-effective. Thus, an internal procurement process might result in a suboptimal choice. Second, utilities might have a competitive advantage over third parties in wholesale markets, since regulated utilities receive cost recovery plus an authorized rate of return on the asset. Each of the suggestions below addresses one of these concerns.
• Competitive RFPs – The PSC could require utilities to issue an all-source RFP when they are seeking to procure a storage asset whose cost exceeds a threshold (that would be determined through stakeholder dialogue). Third-party developers would have the chance to propose solutions and, ideally, the most cost-effective solution would then be selected.1 The Joint Utilities note that they must demonstrate the prudency of all their investments during a rate case. Creating a special RFP requirement solely for storage might serve as a disincentive to using storage in lieu of a traditional approach.2
• Bill Credits / Reduced Revenue Requirements – The Federal Energy Regulatory Commission (FERC) recently issued a policy statement regarding the use of storage to provide both cost-based services (as transmission assets) and wholesale, market-based services. FERC noted that concerns were raised that such projects could have an adverse impact on wholesale markets. However, FERC stated, “We do not share commenters’ concerns and are not convinced that allowing such arrangements will adversely impact other market competitors.” FERC recommended two possible solutions: either crediting
iii There are also legal issues and case law related to a regulated utility’s ability to own BTM assets.
iv Note that the PSC has yet to determine whether utilities in Maryland may own microgrids. See Chapter 3.
market revenues back to ratepayers or using market revenues to reduce a utility’s revenue requirement for a given storage asset.3 The PSC could oversee the development of an analogous process for distribution assets that generate market-based revenues and/or receive lease payments from third parties. Note that in regions where utilities remain vertically integrated, such as CAISO and SPP, utilities frequently credit revenue from utility-owned generation back to customers.
Behind the Meter
Utility ownership of BTM storage poses additional challenges to competition.iii Utilities have direct access to customers and customer data, which is extremely useful for identifying good candidates for storage. Utilities also control the interconnection process for BTM systems and determine potential upgrades that may be needed for these systems. This gatekeeper role could create potential conflicts of interest for utilities that are seeking to put storage systems in customers’ homes and businesses.4 Stakeholders have recommended several possible responses to these challenges.
• Prohibition of utility ownership, possibly with special exceptions – Utilities could be completely barred from owning BTM storage or allowed to own it only in cases where no other option viable. These cases would be limited to the following categories:
• When large-scale storage is part of a multi-customer, utility-owned microgrid;iv
• When storage is benefitting underserved populations and a competitive market to provide these services does not yet exist; or

5-7OPTIONS AND DISCUSSION |
• When storage is part of a demonstration project.5
Such a ban could be viewed as a way to ensure that third-party storage developers have opportunities to establish a foothold in Maryland, while utilities focus on front-of-the-meter applications. (Note that non-regulated utility affiliates are also free to invest in energy storage at any time.)
• Utility ownership cap / third-party ownership floor – As a less extreme approach than a total ban, the state could establish a cap on utility ownership of BTM systems or a floor on third-party ownership. This cap and/or floor could be revisited after a reasonable time period.
• Distribution service contracts – The PSC could direct the utilities to develop a “distribution services contract” that would allow storage owners or third-party aggregators to provide grid benefits to the utility at a fair market value. Such contracts could be considered for cost recovery in a utility rate case.6
• Data access and interconnection treatment – If utilities are allowed to own BTM storage, the PSC could establish rules to level the playing field between utilities and third-party providers. These rules would address providing third parties fair access to customer data and providing transparent interconnection timelines and upgrade estimates.7
Interconnection In April 2018, the PSC approved most of the updates to COMAR Section 20.50.09 that the Interconnection WG recommended during Phase I of its work (see Chapter 3). For example, energy storage was added to COMAR’s definition
of a small generator, solely for purposes of the interconnection process. Also, the PSC decided that utilities will be required to post their interconnection queues, in tabular form, on their websites as a tool for developers looking for low-cost interconnection points. In addition, the PSC could adopt storage-related provisions that were not agreed upon by the Interconnection WG. Two primary areas of ongoing discussion are described below:
• Review Requirements – The level of review that a proposed system requires is based on its capacity. The capacity of small generator projects combined with energy storage systems can either be viewed as the maximum power they could theoretically discharge (nameplate capacity) or the maximum power they are programmed to discharge (net nameplate capacity). (For example, a 50-kW system with a 15 kW battery might be programmed never to export more than 50 kW. Its nameplate capacity would be 65 kW, and its net nameplate capacity would be 50 kW.) The Interconnection WG did not agree on which method is appropriate during Phase I of its workgroup efforts. Proponents say that relying on nameplate capacity adds an unnecessary time and cost burden. Utilities counter that since they do not directly control these systems, they must consider whether/how they would be able to maintain system reliability, especially if system modifications and potential cyber threats are not well-managed by owners.
• Inadvertent Export – Small generator projects combined with energy storage systems may occasionally generate a small amount of energy for export unintentionally. This occurs

5-8 | ENERGY STORAGE IN MARYLAND
when a customer’s load drops unexpectedly and on-site generation or batteries cannot respond swiftly enough to avoid a few seconds of energy being exported to the grid. The Interconnection WG proposed that a new term, “inadvertent export,” be added to COMAR Section 20.50.09. The proposed regulation for inadvertent export would have established an acceptable limit for such exports. This would allow customers to rely on storage for a greater percentage of their on-site energy needs.8 Utilities are concerned that inadvertent exports would have negative impacts on the grid.
The Interconnection WG is revisiting these topics during Phase II of its work, envisioned to end in 2019. Meanwhile, these proposals are moving forward in other states. For instance, Xcel in Colorado and all utilities in Nevada may soon begin to base their reviews on net nameplate capacity.9 Also, utilities in California and Hawaii have adopted inadvertent export definitions.10
Multi-use ProtocolsMaryland’s utilities, the PSC, and PJM could work together to clarify how BTM systems should be metered, controlled, and serviced to provide a mix of customer, utility, and independent system operator (ISO) services. These questions are central to many potential use cases for storage and will become even more relevant as PJM takes steps to comply with FERC Order 841 by increasing the ability of BTM storage to provide services in all PJM’s wholesale markets.
A.F. Mensah, one of the most active storage project developers in Maryland to date, has been working with PJM to resolve questions about metering protocols for BTM storage providing services to PJM. In order to align state and PJM
practices, A.F. Mensah has proposed that retail customers may use their retail electric service connection to facilitate sales to PJM and their retail meters to measure wholesale transactions, with submetering as needed to measure the flow of wholesale or station energy into and out of the system. (See Appendix C for A.F. Mensah’s entire list of proposals to the Storage WG.)
Regarding system control, FERC has indicated that system owners providing services to PJM should control when their unit is charged/discharged and how much energy is discharged, in response to signals from PJM.11 This approach is not possible at the distribution level, since there are no real-time distribution markets (nor distribution market signals) to which owners could respond. The PSC may need to establish who is in control of third-party-owned storage systems providing distribution services, the owner or the utility. Either way, to maintain grid reliability, the utilities will likely need visibility into storage system activities and an override function for both charging and discharging.
The PSC and the state’s utilities could develop protocols for communicating with and dispatching BTM systems, via a third-party aggregator, to provide utility services. Such protocols could likely be adapted for individual BTM storage devices. California may also be a useful reference. The California Public Utilities Commission (CPUC) is in the process of developing a Multiple-Use Application Framework for storage that breaks down the services it can provide to “reliability” and “non-reliability,” and provides guidelines for how each type of service should be prioritized and how reliability services should be signaled for/controlled by utilities.12
As best practices emerge, either the PSC or the state’s utilities could create a set of guidelines

5-9OPTIONS AND DISCUSSION |
for interested parties, including government agencies, to use with third-party storage project developers. These guidelines would cover safety considerations, maintenance best practices, and any other matters necessary to ensure that BTM systems are available to utilities when needed.
SafetyTo avoid site-specific reviews and unnecessary confusion, building and fire codes could address the siting of batteries that are commonly used for bill management, resiliency, or (with PV) self-supply of energy.v The General Assembly could designate a state agency to assist with these efforts by coordinating with storage manufacturers and developers to provide boilerplate safety information and standards for local authorities to adopt as they update codes. This resource could include standards for the decommissioning of batteries, which is a source of concern to some stakeholders.
Rate DesignTOU Rates
The Rate Design WG’s has designed TOU pilot projects to convey the actual costs of generating and delivering electricity to residential ratepayers (see Chapter 3). Such rates can motivate and reward customers for shifting their consumption patterns, with or without the use of storage, to benefit the grid. If the pilot evaluations conclude that the new rates are viable and beneficial to customers and the grid, the PSC could work with utilities to encourage customers with storage use TOU rates. The PSC could also instruct the utilities to take steps to interest a wider portion of the public in TOU rates. It is understood, however, that many residential customers cannot adjust their consumption to avoid peak hours. For such customers, a mandatory TOU tariff would result
v On a related note, storage has yet to be incorporated into the International Green Construction Code (IGCC), which, along with Leadership in Energy and Environmental Design (LEED), guides many investments.
primarily in higher electricity costs, not grid benefits.
Demand Charges
The Rate Design WG considered and dismissed creating demand charges for residential customers. Their rationale was simple. If the demand charges were based on PJM-wide peaks in demand residential customers would not be able to anticipate these peaks and adjust their consumption accordingly. If the demand charges were based on the customer’s peak demand, minimizing this peak would still be difficult for customers and of little value to the grid. Nevertheless, voluntary residential rates with demand charges could be attractive to customers that can use storage (or in-home energy management controls) to respond to price signals. This could be an avenue for exploration via a pilot project in the future.
Net Metering
For customers who intend to use both on-site PV and storage, net metering rates and rules come into play. Under net metering, PV customers with systems <2 MW are eligible to be paid, at the retail electricity rate, for power that they generate on site and then feed back into the grid, up to 2.5 percent of electricity load in the state, or roughly 1,500 MW.
The state could clarify whether or how storage may fit into the existing net metering paradigm. For example, California has specified that energy discharged from a storage device can only qualify for net metering if the device was charged with on-site PV, not from the grid. That said, many industry representatives pointed out that net metering creates a disincentive for storage. (If PV generation and stored PV generation are
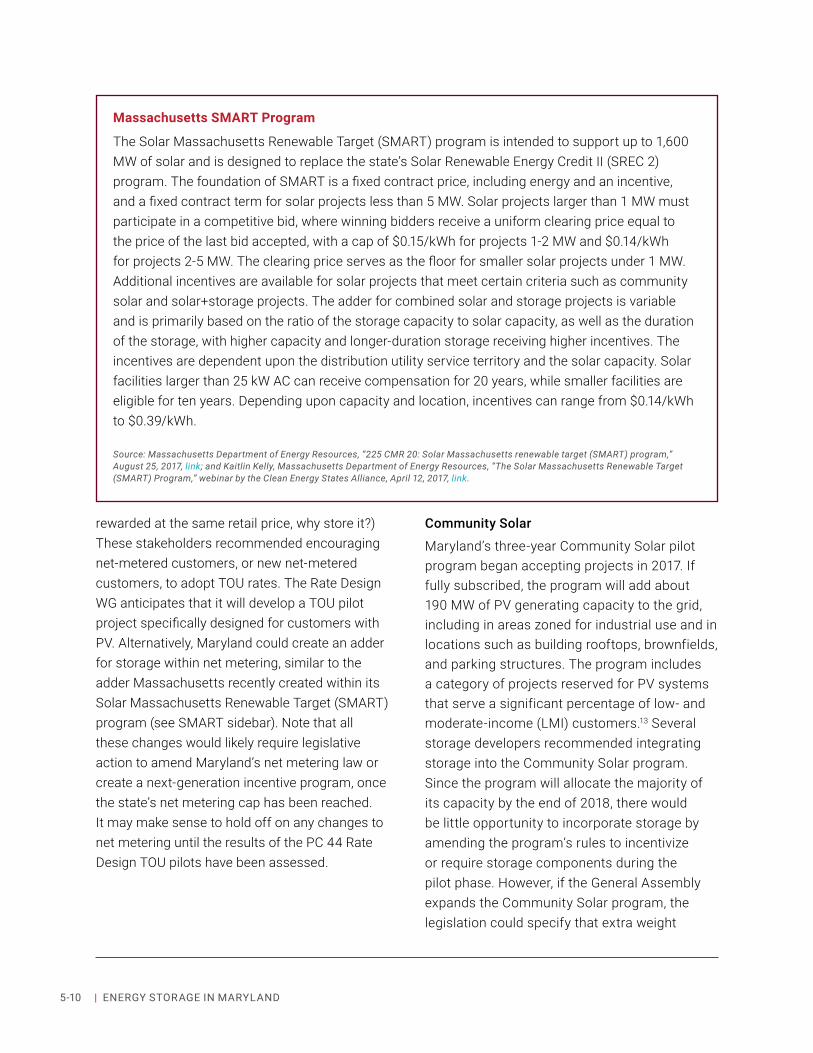
5-10 | ENERGY STORAGE IN MARYLAND
rewarded at the same retail price, why store it?) These stakeholders recommended encouraging net-metered customers, or new net-metered customers, to adopt TOU rates. The Rate Design WG anticipates that it will develop a TOU pilot project specifically designed for customers with PV. Alternatively, Maryland could create an adder for storage within net metering, similar to the adder Massachusetts recently created within its Solar Massachusetts Renewable Target (SMART) program (see SMART sidebar). Note that all these changes would likely require legislative action to amend Maryland’s net metering law or create a next-generation incentive program, once the state’s net metering cap has been reached. It may make sense to hold off on any changes to net metering until the results of the PC 44 Rate Design TOU pilots have been assessed.
Community Solar
Maryland’s three-year Community Solar pilot program began accepting projects in 2017. If fully subscribed, the program will add about 190 MW of PV generating capacity to the grid, including in areas zoned for industrial use and in locations such as building rooftops, brownfields, and parking structures. The program includes a category of projects reserved for PV systems that serve a significant percentage of low- and moderate-income (LMI) customers.13 Several storage developers recommended integrating storage into the Community Solar program. Since the program will allocate the majority of its capacity by the end of 2018, there would be little opportunity to incorporate storage by amending the program’s rules to incentivize or require storage components during the pilot phase. However, if the General Assembly expands the Community Solar program, the legislation could specify that extra weight
Massachusetts SMART Program
The Solar Massachusetts Renewable Target (SMART) program is intended to support up to 1,600 MW of solar and is designed to replace the state’s Solar Renewable Energy Credit II (SREC 2) program. The foundation of SMART is a fixed contract price, including energy and an incentive, and a fixed contract term for solar projects less than 5 MW. Solar projects larger than 1 MW must participate in a competitive bid, where winning bidders receive a uniform clearing price equal to the price of the last bid accepted, with a cap of $0.15/kWh for projects 1-2 MW and $0.14/kWh for projects 2-5 MW. The clearing price serves as the floor for smaller solar projects under 1 MW. Additional incentives are available for solar projects that meet certain criteria such as community solar and solar+storage projects. The adder for combined solar and storage projects is variable and is primarily based on the ratio of the storage capacity to solar capacity, as well as the duration of the storage, with higher capacity and longer-duration storage receiving higher incentives. The incentives are dependent upon the distribution utility service territory and the solar capacity. Solar facilities larger than 25 kW AC can receive compensation for 20 years, while smaller facilities are eligible for ten years. Depending upon capacity and location, incentives can range from $0.14/kWh to $0.39/kWh.
Source: Massachusetts Department of Energy Resources, “225 CMR 20: Solar Massachusetts renewable target (SMART) program,” August 25, 2017, link; and Kaitlin Kelly, Massachusetts Department of Energy Resources, “The Solar Massachusetts Renewable Target (SMART) Program,” webinar by the Clean Energy States Alliance, April 12, 2017, link.

5-11OPTIONS AND DISCUSSION |
be given to proposals that include both solar+storage, or an “adder” could be applied to projects that include storage.
GHG Signals
As reported in Chapter 2, California has found that BTM storage is being charged/discharged in ways that increase greenhouse gas (GHG) emissions in the state. At a kick-off workshop on this issue, it was noted that round-trip efficiency (RTE) may be “an imperfect metric for achieving GHG reductions.” The CPUC has since begun work on a GHG signal that is projected to: forecast GHG emissions by zone one day ahead, on hourly or sub-hourly increments, in a manner that is automatically transmitted to a storage system, or the remote controller of the system. This GHG signal is expected to influence when storage owners charge and discharge their systems because only systems that serve to reduce GHG emissions are eligible for California’s Self-Generation Incentive Program payments (see Chapter 5).14 It is worth monitoring this proceeding and considering the use of a GHG signal as BTM storage systems become more prevalent in Maryland.
5.3. Policy OptionsGoal-oriented PoliciesThere are several ways that Maryland could promote storage through goal-oriented policies. The state could incorporate storage into the Maryland RPS or EmPOWER Maryland, or it could establish a stand-alone storage target. The merits of these options, and specific methods for executing each approach, are discussed below. (PPRP is also conducting a study on the Maryland RPS, which will consider storage, and will be an additional resource once it is completed in December 2019.) It is important to note there is less stakeholder support in Maryland for pursuing more promotional policies for energy storage than in enacting regulatory changes described earlier. While many in the industry would like policies to be enacted now, their effectiveness will be enhanced once the regulatory reforms discussed in Section 5.2 have progressed.
Renewable Energy Portfolio Standard
Maryland’s RPS has been modified multiple times since its original enactment in 2004. Currently, the RPS calls for the state’s investor-owned utilities (IOUs) and retail suppliers to source 25 percent of their retail sales (MWh) from qualifying renewable energy generators by 2020, including a 2.5 percent solar carve out and a carve-out for offshore wind that is capped at 2.5 percent.
Storage is not an obvious fit for RPS programs, since the value of storage lies not in simply providing energy to the grid, but in strategically meeting grid needs at certain times and locations. However, incorporating storage into an RPS can be an expedient way to promote the adoption of storage. For example, Vermont

5-12 | ENERGY STORAGE IN MARYLAND
has a 2 percent carve-out in its Renewable Energy Standard for “energy transformation projects,” including storage, and Massachusetts’s Alternative Energy Portfolio Standard accepts flywheels as an eligible resource. It is also not clear how the math would work, since one renewable energy credit (REC) is awarded to eligible generators for producing one MWh of energy. Perhaps only energy from a storage device that has been charged by an eligible resource would qualify. Or, energy from storage could be derated. For example, flywheels in Massachusetts are compensated for 65 percent of the energy they discharge.15
In 2017, legislative bills in both Arizona and California proposed the creation of a Clean Peak Standard (CPS) within each state’s respective RPS, and Massachusetts enacted a CPS as part of changes to the Commonwealth’s RPS enacted by the Massachusetts Legislature in August 2018. A CPS standard would require a certain percentage of renewable generation during times of peak demand, as shown in the figure to the right. If Maryland adopted a CPS and made storage eligible to discharge energy stored from renewable energy generators during these periods, it could incentivize storage to provide peaking services under the Maryland RPS.
EmPOWER Maryland
The EmPOWER Maryland program’s goals have also been modified several times since the law’s enactment in 2008. The original phase called for 15 percent reductions in both per capita energy use and per capita demand by 2015. These per capita goals were changed into goals based on a percentage of each utility’s retail sales, which is simpler to track. Targets for further reductions in energy use have been approved through a combination of regulatory and legislative action. No further goals have been set for demand reduction. (For example, in 2015, the PSC opted not to set new demand goals due to: concerns about market saturation within the utilities’ load control programs, questions about the interface between these programs and emerging initiatives such as dynamic pricing programs, and uncertainty about the utilities’ ability to bid these programs into PJM’s capacity market.)16 The utilities continue to run their demand response (DR) programs and expect further reductions in demand due to non-EmPOWER Maryland efforts, including dynamic pricing programs.17
Many storage developers suggested that storage be made eligible for EmPOWER Maryland rebates (see next section). For this to be of greatest impact, the PSC or the General Assembly would also need to establish a new goal for reductions in demand or peak demand. Significant work would also be needed to determine how BTM storage would participate in lowering demand. Currently, the state’s utilities use direct load controls to cycle down customer heat pumps and air conditioners. Storage systems would need to be controlled or dispatched in a different manner (as discussed in Section 5.2).
Traditional RPS(% Total MWh)
Clean Peak Standard(% On-peak MWh)
Figure 5-1. Clean Peak Standard ConceptSource: Adapted from Warren Leon, “Should There Be a Clean Peak Standard,” CESA, link, 13.

5-13OPTIONS AND DISCUSSION |
Using storage to reduce peak demand will, by necessity, increase energy use (since charging and discharging storage entails energy losses). This means that storage would work against EmPOWER Maryland’s energy efficiency goals. Ideally, the savings from further peak reductions would outweigh the additional costs of energy use.
Standalone Target
Standalone targets have the advantage of being tailored to storage and its range of applications. There is strong support from storage companies for procurement targets, as an approach that “kick-starts” new markets by providing market certainty to all interested parties. Procurement targets are also a popular way to compensate storage for a range of non-monetized value streams without extensive regulatory proceedings to define and quantify these streams.
On the other hand, utility and utility trade association representatives have expressed concerns that storage targets can be arbitrary and inefficient. There are only so many storage projects that make economic sense for the grid at a certain point in time. Once this “saturation level” is reached, additional projects crowd out other grid investments that may have a better cost-benefit profile, simply to meet an arbitrary storage target level. One way to avoid this issue is to use a non-binding target, which is the norm around the country. Massachusetts, Nevada, New York, and North Carolina have used, or are using, cost-benefit analyses to inform the decision of whether to set a storage target and/or what size it should be. Maryland could also set a modest target to serve, first and foremost, as a learning vehicle. For example, the Massachusetts Department of Energy Resources (DOER)
explained, in announcing a 200-MWh by 2020 target:
Storage procured under this target will serve as a crucial demonstration phase to further the Commonwealth’s knowledge of the potential for this technology. Based on lessons learned from this initial target, DOER may determine whether to set additional procurement targets beyond January 1, 2020. 18
Should Maryland decide to create a storage procurement target, important policy considerations to address include:
• Technology Neutrality – Just as the storage community is working to compete on a level playing field with traditional grid assets, individual storage technologies compete with each other. To that end, many industry representatives stressed the importance of procurement solicitations that specify the services needed (i.e., ramping, peak-shaving, etc.), not the storage technology desired.
• Project Diversity – Several industry representatives suggested specifically requiring diversity in project size, location, sector, and/or ownership. Otherwise, a handful of utility-scale projects could fulfill a target without creating a diversity of projects deployed for various purposes in Maryland.
• Small Business/Innovation – Maryland may also want to create a carve-out to support smaller storage product developers, who have yet to amass the track records usually required of successful bid respondents. This carve-out could reserve a certain amount of the overall target for smaller companies and/or innovative technologies. This is

5-14 | ENERGY STORAGE IN MARYLAND
somewhat analogous to a carve-out within the Chesapeake & Atlantic Coastal Bays Trust Fund for projects involving innovative technologies.19
Of the three options for setting goals, a standalone storage target would likely be the most useful, since it would allow Maryland to catalyze multiple applications for storage in multiple settings. To avoid confusion about which projects are eligible, it would be simplest to hold off on setting a target until utility ownership questions have been addressed by the PSC or the General Assembly. Alternatively, the General Assembly could specify sub-targets for utility- and non-utility ownership, as California did, or use the same legislation to settle ownership questions.
Grants, Rebates, and Tax IncentivesGrants and rebates have been integral to advancing Maryland’s clean energy, energy efficiency, and GHG reduction objectives. Together, with tax incentives, these tools act can act as “bridge incentives” that provide support for storage as costs continue to fall and more experience is gained with storage. Several current or previously proposed programs in Maryland could be expanded, extended, or launched to promote storage. As a rule, care should be taken to ensure that incentives are paired with some form of price signal (e.g., TOU rates, demand charges, DR program payments) so that storage is used in a manner that benefits both customers and the grid.
Grants
Grants can be designed to emphasize certain technologies, market niches, geographic areas, and pilot or demonstration projects, or they can be less structured to encourage more creative
proposals. Grants can also be combined with private capital, such as requiring minimum amounts of co-funding from applicants, to ensure grant dollars extend as far as possible. However, grants often have high administrative costs, since preparing and reviewing applications is time-consuming for both applicants and application reviewers.20
Resiliency grants focus on a highly valued, non-monetized benefit. In Massachusetts, for example, eight municipalities are combining resiliency grants with peak load management strategies to get public purpose microgrid projects off the ground.21 In 2015, Maryland’s Resiliency Through Microgrids Task Force envisioned a grant program for public purpose microgrids similar to those created by Massachusetts and Connecticut (see Chapter 4). Pepco has just proposed two public purpose microgrids, for which the utility seeks to recover $63 million from ratepayers (see Chapter 3). Maryland could postpone resiliency investments until lessons learned from these projects, if approved, can be applied. In its comments to the PSC on Pepco’s proposal, MEA also put forward the concept of privately owned, public-purpose microgrids, which it sees as a potentially less costly means to achieving the same goals.22
Though MEA has completed awarding grants under its Game Changers program (which focused on innovative technologies that can help the state meet its RPS goal), the program could potentially be adapted to fund projects with new demonstration objectives. Currently, it appears that the Storage WG pilot projects may address one of the key areas of interest among many industry representatives and stakeholders: aggregating BTM storage to provide utility
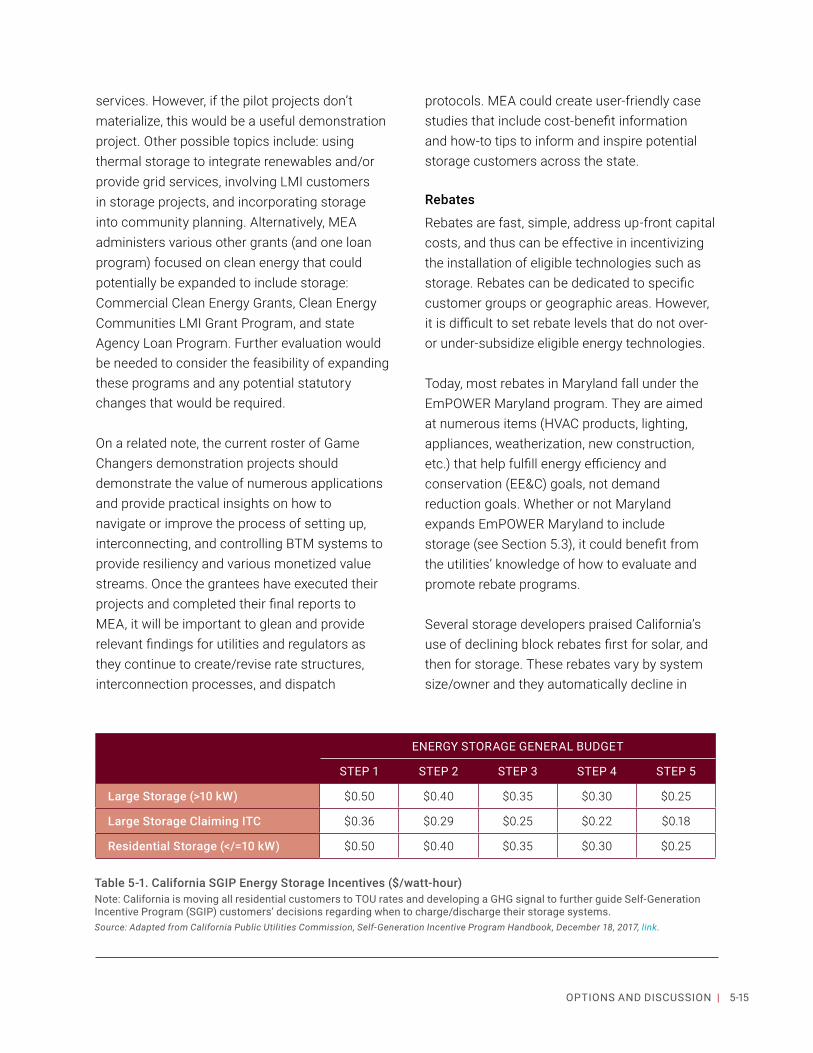
5-15OPTIONS AND DISCUSSION |
services. However, if the pilot projects don’t materialize, this would be a useful demonstration project. Other possible topics include: using thermal storage to integrate renewables and/or provide grid services, involving LMI customers in storage projects, and incorporating storage into community planning. Alternatively, MEA administers various other grants (and one loan program) focused on clean energy that could potentially be expanded to include storage: Commercial Clean Energy Grants, Clean Energy Communities LMI Grant Program, and state Agency Loan Program. Further evaluation would be needed to consider the feasibility of expanding these programs and any potential statutory changes that would be required.
On a related note, the current roster of Game Changers demonstration projects should demonstrate the value of numerous applications and provide practical insights on how to navigate or improve the process of setting up, interconnecting, and controlling BTM systems to provide resiliency and various monetized value streams. Once the grantees have executed their projects and completed their final reports to MEA, it will be important to glean and provide relevant findings for utilities and regulators as they continue to create/revise rate structures, interconnection processes, and dispatch
protocols. MEA could create user-friendly case studies that include cost-benefit information and how-to tips to inform and inspire potential storage customers across the state.
Rebates
Rebates are fast, simple, address up-front capital costs, and thus can be effective in incentivizing the installation of eligible technologies such as storage. Rebates can be dedicated to specific customer groups or geographic areas. However, it is difficult to set rebate levels that do not over- or under-subsidize eligible energy technologies.
Today, most rebates in Maryland fall under the EmPOWER Maryland program. They are aimed at numerous items (HVAC products, lighting, appliances, weatherization, new construction, etc.) that help fulfill energy efficiency and conservation (EE&C) goals, not demand reduction goals. Whether or not Maryland expands EmPOWER Maryland to include storage (see Section 5.3), it could benefit from the utilities’ knowledge of how to evaluate and promote rebate programs.
Several storage developers praised California’s use of declining block rebates first for solar, and then for storage. These rebates vary by system size/owner and they automatically decline in
ENERGY STORAGE GENERAL BUDGET
STEP 1 STEP 2 STEP 3 STEP 4 STEP 5
Large Storage (>10 kW) $0.50 $0.40 $0.35 $0.30 $0.25
Large Storage Claiming ITC $0.36 $0.29 $0.25 $0.22 $0.18
Residential Storage (</=10 kW) $0.50 $0.40 $0.35 $0.30 $0.25
Table 5-1. California SGIP Energy Storage Incentives ($/watt-hour) Note: California is moving all residential customers to TOU rates and developing a GHG signal to further guide Self-Generation Incentive Program (SGIP) customers’ decisions regarding when to charge/discharge their storage systems.Source: Adapted from California Public Utilities Commission, Self-Generation Incentive Program Handbook, December 18, 2017, link.

5-16 | ENERGY STORAGE IN MARYLAND
“steps” based on the volume of storage that has been deployed in each category, as shown in Table 5-1. This allows the state to lessen its subsidies as the storage market matures and costs continue to fall.
Support was also expressed for prescriptive rebates for thermal storage equipment. Prescriptive rebates are determined in advance, rather than based on the savings calculated for a specific project, which can be difficult to estimate. Table 5 2 provides an illustrative list of utilities that offer prescriptive rebates for thermal storage technologies, which are typically used by customers for a mix of peak shaving/load shifting. (Note that EmPOWER Maryland offers pre-determined rebates for
certain other technologies such as washers, dryers, and water heaters.)
CITY OR AREA STATE UTILITY REBATE
Los Angeles CA LA DWP $800/kW
Tampa FL TECO $275/kW
Much of central Florida FL Duke Energy FL $300/kW
Miami and much of eastern/southern Florida FL FPL $600/kW
Massachusetts (whole state) MA via MassCEC/MA DOER rolling RFPs from ESI
Lincoln NE Lincoln Electric Service $500/kW
New York City and Westchester County NY ConEd <$1,700/kW thru
auction process
Long Island NY PSEG-LI $1,000 per ton
East Texas TX Entergy TX $225/kW
El Paso TX El Paso Electric $240/kW
Dallas-Ft. Worth TX Oncor $337/kW
Austin TX Austin Energy $350/kW
Wisconsin (whole state) WI via Focus on Energy $100/KW
Table 5-2. Illustrative Prescriptive Rebates for Thermal Storage Source: Adapted from data gathered by CALMAC® Corporation from utility websites as of February 21, 2018 and is subject to change.

5-17OPTIONS AND DISCUSSION |
Investment Tax Credit
It is too early to evaluate the impact of Maryland’s one-of-a-kind state investment tax credit (ITC) for storage. The credit, as currently designed and funded, is modest; it will enable a small number of projects while protecting taxpayers from exorbitant costs. If this incentive model is deemed successful at catalyzing BTM storage projects, the tax credit could be extended, and the funding cap expanded. At that time, some thought should be given to pairing the tax credit with some form of price signal, such as the TOU rate discussed earlier.
FinancingStorage could potentially benefit from many of the same financing structures that have become commonplace for PV projects, including power purchase agreements (PPAs), master limited partnerships, asset-backed securities, bonds, and Property Assessed Clean Energy (PACE) loans. Maryland can help storage projects attract third-party financing indirectly by providing sufficient revenue streams to reduce the perceived risk of storage; instituting a storage procurement target; providing incentives such as tax credits, grants, or rebates; or some combination of the above.23
In addition, Maryland could lower the cost of financing storage through state-led loan programs that provide funding at favorable interest rates or with better terms than banks or other sources of financing.24 Loan programs can be self-sustaining (assuming no or limited defaults) through loan repayments that, in turn, can be used for making additional loans. State loan programs may also facilitate co-funding from private lenders or investors who might not have otherwise provided financing. However, state loan programs incur the risk of loan defaults and also have high administrative costs, since expertise is needed to evaluate project and
LMI Customers and Storage
Typically, new technologies such as storage are adopted first by customers and large companies that can afford to pay a premium for energy-related services. Yet, low- and moderate-income (LMI) communities may be able to access certain benefits from energy storage equipment as well. For instance, LMI communities, on average, pay a relatively high portion of their income for energy and are often the most vulnerable to natural disasters that can knock out power for days. Many of the mechanisms for promoting storage discussed in this chapter could potentially be deployed in LMI communities so they may benefit from storage and solar+storage systems, in particular.
Set-asides and Adders: If policy options such as grants or rebates were enacted, they could set aside a portion of funds for LMI projects or use adders to give consideration to such projects during the review stage. If targets were set in Maryland, a portion of the overall deployment goal could be set aside for projects that serve LMI customers.
Communal Ownership or Use: In cases where LMI customers do not own property, community ownership may be useful. This is especially the case with community solar projects, where participants may own shares in the project and receive a proportional share of cost savings. United Power, a Colorado-based co-op, is experimenting with offering customers shares of a 4-MW/16-MWh battery.
continued next page

5-18 | ENERGY STORAGE IN MARYLAND
credit risk, and active loans require loan servicing and monitoring.25
Tax-exempt Loans
A useful reference for loan-making programs is the Maryland Clean Energy Commission (MCEC), which the General Assembly created to serve as a “corporate instrumentality” of the state.26 The MCEC is authorized to serve as a bonding agent, securing largely tax-exempt loans for residential, commercial, institutional, municipal, and not-for-profit consumers who wish to make energy improvements and related capital investments. MCEC has added storage to its portfolio of supported projects and is especially interested in promoting the use of BTM storage for grassroots resiliency and PV integration.
Green Bank Loans
Green banks are typically public or quasi-public institutions that focus on accelerating the deployment of clean energy technologies.
Montgomery County started a Green Bank in 2015, using up to $14 million from the Pepco-Exelon merger settlement.27 The bank is focused on projects that can provide sound and rapid financial returns. The County is interested in finding storage projects that fit this paradigm, but has yet to do so.28 Also of relevance, in 2015, MCEC published a Green Bank Study, which envisions a $40 million green bank for Maryland like those in Connecticut and New York (see Chapter 3).29
5.4. Planning Given the growing importance of distribution planning to grid modernization efforts, many industry stakeholders expressed the desire for greater transparency from utilities. Currently, utilities bring any distribution system investments and improvements to the PSC as part of a rate case. Industry representatives and stakeholders are interested in having more insight and input up front before utilities act or make the investments.
Alternatively, projects that aggregate BTM storage to shave system-wide demand can involve LMI customers. Additionally, the potential for pairing community solar with batteries exists as well.
Benefit Sharing: Unlike standalone homes, affordable housing buildings often have loads (such as common-area lighting, elevators, and laundry rooms) that are assessed at commercial rates and may lend themselves to demand charge management. The benefits can be shared between tenant and owner, as is the case with California’s Multifamily Affordable Housing Solar Roofs Program.
Technical Assistance: Grants can include funding for pre-proposal feasibility studies to help municipalities and other groups serving LMI customers scope out complex project ideas, such as microgrids. Maryland could also create online resources such as: tools for project scoping or economic analysis; procurement guidelines; and lists of qualified engineers, installers, etc. states can also educate and partner with NGOs, philanthropies, and foundations that fund pilot projects in LMI communities.
Sources: Todd Olinksy-Paul, Solar+Storage for Low- and Moderate-Income Communities: A Guide for States and Municipalities, Clean Energy States Alliance, March 2017, link, 4-5, 9, 18-19, 24, 36-37; United Power, “Case Study: United Power Community Battery Storage,” November 14, 2017, link.

5-19OPTIONS AND DISCUSSION |
Utility Compensation
Distribution system planning reforms are often considered in conjunction with new forms of utility compensation. Traditional cost-of-service regulation bases utility earnings on their investments in capital assets, upon which they receive PSC-approved returns. states that are interested in facilitating a shift towards greater reliance on non-wires alternatives, particularly distributed energy resources that are owned by third parties, are exploring how to compensate utilities for a shift in this direction. There is a perceived disincentive on the part of utilities to use third-party services because they are traditionally considered O&M expenses, which are not eligible for a return.
Massachusetts, New York, Pennsylvania, and Rhode Island are all considering performance-based incentives (PBIs), among other strategies. PBIs reward utilities for their performance in pre-specified areas of interest such as: data access, system efficiency, DER deployment, interconnection efficiency, and customer empowerment. PBIs can be designed as specific targets or metrics that increase/decrease a utility’s authorized rate of return. For example, as part of the NY
They want to better understand, in particular, how utilities are weighing traditional upgrades against non-wires alternatives (NWAs), including storage. Conversely, opponents are concerned that more proactive distribution planning would result in more complexity and is simply unnecessary, as the current system works effectively in maintaining distribution system reliability. There are more and less intensive ways that the PSC could create regular communication lines regarding infrastructure upgrades, including:
• Informational filings – The PSC could focus on planned upgrades above a certain cost threshold, requiring that utilities make an informational filing beforehand that contains a brief project description and rationale. The filing would not require approval by the PSC, but rather give the PSC an opportunity to request more information, if desired.
• NWA analyses – The PSC could focus on planned upgrades above a certain cost threshold, requiring that utilities evaluate and pursue NWAs that are deemed cost-effective.
• More formal distribution planning – The PSC could launch the PC 44 distribution system planning work group, which is presently deferred, to develop a broader approach to oversight.
As discussed in Chapter 4, distribution system planning is a realm of exploration and experimentation in at least 16 states around the country, including Maryland. The five states with practices deemed “advanced” in a recent DOE report (California, Hawaii, Massachusetts, Minnesota, and New York), are asking that utilities share some combination of the following documents, on a regular basis, with their respective public service/utility commission: long-term distribution plans or grid modernization plans, hosting capacity analyses, locational net benefit analyses, and NWA analyses (see Table 4-7 and associated texts, as well as Appendix D, which describes approaches taken by California and New York in further detail).
Maryland is gaining experience on all these fronts via PC 44’s active Work Groups and
continued next page

5-20 | ENERGY STORAGE IN MARYLAND
other efforts discussed throughout this report. Working with the state’s utilities and other stakeholders to gain an increasingly granular understanding of the potential for storage and other DERs to provide value to the grid, could inform future utility investments and time- and location-based rate designs. However, overseeing distribution system planning requires significant expertise and effort on the part of utility regulators. To date, the PSC has chosen to prioritize other grid modernization topics. Also, many industry and agency representatives cautioned that increasing oversight of distribution system planning should not be undertaken lightly, since it could strain Commission Staff and financial resources.
5.5. PJM-level ReformsWhile they primarily focused on changes that Maryland can make independently, several industry representatives highlighted changes that PJM would need to take to remove barriers to storage. These barriers were first introduced in Chapter 2. This section recaps each barrier and suggests potential alternatives, two of which are drawn from the California Independent System Operator (CAISO), which has been exploring various ways to incorporate storage, and, to a greater extent, other DERs for over ten years.
REV proceeding (see Appendix C), utilities are proposing metrics related to the proceeding’s goals. Their performance will be tracked using scorecards, and utilities will be allowed to earn up to 100 basis points above their standard return on equity. In addition to PBIs, New York is exploring new ways for utilities to earn revenues associated with serving as “platforms” that connect DERs, large-scale power generators, customers, and other parts of the energy system. Likewise, in a recent report to Rhode Island’s governor, the state’s PUC and Office of Energy Resources recommended the use of PBIs and four additional changes to utility compensation, including the use of a multi-year rate plan with a revenue cap to incentivize cost savings.
Other possible approaches involve equalizing the treatment of capital solutions and service alternatives by allowing utilities to: earn a return on their contracts for storage services provided by a third party; treat a service contract like a traditional capital investment; and/or share with customers the savings between the cost of a traditional upgrade and a less expensive service solution. A recent study by Advanced Energy Economy, a trade association, concluded that using these approaches can, under certain circumstances, result in “win-win” situations where utility earnings and customer cost savings are both greater than in the case of a traditional upgrade.
Sources: David Littell and Jessica Shipley, Performance-Based Regulation Options: White Paper for the Michigan Public Service Commission, Regulatory Assistance Project, August 2, 2017, link, 4;
Hannah Polikov, “New Business Models for Storage,” Presentation to the MD PC 44 Storage Work Group, June 11, 2018, slides 8-11;
New York Reforming the Energy Vision, “Track Two: REV Financial Mechanisms, May 19, 2016, link; and
Rhode Island Division of Public Utilities & Carriers, Office of Energy Resources and Public Utilities Commission, “Rhode Island Power Sector Transformation: Phase One Report to Governor Gina M. Raimondo,” November 2017, link, 10.

5-21OPTIONS AND DISCUSSION |
Capacity Market Participation As with DR and energy efficiency, storage has unique physical and operational characteristics that differ from traditional capacity infrastructure (e.g., large-scale generation resources). Markets designed around traditional resources, most especially long-term, centralized capacity markets, often impose requirements that preclude storage from participation, as is the case in PJM. This can come at the expense of market efficiency insofar as grid operators do not fully utilize least-cost grid resources. As PJM considers how to change its capacity market rules to comply with FERC Order 841, one potential model is the approach adopted by the CPUC beginning in 2004, as applicable to most parts of the CAISO.vi
Resource adequacy in California blends elements of centralized capacity markets, including procurement of least-cost resources, with traditional, regulated planning processes, including administratively determined reliability obligations. Resource adequacy is broken down into three distinct requirements: system, local, and flexible resources. Storage, including stand-alone, co located, and BTM resources, can serve as both “Qualifying Capacity” to meet system and local resource needs and as “Effective Flexible Capacity” to meet flexible resource needs so long as it fulfills basic operation requirements. All capacity resources must be capable of operations for at least four consecutive hours over three consecutive days to qualify. Additionally, resources must participate in CAISO day-ahead energy markets and be subject to must-offer obligations.
System resource adequacy ensures sufficient capacity to meet the forecasted maximum
vi A complete overview of California’s resource adequacy program is available via resources found at: http://www.cpuc.ca.gov/RA/.
vii PJM’s zones generally encompass the entire service territory of a utility and frequently cross state boundaries. For example, the PJM Zone for Pepco includes Washington D.C., and the PJM Zone for Delmarva includes Delaware.
requirement for an entire utility service area in California plus a planning reserve margin, currently set at 15 percent. System requirements are subject to various adjustments to account for peak coincidence (i.e., level of peak load overlap) with CAISO. Local resource adequacy requirements account for select, transmission-constrained areas, as identified in the annual CAISO Local Capacity Technical Study. Local requirements are evaluated under various scenarios accounting for weather and contingency.30 Finally, flexible resource adequacy provides capacity to meet monthly, peak 3-hour ramping requirements, as identified in the annual CAISO Flexible Capacity Study. The CPUC approved the flexible requirement in response to the so-called “duck curve,” a phenomenon stemming from the timing imbalance of solar production and load requirements that can necessitate steep ramping to meet demand.
Capacity Demand CurvePJM creates a system-wide demand curve for its Reliability Pricing Model (RPM) auctions. This demand curve is based on a load forecasting model that severely discounts peak shaving. Specifically, PJM’s model uses daily peak loads from all summer days over the past 18 years to determine each PJM zone’s capacity obligation.31,vii Thus, if Maryland’s IOUs were to successfully use storage to diminish their capacity charges, they would primarily shift capacity costs to fellow PJM members. This issue could be reduced or eliminated if PJM revises its capacity market rules to allow storage to bid in as a resource, as discussed in the prior section. Alternatively and/or additionally, PJM could consider adjusting its load forecasting methodology to give greater weight to current practices. (As noted in Chapter 2, PJM has created a task force to look at ways

5-22 | ENERGY STORAGE IN MARYLAND
to incorporate summer-only DR into its load forecast.32 If the task force’s recommendations are approved by PJM, they could be sent to FERC to be approved for the next annual RPM auction.)
Transmission Planning PJM uses a proprietary Regional Transmission Expansion Plan (RTEP) model to identify upgrades that can be used to alleviate constraints and improve reliability. While the RTEP model considers generation projects that are at a relatively late stage of development, it cannot impose generation-, demand-, or storage-based solutions. The RTEP model only puts forward transmission solutions, such as new lines or upgrades. Once a transmission constraint is identified, or other system issue that could impact reliability, PJM authorizes construction and cost recovery of transmission upgrades to address the area of concern. PJM also considers market efficiency upgrades designed to relieve economic congestion by reducing overall operating and supply costs for customers. As noted in Chapter 2, PJM does not considered storage or other DERs as part of its RTEP planning process, and does not have plans to include it. By contrast, CAISO’s framework for transmission planning explicitly calls for the evaluation of non-transmission alternatives (particular so-called “preferred resources” such as energy efficiency, demand response, and storage) to transmission expansion projects.33 As noted in Chapter 2, this directive has begun to bear fruit with a first-ever proposal, submitted by Pacific Gas & Electric (PG&E), to solicit 20-40 MW of DERs over the next five years to offset any transmission reliability issues resulting from the phase-out of a 168-MW, diesel-fired power plant in Oakland.34 CAISO approved PG&E’s proposal in spring 2018.35
5.6. ConclusionMaryland faces numerous decisions regarding the treatment of energy storage and various methods for eliminating barriers to its use. Yet, Maryland has the advantage of not being under pressure to address certain problems that storage can help to mitigate, such as constraints on fossil fuel supplies, widespread curtailment of utility-scale wind and solar plants, or significant upward pressure on transmission and distribution (T&D) costs due to load growth. These circumstances provide Maryland with the luxury to thoughtfully increase storage’s access to the grid, facilitate its participation in electric power markets, and provide compensation for a wider range of the benefits that storage can provide. Such changes will both enable storage to compete with other technologies and address market shortcomings that necessarily result in suboptimal levels of storage investment.
Over the long term, increases in energy storage in Maryland, and in regions that affect Maryland, can potentially provide direct employment opportunities related to installation and maintenance; lower overall costs by deferring distribution system upgrades and reducing peak demand; and improve environmental quality by enabling solar and wind resources to more effectively contribute to the regional energy supply. The administrative, regulatory, and legislative options enumerated in this report, along with the recommendations emerging from the PSC’s PC 44 process, provide a basis for Maryland to pursue these benefits without exposing the state’s ratepayers to large and long-term additional costs.

5-23OPTIONS AND DISCUSSION |

5-24 | ENERGY STORAGE IN MARYLAND 5-24
Endnotes1 Nitzan Goldberger, “Informal Comments on Utility Ownership of Storage; Maryland Public Service Commission PC 44 Storage Working
Group,” September 20, 2017.
2 Nitzan Goldberger, “Informal Comments on Utility Ownership of Storage; Maryland Public Service Commission PC 44 Storage Working Group,” September 20, 2017.
3 Federal Energy Regulatory Commission, Utilization of Electric Storage Resources for Multiple Services When Receiving Cost-Based Rate Recovery, 158 FERC ¶ 61,051, Docket No. PL17-2-000, 13-17.
4 Nitzan Goldberger, “Informal Comments on Utility Ownership of Storage…”.
5 Advanced Energy Economy, “DISTRIBUTED ENERGY RESOURCE OWNERSHIP, Emerging roles for regulated utilities and third-party providers,” September 2017, https://info.aee.net/hubfs/PDF/DER-Ownership.pdf, 8.
6 Nitzan Goldberger, “Informal Comments on Utility Ownership of Storage…”
7 Ibid.
8 Energy Storage Association, Updating Distribution Interconnection Procedures to Incorporate Energy Storage, January 2018, http://energystorage.org/interconnection, 4.
9 Ibid, 9.
10 Email communication with Mari Hernandez, Interstate Renewable Energy Council (IREC), April 11, 2018.
11 Federal Energy Regulatory Commission, Utilization of Electric Storage Resources for Multiple Services When Receiving Cost-Based Rate Recovery, 158 FERC ¶ 61,051, Docket No. PL17-2-000.
12 ADMINISTRATIVE LAW JUDGE’S RULING SEEKING COMMENTS ON JOINT STAFF PROPOSAL, Order Instituting Rulemaking to consider policy and implementation refinements to the Energy Storage Procurement Framework and Design Program (D.13-10-040, D.14-10-045) and related Action Plan of the California Energy Storage Roadmap, Rulemaking 15-03-011, May 18, 2017.
13 Maryland Public Service Commission (MD PSC), “Community Solar Pilot Program – Frequently Asked Questions,” http://www.psc.state.md.us/electricity/community-solar-pilot-program-frequently-asked-questions/.
14 California Public Utilities Commission, Order Instituting Rulemaking Regarding Policies, Procedures and Rules for the California Solar Initiative, the Self-Generation Incentive Program and Other Distributed Generation Issues, Docket No. 12-11-005, December 27, 2017, http://docs.cpuc.ca.gov/PublishedDocs/Efile/G000/M202/K276/202276301.PDF.
15 Massachusetts Department of Energy Resources, State of Charge – Massachusetts Energy Storage Initiative, September 2016, https://www.mass.gov/files/documents/2016/09/oy/state-of-charge-report.pdf, 158.
16 MD PSC Order No. 87082, https://www.psc.state.md.us/wp-content/uploads/Order-No.-87082-Case-Nos.-9153-9157-9362-EmPOWER-MD-Energy-Efficiency-Goal-Allocating-and-Cost-Effectiveness.pdf.
17 MD PSC, The EmPOWER Maryland Energy Efficiency Act Standard Report of 2017, September 2017, http://www.psc.state.md.us/wp-content/uploads/Final-2017-The-EmPOWER-Maryland-Energy-Efficiency-Act-Standard-Report.pdf, 18.
18 Letter to Conference Committee Members, Judith F. Judson, Commissioner, Massachusetts Department of Energy Resources, June 30, 2017, accessed via https://www.mass.gov/news/baker-polito-administration-sets-200-megawatt-hour-energy-storage-target.
19 Maryland Department of Natural Resources, “Innovate Technology Fund,” http://dnr.maryland.gov/ccs/Pages/funding/intechfund.aspx.
20 Charles Kubert and Mark Sinclair, Distributed Renewable Energy Finance and Policy Toolkit, Clean Energy States Alliance, December 2009, https://cesa.org/assets/Uploads/CESA-renewableenergy-FinancePolicy-toolkit2009.pdf.
21 Imre Gyuk, “Energy Storage Micro-Grids: Monetizing Resilience through New Business Cases!,” presentation, February 13, 2018, https://www.cesa.org/assets/2018-Files/ESTAP-webinar-slides-2.13.2018.pdf, April 16, 2018, 6.
22 Maryland Energy Administration, “Maryland Energy Administration Comments Regarding Merger Condition No. 13 – Pepco’s Proposal for a Pilot Program to Create and Evaluate Public Purpose Microgrids,” MD PSC Case No. 9361 (Item No. 398), April 6, 2018, 10-11.
23 New York Battery and Energy Consortium, Energy Storage Roadmap for New York’s Electric Grid, January 2016, https://www.ny-best.org/blog-entry/2016-energy-storage-roadmap-new-yorks-electric-grid-0, 41.
24 United States Environmental Protection Agency, Energy and Environment Guide to Action, 2015, https://www.epa.gov/sites/production/files/2015-08/documents/guide_action_full.pdf, 3-8.
25 Charles Kubert and Mark Sinclair, Distributed Renewable Energy Finance.

5-25OPTIONS AND DISCUSSION |
26 Maryland Clean Energy Center (MCEC) website, https://mdcleanenergy.org/about-us.
27 Montgomery County Green Bank, https://mcgreenbank.org/partners/lenders/.
28 Email correspondence with Eric Coffman, Chief – Office of Energy and Sustainability, Department of General Services, Montgomery County, Maryland, March 30, 2018.
29 MCEC, Growing the Maryland Clean Energy Economy – Green Bank Study Final Report, December 1, 2015, http://mdcleanenergy.org/sites/default/files/Report%20-%20Draft%20FINAL%203%20PM%2011.30.pdf, 10.
30 Additional information regarding local capacity requirements is available via resources found at: http://www.caiso.com/informed/Pages/StakeholderProcesses/LocalCapacityRequirementsProcess.aspx.
31 PJM Interconnection (PJM), “Questions on 5CPs and Peak Shaving,” May 6, 2015, http://www.pjm.com/~/media/committees-groups/task-forces/scrstf/20160506/20160506-item-01b-faqs-for-5cps-and-peak-shaving.ashx.
32 PJM, “Opportunities to recognize and value summer-only Demand Response resources,” 2017, http://www.pjm.com/-/media/committees-groups/task-forces/sodrstf/postings/sodrstf-problem-statement.ashx?la=en.
33 California ISO, Transmission Assessment Methodology, November 2, 2017, http://www.caiso.com/Documents/TransmissionEconomicAssessmentMethodology-Nov2_2017.pdf, 27.
34 Jeff St. John, “A California First: Enlisting Distributed Energy for the Transmission Grid,” Greentech Media, December 7, 2017, https://www.greentechmedia.com/articles/read/a-california-first-enlisting-distributed-energy-for-the-transmission-grid?utm_source=GridEdge&utm_medium=Newsletter&utm_campaign=GTMGridEdge#gs.bxPJrKQ.
35 American Public Power Association, “CAISO Oks utility plan to replace plant with DERs, system upgrades,” April 3, 2018, https://www.publicpower.org/periodical/article/caiso-oks-utility-plan-replace-plant-with-ders-system-upgrades.

5-26 | ENERGY STORAGE IN MARYLAND

A-1APPENDIX |
APPENDIX A: PC 44 MEMORANDUM TO PPRP ON UTILITY OWNERSHIP AND REGULATION OF FOM STORAGE IN MARYLAND
1
MEMORANDUM
TO: Power Plant Research Program, Maryland Department of Natural Resources FROM: PSC 44 Energy Storage Workgroup Leaders DATE: January 11, 2018 RE: Utility Ownership and Regulation of Front-of-the-Meter Energy Storage in Maryland
I. Introduction
The issue of whether electric distribution companies may own energy storage has not yet
been addressed in most states with deregulated energy markets, including Maryland. And in the
few states that have addressed the issue, the rationales behind their approaches are not rooted in a
consistent policy approach.1 Following several meetings of the Public Conference 44 Energy
Storage Workgroup, as well as several rounds of written comments, this Memorandum reviews
existing legal and policy considerations for utility ownership of front-of-the-meter energy
storage in Maryland. This paper focuses on front-of-the-meter energy storage because there
remain significant and complex issues related to ownership of behind-the-meter energy storage
that the workgroup has not yet resolved. There were a diversity of views regarding the issue in
the workgroup; however, from a policy perspective, the workgroup generally agrees that utilities
should be allowed to own energy storage in front of the meter when it has the primary purpose of 1 Massachusetts, for example, has an energy storage mandate and explicitly permits utility ownership of energy storage. See Advancing Batteries to Enhance the Electric Grid, The GridWise Alliance, Inc., July 13, 2017 at p. 15. In New York, utility ownership of energy storage integrated into the distribution system is permissible under certain circumstances. On February 26, 2015, in Track 1 of its “Reform the Energy Vision”(REV) proceedings, the New York Public Service Commission limited energy storage ownership by utilities to demonstration projects, storage sited on utility property with a distribution function, and where markets are not adequately serving low-income community needs. See CASE 14-M-0101, Order Adopting Regulatory Policy Framework. In a later Order, however, New York expanded its directive on utility-owned storage. See CASE 14-M-0101, ORDER ON DISTRIBUTED SYSTEM IMPLEMENTATION PLAN FILINGS, March 9, 2017, at p. 29-30 (“The Utilities should be striving to develop their abilities to plan and use energy storage as part of their normal course of business . . . To that end, we direct the Utilities to significantly increase the scope and speed of their energy storage endeavors. By no later than December 31, 2018, each individual utility must have energy storage projects deployed and operating at no fewer than two separate distribution substations or feeders, which shall be documented in a compliance filing).” Texas does not allow utilities to own energy storage projects that are intended to receive compensation from wholesale markets. See Texas Senate Bill 943 of 2011. However, on October 13, 2017, an Administrative Law Judge Proposal for Decision to the Public Utility Commission of Texas (“PUCT”) recommended approval of an AEP Texas request to own utility-scale batteries on the distribution system. See PUCT Docket No. 46368, Application of AEP Texas North Company for Regulatory Approvals Related to the Installation of Utility-Scale Battery Facilities, at p. 83. On December 6, 2017, the Proposal for Decision was rescheduled for consideration by the Public Utility Commission of Texas on January 11, 2018. See PUCT Filing No. 46368-158.

A-2 | ENERGY STORAGE IN MARYLAND
2
supporting the distribution system.2 It may be useful for the General Assembly or the
Commission to provide additional clarity on the issue.
II. Background
Maryland policymakers did not anticipate or address energy storage when the State
restructured the electric industry through the Electric Customer Choice and Competition Act of
1999, PUA §§7-501 et seq.(“Act”). The Act’s stated purpose is to:
(1) establish customer choice of electricity supply and electricity supply services; (2) create competitive retail electricity supply and electricity supply services markets; (3) deregulate the generation, supply, and pricing of electricity; (4) provide economic benefits for all customer classes; and (5) ensure compliance with federal and State environmental standards.3
When Maryland deregulated the electric industry, it intended to segregate generation from
distribution along clear and straightforward lines. See PUA §7-505(b)(3);4 PUA §7-
505(b)(10)(iii)5; and PUA §7-509(a)(1)6.7 For the most part, that goal was accomplished.
Policymakers ordered the transfer of generation facilities to deregulated businesses, while
regulated utilities retained distribution facilities.
Modern energy storage technology, however, potentially disrupts this framework by
blurring the bright lines between generation and distribution, depending on how energy storage is
used. Advances in utility scale electric batteries make storage useful for a variety of distribution
purposes while also exhibiting the attributes and function of generation. Energy storage is a
2 This approach was brought to the workgroup’s attention by The GridWise Alliance. The Maryland investor-owned utilities participating in the workgroup take the position that they are not prohibited from owning and operating energy storage resources when used primarily for distribution system support, just as any other utility asset used in the ordinary course for maintaining the safety and reliability of the utility’s distribution system. 3 PUA §7-504 4 (b)(3) The Commission shall order an electric company to adopt policies and practices that are reasonably designed to prevent ... giving undue or unreasonable preference in favor of the electric company’s own electric supply, other services, divisions, or affiliates... 5 (iii) On or before July 1, 2000, the Commission shall require, among other factors, functional, operational, structural, or legal separation between the electric company's regulated businesses and its nonregulated businesses or nonregulated affiliates. 6 (a)(1) On and after the initial implementation date, the generation, supply, and sale of electricity, including all related facilities and assets, may not be regulated as an electric company service or function except to: (i) establish the price for standard offer service under § 7-510(c) of this subtitle; and (ii) review and approve transfers of generation assets under § 7-508 of this subtitle. 7 In written comments sent to PC 44 workgroup, BGE, Delmarva Power, and Pepco maintained that § 7-505(b)(3) is designed to address utility affiliate issues rather than prohibit utility participation in competitive markets. As to § 7-509(a)(1), BGE, Delmarva Power, and Pepco argued that energy storage resources would not even qualify as facilities or assets that relate to the generation, supply, or sale of electricity.

A-3APPENDIX |
3
subject of continuing interest at both FERC and PJM, both of whom have encouraged the use of
energy storage and may require its use in the future.8
III. Maryland Law
Although the Act effectively separated “generation” from “distribution,” the Act does not
define those terms. Moreover, although PUA §7-505 and §7-509 are generally read to prohibit
the regulated distribution utilities from owning “the generation …of electricity, including all
related facilities and assets…,” the Act does not unambiguously prohibit a regulated utility from
owning or using equipment capable of use for generation.
Moreover, even if the Maryland General Assembly intended for such an outright
prohibition to exist, it was at least limited in 2006 when the Legislature added §7-510(c)(6),
which expressly permits a regulated utility to own and operate generating facilities with
Commission authorization: (6) In order to meet long-term, anticipated demand in the State for standard offer service and other electricity supply, the Commission may require or allow an investor-owned electric company to construct, acquire, or lease, and operate, its own generating facilities, and transmission facilities necessary to interconnect the generating facilities with the electric grid, subject to appropriate cost recovery.
The ambiguous and even contradictory statutory scheme of the Act, as amended, relies on a
categorization of assets into generation and distribution that does not neatly address the emerging
hybrid technology of electric storage. Although Maryland case law has yet to address issues
surrounding electric storage, some Maryland authority does exist that may be useful in
determining whether regulated utilities may own energy storage devices.
A. Should electric storage batteries be considered a source of generation?
If Maryland regulated utilities are not permitted to own generation, the question of
whether electric storage batteries are classified as generation is consequential. Depending on its
specific form and use, energy storage can have the attributes of generation, distribution, or both.
8 See FERC Docket No. RM16-6-000, Essential Reliability Services and the Evolving Bulk-Power System-Primary Frequency Response; FERC Docket No. RM16-23-000, Docket No. AD16-20-000, Electric Storage Participation in Markets Operated by Regional Transmission Organization and Independent Operators; FERC Docket No. PL 17-2-000, Utilization of Electric Storage Resources for Multiple Services When Receiving Cost-Based Rate Recovery, noting at p. 17 that: “[i]f we were to deny electric storage resources the possibility of earning cost-based and market-based revenues on the theory that having dual revenue streams undermines competition, we would need to revisit years of precedent allowing such concurrent cost-based and market-based sales to occur…” But see the dissent of Commissioner LaFleur noting at p. 1, expressing particular disagreement “with the Policy Statement’s sweeping conclusions about the potential impacts of multiple payment streams on pricing in wholesale electric markets.”

A-4 | ENERGY STORAGE IN MARYLAND
4
In 2014, then Governor O’Malley ordered the formation of a Resiliency Through
Microgrids Task Force (“Task Force”) to study various issues concerning the potential
deployment of microgrids in Maryland. The resulting Resiliency Through Microgrids Task
Force Report (“TF Report”) recommends that the Commission allow electric distribution
companies employing energy storage, as part of a public purpose microgrid, in their distribution
functions to sell stored energy into the PJM markets. According to the TF Report, allowing
utilities to receive compensation through the wholesale energy markets would facilitate the full
benefits of energy storage technology, in the most cost effective manner. While recognizing that
energy storage serves functions of generation, the TF Report concludes that storage systems do
not require Commission CPCN authorization, reasoning that storage systems do not meet the
COMAR 20.79.01.02(11) (a) definition of “generation station” because they store rather than
produce electricity.9 Although this conclusion may dismiss some of the engineering, mechanical,
and chemical processes involved in energy storage systems, the PC 44 energy storage
workgroup generally agreed that energy storage systems do not fall under the definition of a
“generation station” under COMAR.
On the other hand, the energy storage workgroup also agreed that, from a legal
standpoint, defining a generation station for purposes of the CPCN statute does not carry
significant legal bearing on the question of whether storage should be considered generation.
Fundamentally, the CPCN statute and its implementing regulations constitute a framework that
the Commission uses to site or not site certain transmission and generation projects. The laws
were not written to answer the question of which technologies might be considered generation in
a deregulated regulatory scheme.
Although BGE, Delmarva Power, and Pepco (collectively, the “Joint Utilities”) concede
that energy storage devices like batteries do not fall clearly into the existing regulatory process,
they emphasize that batteries are not capable of generating energy, but rather capture and absorb
energy generated from another source, store it, and deliver it at a future time. The Joint Utilities
maintain that even if PJM defines a particular application of energy storage as a generation
service, the storage device is not actually a generator, energy storage resources are not actually
generation assets, and the Commission should not classify them as such. 9 The definition of “Generation station” at COMAR 20.79.01.02(11)(a) reads: “‘Generation station’” means property or facilities located in Maryland constituting an integral plant or unit for the production of electricity…”

A-5APPENDIX |
5
MEA and the Center for Renewables Integration, on the other hand, suggest that energy
storage be considered generation if it is providing as its primary function a generation service,
such as in certain circumstances participating in PJM wholesale energy markets. In that case, it
would be appropriate to afford energy storage the same regulatory treatment that traditional
generation receives when the storage serves a competitive function or service – i.e. if it is
providing bulk energy or consumer services, or providing ancillary services. The Center for
Renewables Integration suggests that the FERC policy statement summarizes the issues that need
to be resolved if energy storage is seeking both rate based (i.e. cost-based) and market based
revenues.10 MEA in particular finds it self-evident that such energy storage resources would
qualify under § 7-509(a)(1) as facilities or assets that relate to the generation, supply, or sale of
electricity. Under such a reading, the Commission would not regulate those assets as an electric
company service or function, and an electric company would not be able to recover on the costs
of those facilities within its rate base.11
The Office of People’s Counsel’s (“OPC”) view is that because the State is at a very early
stage in the development of storage as a utility-scale asset, it is difficult to categorize all of
storage’s possible uses. As such, it would be premature to adopt rules at this time prohibiting
utilities from owning storage because that type of regulatory framework could potentially
prevent cost-effective solutions. OPC states that because there are a number of options for the
10 FERC Docket No. PL 17-2-000, Utilization of Electric Storage Resources for Multiple Services When Receiving Cost-Based Rate Recovery, noting at page 11, “…if an electric storage resource seeks to recover its costs through both cost-based and market-based rates concurrently, the following issues…should be addressed: 1) the potential for combined cost-based and market-based rate recovery to result in double recovery of costs by the electric storage resource owner or operator to the detriment of cost-based ratepayers; 2) the potential for cost recovery through cost-based rates to inappropriately suppress competitive prices in the wholesale electric markets to the detriment of other competitors who do not receive such cost-based recovery, and 3) the level of control of the operation of an electric storage resource by an RTO/ISO that could jeopardize its independence from market participants.” FERC continues in the policy statement, however, to note that there are ways to address each such issue, explaining on pages 13-14 that with respect to the potential for double recovery of costs, “crediting any market revenues back to the cost-based ratepayers is one possible solution” where the “market-revenue offset can be used to reduce the amount of the revenue requirement to be used in the development of the cost-based rate” and stating on pages 15-16 regarding possible price suppression, that “electric storage resources may concurrently receive cost- and market-based revenues for providing separate services. We do not share commenters' concerns and are not convinced that allowing such arrangements will adversely impact other market competitors.” Finally, on the issue of RTO/ISO independence, FERC concluded on page 20 that “there is nothing unreasonable about an RTO/ISO exercising some level of control over the resources it commits or dispatches where it can be shown that the RTO/ISO independence is not at issue.” FERC explained that RTO/ISO control will be lower when storage resources are dispatched through the organized wholesale electric market clearing process, and will be higher when resources are operated outside of the organized wholesale electric market clearing process to address reliability needs. 11 Other hybrid approaches, also acceptable to MEA, would allow electric companies to recover the costs of storage assets only to the extent that they are used for distribution purposes.

A-6 | ENERGY STORAGE IN MARYLAND
6
ownership of utility-scale storage assets and different ways to deal with the costs and potential
revenues from such assets, a case-by-case approach to addressing those questions is better for
Maryland at this time. This will allow the Commission to consider the facts of each proposal and
gives the best opportunity for utility-scale storage to actually be deployed in the State in the near
term.
OPC suggests that the utilities should identify where and how storage assets could benefit
their systems and describe how the assets would be useful.12 This would include the function that
the storage asset will provide to the utility, and any available alternative solutions. According to
OPC, this type of information could lead to other questions of the utilities, which could elicit
information relevant to determining what other opportunities to deploy storage assets may exist.
The Energy Storage Association, along with other stakeholders, emphasizes that energy
storage systems bear the unique capability of providing services associated with generation,
transmission, and distribution. Therefore, they maintain, the goal of the workgroup should be
less focused on defining storage within particular functional categories and more upon ensuring
that an effective competitive framework exists under which all cost-effective storage resources –
including those owned by distribution utilities, and by third-parties and customers – are
evaluated and procured. 13
B. Would Maryland law permit regulated utilities to own front-of-the meter energy storage
devices if they are treated like generation?
As part of the 2014 Task Force study, the Task Force directly confronted the question of
whether Maryland law permits regulated utilities (or electric distribution companies (“EDCs”))
to own and operate generation assets, as well as other questions concerning energy storage
systems. In its report, the Task Force concluded that EDC ownership of generation was
permitted, based on PUA §7-510(c)(6), if there is Public Service Commission approval after a
12 Although supportive of exploring how storage resources can benefit their distribution systems, the Joint Utilities state that they can install energy storage, like any other distribution system asset, if it makes economic sense – even if the utility is unable to access all available value streams with such resources. Furthermore, the Joint Utilities maintain that they should be able to own and operate energy storage resources, and participate in any available markets. The Joint Utilities note that access to the markets can generate revenue that can then be used to offset the capital costs of the energy storage resource, all for the benefit of utility ratepayers. 13 WGL Energy submitted written feedback suggesting that the definition of energy storage facilities as either generation or distribution is not as important as the functional classification of energy storage to support utility distribution versus competitive generation, as well as expressing WGL Energy’s view that utilities should not be permitted to own and operate energy storage facilities that are used to support electricity supply merchant functions. This feedback may be discussed further at future energy storage workgroup meetings.
A-7APPENDIX |
7
finding that the generation would help meet long term, anticipated demand in the State for
electricity supply.14
Other conclusions of the Task Force relevant to energy storage are that under current
Maryland law:
� The PSC is authorized to require or allow EDCs to construct and operate distributed generation facilities to meet long-term, anticipated demand in the State for electricity supply; � EDCs can own and operate energy storage systems; � EDCs are not prohibited from selling services from distributed generation facilities and energy storage systems into PJM wholesale markets; � After PSC approval, EDCs can sell services from distributed generation facilities and energy storage systems to microgrid retail customers;15 Although the TF Report carries the authority of the State’s former Energy Advisor and a
staff assembled from the Maryland Energy Administration and other State agencies, it is not
settled law, and incorporates the policy preferences of that particular Administration. It is
important to note, therefore, that the views of the current Administration carry added
significance, and are to some extent distinguishable. Indeed, as MEA notes in its analysis of the
practicality of relying on 7-510(c)(6) as a basis for utility ownership of energy storage: “while there could be a situation in which the Commission used this provision to require the utility to act in accordance with this provision, there would likely need to be a compelling reason for the Commission to do so (i.e. a large spike in anticipated electricity demand). In the absence of such a compelling reason, it is difficult to see how this would apply.”16
Although BGE’s Microgrid proposal17 afforded the Commission the opportunity to
address the ownership of generation assets, the Commission declined to address the Task Force’s
conclusion that regulated utilities can own and operate a generating asset in the form of a
microgrid under PUA §7-510(c)(6). Although the Commission ultimately rejected BGE’s
microgrid proposal, it did not base its decision on BGE ownership of generation assets. In
response to the contention of parties who argued that BGE failed to make a showing of long-term 14 See TF Report, p. 29.
15 Id. 16 MEA September 18, 2017 memo to the PC 44 Energy Storage Workgroup on Energy Storage Considerations. 17 In the Matter of the Baltimore Gas and Electric Company’s Request for Approval of Its Public Purpose Microgrid Proposal, Order No. 87669, Case No. 9416.

A-8 | ENERGY STORAGE IN MARYLAND
8
energy demand under PUA §7-510(c)(6), the Commission responded in its footnote 16 that it
declined “to decide here whether the statute requires such a finding.”
BGE, Delmarva Power, and Pepco maintain that there is no current law that prohibits
utilities from owning energy storage when it is compensated like generation in PJM markets, and
emphasize that PJM and FERC have not objected to the concept of allowing utilities18 to recoup
both cost and market-based revenues from energy storage systems that they own.19 Other
stakeholders like MEA, however, point out that Maryland’s deregulation laws lend credence to
the argument that utilities should not be able to recover on storage as a regulated asset when it
serves a competitive function. Certainly, there is no explicit prohibition on utility ownership of
energy storage, as neither the Maryland General Assembly nor the Commission have passed or
promulgated any law that addresses the issue. The corollary to that fact, however, is that there is
no explicit authorization (or regulatory framework) for utility ownership of energy storage,
either.
In sum, the legal authority of utilities to own energy storage could be clarified. Although
workgroup participants disagree regarding the legality of utility-owned energy storage, the
workgroup generally agrees that utilities should be allowed to own front-of-the-meter energy
storage when it has the primary purpose of supporting the distribution system. Given this
threshold agreement, it would be useful for the General Assembly or the Commission to provide
additional clarity on the issue. It would also be useful to discuss the ways under which the
Commission could regulate such an ownership structure.
IV. Proposed Pilot Programs
One method of clarifying the potential costs and benefits of certain ownership and
regulatory structures could be for the Commission to authorize or require utilities to conduct
pilot programs that explore various ownership models that may more fully realize the potential
for energy storage to provide value for Maryland ratepayers. To that end, the Energy Storage
Association in late 2017 proposed a “Proof of Regulatory Concept Program” to test innovative
regulatory concepts that can ultimately be the building blocks of a competitive framework for
energy storage. In ESA’s view, such a pilot program would also provide the benefit of being a 18 In its policy statement, FERC conditions its acceptance of such a mechanism on establishing adequate protections against effects on market clearing prices, by establishing prohibitions on double recovery and appropriate cost recovery mechanisms. FERC Docket No. PL 17-2-000, Utilization of Electric Storage Resources for Multiple Services When Receiving Cost-Based Rate Recovery, at p. 17 19 See id.

A-9APPENDIX |
9
“learning-by-doing” process that allows all stakeholders to identify and adjust any regulations
and permitting obstacles in order to facilitate the smooth deployment of energy storage in the
future.
Under the proposed Proof of Regulatory Concept Program, the Commission could
provide a list of regulatory mechanisms and commercial structures for the utilities to select over
a period of 2-3 years, with a program size of 5-10 MW (with a minimum of 15 megawatt hours).
The utilities could then select a minimum of two projects from the following regulatory
applications:
● Multiple Use Project: The purpose here is to test multiple applications of energy storage. For this project, the utilities would be able to lease a distribution grid asset to a third-party developer when it is not being used for grid support, in order to participate in the wholesale market. Under this scenario, the Commission would direct the utilities as to how the additional revenues should be used to drive down costs for ratepayers.
● Ownership Model Project: For this project, the Commission would test out an alternative
compensation mechanism that allows utilities to earn a similar return for contracting services from a third-party owned energy storage resource as if they rate-based the asset directly. One proposal discussed in the working group provides for a rate of return on the contract value, but there are alternative mechanisms that can be considered. Different arrangements regarding operational controls can also be tested for this project.
● Virtual Power Plant Project: This program allows utilities to contract with third-party
developers who own and operate a portfolio of behind-the-meter resources and synchronize them as a larger, unified, and flexible resource to meet the utility’s needs. Different arrangements regarding operational controls can also be tested for this project.
The Joint Utilities support the proposed Proof of Regulatory Concept Program, but only
if a fourth “utility-centric” model is included as a fourth project option. In this model, the utility
would own and operate the energy storage resource, and be able to offer the resource into all
available PJM wholesale markets when not otherwise being used for utility grid support, with
any realized market revenue being used to offset the costs of the energy storage resource, all to
the benefit of the utility’s ratepayers. The Joint Utilities argue that the inclusion of the fourth
option is necessary to ensure a full and complete comparison of possible energy storage
ownership models. Additionally, the requirement that each utility propose a minimum of two
projects would ensure that diverse applications are tested under the program. OPC raised
concerns about the need to demonstrate cost-effectiveness of pilot projects before they are

A-10 | ENERGY STORAGE IN MARYLAND
10
approved as well as a desire for more insight into the utilities’ decision making processes about
deploying storage and other distribution investments. Beyond these concerns, OPC also believes
that certain issues surrounding the pilots require further discussion and consideration, including
what insight or new information the pilots will offer, particularly in the short or medium term,
and how the utilities will ensure that the pilot programs do not delay the deployment of other
cost-effective storage assets that become available during the pendency of the programs.
ESA also recommended that timelines and next steps need to be clearly identified for
implementation for this Proof of Regulatory Concept Program to be effective in driving a
competitive landscape for energy storage in the state, and that a clear plan be in place to help
determine next steps, once the results of the pilot are assessed.
ESA submitted the following proposed timeline for the work group’s consideration:
1. Within 60 days of the launch of the program, the compliant entities should institutionalize a working group of key stakeholders who will review project proposals, standard contracts and solicitation materials.
a. The working group should begin developing a standard contract as well as review request for offers (RFO) materials so that utilities are able to secure resources in a timely manner once the Commission has approved proposed projects.
2. Within 180 days of program launch, the utilities must propose projects to the Commission. Project proposals should be filed within the designated docket.
a. Projects should be presented to the stakeholder group before being submitted to the Commission.
3. The Commission should approve, reject, or request modification of the proposed projects within 90 days of submission.
4. Depending on the project selection, the utilities must take action within 30 days of Commission approval of projects to secure projects. For scenarios that have been determined to require a competitive solicitation the utilities would release a RFO or other mechanism deemed appropriate by the Commission for the projects described in the application.
5. Utilities should finalize contracts for the projects within 120 days of launch of RFO or other solicitation mechanism deemed appropriate by the Commission.
6. Pilot program data collection will run twelve months from the date that projects are operational.
a. Data collection requirements should be identified in the working group. 7. At the end of the twelve month period, the Commission will evaluate the efficacy and
appropriateness of the regulatory and commercial structures tested in this program and – if deemed effective – consider broader adoption of these mechanisms.
8. At the end of the twelve month period, cost recovery method should be evaluated for the Commission to determine if the mechanism is appropriate for the duration of the contract life or if another cost recovery option is preferred.

A-11APPENDIX |
11
The Joint Utilities also support the idea of submitting a proposed timeline, but take the
position that the timeline could be much simpler, offering dates and time periods for key events
such as utility proposal submission, a Commission decision on the submitted proposals, the
issuance of any RFO or solicitation mechanism, and project completion.
In addition to further discussing these and other potential concerns, the workgroup will
need to address several additional outstanding items of what a potential pilot program might look
like, including: (1) which entities are required to comply with the program; (2) finalizing what
regulatory applications/mechanisms the program aims to test (including what type of cost
recovery mechanisms will be offered in this program and any related steps needed to implement
those cost recovery mechanisms); (3) what data will be collected as part of the pilot program and
how will it be made public; and (4) metrics to evaluate efficacy and appropriateness of these
regulatory concepts at the end of the program period.

A-12 | ENERGY STORAGE IN MARYLAND
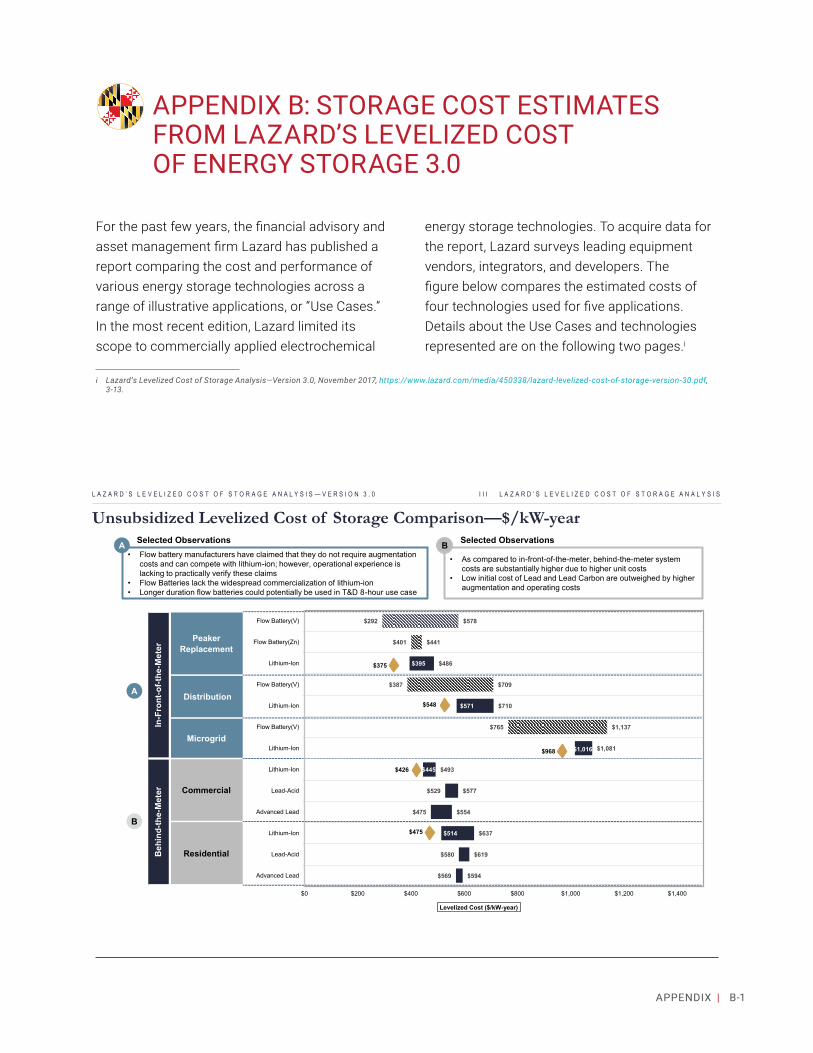
B-1APPENDIX |
For the past few years, the financial advisory and asset management firm Lazard has published a report comparing the cost and performance of various energy storage technologies across a range of illustrative applications, or “Use Cases.” In the most recent edition, Lazard limited its scope to commercially applied electrochemical
i Lazard’s Levelized Cost of Storage Analysis—Version 3.0, November 2017, https://www.lazard.com/media/450338/lazard-levelized-cost-of-storage-version-30.pdf, 3-13.
energy storage technologies. To acquire data for the report, Lazard surveys leading equipment vendors, integrators, and developers. The figure below compares the estimated costs of four technologies used for five applications. Details about the Use Cases and technologies represented are on the following two pages.i
APPENDIX B: STORAGE COST ESTIMATES FROM LAZARD’S LEVELIZED COST OF ENERGY STORAGE 3.0
Copyright 2017 Lazard No part of this material may be copied, photocopied or duplicated in any form by any means or redistributed without the prior consent of Lazard.
Peaker Replacement
Distribution
Microgrid
Commercial
Residential
In-F
ront
-of-t
he-M
eter
Beh
ind-
the-
Met
er
$426
$292
$401
$395
$387
$571
$765
$1,016
$445
$529
$475
$514
$580
$569
$578
$441
$486
$709
$710
$1,137
$1,081
$493
$577
$554
$637
$619
$594
$0 $200 $400 $600 $800 $1,000 $1,200 $1,400
Flow Battery(V)
Flow Battery(Zn)
Lithium-Ion
Flow Battery(V)
Lithium-Ion
Flow Battery(V)
Lithium-Ion
Lithium-Ion
Lead-Acid
Advanced Lead
Lithium-Ion
Lead-Acid
Advanced Lead
Levelized Cost ($/kW-year)
$375
$548
$968
$475
Unsubsidized Levelized Cost of Storage Comparison—$/kW-yearI I I L A Z A R D ’ S L E V E L I Z E D C O S T O F S T O R A G E A N A L Y S I SL A Z A R D ’ S L E V E L I Z E D C O S T O F S T O R A G E A N A L Y S I S — V E R S I O N 3 . 0
Denotes indicative Flow Battery LCOS value. Flow battery LCOS ranges are shaded given the lack of operational experience required to verify survey results. Source: Lazard and Enovation Partners estimates.Note: Here and throughout this presentation, unless otherwise indicated, analysis assumes 20% debt at an 8% interest rate and 80% equity at a 12% cost of equity.
All costs estimates are for 2017 unless otherwise noted. Flow Battery Vanadium and Flow Battery Zinc denoted in this report as Flow Battery(V) and Flow Battery(Zn), respectively.
• Flow battery manufacturers have claimed that they do not require augmentation costs and can compete with lithium-ion; however, operational experience is lacking to practically verify these claims
• Flow Batteries lack the widespread commercialization of lithium-ion • Longer duration flow batteries could potentially be used in T&D 8-hour use case
A
B
A• As compared to in-front-of-the-meter, behind-the-meter system
costs are substantially higher due to higher unit costs• Low initial cost of Lead and Lead Carbon are outweighed by higher
augmentation and operating costs
B
Peaker Replacement
Transmission/ Distribution
Microgrid
Commercial
Residential
Front
of the
Mete
rBe
hind t
he M
eter
$213
$291
$285
$189
$272
$281
$369
$895
$1,065
$957
$1,033
$1,169
$1,146
$418
$319
$351
$342
$338
$413
$392
$992
$1,161
$1,114
$1,282
$1,248
$1,196
$0 $200 $400 $600 $800 $1,000 $1,200 $1,400
FBV
FBZ
LiE
FBV
LiE
FBV
LiE
LiE
Pb
PbC
LiE
Pb
PbC
Levelized Cost ($/MWh)
Selected Observations Selected Observations
Denotes 2018 Estimate= 13

B-2 | ENERGY STORAGE IN MARYLAND
Copyright 2017 Lazard No part of this material may be copied, photocopied or duplicated in any form by any means or redistributed without the prior consent of Lazard.
Use Case Overview (cont’d)
I I L C O S M E T H O D O L O G Y , U S E C A S E S A N D T E C H N O L O G Y O V E R V I E WL A Z A R D ’ S L E V E L I Z E D C O S T O F S T O R A G E A N A L Y S I S — V E R S I O N 3 . 0
Lazard’s LCOS examines the cost of energy storage in the context of its specific applications on the grid and behind-the-meter; each use case specified herein represents an application of energy storage that market participants are utilizing now or will be utilizing in the near future Commonly employed energy storage technologies for each use case are included below
Use Case Description Technologies Assessed(2)
In-F
ront
-of-t
he-M
eter
Peaker Replacement
Large-scale energy storage system designed to replace peaking gas turbine facilities; brought online quickly to meet rapidly increasing demand for power at peak; can be quickly taken offline as power demand diminishes(1)
Lithium-Ion
Vanadium Flow Battery
Zinc Bromide Flow Batteries
Distribution Energy storage system designed to defer distribution upgrades, typically placed at substations or
distribution feeder controlled by utilities to provide flexible peaking capacity while also mitigating stability problems (typically integrated into utility distribution management systems)
Lithium-Ion
Vanadium Flow Battery
Microgrid
Energy storage system designed to support small power systems that can “island” or otherwise disconnect from the broader power grid (e.g., military bases, universities, etc.)
Provides ramping support to enhance system stability and increase reliability of service (emphasis is on short-term power output vs. load shifting, etc.)
Lithium-Ion
Vanadium Flow Battery
Beh
ind-
the-
Met
er Commercial
Energy storage system designed for behind-the-meter peak shaving and demand charge reduction services for commercial energy users
Units typically sized to have sufficient power/energy to support multiple Commercial energy management strategies and provide option of the system providing grid services to utility or wholesale market
Lithium-Ion
Lead-Acid
Advanced Lead (Lead Carbon)
Residential
Energy storage system designed for behind-the-meter residential home use—provides backup power, power quality improvements and extends usefulness of self-generation (e.g., “solar plus storage”)
Regulates the power supply and smooths the quantity of electricity sold back to the grid from distributed PV applications
Lithium-Ion
Lead-Acid
Advanced Lead (Lead Carbon)
(1) Specific operational revenue streams include: capacity, energy sales (e.g., time-shift/arbitrage, etc.), spinning reserve and non-spinning reserve.(2) Microgrid and Distribution use cases are beginning to use ZnBr flow batteries; however, they are not included in the LCOS output due to the limited sample size.
1
2
3
4
5
8

B-3APPENDIX |
Copyright 2017 Lazard No part of this material may be copied, photocopied or duplicated in any form by any means or redistributed without the prior consent of Lazard.
Energy Storage Use Cases—Operational Parameters
I I L C O S M E T H O D O L O G Y , U S E C A S E S A N D T E C H N O L O G Y O V E R V I E WL A Z A R D ’ S L E V E L I Z E D C O S T O F S T O R A G E A N A L Y S I S — V E R S I O N 3 . 0
For comparison purposes, this study assumes and quantitatively operationalizes five use cases for energy storage; while there may be alternative or combined/“stacked” use cases available to energy storage systems, the five use cases below represent illustrative current and contemplated energy storage applications and are derived from Industry survey data
Note: Distribution use case represents emerging longer duration application. (1) Indicates power rating of system (i.e., system size).(2) Indicates total battery energy content on a single, 100% charge, or “usable energy.” Usable energy divided by power rating (in MW) reflects hourly duration of system.(3) “DOD” denotes depth of battery discharge (i.e., the percent of the battery’s energy content that is discharged). Depth of discharge of 100% indicates that a fully charged battery
discharges all of its energy. For example, a battery that cycles 48 times per day with a 10% depth of discharge would be rated at 4.8 100% DOD Cycles per Day.(4) Indicates number of days of system operation per calendar year. (5) Usable energy indicates energy stored and able to be dispatched from system.
Project Life (Years) MW(1)
MWh of Capacity(2)
100% DOD Cycles/Day(3)
Days/Year(4)
AnnualMWh
ProjectMWh
In-F
ront
-of-t
he-M
eter
PeakerReplacement 20 100 400 1 350 140,000 2,800,000
Distribution 20 10 60 1 350 21,000 420,000
Microgrid 10 1 4 2 350 2,800 28,000
Beh
ind-
the-
Met
er
Commercial 10 0.125 0.25 1 250 62.5 625
Residential 10 0.005 0.01 1 250 2.5 25
= “Usable Energy”(5)
1
2
3
4
5
9

B-4 | ENERGY STORAGE IN MARYLAND
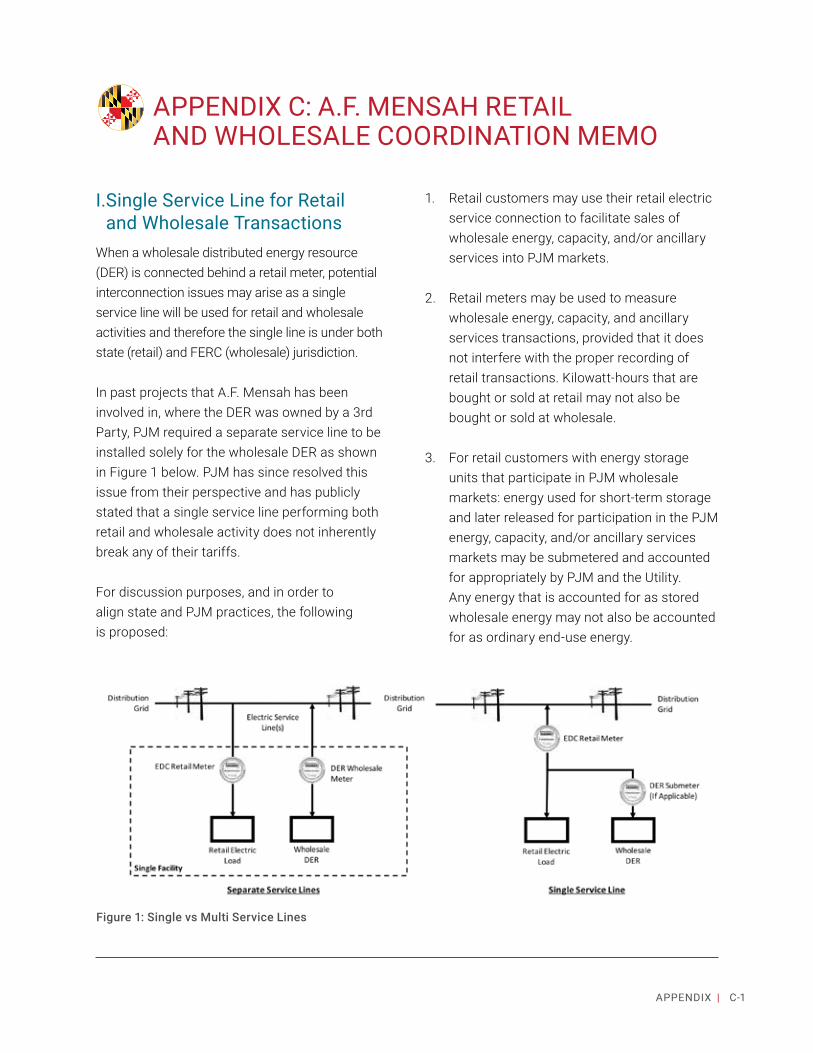
C-1APPENDIX |
I. Single Service Line for Retail and Wholesale Transactions
When a wholesale distributed energy resource (DER) is connected behind a retail meter, potential interconnection issues may arise as a single service line will be used for retail and wholesale activities and therefore the single line is under both state (retail) and FERC (wholesale) jurisdiction.
In past projects that A.F. Mensah has been involved in, where the DER was owned by a 3rd Party, PJM required a separate service line to be installed solely for the wholesale DER as shown in Figure 1 below. PJM has since resolved this issue from their perspective and has publicly stated that a single service line performing both retail and wholesale activity does not inherently break any of their tariffs.
For discussion purposes, and in order to align state and PJM practices, the following is proposed:
1. Retail customers may use their retail electric service connection to facilitate sales of wholesale energy, capacity, and/or ancillary services into PJM markets.
2. Retail meters may be used to measure wholesale energy, capacity, and ancillary services transactions, provided that it does not interfere with the proper recording of retail transactions. Kilowatt-hours that are bought or sold at retail may not also be bought or sold at wholesale.
3. For retail customers with energy storage units that participate in PJM wholesale markets: energy used for short-term storage and later released for participation in the PJM energy, capacity, and/or ancillary services markets may be submetered and accounted for appropriately by PJM and the Utility. Any energy that is accounted for as stored wholesale energy may not also be accounted for as ordinary end-use energy.
APPENDIX C: A.F. MENSAH RETAIL AND WHOLESALE COORDINATION MEMO
Figure 1: Single vs Multi Service Lines

C-2 | ENERGY STORAGE IN MARYLAND
4. For retail customers with small generators that participate in PJM wholesale markets: station power may be submetered and accounted for appropriately by PJM and the Utility. Any energy that is accounted for as station power may not also be accounted for as ordinary end-use energy. However, any station power that is purchased must be purchased at retail.
5. Energy stored for later release is excluded from station power.

D-1APPENDIX |
New YorkIn April 2014, New York Governor Andrew Cuomo introduced the Reforming the Energy Vision (known as REV), a multi-year effort intended to modernize the distribution grid, including the restructuring of utility ratemaking and how utilities earn revenues. REV is part of a larger New York campaign to reduce GHG emissions by 40 percent from 1990 levels by 2030 and 80 percent by 2050; achieve a 50 percent clean energy target by 2030; and decrease energy consumption in buildings by 23 percent from 2012 levels, which is equates to 600 trillion British thermal units (TBtu).i
The New York State Public Service Commission (NY PSC) directed its six investor-owned utilities in April 2016 to file Distribution System Implementation Plans (DSIP), both individually and jointly with other utilities. The DSIPs are to include load and DER forecasts; a means of coordinating with the New York Independent System Operator (NYISO) on short- and long-term forecasting; a non-wires analysis; a roadmap for determining available hosting capacity; and an interconnection data platform. The NY PSC is also requiring the establishment a Distribution System Platform (DSP). The DSP will be utilized by the utilities to forecast, plan, interconnect, monitor, control, and manage the DERs on the electric distribution system. Relative to energy storage, the NY PSC has required each utility to have energy storage projects in operation at no less than two
i New York State Department of Public Service – Reforming the Energy Vision, “About the Initiative,” August 10, 2017, http://www3.dps.ny.gov/W/PSCWeb.nsf/All/CC4F2EFA3A23551585257DEA007DCFE2?OpenDocument#.
separate distribution substations or feeders by the end of 2018.
California Since 1998, California has worked to integrate DERs into its grid. In the past, California has utilized multiple initiatives and proceedings to modernize its distribution grid, including integrating DERs, renewable energy, and demand-side resources. The proceedings include a Distributed Resource Plan (DRP), Integrated Demand-side Resource (IDER), rate reform efforts, DER incentive proposal, electric vehicles, energy storage, and distributed energy resource management (DERMS). DERMS, like New York’s DSP, would be a software system used to manage the distribution grid with BTM and DER assets.
Like New York, California’s Action Plan is driven by policy initiatives, including a requirement to reduce GHG emissions 40 percent by 2030, a doubling of its energy efficiency targets, and raising the California RPS to 50 percent by 2030. Of relevance to this report, the CPUC, in response to legislation enacted by the California Legislature, issued orders in 2013 and 2017, respectively, requiring the three large IOUs to procure 1,325 MW of energy storage by 2020 and 500 MW of BTM battery storage.
In 2016, the CPUC issued the DER Action Plan (Action Plan) to provide a long-term roadmap for integrating and implementing the various proceedings and efforts previously mentioned. The Action Plan divided the related proceedings
APPENDIX D: CALIFORNIA AND NEW YORK DISTRIBUTION PLANNING INITIATIVES

D-2 | ENERGY STORAGE IN MARYLAND
and efforts into three groups: (1) Rates and Tariffs; (2) Distribution Grid Infrastructure, Planning, Interconnection, and Procurement; and (3) Wholesale DER Market Integration and Interconnection. Some of the initiatives under the Action Plan include evaluating TOU tariffs, evaluating DRP demonstrations, and evaluating issues for utilizing DERs at both the transmission and distribution level. Some of the projects that have resulted include a pilot to evaluate the use of EVs as a demand response tool and installing a 30 MW battery power plant to replace the Aliso Canyon gas peaker plant.

E-1APPENDIX |
Advanced Metering Infrastructure (AMI) – An integrated network of digital hardware and software, which enables the collection, measurement, storage, and analysis of detailed, time-based information and the transmittal of such information between customers, utilities, and other third-party providers.
Alternating current (AC) – Flow of electricity whose polarity alternates between positive and negative.
Ancillary services – Those services that are necessary to support the transmission of capacity from generation resources to customer loads while maintaining reliable operation of the transmission system. Such services include frequency and voltage regulation, load following and ramping, black start, and spinning and non-spinning reserve capacity.
Anode – The negative electrode from which electrons flow out towards the external part of a circuit within a battery.
Behind-the-meter (BTM) – A renewable energy system designed to produce power for on-site use in a home, business, or facility.
Black start – The ability of a generating unit to start up without an outside electrical supply or to automatically remain operating at reduced levels when disconnected from the electric grid. Black start service is necessary to help ensure the reliable restoration of the grid following a blackout.
Build time –The total amount of time required to construct an energy storage facility, measured from the point of project announcement until full commissioning (including time required for permitting, siting, and other intermediary steps). Also referred to as lead time.
Capacity – The rate at which equipment can either generate, convert, or transfer energy. Battery capacity represents the maximum amount of energy that can be extracted from a battery under certain specified conditions.
Capacity rating – The amount of power that a storage unit can charge or discharge at once, usually measured in watts.
Capital cost – The cost to construct an energy storage facility, including engineering, legal, regulatory, equipment, space, and other one-time costs. Usually measured on a function of the capacity rating (i.e., $/kW).
Cathode – The positive electrode from which electrons flow out towards the external part of a circuit within a battery.
Certificate of Public Convenience and Necessity (CPCN) – A regulatory compliance certificate that gives the holder exclusive right to provide retail electricity service to an identified geographic area.
Charge – The process of injecting energy to be stored into the storage system. A charge is the conversion of electrical energy from an external source into chemical energy within a cell or battery.
GLOSSARY

E-2 | ENERGY STORAGE IN MARYLAND
Clean Peak Standard – A regulation that requires a certain percent of delivered electricity during a predetermined peak period to come from clean energy resources.
Coincident peak (CP) – The demand of a given customer or class of customers during periods of peak system demand.
Congestion – A situation during which power cannot be moved from where it is being produced to where it is needed for use because the transmission system does not have sufficient capability to carry the electricity.
Cost-benefit – A process that estimates the strength and weaknesses of transactions, projects, investments, etc. by assessing the relationship between the cost of the undertaking and the value of the resulting benefits.
Curtailment Avoidance – The process of avoiding output curtailment,; i.e., reduction or restriction of energy delivery, at certain times, preventing loss of energy production.
Cycle life –Number of charge and discharge cycles that a facility can continue to provide power and energy before its capacity falls below 80 percent of its original capacity rating. Sometimes measured as the years until the storage machinery requires replacement. Also referred to as project life or useful life.
Day-ahead energy market – A financial market where participants purchase and sell energy at fixed, day-ahead prices for the following day.
Demand – The maximum amount of electric energy at a given instant that is being delivered to or by a system or part of a system, generally
expressed in kilowatts or megawatts. It can also indicate the amount of power that must be supplied to a customer or an aggregate of customers (i.e., a load), typically expressed in MW.
Demand charge – The price paid by a retail electricity user for each unit of power draw on the electric grid. (That power draw drives the amount of electricity generation and T&D infrastructure needed by the utility to serve all load.) Typically, demand charges are applied to the maximum demand during a given month; hence, units are $/kW-month.
Demand response (DR) – Reduction of retail electricity end-users’ electric load (power draw) in response to control or price signals. DR resources are deployed and used in lieu of installing/operating peaking generation capacity.
Demand-side – Related to end-user electric demand.
Direct current (DC) – An electric charge that only flows in one direction.
Discharge – The process of extracting stored energy from a storage system.
Distributed energy resource (DER) – A relatively small and modular generator or storage device that is deployed at the subtransmission or distribution level.
Distributed generation (DG) – Generating resources located close to or on the same site as the facility using the power.
Duration – The length of time that a storage device can maintain its maximum output.

E-3APPENDIX |
Electric circuit – A path on which electrons from a voltage or current source flow.
Electric cooperative – An electric company that is owned by those using the system.
Electric current – The rate of flow of electricity, or the flow of electrons. The common metric is ampere or amp. AC and DC are the two types of electrical current.
Electric supply capacity – The use of energy storage to defer and/or to reduce the need to buy new central station generation capacity and/or purchase capacity in a wholesale electricity marketplace.
Electric time-shift (or arbitrage) – The method of capturing energy when the market value or need for that energy is lower; i.e., during off-peak periods, and then expelling that energy when the market value or need is higher.
Electric vehicle (EV) – A vehicle that is driven by an electric motor that draws its current from storage batteries.
Electrode – An electrical conductor through which an electric current enters or leaves a conducting medium, whether it be an electrolytic solution, solid, molten mass, or gas.
Electrolyte – For electrochemical batteries, a chemical compound that allows electricity to flow between positive and negative electrodes.
EmPOWER Maryland – Enacted into law in 2008 with the passage of Maryland House Bill (HB) 374, the EmPOWER Maryland Energy Efficiency Act of 2008 is an initiative that aims to achieve reductions in Maryland’s per capita electricity
consumption and peak demand relative to a historical baseline load.
End-use consumer – The person or entity that uses energy, as distinct from, for example, entities that engage in wholesale energy transactions or purchases made by a landlord or other “distributor.”
Energy – The ability a physical system has to do work on other physical systems, typically measured in kWh in the electric utility context.
Energy arbitrage – The process of purchasing energy at a lower price at one time and then selling it later for a higher price.
Energy density – Energy rating per unit of volume (e.g., kWh/m3).
Energy rating – The total volume of energy that a unit can hold, usually measured in watt-hours.
Energy storage – The capture of energy produced at one time for use at a later time.
Energy supplier – An entity that sells electricity to customers (and, in Maryland, is licensed to do so by the Maryland PSC).
Energy use – A measure of electrical power used over a period of time, usually expressed in kWh or MWh.
Environmental impact – Effect on the natural environment, including land alteration, disruption to wildlife, emissions from combustion, and toxic byproducts or remains.
Federal Energy Regulatory Commission (FERC) – An independent federal commission

E-4 | ENERGY STORAGE IN MARYLAND
responsible for regulating wholesale electric power transactions and the interstate transmission and sale of natural gas for resale. FERC is the federal counterpart to state utility regulatory commissions.
Federal Investment Tax Credit (ITC) – A federal solar tax credit that allows the owner, investor, or producer of a residential or commercial solar system to deduct 30 percent of the cost of installing the system from their taxes.
Frequency regulation – The constant adjustment of power to maintain grid frequency (i.e., the rate of waves of electric current, measured in hertz (Hz)) at a constant level to ensure grid stability.
Fuel cell – A cell that uses a chemical reaction to produce electric current.
Fuel hedging – A contractual tool used to reduce exposure to the volatility of fuel costs through advanced purchases of fuel at a fixed price.
Greenhouse gas (GHG) – Gases that absorb infrared radiation, trap heat within the atmosphere, and emit radiation in all directions, resulting in the general warming of the planet’s surface temperature. These include carbon dioxide (CO2), methane (CH4), nitrogen oxides (NOx), and fluorocarbons.
Grid – A network of generators, transformers, T&D lines, substations, and the end-user that comprise the physical utility electric power supply and T&D systems.
Heat rate – A measure of generating station thermal efficiency, commonly stated as British thermal units (Btu) per kWh; i.e., the amount of
fuel that is required to produce a certain amount of output. Since the heat rate increases as more fuel is required to produce the same amount of output, a higher heat rate represents a lower level of generating efficiency.
Hosting capacity – The capacity, or ability, of a system to “host” distributed generation, energy storage, and electric vehicles.
Independent System Operator (ISO) – An organization formed at the direction or recommendation of the FERC to coordinate, control, and monitor operation of the electrical power system. An ISO’s jurisdiction may be in one state or multiple states. Note that ISOs typically perform the same or similar functions as RTOs, but RTOs tend to have jurisdiction over larger geographic areas than ISOs. Some ISOs and RTOs also administer the marketplace for wholesale electricity.
Infrastructure deferral – The postponement of generation and T&D upgrades that would otherwise be necessitated by system constraints or reliability requirements.
Integrated Resource Plan (IRP) – A comprehensive electric resources planning framework that addresses all existing and possible electric supply resources and demand side alternatives, including those owned and controlled by the entity doing the planning, as well as other resources that can be provided by other providers. The objective is to identify the most optimal portfolio of electric resources (i.e., the mix that yields the lowest possible cost, possibly including environmental and societal externalities).
Interconnection – The physical connection between an electricity source and the electric

E-5APPENDIX |
power grid. Interconnection can also be defined as two or more electric systems having a common transmission line that permits a flow of energy between them. This physical connection allows for the sale or exchange of energy.
Investor-owned utility (IOU) – A utility whose assets are owned by investors (as distinct from public power agencies, cooperatives, and municipal utilities). An IOU is a for-profit, tax-paying utility company.
Levelized cost – The present value of the total cost of building and operating a generating plant over its economic life, converted to equal annual payments. Costs are levelized in real dollars (i.e., adjusted to remove the impact of inflation).
Levelized Cost of Energy (LCOE) – Net present value of the cost of stored energy output over the cycle life of an energy storage facility, usually represented as a function of the energy rating (i.e., $/kWh). Calculated by summing the total, time-value adjusted capital and operating cost, and dividing by the total potential energy output of the energy storage facility. A related term, levelized benefit of energy (LBOE) is created by replacing costs with benefits; e.g., the value of energy services provided or the energy output. The LCOE and LBOE of a technology may differ based on the proposed use of the storage device as well as inclusion or exclusion of policy incentives, such as subsidies.
Levelized Cost of Storage (LCOS) – The net present value of the cost of stored energy output over the life of an energy storage facility.
Lithium-ion battery – A type of rechargeable battery in which lithium ions move from the
negative electrode to the positive electrode during discharge, and then back when charging.
Load – Kilowatt or megawatt demand placed on the electric system by consumers of power.
Load following - Regulation of the power output of electric generators and storage devices within a prescribed area in order to maintain the scheduled system frequency and/or established interchange with other areas.
Load-serving entity (LSE) – Utilities, marketers, or aggregators who provide electric power to a large number of end-use customers. LSEs can also be providers of electric service, including competitive retailers, to retail customers.
Locational Marginal Pricing (LMP) – A method of setting prices in an ISO/RTO market whereby prices at specific locations on the grid are determined by the marginal price of generation of power available to that specific location. Prices vary from location to location based on transmission congestion and losses.
Maturity – Level of commercial readiness of an energy storage technology, reflective of the amount of additional development required before a technology can be widely deployed.
Microgrid – A combination of co-located resources that can operate as one entity that: (1) interacts with the greater electric grid (if available); or (2) is an autonomous power system that is not connected with a large power system (i.e., in “island” mode).
Municipal utility – An electric company owned and operated by a municipality serving residential, commercial, and/or industrial

E-6 | ENERGY STORAGE IN MARYLAND
customers, usually within the boundaries of the municipality.
Nanostructures for Electrical Storage (NEES) – A multi-institutional research center created by the U.S. Department of Energy that conducts fundamental research studying battery characteristics.
Negative price period – Period of time during which the cost of energy on the wholesale energy market falls below zero and power suppliers have to pay their wholesale customers to purchase electric energy. This may occur when electricity demand is low, but power generation is high and inflexible.
Net metering – A billing system that measures the flow of energy into and out of the energy grid by customers who generate their own electricity through a single bi-directional meter. The system allows these customers to sell the excess electricity generated by their DG systems back to their electric utility, usually at retail rates.
Non-coincident peak – The actual peak demand of a given customer or class of customers that is calculated using several readings taken at different times.
Non-spinning reserve – Offline generation capacity that can be ramped to capacity and synchronized to the grid within ten minutes of a dispatch instruction by the ISO/RTO, and that is capable of maintaining that output for at least two hours.
Non-wires alternative (NWA) – An electric grid investment or project that can replace the need for traditional T&D through a solution of DG,
energy storage, energy efficiency, DR, and grid software and controls.
Off-peak period – Those hours or other periods defined by North American Energy Standards Board (NAESB) business practices, contracts, agreements, or guides as periods of lower electrical demand.
On-peak period – Times when demand for electricity is highest (a/k/a peak demand). Typically occurs on weekdays during the summer months, when normal demand is high and when air conditioning is operating. Similarly, in some areas, on-peak times may be in the winter when high demand is combined with high heating-related power use.
Operating cost – Variable cost to operate and maintain the energy storage facility, including labor, materials, and other day-to-day expenses. Usually measured on a function of the energy rating (i.e., $/kWh).
Peak demand – The maximum instantaneous power draw from end-user loads over a designated period of time (e.g., a year, a month, or a season).
Peak shaving – The process of reducing consumption of electricity during the periods when the utility experiences peak demand.
Peaking plants – Power plants that operate for a relatively small number of hours, usually during peak demand periods. Such plants usually have high operating costs and low capital costs.
Penetration – The percentage of electricity generated by a resource in a particular geographical region.

E-7APPENDIX |
PJM – A federally regulated RTO that manages the wholesale electricity market and transmission system in a region encompassing the District of Columbia and all or parts of Delaware, Illinois, Indiana, Kentucky, Maryland, Michigan, New Jersey, North Carolina, Ohio, Pennsylvania, Tennessee, Virginia, and West Virginia.
Potential energy – Stored energy when an object is at rest. It describes how much work the object could do if set into motion.
Power – The rate of producing or consuming energy, measured in watts.
Power inverters – Transformers that convert DC power into AC power.
Power Plant Research Program (PPRP) – A subdivision of the Maryland DNR, the PPRP functions to ensure that Maryland meets its electricity demands at reasonable costs while protecting the state’s valuable natural resources. It provides a continuing program for evaluating electric generation issues and recommending responsible, long-term solutions.
Power Quality – A service that can be provided by storage to protect loads from short-duration events that may affect the voltage, frequency or other characteristics of power.
Ramping – The process of changing the load level of a power generating unit in a constant manner over a fixed period of time. You can either “ramp up” or “ramp down”.
Rate of return – The ratio of net operating income earned by a utility is calculated as a percentage of its rate base.
Reactive power – The resultant power, in watts, of an AC circuit when the current waveform is out of phase with the waveform of the voltage.
Real-time – Present time as opposed to future time.
Real-time market – The competitive generation market controlled and coordinated by the ISO/RTO that allows market participants to buy and sell wholesale electricity on demand.
Regional Transmission Expansion Plan (RTEP) – An annual plan that identifies transmission system upgrades and enhancements to be provided within the PJM territory.
Regional Transmission Organization (RTO) – An RTO controls, operates, and owns the transmission facilities held by a region’s vertically integrated public and private utilities. An RTO is independent of the transmission facility owners. The RTO operates the high voltage transmission grid to provide non-discriminatory access to the grid so that the lowest-priced wholesale power can be delivered to wholesale customers (e.g., LSEs), while the owners still market and sell power.
Reliability – The degree of performance of the bulk electric system that results in electricity being delivered to customers within accepted standards and in the amount desired. Reliability may be measured by the frequency, duration, and magnitude of adverse effects on the electric supply.
Reliability Pricing Model (RPM) – A PJM-run market that develops a long-term (three-year) pricing signal for capacity resources and LSE obligations. The RPM is consistent with the PJM RTEP planning process, and adds stability and a

E-8 | ENERGY STORAGE IN MARYLAND
locational nature to the pricing signal for capacity.
Renewable energy – Sources of energy that are continually being replaced such as energy from the sun (solar), wind, geothermal, and hydroelectric.
Renewable Energy Credit (REC) – Represents the property rights to the environmental, social, and other non-power qualities of renewable electricity generation. A REC, and its associated attributes and benefits, can be sold separately from the underlying physical electricity associated with a renewable-based generation source, and typically represents one MWh of renewable energy generation. Also known as a renewable energy certificate.
Renewable Energy Portfolio Standard (RPS) – Requires that a specific portion of retail electricity supply comes from specified renewable resources.
Renewables firming – The process of making intermittent power generation more predictable.
Reserve margin – The amount of unused available capability of an electric power system (at peak load for a utility system) as a percentage of total capability.
Resilience – The capacity of an energy system to tolerate disturbance and to continue to deliver affordable energy services to end-users.
Response time –The amount of time required to deploy an energy storage facility in response to a request for its use. Differs by energy storage method and intended device use. Also referred to as latency.
Retail rate – The final price paid by end- use customers.
Round-trip Efficiency (RTE) – Efficiency of the energy storage facility, calculated as the total percent of energy input (i.e., charge) that can ultimately be recovered during energy output (i.e., discharge). RTE accounts for energy losses due to the storage method.
Smart inverter – A power inverter that can synchronize power production with consumption in real-time, allowing customers to flexibly deploy energy storage for things like renewables firming without jeopardizing reliable power in the process.
Solar carve-out (or solar set-aside) – A requirement that a certain percentage of an RPS be met specifically with solar energy. Solar technologies eligible for compliance may vary depending on the goals of the policy.
Solar photovoltaic (PV) – PV devices use semiconducting materials to convert sunlight directly into electricity.
Space – Physical area required to host the energy storage facility.
Specific energy – Energy rating per unit of weight (e.g., kWh/ton).
Spinning reserves – The online reserve capacity that is synchronized to meet electric demand within ten minutes of dispatch instruction by the ISO/RTO.
Standard Offer Service (SOS) – For residential customers, entails a monthly customer charge and per-kWh charges. No per-kW charge is

E-9APPENDIX |
included in the SOS rate design, though capacity costs and similar costs that are related to peak demand are folded into the per-kWh charge.
Storage period – Length of time energy can be stored, ranging from seconds (e.g., flywheels) to months (e.g., molten salt thermal storage), before the charge naturally dissipates.
Submetering – The retail sale of electricity through individual meters to tenants in large office facilities or apartment buildings.
Supercapacitor – A device that can store a large amount of energy.
System capacity – The amount of power that can be charged or discharged at once within a system.
T&D Deferral – The postponement of electrical transmission and distribution upgrades needed to extend the life of existing T&D equipment.
Time-of-use (TOU) – Refers to a price structure for electric energy that is specific to the time (season, day of week, time of day) when the energy is purchased.
Time-of-use rates – A utility rate structure that charges higher rates during peak hours of the day in an effort to shift peak period demand to off-peak hours.
Time-shift – The ability to shift energy consumption or production from one period to another. In the context of energy storage, time-shift is defined as the storage of energy during times when cost or price is low, for use or sale when the energy’s value is high.
Time-varying rates – A pricing schedule where the price per kWh of electricity is higher during peak periods and lower during off-peak periods. This is a form of demand management.
Transformer – An electrical device that transfers electrical energy between two or more circuits through electromagnetic induction.
Transmission and Distribution (T&D) – The different stages of carrying electricity through lines and poles from generators to an end-user. Transmission lines move electricity from a generator or power plant to various substations and operate at higher voltage ranges than distribution lines. Distribution lines carry electricity from the substation to the customer.
Value of Lost Load (VOLL) – The monetary value representing the cost of an interruption of electricity supply.
Value stacking – A practice that allows energy storage to derive value from serving multiple applications over different times.
Virtual power plant – A network of DERs that can be aggregated and operated as if they were one entity (i.e., a virtual power plant). The aggregated resources may be used to enhance power generation by managing the supply and demand balance and/or selling power on the wholesale electric market.
Volt – A unit of electric potential energy. 1 kilovolt (kV) = 1,000 volts.
Volt-ampere reactive (VAR) – A unit of reactive power in AC circuits.

E-10 | ENERGY STORAGE IN MARYLAND
Voltage – The pressure that guides power or makes electric charges move in an electrical conductor. Commonly referred to as electromotive force.
Voltage/VAR Support – The use of generation or energy storage to produce reactive power in order to maintain grid voltage within specified limits.
Watt – The electrical unit of power or rate of doing work. 1 kW = 1,000 watts; 1 MW = 1,000,000 watts.
Watt-hour – An electric energy unit of measure that is equal to one watt of power supplied or taken steadily from an electric circuit for one hour.
Wholesale energy market – A financial market that allows for the purchase and sale of large quantities of the electricity produced by different energy resources between utility companies and energy suppliers.
Wholesale energy price – The price at which energy is sold by energy suppliers, in a wholesale energy market, to energy distributers and utility companies, for the resale of the energy to end-use customers.

F-1APPENDIX |
AC Alternating current
ACC Arizona Corporation Commission
ACES Advancing Commonwealth Energy Storage (Massachusetts)
AMI Advanced Metering Infrastructure
APS Arizona Public Service
ARPA-E Advanced Research Projects Agency-Energy
ASOT Advanced Storage Optimization Tool
BGE Baltimore Gas & Electric Company
BPU Board of Public Utilities (New Jersey)
BQDM Brooklyn-Queens Demand Management Program (New York)
BTM Behind the meter
C&I Commercial and industrial
CAES Compressed air energy storage
CAGR Compound annual growth rate
CAISO California Independent System Operator
CCERI Community Clean Energy Resiliency Initiative (Massachusetts)
CEC California Energy Commission
CESA Clean Energy States Alliance
COMAR Code of Maryland Regulations
CP Coincident peak
CPCN Certificate of Public Convenience and Necessity
CPS Clean Peak Standard
CPUC California Public Utilities Commission
CREB Center for Research in Extreme Batteries
CRI Center for Renewables Integration
DC Direct current
DER Distributed energy resource
DoD U.S. Department of Defense
DOE U.S. Department of Energy
DOER Department of Energy Resources (Massachusetts)
LIST OF ACRONYMS

F-2 | ENERGY STORAGE IN MARYLAND
DNR Department of Natural Resources (Maryland)
DR Demand response
DSM Demand side management
EE Energy efficiency
EE&C Energy efficiency and conservation
EEI Edison Electric Institute
EPIC Electric Program Investment Charge (California)
EPRI Electric Power Research Institute
ERB Energy Resilience Bank (New Jersey)
ESA Energy Storage Association
EUL Enhanced Use Leasing
EV Electric vehicle
EWEB Eugene Water and Electric Board (Oregon)
FERC Federal Energy Regulatory Commission
FOM Front of the meter
GHG Greenhouse gas
GIWH Grid-interactive water heater
GMP Green Mountain Power
GW Gigawatt
GWh Gigawatt-hour
HB House Bill
HECO Hawaiian Electric Companies
IGCC International Green Construction Code
IOU Investor-owned utility
IREC Interstate Renewable Energy Council
IRP Integrated resource plan
ISO Independent System Operator
ISO-NE Independent System Operator of New England
ITC Investment tax credit
kW Kilowatt
kWh Kilowatt-hour
LBOE Levelized benefit of energy

F-3APPENDIX |
LCOE Levelized cost of energy
LCOS Levelized cost of storage
LEED Leadership in Energy and Environmental Design
LMI Low- and middle-income
LMP Locational Marginal Price
LSE Load-serving entity
MassCEC Massachusetts Clean Energy Center
MCEC Maryland Clean Energy Center
MDOT Maryland Department of Transportation
MEA Maryland Energy Administration
MEI2 Maryland Energy Innovation Institute
MISO Midcontinent Independent System Operator
MTA Maryland Transit Administration
MW Megawatt
MWh Megawatt-hour
NEES Nanostructures for Electrical Energy Storage
NGO Non-governmental organization
NIBC National Interagency Biodefense Campus
NREL National Renewable Energy Laboratory
NWA Non-wires alternative
NYISO New York Independent System Operator
NYSERDA New York State Energy Research and Development Authority
O&M Operations and maintenance
OPC Maryland Office of Peoples’ Counsel
PBI Performance-based incentive
PC Public Conference
Pepco Potomac Electric Power Company
PG&E Pacific Gas & Electric
PGE Portland General Electric
PHI Pepco Holdings, Inc.
PJM PJM Interconnection, LLC
PPA Power purchase agreement

F-4 | ENERGY STORAGE IN MARYLAND
PPRAC Power Plant Research Advisory Committee
PPRP Power Plant Research Program
PSC Public Service Commission (Maryland)
PUC Public Utility Commission
PUCN Public Utilities Commission of Nevada
PV Photovoltaic
R&D Research and development
RAP-WECC Regulatory Assistance Project – Western Electric Coordinating Council
REC Renewable energy credit
RESA Retail Energy Supply Association
RFP Request for Proposal
RGGI Regional Greenhouse Gas Initiative
RPM Reliability Pricing Model
RPS Renewable Energy Portfolio Standard
RTE Round-trip efficiency
RTEP Regional Transmission Expansion Plan (PJM)
RTO Regional Transmission Organization
SGIP Self-Generation Incentive Program (California)
SMART Solar Massachusetts Renewable Target (Massachusetts)
SMECO Southern Maryland Electric Cooperative
SOS Standard Offer Service
SREC 2 Solar Renewable Energy Credit II (Massachusetts)
T&D Transmission and distribution
TOU Time of use
USACE U.S. Army Corps of Engineers
VOLL Value of Lost Load
WCEF Washington Clean Energy Fund
WG Work Group