energy storage (battery) systemsecee.colorado.edu/~ecen5017/lectures/cu/l13_slides.pdf ·...
TRANSCRIPT

Energy Storage (Battery) Systems
• Overview of performance metrics• Introduction to Li‐Ion battery cell technology
• Electrochemistry• Fabrication
• Battery cell electrical circuit model• Battery systems: construction and modeling• Battery management system (BMS)
• Functions and circuit implementation • Cell balancing• Simulation examples
1
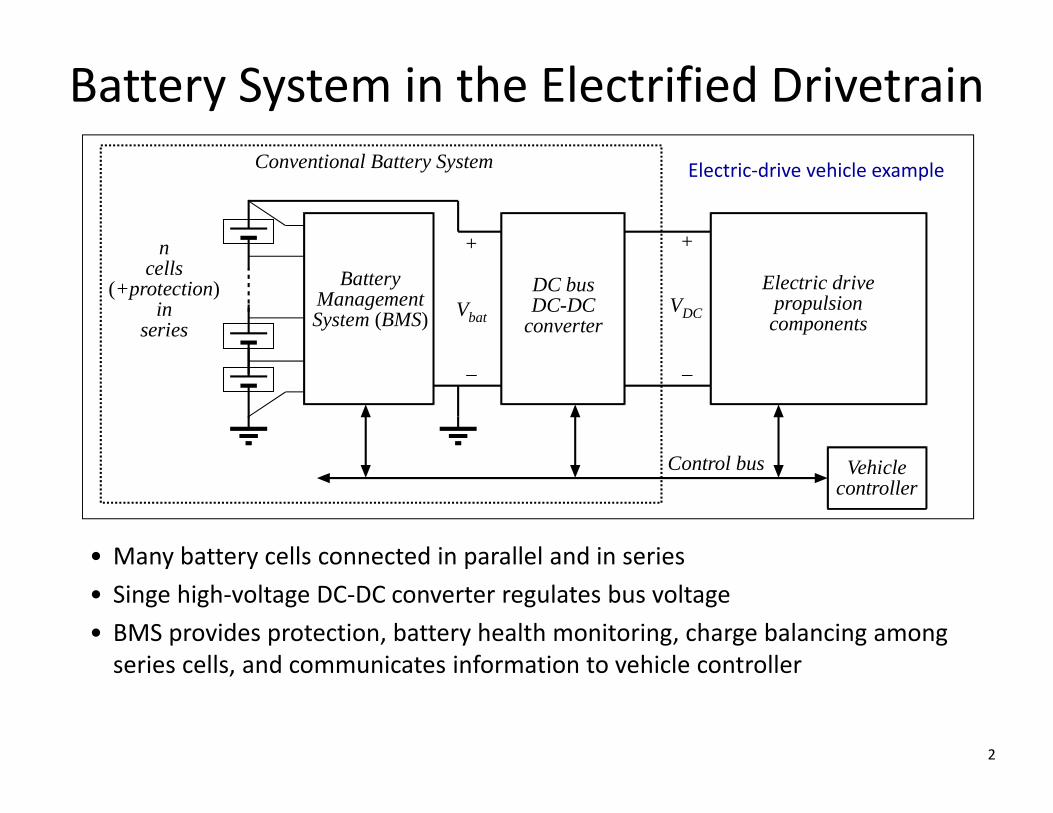
Battery System in the Electrified Drivetrain
DC busDC-DC
converter
BatteryManagementSystem (BMS)
Control bus
Vbat
+
_
VDC
+
_
Electric drivepropulsioncomponents
Vehiclecontroller
ncells
(+protection)in
series
Conventional Battery System
• Many battery cells connected in parallel and in series• Singe high‐voltage DC‐DC converter regulates bus voltage• BMS provides protection, battery health monitoring, charge balancing among series cells, and communicates information to vehicle controller
Electric‐drive vehicle example
2

Battery Performance Metrics
Energy• Available energy storage between charging cycles
• A*hr rating• Specific energy, Wh/kg, energy density Wh/L
Power• Instantaneous power available
• “C” rating: peak discharge current
• Specific power, W/kg, W/L
Cost• Initial investment• Total energy cost over life of battery
Safety• Hazardous chemical content
• Outgassing• Risk of fire from damage or heating
Lifetime• Number of charge / discharge cycles to 80% capacity
• Dependence on % discharge and peak currents
3
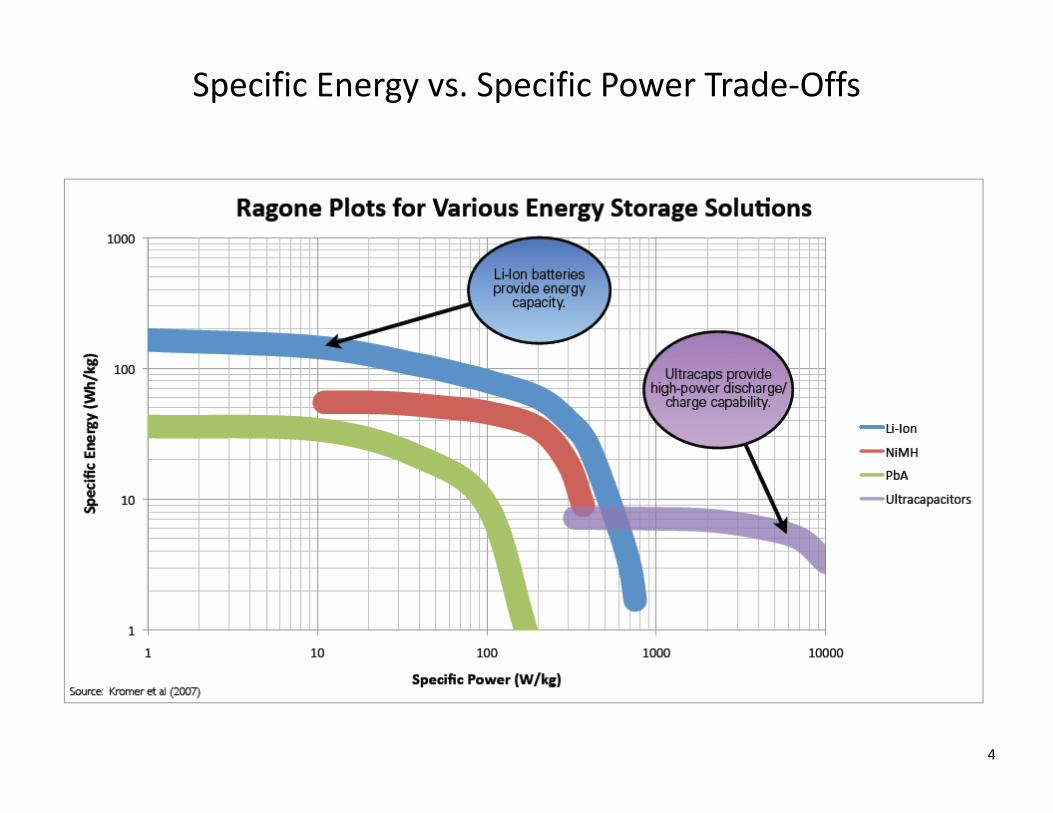
Specific Energy vs. Specific Power Trade‐Offs
4

Energy Density and Specific Energy
5
Volumetric energy density
Gravimetric
ene
rgy de
nsity
(spe
cific ene
rgy)
For comparison, energy density and specific energy of gasoline are orders of magnitude higher: 9700 Wh/L, 13000 Wh/kg

Battery cycle life comparison
6

Comparison of Battery Technologies
Many competing technologies, no clear winners
7
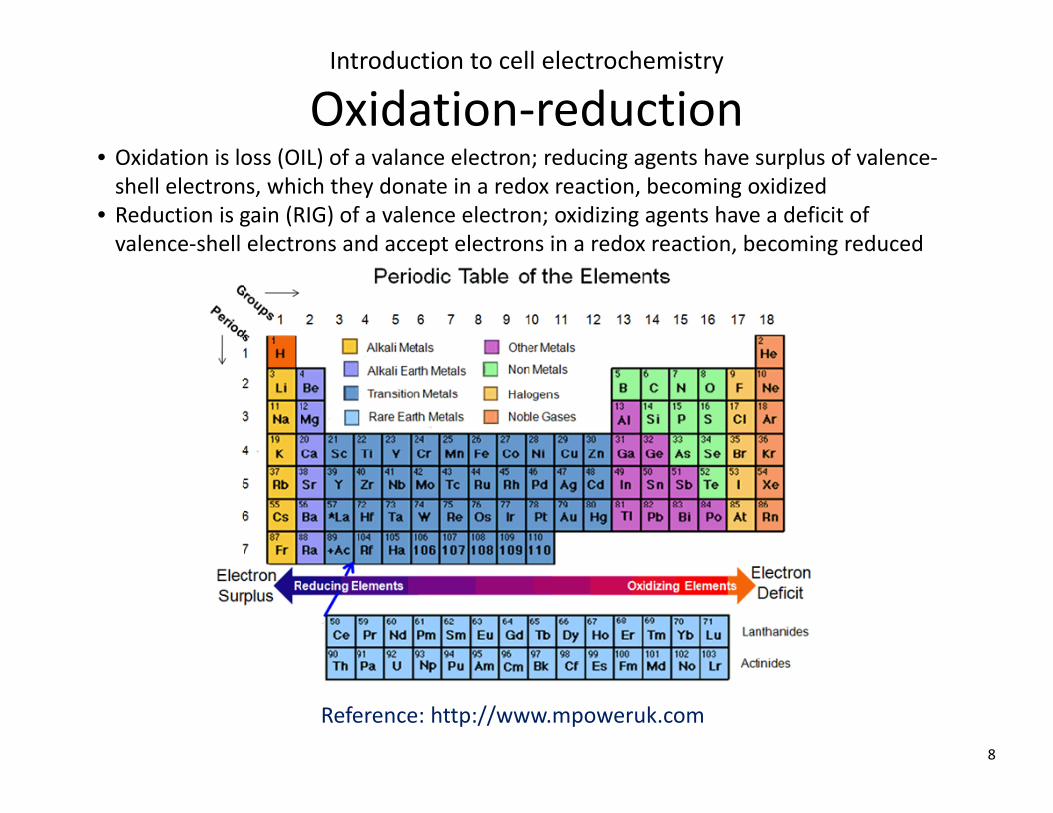
Introduction to cell electrochemistry
Oxidation‐reduction
8
• Oxidation is loss (OIL) of a valance electron; reducing agents have surplus of valence‐shell electrons, which they donate in a redox reaction, becoming oxidized
• Reduction is gain (RIG) of a valence electron; oxidizing agents have a deficit of valence‐shell electrons and accept electrons in a redox reaction, becoming reduced
Reference: http://www.mpoweruk.com
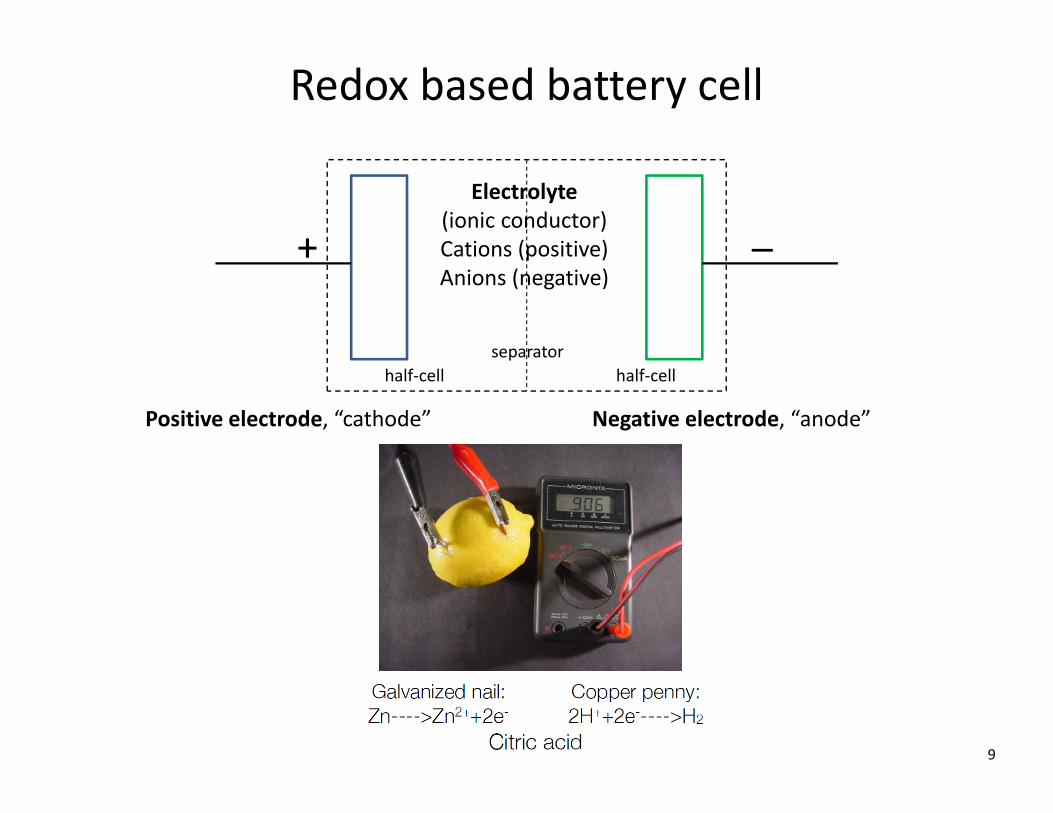
Redox based battery cell
9
Electrolyte(ionic conductor)Cations (positive)Anions (negative)
+ _
Negative electrode, “anode”Positive electrode, “cathode”
separatorhalf‐cell half‐cell
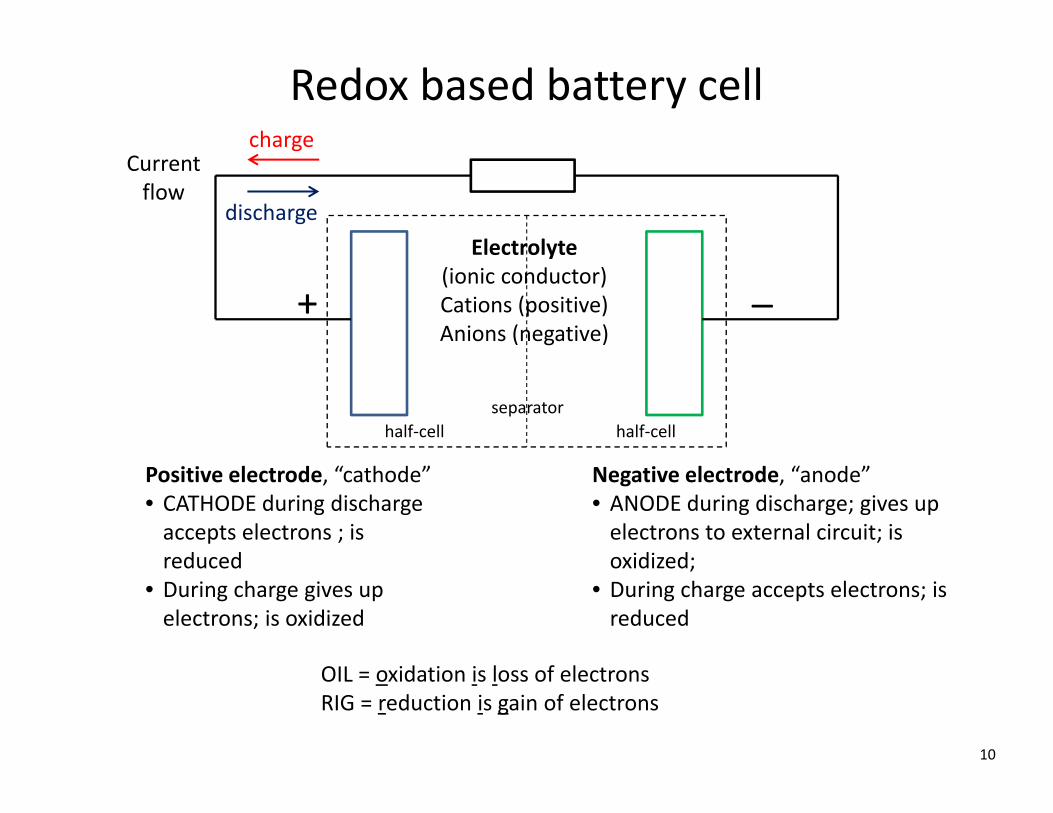
Redox based battery cell
10
Electrolyte(ionic conductor)Cations (positive)Anions (negative)
+ _
charge
discharge
Current flow
Negative electrode, “anode”• ANODE during discharge; gives up electrons to external circuit; is oxidized;
• During charge accepts electrons; is reduced
Positive electrode, “cathode”• CATHODE during discharge accepts electrons ; is reduced
• During charge gives up electrons; is oxidized
separatorhalf‐cell half‐cell
OIL = oxidation is loss of electronsRIG = reduction is gain of electrons
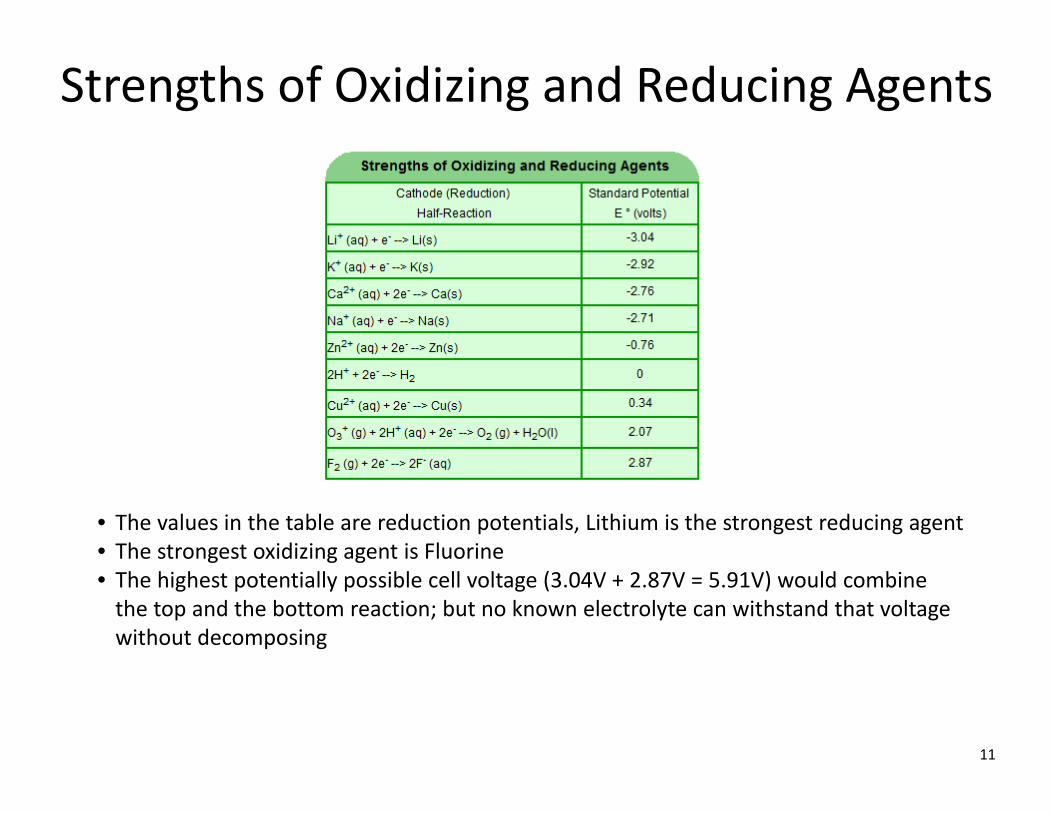
Strengths of Oxidizing and Reducing Agents
11
• The values in the table are reduction potentials, Lithium is the strongest reducing agent• The strongest oxidizing agent is Fluorine• The highest potentially possible cell voltage (3.04V + 2.87V = 5.91V) would combine the top and the bottom reaction; but no known electrolyte can withstand that voltage without decomposing

Example of a standard redox‐based battery cell
Lead‐Acid battery cell
+
Sulfuric acidH2SO4 + H2O
Lead dioxidePbO2
Porous leadPb
1.685 eV 0.356 eV
• Open‐circuit cell voltage (Nernst equation): 1.685V + 0.356V + Vt ln((electrolyte concentration)/1 mol)Vt = thermal voltage = kT/q = 26 mV at room temperature
• SOC directly determined by acid concentration (6 mol at 100%, 2 mol at 0%)• Energy density: 30‐40 Wh/kg, 60‐75 Wh/l• Cost: $(0.1‐0.2)/Wh
12

Nickel‐Metal Hydride: NiMH
• Open‐circuit cell voltage: 0.83V + 0.52V + Vt ln(electr.conc/1 mol) 1.4 V• SOC directly determined by electrolyte concentration (6 mol at 100%)• Energy density: 70 Wh/kg, 170 Wh/l• Cost: $(0.5‐1)/Wh
MH + OH > M + H2O + e‐0.83 eV
NiOOH + H2O + e > Ni(OH)2 + OH
+
PotassiumhydroxideKOH + H2O
Nickel oxyhydroxideNiOOH
Metal alloyMH
0.52 eV
13
• Not a standard redox‐based cell• Metallic alloy (“hydrate”) has the ability to absorb hydrogen• Electrolyte transports hydrogen between the electrodes but does not participate in the reactions

Example: 2004 Prius battery
Battery pack28 modulesVDC = 202 VEbat = 1.3 kWhPack weight: 30 kgSOCmin = 35%SOCmax = 75%$3K retail replacement cost
19.6mm(W)×106mm(H)×285mm(L)
http://www.peve.jp/e/hevjyusi.html
NiMH Module6‐cell (7.2 V) NiMH modules, 6.5 Ah at C/246 Wh/kg1.3 kW/kg
14

Lithium‐Ion Chemistry
A. Pesaran (NREL), “Battery Choices for Different Plug‐in HEV Configurations,” Plug‐in HEV Forum, July 12, 2006
15
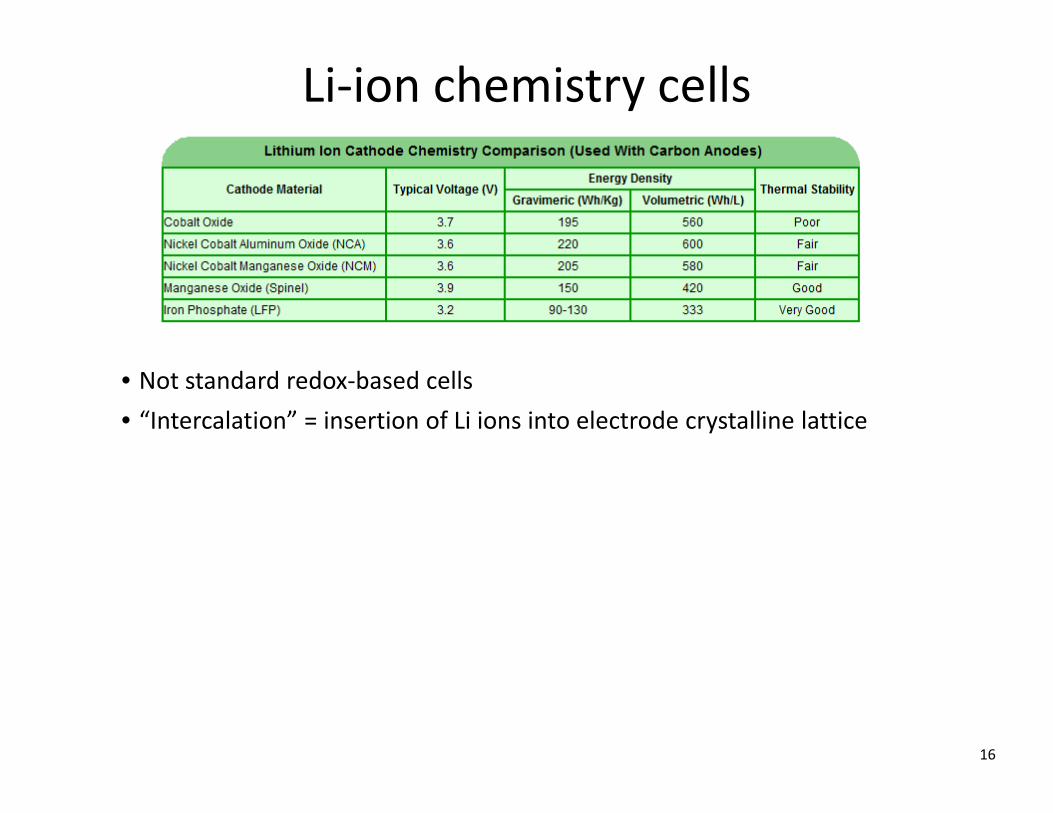
Li‐ion chemistry cells
16
• Not standard redox‐based cells• “Intercalation” = insertion of Li ions into electrode crystalline lattice
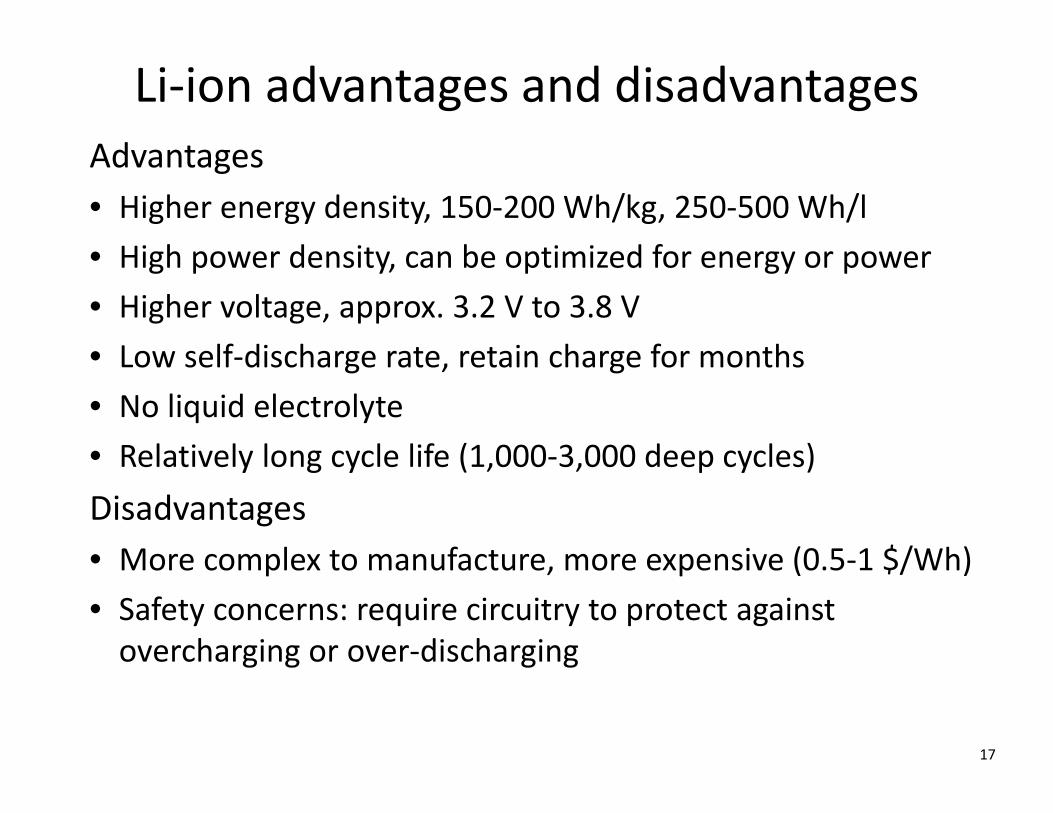
Li‐ion advantages and disadvantagesAdvantages• Higher energy density, 150‐200 Wh/kg, 250‐500 Wh/l• High power density, can be optimized for energy or power• Higher voltage, approx. 3.2 V to 3.8 V• Low self‐discharge rate, retain charge for months• No liquid electrolyte• Relatively long cycle life (1,000‐3,000 deep cycles)Disadvantages• More complex to manufacture, more expensive (0.5‐1 $/Wh)• Safety concerns: require circuitry to protect against overcharging or over‐discharging
17

Cell Equivalent‐Circuit Models
18
Reference:
[Plett 2004‐2] G. Plett, “Extended Kalman Filtering for Battery Management Systems of LiPB‐Based HEV Battery Packs—Part 2: Modeling and Identification,” Journal of Power Sources, Vol. 134, No. 2, August 2004, pp. 262–76.
Objective:• Dynamic circuit model capable of predicting cell voltage in response to charge/discharge current, temperature
Further key techniques discussed in [Plett 2004‐Part 2] and [Plett 2004‐Part 3]• Model parameters found using least‐square estimation or Kalman filter techniques based on experimental test data
• Run‐time estimation of state of charge (SOC)
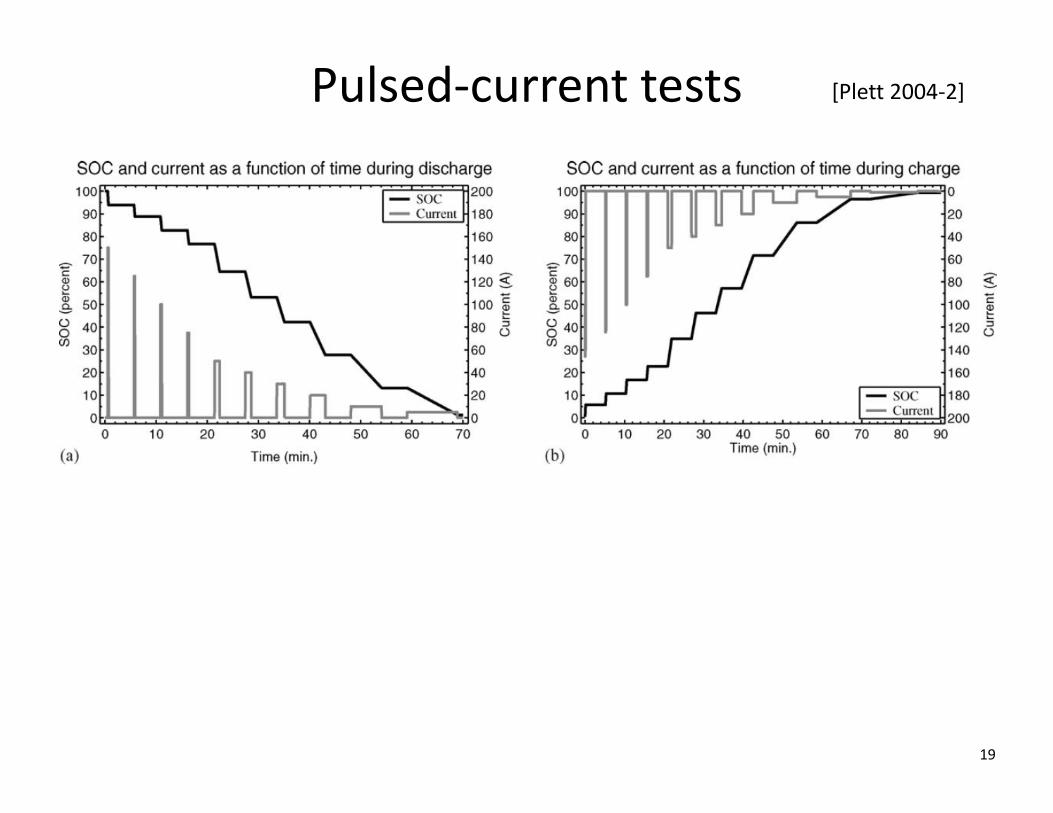
Pulsed‐current tests
19
[Plett 2004‐2]
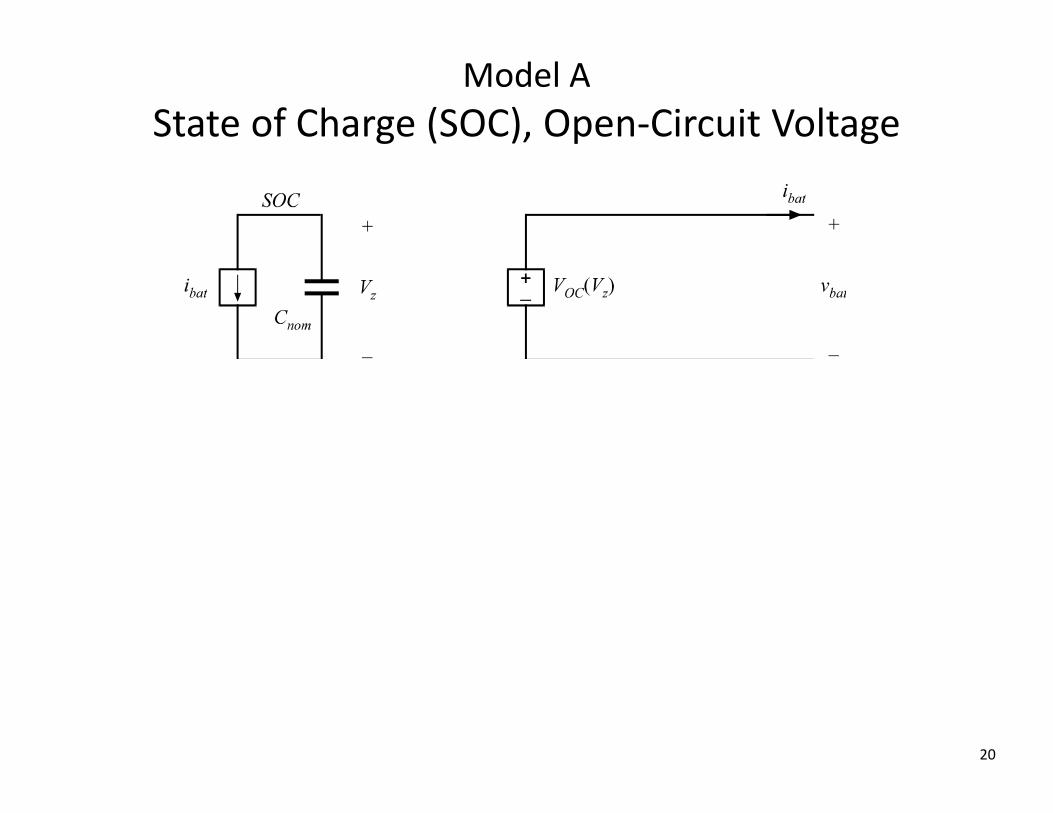
Model AState of Charge (SOC), Open‐Circuit Voltage
20

21

Open‐Circuit Voltage as a Function of SOC
22
0 10 20 30 40 50 60 70 80 90 1003
3.2
3.4
3.6
3.8
4
4.2
4.4
Example

Model BState of Charge (SOC), Open‐Circuit Voltage, Series Resistance
23
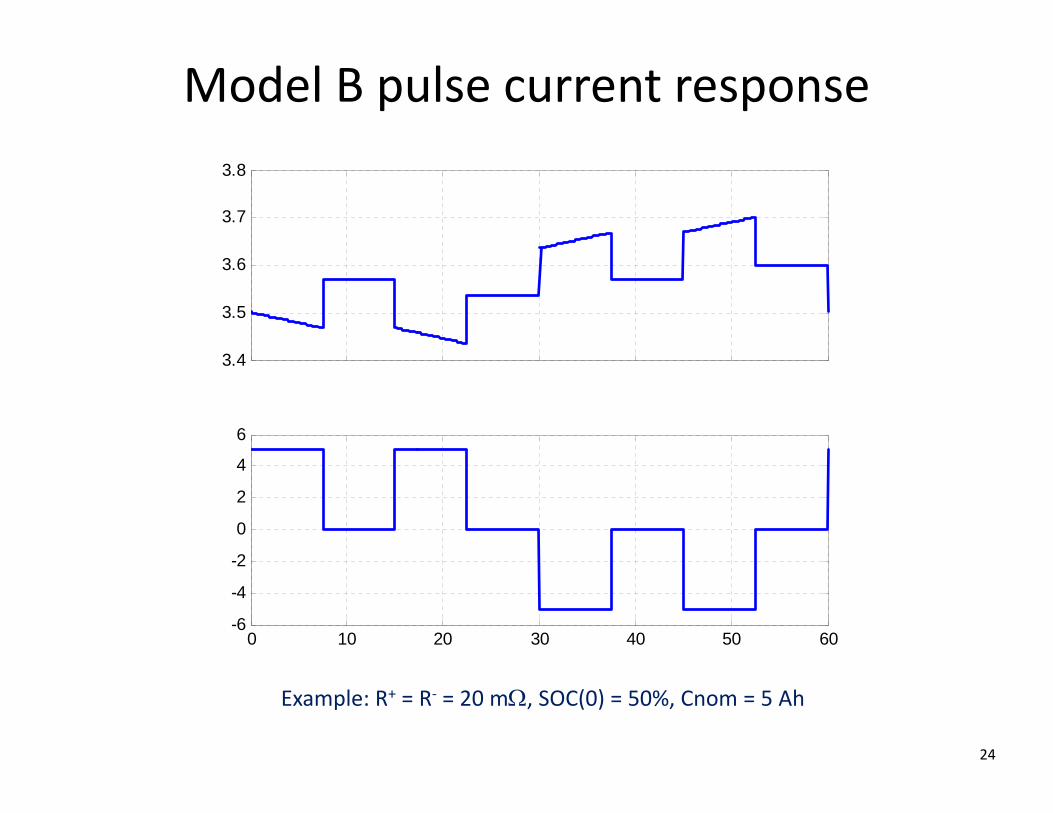
Model B pulse current response
24
3.4
3.5
3.6
3.7
3.8
0 10 20 30 40 50 60-6
-4
-2
0
2
4
6
Example: R+ = R‐ = 20 m, SOC(0) = 50%, Cnom = 5 Ah

Model B (simple model) performance
25
[Plett 2004‐2]
RMS voltage error with respect to experimental data: 36.2 mV

Model CState of Charge (SOC), Open‐Circuit Voltage, Series Resistance,
Voltage Hysteresis (zero‐state)
26
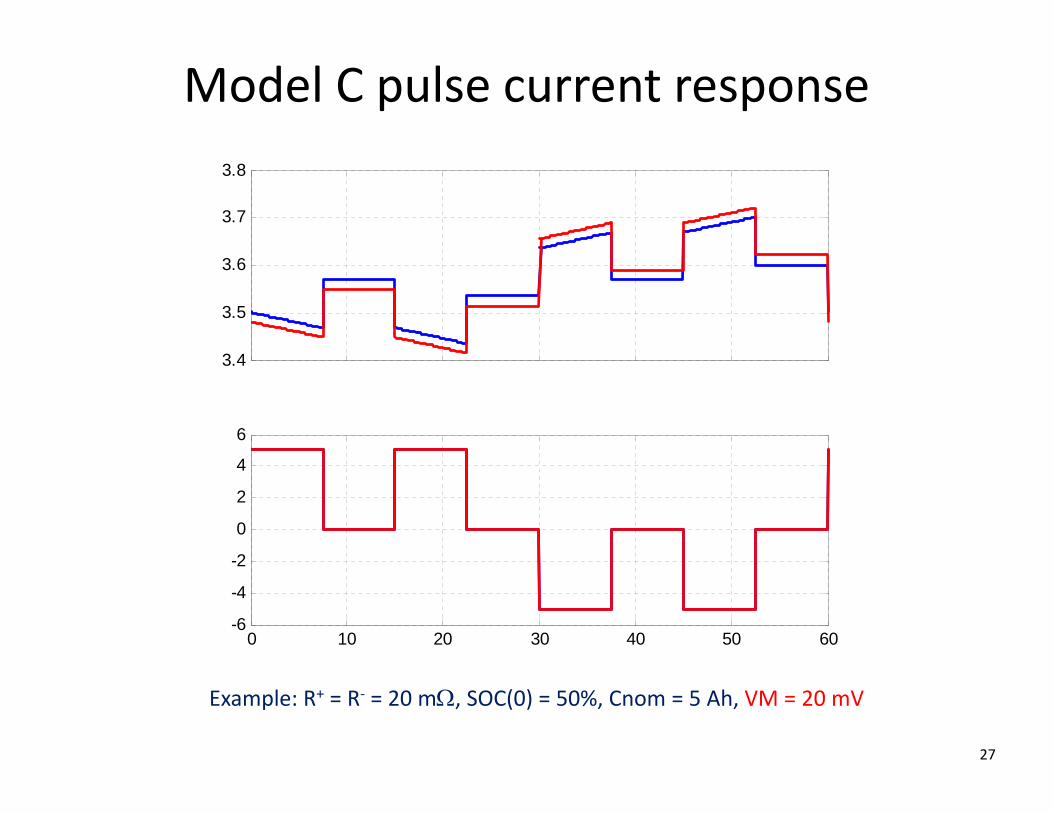
Model C pulse current response
27
3.4
3.5
3.6
3.7
3.8
0 10 20 30 40 50 60-6
-4
-2
0
2
4
6
Example: R+ = R‐ = 20 m, SOC(0) = 50%, Cnom = 5 Ah, VM = 20 mV
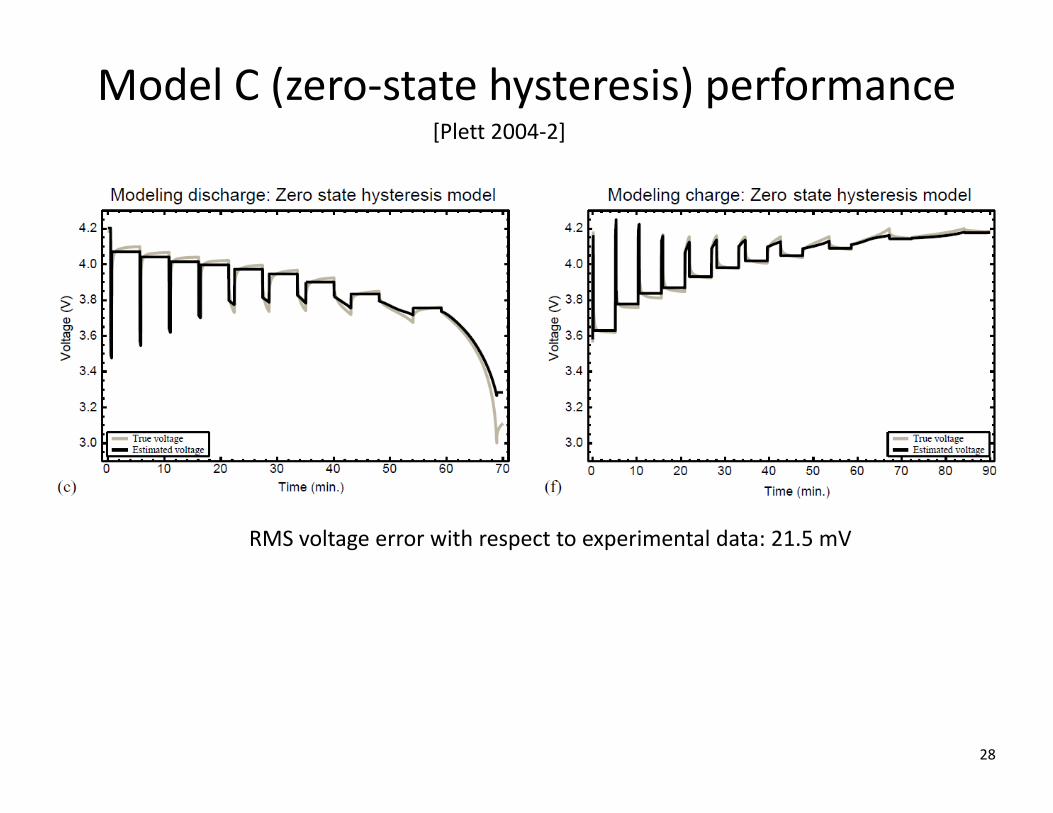
Model C (zero‐state hysteresis) performance
28
[Plett 2004‐2]
RMS voltage error with respect to experimental data: 21.5 mV
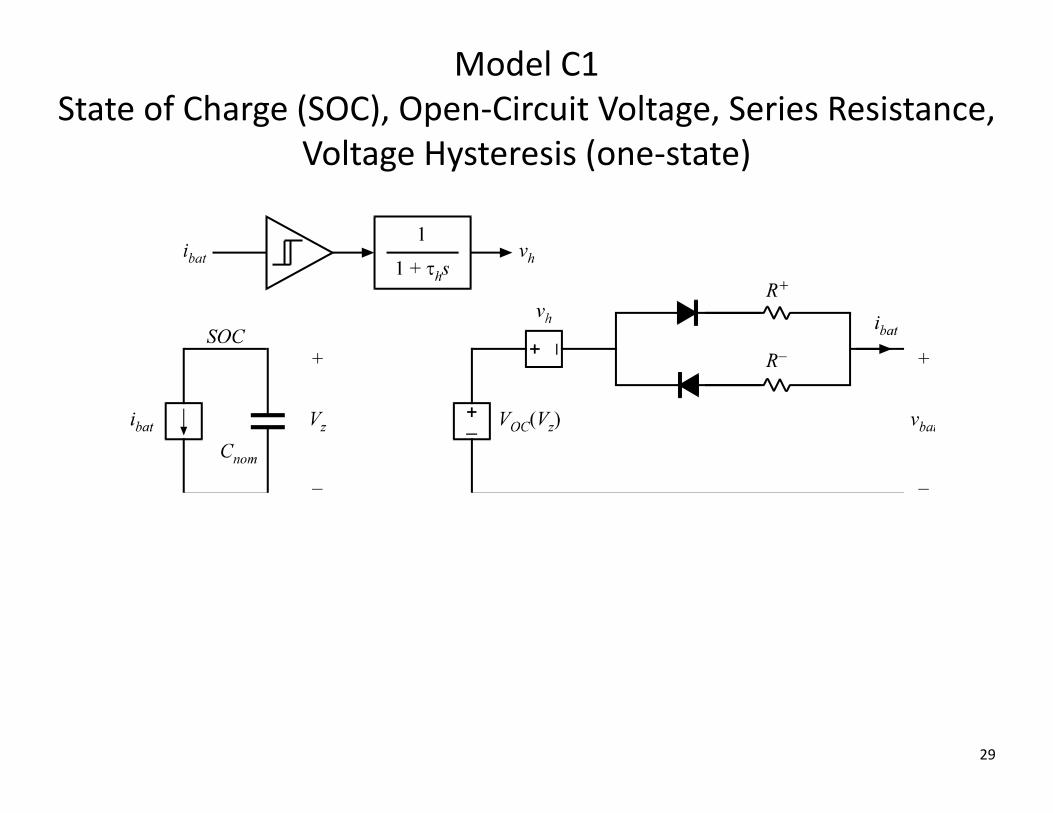
Model C1State of Charge (SOC), Open‐Circuit Voltage, Series Resistance,
Voltage Hysteresis (one‐state)
29
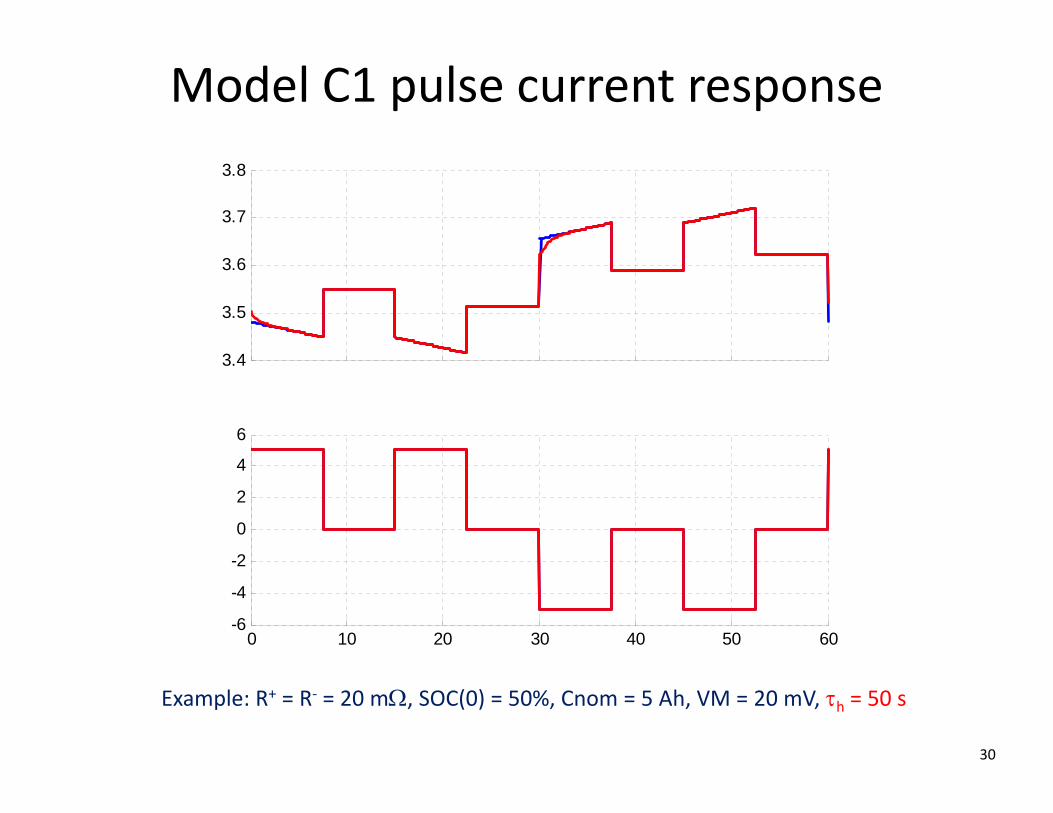
Model C1 pulse current response
30
3.4
3.5
3.6
3.7
3.8
0 10 20 30 40 50 60-6
-4
-2
0
2
4
6
Example: R+ = R‐ = 20 m, SOC(0) = 50%, Cnom = 5 Ah, VM = 20 mV, h = 50 s

Model C2
31
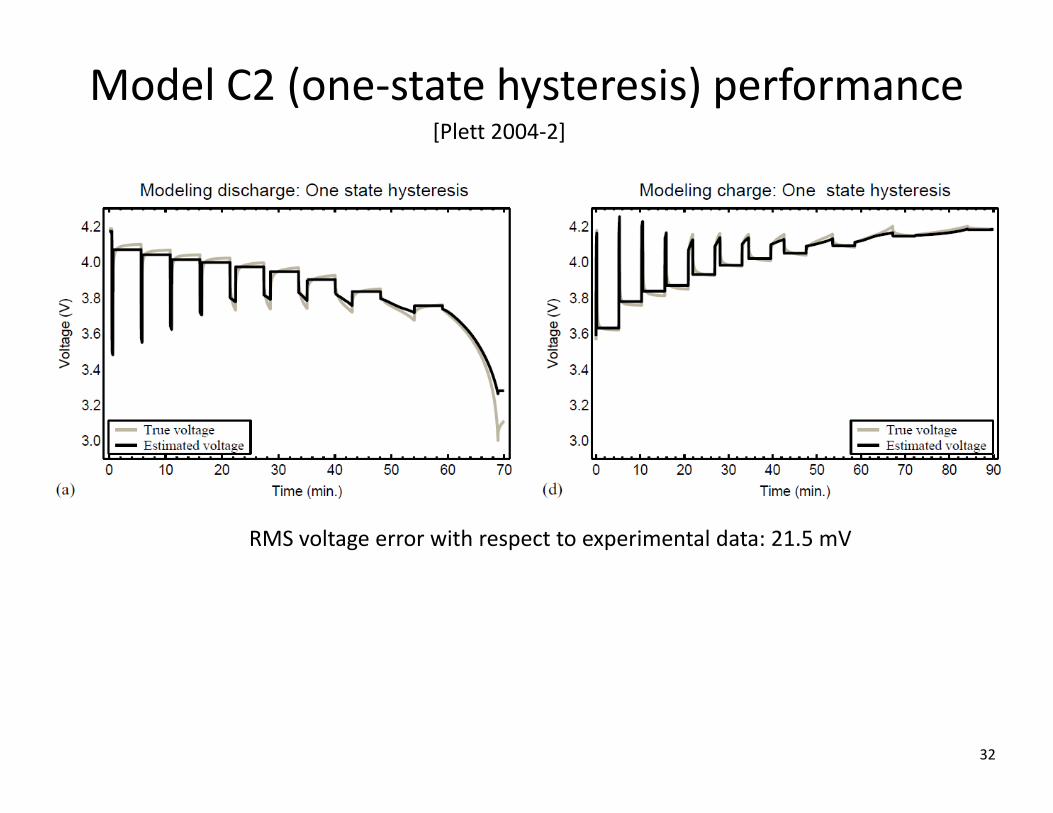
Model C2 (one‐state hysteresis) performance
32
[Plett 2004‐2]
RMS voltage error with respect to experimental data: 21.5 mV

Model DState of Charge (SOC), Open‐Circuit Voltage, Series Resistance,
Voltage Hysteresis (one‐state), Diffusion (one‐state)
33

Model D pulse current response
34
3.4
3.5
3.6
3.7
3.8
0 10 20 30 40 50 60-6
-4
-2
0
2
4
6
Example: Ro+ = Ro‐ = 10 m, SOC(0) = 50%, Cnom = 5 Ah, VM = 20 mV, tH = 50 s, R1 = 10 m, 1 = 100 s
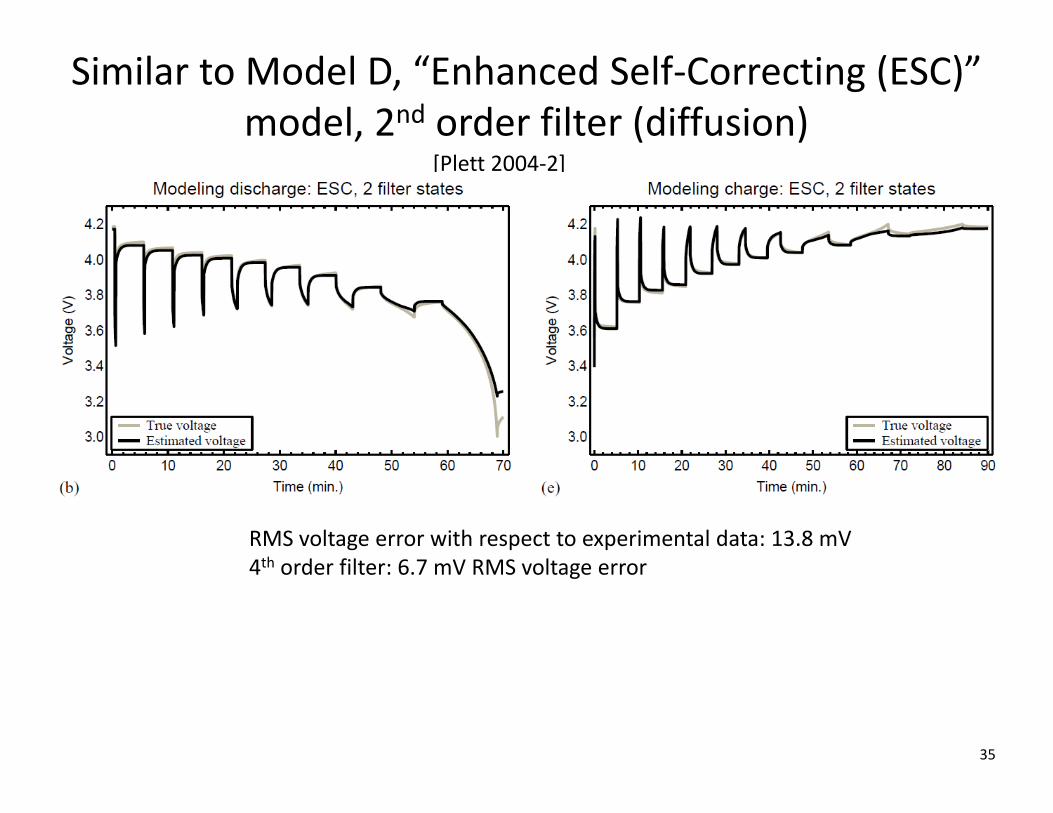
Similar to Model D, “Enhanced Self‐Correcting (ESC)” model, 2nd order filter (diffusion)
35
[Plett 2004‐2]
RMS voltage error with respect to experimental data: 13.8 mV4th order filter: 6.7 mV RMS voltage error