energy storage and reactive power compensator in a large wind
TRANSCRIPT
Energy Storage and Reactive Power Compensator in a Large Wind Farm
Preprint
October 2003 • NREL/CP-500-34701
E. Muljadi and C.P. Butterfield National Renewable Energy Laboratory R. Yinger Southern California Edison H. Romanowitz Oak Creek Energy Systems, Inc. To be presented at the 42nd AIAA Aerospace Sciences Meeting and Exhibit Reno, Nevada January 5–8, 2004
National Renewable Energy Laboratory 1617 Cole Boulevard Golden, Colorado 80401-3393 NREL is a U.S. Department of Energy Laboratory Operated by Midwest Research Institute • Battelle • Bechtel
Contract No. DE-AC36-99-GO10337

NOTICE
The submitted manuscript has been offered by an employee of the Midwest Research Institute (MRI), a contractor of the US Government under Contract No. DE-AC36-99GO10337. Accordingly, the US Government and MRI retain a nonexclusive royalty-free license to publish or reproduce the published form of this contribution, or allow others to do so, for US Government purposes.
This report was prepared as an account of work sponsored by an agency of the United States government. Neither the United States government nor any agency thereof, nor any of their employees, makes any warranty, express or implied, or assumes any legal liability or responsibility for the accuracy, completeness, or usefulness of any information, apparatus, product, or process disclosed, or represents that its use would not infringe privately owned rights. Reference herein to any specific commercial product, process, or service by trade name, trademark, manufacturer, or otherwise does not necessarily constitute or imply its endorsement, recommendation, or favoring by the United States government or any agency thereof. The views and opinions of authors expressed herein do not necessarily state or reflect those of the United States government or any agency thereof.
Available electronically at http://www.osti.gov/bridge
Available for a processing fee to U.S. Department of Energy and its contractors, in paper, from:
U.S. Department of Energy Office of Scientific and Technical Information P.O. Box 62 Oak Ridge, TN 37831-0062 phone: 865.576.8401 fax: 865.576.5728 email: [email protected]
Available for sale to the public, in paper, from:
U.S. Department of Commerce National Technical Information Service 5285 Port Royal Road Springfield, VA 22161 phone: 800.553.6847 fax: 703.605.6900 email: [email protected] online ordering: http://www.ntis.gov/ordering.htm
Printed on paper containing at least 50% wastepaper, including 20% postconsumer waste

1
Abstract—The size of wind farm power systems is increasing,
and so is the number of wind farms contributing to the power systems network. The size of wind turbines is also increasing— from less than 1 MW a few years ago to the 2- to 3-MW machines being installed today and the 5-MW machines under development.
The interaction of the wind farm, energy storage, reactive power compensation, and the power system network is being investigated. Because the loads and the wind farms' output fluctuate during the day, the use of energy storage and reactive power compensation is ideal for the power system network. Energy storage and reactive power compensation can minimize real/reactive power imbalances that can affect the surrounding power system.
In this paper, we will show how the contribution of wind farms affects the power distribution network and how the power distribution network, energy storage, and reactive power compensation interact when the wind changes. We will also investigate the size of the components in relation to each other and to the power system.
Index Terms--energy storage, reactive power compensator, static VAR compensator, wind turbine, induction generator, synchronous generator, wind farm, power system, renewable energy
I. INTRODUCTION HE Tehachapi, California area is home to one of the best wind resource areas in the country, and the culture of
wind generation is rooted deeply in the hearts of the locals. As wind power generation in the area continues to expand, reactive power compensation and energy storage will be required.
A reactive power compensator is a very important aspect of wind generation in the Tehachapi wind farms. Most of the wind turbines currently operating in the area are induction generator wind turbines (constant frequency). An induction generator requires reactive power to be supplied from the grid. It is therefore necessary to provide reactive power locally, as close as possible to the demand levels. In the early days of wind farm development, the wind farm operators were required to compensate each wind turbine with the reactive power needed when the wind turbine was operating at no-load. However, an induction generator requires an increasing amount of reactive power as the amount of power generated increases. Without proper compensation, the voltage at the point of injection (where the majority of the wind farm output
is injected) will vary as the wind speed varies during the day. In this paper, the concept of compensating reactive power will be explored. Both the fixed and adjustable compensation will be used to maintain the voltage as close as possible to the acceptable limit. More detailed information on reactive power compensation can be found in references [1-2].
In the past, energy from the wind was transmitted directly to the grid at the time it was generated. The electricity generated is sold at a fixed price based on the contract between the operator and the utility. The deregulation in the utility industry enables the utility to buy the best price from the lowest bid. The cost of energy depends on the availability of the electric energy in the pool. Southern California Edison (SCE) is required to purchase energy from the wind park developers because they are Qualifying Facilities (QF's) under the Public Utility Regulatory Policies Act (PURPA) rules. Rates are established based on the "avoided cost" of generation from other sources. With the incentive of selling the electricity at the highest price, wind farm operators seek new ways to deploy power generated by wind turbines at the right time. However, the variability of the wind speeds during the day and seasons affects the cost-effectiveness of wind energy. To allow electric generation on demand, we need sufficient electric energy storage to enable the wind farm to generate on demand. Large-scale energy storage for power system applications has been investigated for many years for peak shaving, load-frequency control, and many other uses [3-4].
The next sections will explore reactive power compensation and the energy storage concept. Section II will present the layout of the Tehachapi wind farms. In Section III, the representation of a wind farm will be discussed. In Section IV, the role of reactive power will be investigated, and in Section V, the role of energy storage will be explored. Section VI will summarize the paper.
A package program called Power System Simulation for Engineers (PSS/E) will be used throughout this study.
II. LAYOUT OF THE TEHACHAPI WIND FARMS There are four major groups of wind farms in the
Tehachapi area. The wind power plants are modeled as regular generators with real and reactive power varying with wind speeds. The wind power plants represent 1- to 70-MW wind farms. Each wind farm consists of many wind turbines, and the output of each wind farm is characterized by the P-Q relationship measured at the point of common coupling (i.e., the interconnection point of the wind farm). To make it easier
E. Muljadi1 C.P. Butterfield1 R. Yinger2 H. Romanowitz3 . 1National Renewable Energy Laboratory 2) Southern California Edison 3) Oak Creek Energy Systems Inc. 1617 Cole Blvd. P.O. Box 800 14633 Willow Springs Rd. Golden, CO 80401 Rosemead, CA 91770 Mojave, CA 93501
Energy Storage and Reactive Power Compensator in a Large Wind Farm
T
This material is declared a work of the U.S. Government and is not
subject to copyright protection in the United States.

2
for SCE, wind farms were placed into different groups. Note that the choice of group names may confuse some readers because the words WINDPARKS and WINDFARMS are used as group names. To many people, WINDPARK or WINDFARM is used to describe a cluster of wind turbines connected to the same collection point. In this paper, WINDFARMS and WINDPARKS are used as names of groups of smaller wind farms.
There are four major groups of wind farms (WINDFARMS, WINDLANDS, WINDPARKS, and BREEZE). Of these groups, WINDFARMS generates the most power: 192 MW at maximum (based on name plate). The group WINDFARMS consists of six subgroups: Dutchwind, Flowind, Canwind, Enwind, Varwind, and Arbwind. Each subgroup consists of several wind farms, except for Varwind, where two switched capacitors are located. For example, the Flowind subgroup consists of two wind farms, CR1 and RT1. The CR1 wind farm consists of seven 108-kW Micon turbines and seventeen 700-kW Micon turbines. Note that due to space constraints, only the major groups of wind farms are drawn.
The power systems layout is represented in the single line diagram shown in Figure 1. The distribution network shown includes only the main paths—minor connections are not shown in the diagram. The majority of power flows out of the wind farms is channeled through CalCement and Monolith. The two substations will be used as the cornerstones to establish the compensation and energy storage used in this project.
III. HOW EACH WIND FARM IS REPRESENTED About 24 wind farms and three conventional generators are
modeled. The wind farms are connected to the rest of the
transmission network. Bus 1, which is Antelope Substation, is used as the gateway to the much larger network outside the area and is treated as an infinite bus. Each wind farm represents the following characteristics:
1. The characteristic of the wind speed (turbulence level, average speed, air density, etc.)
2. Diversity of the wind speeds with respect to the locations of each wind farm in the Tehachapi area. A more detailed discussion on simulation for wind farm aggregation can be found in reference [5]
3. The characteristic of the wind turbine (Cp-TSR characteristics) and induction generator characteristics
4. The P-Q (real-reactive power) electrical characteristic of the individual wind farms.
Each wind farm is fed by separate wind speed files
representing the wind speed in time series. The wind speeds are previously processed to represent the relative location of the wind farms with respect to one another. If separate measurements are used at each wind farm, these files can be fed to the corresponding wind farms. In this paper, different wind files are generated using the time-shift method, in which wind speed at the first wind farm will be delayed to arrive at the next wind farm. A diagram illustrating the diversity of a large wind farm is shown in Figure 2. The time delay applied to the wind speed input for each wind farm is computed from the relative distance and the mean wind speed. A typical wind speed in time domain is shown in Figure 3.
The characteristic of the wind turbine (Cp-TSR) is used to represent the aerodynamic characteristics of the wind turbine. The induction generator torque speed characteristic is used to represent the mechanical dynamics along with the inertia of
Figure 1. Single line diagram of major distribution network.
BREEZEWINDLANDS
Monolith (bus 24)
CalCement (bus 22)
Goldtown
Rosamond
Antelope
Bus 40 Varwind
Storage
C SVC
WINDPARKS
WINDFARMS

3
the rotor and the blades. This characteristic is unique for each wind turbine. Adjustments should be made to reflect the site air density or modification of the wind turbine’s dimension. A typical Cp-TSR characteristic of a wind turbine is given in Figure 4.
The P-Q characteristic of the wind farm represents the collective electrical behavior of wind turbines, the real and reactive power, and its control strategies. It is derived from experimental data collected over time to represent the wind turbines output plus the reactive power compensation installed at the wind farm. The P-Q characteristic is modeled from the measured data using polynomial equations. It represents the required reactive power Q for a given real power output P of the wind farm. The collective output real power in one wind farm is used to find the corresponding reactive power requirement in that particular wind farm. It is obvious that the P-Q characteristic changes every time new turbines are added or new reactive power compensations are added to the wind farm. A typical P-Q characteristic of a wind farm is given in Figure 5.
IV. REACTIVE POWER COMPENSATION The CalCement substation has 18 MVAR capacitor
compensation installed. Some other buses in the area are compensated to a total of 77.3 MVAR. The total load in the area (including surrounding small towns) is about 259 MW and 46.4 MVAR. The generations at Kern River and Bailey
are 24 MW and 20 MW, respectively. The simulation was fed by non-uniform wind speeds to simulate the entire area. A total simulation time of 6000 seconds (100 minutes) is used to cover the spectrum of possible wind fluctuations. For a wind farm power system, IEC Standard 61 400-21 stated that the 10-minute average of voltage fluctuation should be within + 5% of its nominal value [6].
A typical reactive power compensator may be implemented by using a fixed capacitor, a switched capacitor, or static compensator. The simplest form of reactive power compensation is the static VAR compensator (SVC). It is assumed that the SVC used is a capacitor in parallel with an adjustable inductor (shown in Figure 6). To adjust the output of the inductor, the inverse-parallel thyristor is used to control the voltage applied across the inductor. By choosing the correct size of inductor and capacitor, the SVC can be
Figure 6. Reactive power compensator. a) Symbol of SVC and its implementation.b) SVC in parallel with fixed capacitor.
L C
C
(a) (b)
SVC =
0.6
0.4
0.2
0.0
Powe
r coe
ffici
ent (
Cp)
0 5 10Tip-speed
ratio
15
25 20 15 10 5 0 1200 2400 3600 4800 6000
Figure 2. Wind diversity in a large wind farm.
Figure 5. PQ characteristic of a wind farm.
0.00
2.00
4.00
6.00
0 5 10 15
MW
MVAR
w1
w2
w3
w4
wind speed
Figure 3. A time series wind speed.
Figure 4. Cp-TSR characteristic of a turbine.
4
operated to generate reactive power, which varies from -Qlolim to +Qhilim. For example, with a 100-MVAR capacitor and a 200-MVAR inductor, a range of +100 MVAR can be achieved and adjusted continuously. If negative reactive power is not required, a combination of a 100-MVAR capacitor and a 100-MVAR inductor provides a range of 0 MVAR to +100 MVAR. In this paper, the symbol for an SVC is a capacitor with an arrow indicating that the compensation size is variable. The symbol for a fixed capacitor is a capacitor without an arrow sign. Figure 6 shows the typical symbols of reactive power compensators used in this study.
The power network within the Tehachapi wind farms is relatively stiff between the substations in the Tehachapi area, but this area is relatively weak connected to the rest of the transmission/sub-transmission system. It was decided to install a reactive power compensator at either the Varwind (Bus 40) or the Monolith substation (Bus 24). The voltage magnitude is very close between the CalCement and Monolith at high generation, indicating no major voltage drop between the two busses.
A. No SVC and No Fixed Capacitor at Varwind In this simulation, no reactive power compensation (fixed
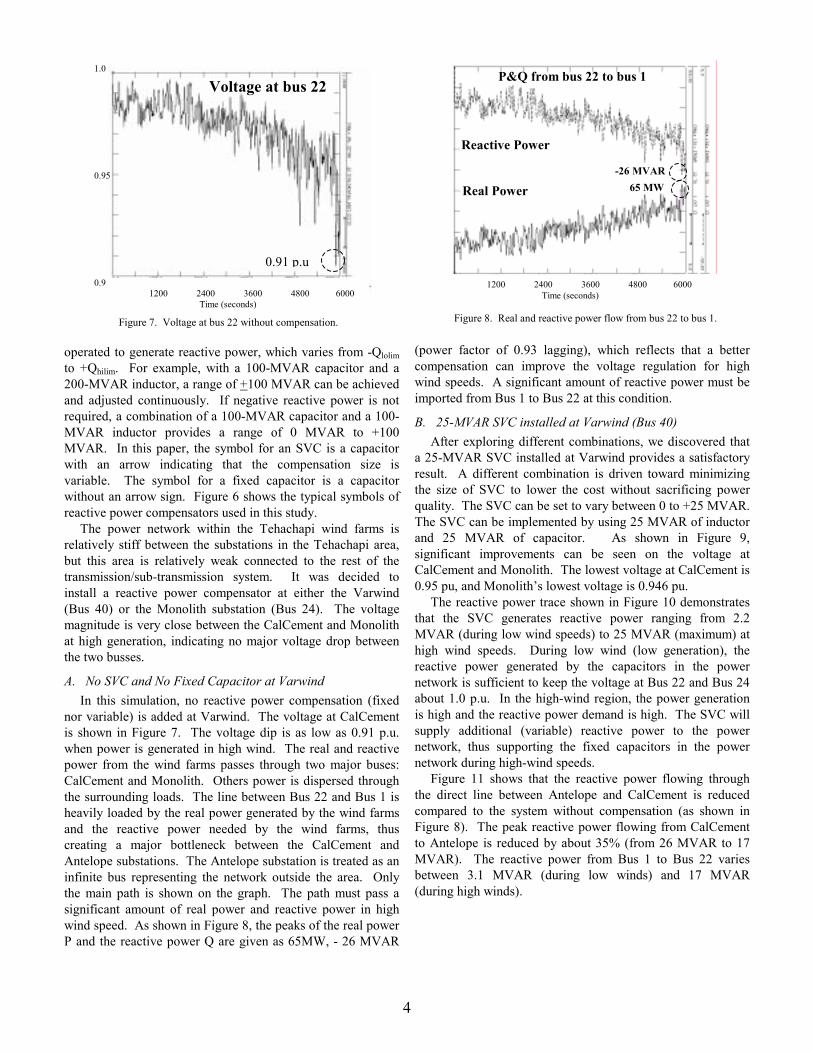
nor variable) is added at Varwind. The voltage at CalCement is shown in Figure 7. The voltage dip is as low as 0.91 p.u. when power is generated in high wind. The real and reactive power from the wind farms passes through two major buses: CalCement and Monolith. Others power is dispersed through the surrounding loads. The line between Bus 22 and Bus 1 is heavily loaded by the real power generated by the wind farms and the reactive power needed by the wind farms, thus creating a major bottleneck between the CalCement and Antelope substations. The Antelope substation is treated as an infinite bus representing the network outside the area. Only the main path is shown on the graph. The path must pass a significant amount of real power and reactive power in high wind speed. As shown in Figure 8, the peaks of the real power P and the reactive power Q are given as 65MW, - 26 MVAR
(power factor of 0.93 lagging), which reflects that a better compensation can improve the voltage regulation for high wind speeds. A significant amount of reactive power must be imported from Bus 1 to Bus 22 at this condition.
B. 25-MVAR SVC installed at Varwind (Bus 40) After exploring different combinations, we discovered that
a 25-MVAR SVC installed at Varwind provides a satisfactory result. A different combination is driven toward minimizing the size of SVC to lower the cost without sacrificing power quality. The SVC can be set to vary between 0 to +25 MVAR. The SVC can be implemented by using 25 MVAR of inductor and 25 MVAR of capacitor. As shown in Figure 9, significant improvements can be seen on the voltage at CalCement and Monolith. The lowest voltage at CalCement is 0.95 pu, and Monolith’s lowest voltage is 0.946 pu.
The reactive power trace shown in Figure 10 demonstrates that the SVC generates reactive power ranging from 2.2 MVAR (during low wind speeds) to 25 MVAR (maximum) at high wind speeds. During low wind (low generation), the reactive power generated by the capacitors in the power network is sufficient to keep the voltage at Bus 22 and Bus 24 about 1.0 p.u. In the high-wind region, the power generation is high and the reactive power demand is high. The SVC will supply additional (variable) reactive power to the power network, thus supporting the fixed capacitors in the power network during high-wind speeds.
Figure 11 shows that the reactive power flowing through the direct line between Antelope and CalCement is reduced compared to the system without compensation (as shown in Figure 8). The peak reactive power flowing from CalCement to Antelope is reduced by about 35% (from 26 MVAR to 17 MVAR). The reactive power from Bus 1 to Bus 22 varies between 3.1 MVAR (during low winds) and 17 MVAR (during high winds).
P&Q from bus 22 to bus 1
Reactive Power
Real Power -26 MVAR
65 MW
1200 2400 3600 4800 6000 Time (seconds)
Figure 8. Real and reactive power flow from bus 22 to bus 1. Figure 7. Voltage at bus 22 without compensation.
0.91 p.u
Voltage at bus 22 1.0 0.95 0.9 1200 2400 3600 4800 6000 Time (seconds)

5
C. Uniform Wind Speeds This section shows the impact of aggregation of wind
turbines in a large wind farm on the bus voltages in the power system. Using the same conditions given to simulate last case (25 MVAR SVC), we changed the wind speed feeding the simulation from a non-uniform wind speed (to simulate a more
realistic and diverse condition over a large area of wind farms in Tehachapi) to a uniform wind speed (to simulate the worst condition by assuming the wind speed in the entire area is identical). The output voltage and the total output of the wind farms (real power and reactive power) are observed. As shown in Figure 12, the voltage at the CalCement and Monolith substations shows degradation in the nature of the fluctuations and the lowest voltage dips. Figure 13 shows the real and reactive power flowing from Bus 22 to Bus 1. By comparing Figures 9 and 11 with Figures 12 and 13, it is easy to see that the non-uniform wind inputs (which is a closer reflection of a real wind farm) yield a much smoother output voltage and output power fluctuations. Thus it is important to represent a large wind farm by properly feeding the wind turbines with different wind speeds to represent the different wind speeds at different locations of a large area [Reference 5].
V. ENERGY STORAGE In the next few sections, different energy storage topics will
be discussed. While energy storage is very important in ensuring the reliability of power delivery, the types of energy
-25 MVAR 76 MW
Reactive Power
Real Power
UNIFORM WIND SPEED
0 6000 Time (seconds)
Figure 13. Real and reactive power flow from bus 22 to bus 1for uniform wind speed.
25 MVAR
Reactive Power Output of the SVC
0 6000 Time (seconds)
Figure 10. Reactive power output of the SVC at bus 22.
2.2 MVAR
0.946 p.u.
0.95 p.u.
1.0 p.u.
Voltage at CalCement
Voltage at Monolith
1.0 p.u.
0 6000 Time (seconds)
Figure 9. Voltage at bus22 and at bus 24.
63 MW
-17 MVAR
-3.1 MVAR P&Q from bus 22 to bus 1
Reactive Power
Real Power 10 MW
0 6000 Time (seconds)
Figure 11. Real and reactive power flow from bus 22 to bus 1.
0.897 p.u.
0.90 p.u.
Voltage at CalCement
Voltage at Monolith
UNIFORM WIND SPEED
0 6000 Time (seconds)
Figure 12. Voltage at bus 22 and bus 24 for uniform wind speed.

6
storage that can be used and the economics and sizing of energy storage are beyond the discussion of this paper. Many types of energy storage have been researched and studied (battery, fuel cell, pump-hydro, etc.) in the power network environment, and the present technologies make it possible to build cheap and reliable energy storage.
Power semiconductors, commonly called power switches, are used to build the power converter. These power switches are used to control the output power of the power converter (the details of power converter design will not be discussed in this paper). Most of the modern power converters for this application type are built using a three-phase AC-DC battery (or fuel cell). The power converter will act as an inverter to transmit power from DC to AC, and it acts as a rectifier to transmit power from AC to DC. It is generally controlled in current mode using current-regulated pulse-width modulation (CRPWM). In this mode, the current in each phase is controlled literally microseconds by microseconds, and the current is shaped by controlling the switches to generate a sinusoidal output current at the right frequency (60 Hz) to be compatible with the utility at the right phase angle (to regulate the proportion of real power and reactive power) and at the right magnitude (to control the size of output power). The power converter can be controlled to operate at all four quadrants delivering/absorbing the real/reactive power. The power converter is limited to operate up to its rated current.
There are two trains of thoughts regarding these control algorithm concepts proposed here:
-One philosophy advocates controlling the power converter such that only real power is controlled. We call this unity power factor control.
-Another philosophy advocates controlling the power converter such that the output current is maximized and the real power is controlled based on demand. The rest of the available current should be used for reactive power compensation, as will be seen later. We call this rated current control.
A. Unity Power Factor Control Under unity power factor control, the power converter is at
unity power factor all the time (-Srated < P <+Srated; Q = 0). This philosophy has the advantage of minimizing the output current of the power converter. In turn, it will minimize the switching losses in the power switches (assuming other losses are not considered).
With this choice of control, the power converter stores or restores real power into or out of the energy storage. Figure 14 illustrates the concept of energy storage applied to the wind farms. At the beginning, the wind farms in the area generate low output power (PTOTWF is low). Below the upper limit, PWFUPLIM, the power converter is not operated. As the wind speed increases, the output power also increases. When the output of the wind power generated in the area is above a certain level (PWFUPLIM), the power converter starts charging the energy storage. The difference between PTOTWF and. PWFUPLIM is the power stored into the energy storage (PSTORE). As the wind speed continues to increase, the power entering
the energy storage will be increased until the rating of the power converter is reached (PSTORAGE_LIMIT). Once the power converter reaches its rated power, the charging power is a constant. The real power entering the energy storage is kept at this limit. The logic statements shown can be used to explain the simple control strategy in operating the energy storage.
The trace of total power of the wind farms under consideration, the power entering energy storage, and the remaining power flowing through the transmission line are also shown in Figure 14. It is shown that the peak total power flowing out of the wind farms is lower than the one without energy storage.
Restoring energy from energy storage will not be discussed in this paper because the control strategy to deploy the energy from the energy storage is driven more by economics than by technical consideration. In short, the power converter can be operated at any power level to return energy into the grid, but it should not operate above its MVA rating.
The advantage of this method is that the energy storage reduces the output power originally planned to go through the transmission line by passing the overproduction into energy
Total Wind Farm Output Power
No Storage
PWFUPLIM
Power into Storage
TIME
TIME
∆P reduction
Total Output Power through the Line
With Storage
TIME Figure 14. Power flow through the power network and energy storage.
a) Total output real power from all the wind farms b) Real power entering the energy storage c) Real power flowing through the transmission line.
∆P Energy StorageRating PSTORAGE _LIMIT
PSTORE = 0.0 IF (PTOTWFS > PWFUPLIM) THEN PSTORE = (PWFUPLIM - PTOTWFS) IF(PSTORE > PSTORAGE_LIMIT) PSTORE = PSTORAGE_LIMIT END IF

7
storage. As shown before, the energy storage helps bypass some of the output energy, and it helps alleviate the crowding of the transmission line. The real power from the wind farms is redirected to energy storage at unity power factor. Thus there is no reactive power interchange with the energy storage. The reactive power must be passed through the line. Although the total current still carries the reactive power component through the line, it is smaller compared to the one without energy storage (ITOT_NEW < ITOT_OLD).
The operation of the energy storage presented here has the limitation of not being able to bypass the reactive power demand from the wind farms because the energy storage is operated at unity power factor. Thus the reactive power demand from the wind farms must be transmitted through the transmission line unless some supply is provided locally. Another thing to consider is the size of energy storage. We have to keep in mind that the energy storage is placed here as an energy peak shaving (storing the energy during peak wind generation and restoring the energy during periods of no generation), not to control the voltage.
In this study, energy storage is placed at the Monolith substation (Bus 24). Figure 15 shows the terminal voltage at Bus 24 (Monolith substation) when a 50-MW storage is placed there. It is shown that the voltage goes down to 0.89 p.u. in a high-wind-speed region. Notice that the terminal voltage is
about 0.98 p.u. during periods of low wind. The same terminal voltage is shown in Figure 16 after 50-MW energy storage is placed at the Monolith substation. Note that for both cases shown in Figure 15 and Figure 16, no reactive power is added to the power system. There is no significant impact on voltage improvement shown from the above two graphs.
The total real and reactive power generated by the wind farms is shown in Figure 18. The total generated power for all wind farms under observation is about 254 MW, and the total reactive power demanded by all the wind farms is 104 MVAR. Some of the reactive power need is supported by surrounding reactive power compensation. It is provided by capacitors in surrounding buses. However, as shown by the voltage trace in Figure 16, the energy storage does not improve the voltage profile, and the reactive power compensation presently installed is not big enough to improve the voltage. At the lowest voltage, the voltage drops below 0.9 p.u.
The output power entering the energy storage is shown in Figure 17. It is shown that when the wind speed is low, the total power generated in the area wind farms is less than 100 MW; thus energy is not stored. When the total power is more than 100 MW, the power generated by the wind farms enters energy storage. In the higher wind speeds, the energy storage must work most of the time, reaching its limit at 50 MW. The
254 MW
Total Output of the Wind Farms (Real Power)
- 104 MVAR
Total Output of the Wind Farms (Reactive Power)
- 50 MW
Real Power Energy Storage
0 MAR
0.89 p.u.
Voltage at Mono (Bus 24) 50 MW Storage
0.98 p.u.
0 6000 Time (seconds)
Figure 16. Voltage at bus 24 (Monolith) with 50-MW storage.
0 6000 Time (seconds)
Figure 17. Power entering energy storage and total power.
0.89 p.u.
Voltage at Mono (Bus 24) ,No-Storage
0.98 p.u.
0 6000 Time (seconds)
Figure 15. Voltage at bus 24 (Monolith) with no-storage.
0 6000 Time (seconds)
Figure 18. Real and reactive power output of the wind farms.

8
total output power (real and reactive power) of the overall wind farms is shown in Figure 18.
Figure 19 shows the voltage trace of a system with energy storage at Bus 24 (Monolith substation) sized at 50-MW power capability and a 25-MVAR SVC placed at the Varwind (Bus 40). It shows that the voltage at Bus 24 reaches the lowest point during high wind, down to 0.936 p.u. The highest voltage at low wind speed is about 0.99 p.u. To improve with the voltage regulation, additional compensation is placed to support the SVC at Bus 40. Figure 20 represents the voltage profile at Bus 24 if an additional fixed capacitor of 25 MVAR is installed at Bus 40 in addition to the SVC. The terminal voltage at the Monolith substation varies between 0.976-1.02 p.u. This control algorithm uses an SVC and a fixed capacitor at Bus 40, each 25 MVAR. In addition, a 50-MW energy storage unit is placed at the Monolith substation (Bus 24). The result shows a very close control of the terminal voltage. A significant improvement in voltage regulation is shown in Figure 20 (+2% of per unit voltage) compared to Figure 19 (down to 6% under voltage).
B. Rated Current Control In this mode, the operation of the power converter is at its
current rated and at variable power factor all the time. The following operating boundaries must be followed:
- Srated < P <+Srated - Srated < Q <+Srated Q = (Srated
2 – P2) 1/2 This algorithm allows us to use the power converter to
control the reactive power in the wind farms to stabilize the systems. Although the function may not be as perfect as the SVC, we can use this power converter with the fixed capacitor to produce low reactive power during low wind speeds and to produce high reactive power during high wind speeds. The operation with unity power factor does not utilize the power converter capability at its maximum rating. Thus the power converter was left to operate under rated when the charging or discharging is at below rated.
The operation explained in this section is based on the knowledge of the characteristic of the real-reactive power characteristic of a conventional wind farm (fixed speed wind turbines equipped with an induction generator connected to the utility), which is always lagging, and reactive power demand increases as the real power increases non-linearly. In wind farms using induction generators, the reactive power demand is small when the real power generated from the wind farm is small. With this reference in mind, we can use a large fixed capacitor at one location to compensate for the reactive power needed by the wind farms during high wind. During low wind, the reactive power needed is small; thus the fixed capacitor is oversized during low wind (over-excitation) at the same time the real power output is also low, thus requiring only a small portion of the current capability of the power converter. To compensate for this over-excitation, we can use the remaining current capability of the power converter to operate the power converter in lagging power factor (inductive compensation), thus subtracting reactive power from the capacitor output. In the higher winds, the wind farm demands a larger reactive power and generates more real power, and there is more energy to be stored. The negative reactive power (inductive) output of the power converter decreases. At high wind, when the energy storage is charged with rated power, the power converter must be utilized to convert the real power at its maximum current capability, and there is no more room to produce reactive power. At rated winds, the output of the power converter is at unity power factor at full rated, leaving only the reactive power output of the fixed capacitor to compensate for the reactive power demand. A switched capacitor can be used to replace the fixed capacitor to allow step changes in the capacitor size if a finer voltage adjustment is desired. In Figure 21, the energy storage is symbolized as a variable inductor and variable battery. The phasor diagram llustrates the behavior of the system during low and high winds.
The following is a summary of the advantages of rated current operation of energy storage:
• The same power converter can be used to provide controllable reactive output power that will mitigate the reactive power demand by the induction
Energy Storage (50 MW) at Mono (Bus 24) with SVC 25 MVAR & 25MVAR Cap (at Bus 40)
0.976 p.u. Terminal Voltage at Mono (Bus 24)
1.02 p.u.
0.936 p.u. Voltage at Mono (Bus 24) Energy Storage (50 MW) SVC 25 MVAR (Bus 40)
0.99 p.u.
0 6000 Time (seconds)
Figure 19. Voltage at bus 24 with 25-MVAR SVC at bus 40.
0 6000 Time (seconds)
Figure 20. Voltage at bus 24 with 25-MVAR SVC and 25 MVAR cap.
9
generator. • The real power stored can be sold at a higher price at
a different time. • The reactive power (QCAP + ∆Q) controllable can be
sold separately. • Although lower resolution of voltage control can be
expected, it is a much cheaper solution than a separate SVC for voltage control.
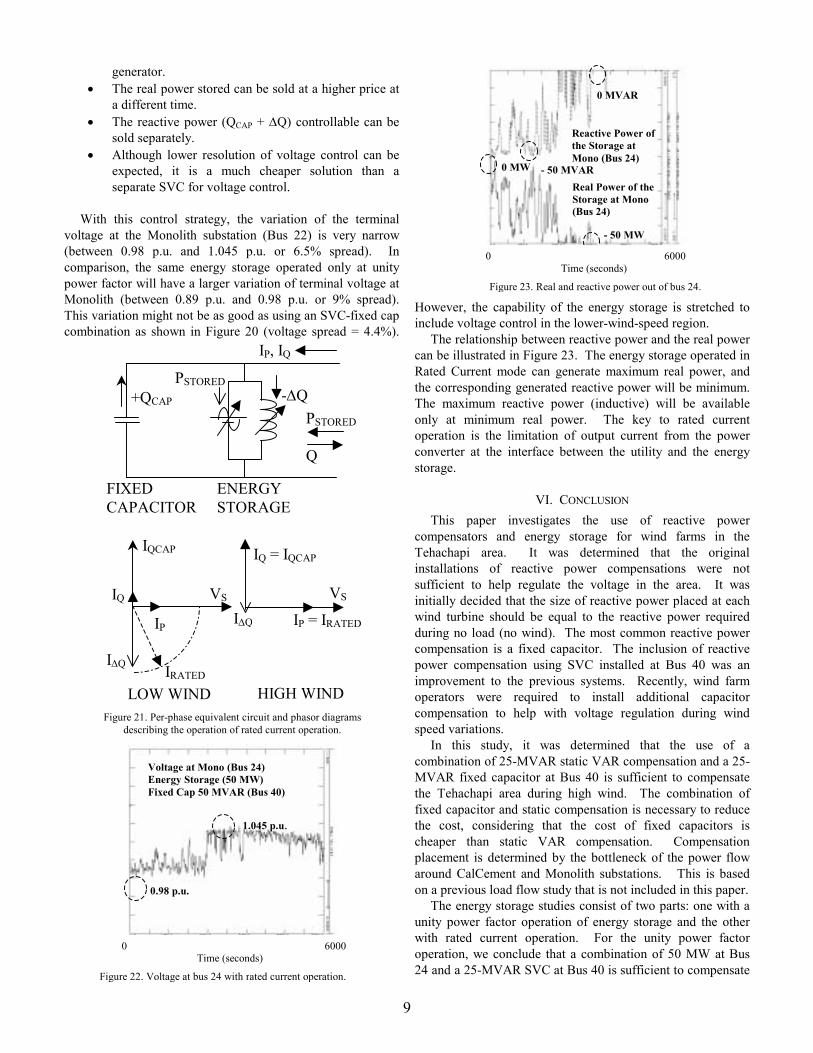
With this control strategy, the variation of the terminal
voltage at the Monolith substation (Bus 22) is very narrow (between 0.98 p.u. and 1.045 p.u. or 6.5% spread). In comparison, the same energy storage operated only at unity power factor will have a larger variation of terminal voltage at Monolith (between 0.89 p.u. and 0.98 p.u. or 9% spread). This variation might not be as good as using an SVC-fixed cap combination as shown in Figure 20 (voltage spread = 4.4%).
However, the capability of the energy storage is stretched to include voltage control in the lower-wind-speed region.
The relationship between reactive power and the real power can be illustrated in Figure 23. The energy storage operated in Rated Current mode can generate maximum real power, and the corresponding generated reactive power will be minimum. The maximum reactive power (inductive) will be available only at minimum real power. The key to rated current operation is the limitation of output current from the power converter at the interface between the utility and the energy storage.
VI. CONCLUSION This paper investigates the use of reactive power
compensators and energy storage for wind farms in the Tehachapi area. It was determined that the original installations of reactive power compensations were not sufficient to help regulate the voltage in the area. It was initially decided that the size of reactive power placed at each wind turbine should be equal to the reactive power required during no load (no wind). The most common reactive power compensation is a fixed capacitor. The inclusion of reactive power compensation using SVC installed at Bus 40 was an improvement to the previous systems. Recently, wind farm operators were required to install additional capacitor compensation to help with voltage regulation during wind speed variations.
In this study, it was determined that the use of a combination of 25-MVAR static VAR compensation and a 25-MVAR fixed capacitor at Bus 40 is sufficient to compensate the Tehachapi area during high wind. The combination of fixed capacitor and static compensation is necessary to reduce the cost, considering that the cost of fixed capacitors is cheaper than static VAR compensation. Compensation placement is determined by the bottleneck of the power flow around CalCement and Monolith substations. This is based on a previous load flow study that is not included in this paper.
The energy storage studies consist of two parts: one with a unity power factor operation of energy storage and the other with rated current operation. For the unity power factor operation, we conclude that a combination of 50 MW at Bus 24 and a 25-MVAR SVC at Bus 40 is sufficient to compensate
IQCAP
IP
VS IQ
I∆Q
IQ = IQCAP
IP = IRATED
VS
I∆Q
HIGH WIND LOW WIND IRATED
-∆Q +QCAP PSTORED
PSTORED Q
IP, IQ
ENERGY STORAGE
FIXED CAPACITOR
Figure 21. Per-phase equivalent circuit and phasor diagrams describing the operation of rated current operation.
0 6000 Time (seconds)
Figure 22. Voltage at bus 24 with rated current operation.
Voltage at Mono (Bus 24) Energy Storage (50 MW) Fixed Cap 50 MVAR (Bus 40)
0.98 p.u.
1.045 p.u.
Reactive Power of the Storage at Mono (Bus 24)
0 MW - 50 MVAR
- 50 MW
Real Power of the Storage at Mono (Bus 24)
0 MVAR
0 6000 Time (seconds)
Figure 23. Real and reactive power out of bus 24.

10
the high power generation in the Tehachapi area. In terms of voltage regulation, an ideal solution is 50-MW energy storage and a 25-MVAR static VAR combined with a 25-MVAR fixed capacitor compensator (shown in Figure 20). With rated current operation, the energy storage can be operated sufficiently with only a 50-MVAR fixed capacitor during rated generation in the area. Adjustment can be made by switching some steps of the fixed capacitor compensation during high winds. The final decision should be based both on the technical and economical consideration.
VII. ACKNOWLEDGMENT The authors of this paper acknowledge the support of the
Transmission Planning Division of Southern California Edison (SCE) and the support of the U.S. Department of Energy. The authors would like to thank Pat Mayfield, George Chacon, Phil Save, and Antonio Velarde from SCE. This work is the result of collaboration between NREL and SCE under a non-disclosure agreement signed by NREL and SCE. This work is supported by the U.S. Department of Energy.
VIII. REFERENCES [1] Timothy J.E. Miller, Editor, “Reactive Power Control in Electric
Systems” John Wiley & Sons, 1982. [2] Mathur, R.M., Editor, “Static Compensators for Reactive Power
Control”, Cantext Publications, Winnipeg, Canada, 1984. [3] Yau, T., et al, “Effects of Battery Storage Devices on Power System
Dispatch,” IEEE Transactions on Power Apparatus and Systems, Vol. PAS-100, No. 1, January 1981, pp. 375-383.
[4] Kunisch, H.J., Kramer, K.G., Dominick, H., “Battery Energy Storage, Another Option for Load-Frequency-Control and Instantaneous Reserve”, IEEE Transactions on Energy Conversion, Vol. EC-1, No. 3, September 1986, pp. 41-54.
[5] Muljadi, E., Butterfield, C.P., Gevorgian, V.,"The Impact of the Output Power Fluctuation of a Wind Farm on a Power Grid," Conference Record, Third International Workshop on Transmission Networks for Offshore Wind Farms, Royal Institute of Technology, Stockholm, Sweden, April 11 - 12, 2002.
[6] IEC Standard 61 400-21 Measurement and Assessment of Power Quality of Grid Connected Wind Turbines.

REPORT DOCUMENTATION PAGE
Form Approved OMB NO. 0704-0188
Public reporting burden for this collection of information is estimated to average 1 hour per response, including the time for reviewing instructions, searching existing data sources, gathering and maintaining the data needed, and completing and reviewing the collection of information. Send comments regarding this burden estimate or any other aspect of this collection of information, including suggestions for reducing this burden, to Washington Headquarters Services, Directorate for Information Operations and Reports, 1215 Jefferson Davis Highway, Suite 1204, Arlington, VA 22202-4302, and to the Office of Management and Budget, Paperwork Reduction Project (0704-0188), Washington, DC 20503. 1. AGENCY USE ONLY (Leave blank)
2. REPORT DATE
October 2003
3. REPORT TYPE AND DATES COVERED
Conference paper
4. TITLE AND SUBTITLE Energy Storage and Reactive Power Compensator in a Large Wind Farm: Preprint
6. AUTHOR(S) E. Muljadi, C.P. Butterfield, R. Yinger, H. Romanowitz
5. FUNDING NUMBERS
WER3-3520
7. PERFORMING ORGANIZATION NAME(S) AND ADDRESS(ES)
National Renewable Energy Laboratory 1617 Cole Blvd. Golden, CO 80401-3393
8. PERFORMING ORGANIZATION
REPORT NUMBER NREL/CP-500-34701
9. SPONSORING/MONITORING AGENCY NAME(S) AND ADDRESS(ES)
10. SPONSORING/MONITORING
AGENCY REPORT NUMBER
11. SUPPLEMENTARY NOTES
12a. DISTRIBUTION/AVAILABILITY STATEMENT
National Technical Information Service U.S. Department of Commerce 5285 Port Royal Road
Springfield, VA 22161
12b. DISTRIBUTION CODE
13. ABSTRACT (Maximum 200 words)
The size of wind farm power systems is increasing, and so is the number of wind farms contributing to the power systems network. The size of wind turbines is also increasing—from less than 1 MW a few years ago to the 2- to 3-MW machines being installed today and the 5-MW machines under development. The interaction of the wind farm, energy storage, reactive power compensation, and the power system network is being investigated. Because the loads and the wind farms' output fluctuate during the day, the use of energy storage and reactive power compensation is ideal for the power system network. Energy storage and reactive power compensation can minimize real/reactive power imbalances that can affect the surrounding power system. In this paper, we will show how the contribution of wind farms affects the power distribution network and how the power distribution network, energy storage, and reactive power compensation interact when the wind changes. We will also investigate the size of the components in relation to each other and to the power system.
15. NUMBER OF PAGES
14. SUBJECT TERMS
energy storage; reactive power compensator; static VAR compensator; wind turbine; induction generator; synchronous generator; wind farm; power system; renewable energy
16. PRICE CODE
17. SECURITY CLASSIFICATION
OF REPORT Unclassified
18. SECURITY CLASSIFICATION
OF THIS PAGE Unclassified
19. SECURITY CLASSIFICATION
OF ABSTRACT Unclassified
20. LIMITATION OF ABSTRACT
UL
NSN 7540-01-280-5500 Standard Form 298 (Rev. 2-89) Prescribed by ANSI Std. Z39-18 298-102