energy saving with total energy system for cold storage in ... · energy saving with total energy...
TRANSCRIPT

Applied Mathematical Sciences Vol. 8, 2014, no. 130, 6529 - 6546
HIKARI Ltd, www.m-hikari.com
http://dx.doi.org/10.12988/ams.2014.46443
Energy Saving with Total Energy System for Cold
Storage in Italy: Mathematical Modeling and
Simulation, Exergetic and Economic Analysis
D. Friso
Department of Land, Environment, Agriculture and Forestry-TESAF
Research Unit: Agricultural and Food Engineering
University of Padova, Viale dell’Università 16, Legnaro 35020, Padova, Italy
Copyright © 2014 D. Friso. This is an open access article distributed under the Creative Commons
Attribution License, which permits unrestricted use, distribution, and reproduction in any medium,
provided the original work is properly cited.
Abstract
With the aim of energy saving in cold storage in Italy, an integrated system (Total
Energy System – TES) was considered for production of cold air, obtained by
assembling compression system, absorption system and cogeneration unit (CHP)
fuelled with methane-gas, in two different plant solutions: 1) TES consisting of the
CHP, mechanically coupled with the compression refrigerating machine and
thermically with the absorption system both designed to cool the air in the store
rooms; 2) TES* characterized by the CHP, mechanically coupled with the
compression refrigerating machine, designed to cool the air in the store rooms, and
thermically with the absorption system designed to cool the air in a pre-refrigeration
plant. A mathematical modeling and a consequent computer simulation of the
behavior of both integrated system (TES and TES*) and both related conventional
systems (CES consisting of a compression machine to cool the air in the store rooms
and CES* characterized by two compression machines, the first cooling air in the
store rooms, the second cooling air in a pre-refrigeration plant) was carried out. As
an overall results, an energy saving of 21÷16% was calculated. Considering the
difficulty of comparing the different types of energy involved, an exergetic analysis
6530 D. Friso
was also carried-out, confirming a better exergetic efficiency of TES vs. CES.
Finally, an economic evaluation was also conducted with a very attractive
profitability index for TES and TES* systems fuelled with natural gas. The economic
analysis showed that the use of bio-methane, in the TES system, is profitable up to a
bio-methane cost of 0.46 €/m3.
Keywords: Cold storage; Heat and power cogeneration; Total energy system;
Energy saving; Exergetic analysis; Bio-methane.
1 Introduction
Of the overall world food production, 4,200 Mt/year, it is estimated that 40%
consists of perishable goods and hence requires cold storage [1]. In Italy, where the
statistics are approximate and rather old there are notable differences between
areas, but as far as fruit and vegetables are concerned, about 2 Mt/year are kept in
cold storage [1].
This corresponds, again referring to fruit and vegetables alone, to an annual energy
consumption of around 0.5 Mtep [1]. This figure refers to the fuel consumed in
thermo-electric power stations, given that almost all refrigerating machines are based
on mechanical compression cycles using electric engines.
At the level of costs, it can be stated [1] that expenditure on energy represents
around 12% of total costs for large refrigerated stores. This is a percentage that
should certainly not be overlooked, as often occurs in planning the warehouses and
relative refrigerating machines.
On the other hand, the natural gas network has been developed considerably in Italy,
but is used mainly for heating purposes particularly in the winter months. This causes
serious problems for the gas company which, with the gas pipelines from abroad
being constantly open, is obliged to store the fuel in the summer at considerable
cost. There is consequently a need to incentive gas consumption in summer, even by
cutting the prices, and refrigeration could play an important role in this.
There is thus an interest in designing plants which would not only provide energy
savings but would also use methane-gas directly for cold storage. In this sense we
shall examine a Total Energy System (TES) consisting of a cogeneration unit,
based on the internal combustion engine adapted for methane-gas power,
mechanically coupled with a compression refrigerating machine and thermically
with a absorption refrigerating system, using hot water at 95°C.
As an alternative, was also evaluated to feed the cogeneration engine with bio-
methane, produced from organic waste [2 and 3] of fruits and vegetables processing
and storage.

Energy saving with total energy system for cold storage 6531
After choosing a refrigeration store for fruit and vegetable conservation and
defining the size of the TES and a conventional compression system (CES) on the
basis of project data, calculation was made of average monthly cooling loads and
for an entire annual cycle. On the basis of these data, considering the energy flows
imposed by interaction among the various components of the TES, an analysis was
made of energy consumption, showing average monthly and overall savings from the
TES with respect to the conventional system (CES).
Considering the difficulty of comparing the different types of energy involved, the
valuation was completed with an exergetic analysis [4] and calculation was also
made of the TES profitability index [5] to show whether it is economically viable.
Table 1 – List of symbols
Variable Description Units
Co Percentage of engine hourly consumption %
COP Coefficient of performance (cooling)
Ea Thermal power required by absorption system kW
Ea% Percentage of maximum thermal power (abs. sys.) %
Ec Mechanical power required by compression system kW
Ec% Percentage of maximum mechanical power (comp. sys.) %
EXa Exergetic/transformation power required by absorption system kW
EXc Exergetic/transformation power required by compr. system kW
EXQa Exergetic/transformation power delivered by absorption sys. kW
EXQc Exergetic/transformation power delivered by compression sys. kW
EXt Exergetic/transformation power required by engine kW
PNV Present net value €
Qa Cooling power delivered by absorption system kW
Qa% Percentage of cooling power delivered by absorption system %
Qc Cooling power delivered by compression system kW
Qc% Percentage of cooling power delivered by compression system %
Qf Total cooling load kW
Qt Combustion (primary) thermal power required by engine kW
R Thermal energy/mechanical energy ratio delivered by the engine
Rv Profitability index
Tap Approach temperature of cooling tower °C
Tdb Dry bulb temperature °C
Twb Wet bulb temperature °C
Tc Temperature of cold water entering the condenser °C
Te Evaporation temperature of frigorific fluid °C
Tp Product temperature on entry to the cooling system °C

6532 D. Friso
2 Energetic and exergetic analysis formulation
In order to achieve a complete energetic and exergetic analysis, a mathematical
modeling was carried-out. The equations obtained were the basis for setting up a
computer programme simulating the behaviour of both the TES and the conventional
system CES in relation to different conditions of operation imposed by variations in
weather conditions and cooling loads in the course of the year.
With regard to the TES (fig.1), due to the cogeneration unit that presents the
variation of the ratio of thermal power and mechanical power depending on the load,
it was necessary to set up a simultaneous calculation simulation, using a suitable
algorithm.
Figure 1- Scheme of Total Energy System TES (left) and Conventional Energy System CES
(right).
Table 2 - Volumetric, thermal and functional features of the fruit and vegetable refrigeration
plant [6].
Rooms
Number (N.)
Rooms Vol.
(m3)
Walls Transmit.
(W/m2°C)
Ambient
Temper. (°C)
Internal
Temper. (°C)
25 1,250 0.46 38 2
Air Spare/h
(N.)
Food Specific
Heat (kJ/kg°C)
Package Specific
Heat (kJ/kg°C)
Input Food
Temper. (°C)
Respiration
Heat (W/t)
Spare/day
(%)
0.1 3.8 2.1 30 17.4 10
COMPRESSION
COOLING SYSTEM
ABSORTION
COOLING SYSTEM
COGENERATION UNIT
STORE ROOMS
COMPRESSION COOLING
SYSTEM
STORE ROOMS
TES CES
Energy saving with total energy system for cold storage 6533
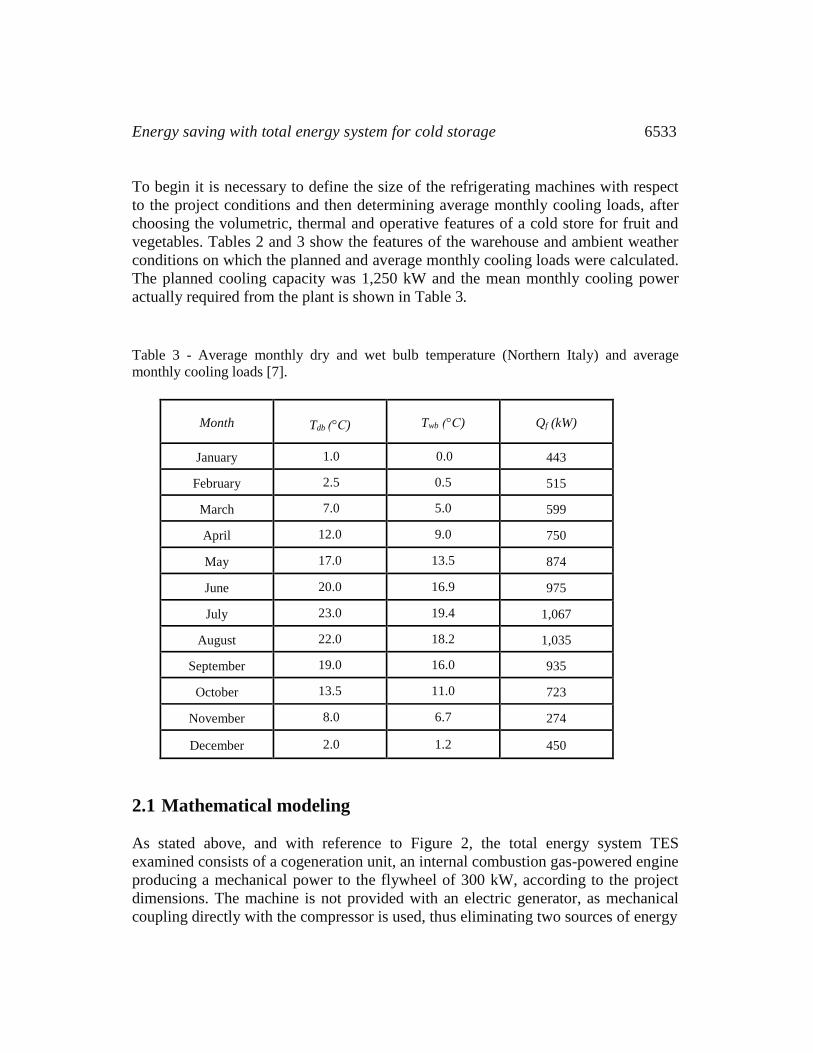
To begin it is necessary to define the size of the refrigerating machines with respect
to the project conditions and then determining average monthly cooling loads, after
choosing the volumetric, thermal and operative features of a cold store for fruit and
vegetables. Tables 2 and 3 show the features of the warehouse and ambient weather
conditions on which the planned and average monthly cooling loads were calculated.
The planned cooling capacity was 1,250 kW and the mean monthly cooling power
actually required from the plant is shown in Table 3.
Table 3 - Average monthly dry and wet bulb temperature (Northern Italy) and average
monthly cooling loads [7].
Month Tdb (°C) Twb (°C) Qf (kW)
January 1.0 0.0 443
February 2.5 0.5 515
March 7.0 5.0 599
April 12.0 9.0 750
May 17.0 13.5 874
June 20.0 16.9 975
July 23.0 19.4 1,067
August 22.0 18.2 1,035
September 19.0 16.0 935
October 13.5 11.0 723
November 8.0 6.7 274
December 2.0 1.2 450
2.1 Mathematical modeling
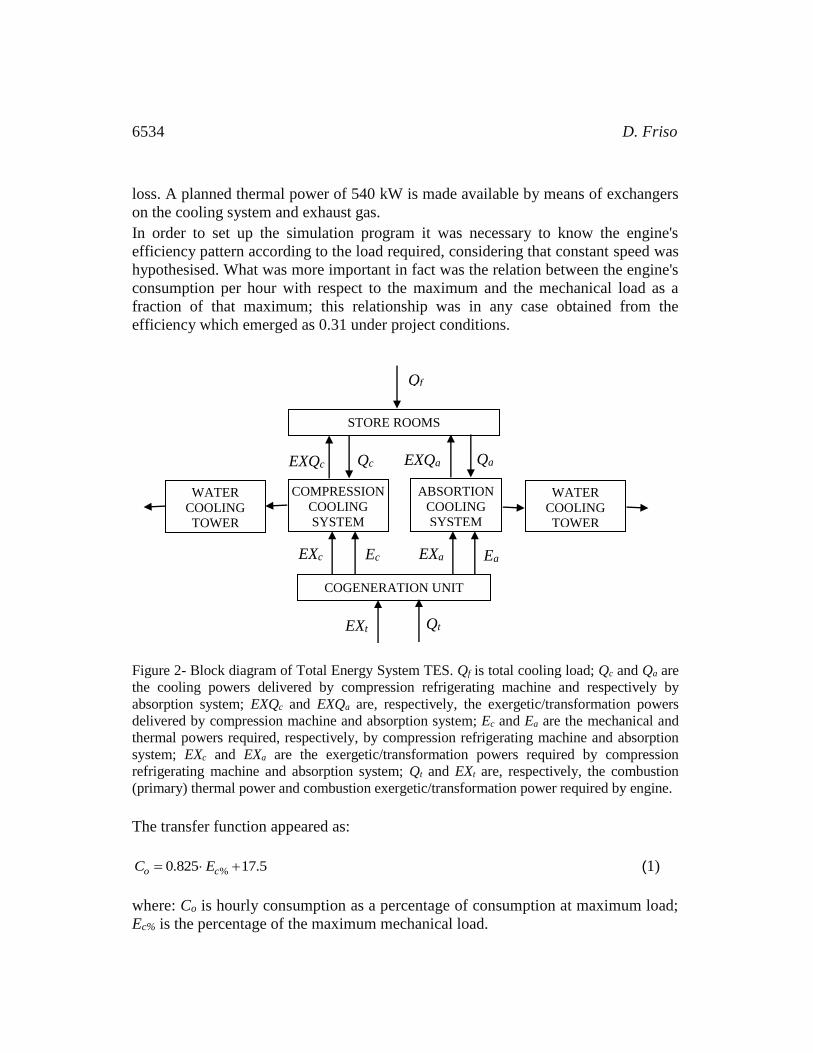
As stated above, and with reference to Figure 2, the total energy system TES
examined consists of a cogeneration unit, an internal combustion gas-powered engine
producing a mechanical power to the flywheel of 300 kW, according to the project
dimensions. The machine is not provided with an electric generator, as mechanical
coupling directly with the compressor is used, thus eliminating two sources of energy
6534 D. Friso
loss. A planned thermal power of 540 kW is made available by means of exchangers
on the cooling system and exhaust gas.
In order to set up the simulation program it was necessary to know the engine's
efficiency pattern according to the load required, considering that constant speed was
hypothesised. What was more important in fact was the relation between the engine's
consumption per hour with respect to the maximum and the mechanical load as a
fraction of that maximum; this relationship was in any case obtained from the
efficiency which emerged as 0.31 under project conditions.
Figure 2- Block diagram of Total Energy System TES. Qf is total cooling load; Qc and Qa are
the cooling powers delivered by compression refrigerating machine and respectively by
absorption system; EXQc and EXQa are, respectively, the exergetic/transformation powers
delivered by compression machine and absorption system; Ec and Ea are the mechanical and
thermal powers required, respectively, by compression refrigerating machine and absorption
system; EXc and EXa are the exergetic/transformation powers required by compression
refrigerating machine and absorption system; Qt and EXt are, respectively, the combustion
(primary) thermal power and combustion exergetic/transformation power required by engine.
The transfer function appeared as:
%0.825 17.5 o cC E (1)
where: Co is hourly consumption as a percentage of consumption at maximum load;
Ec% is the percentage of the maximum mechanical load.
WATER
COOLING
TOWER
EXQc Qc Qa
Ec
Qt
Ea EXc
EXt
EXQa
Qf
EXa
COMPRESSION
COOLING
SYSTEM
ABSORTION
COOLING
SYSTEM
COGENERATION UNIT
WATER
COOLING
TOWER
STORE ROOMS

Energy saving with total energy system for cold storage 6535
It follows that according to the mechanical load required, the ratio between thermal
energy and mechanical energy supplied by the engine varies; under project
conditions it was 1.8. The following equation, again obtained starting from engine
performance [8], provides the value of this ratio R:
4 2 7 3
% % %5 0.075 4.8 10 5.76 10 c c cR E E E (2)
The compression refrigerating machine was characterised by the fact that it operated
at an evaporation temperature Te of on average -13°C and condensation temperature
varying according to ambient weather conditions - dry and wet bulb temperature -
which affect the working of the water cooling tower necessary for cooling water for
the condenser. Under project conditions the coefficient of performance (COP) -
recalling the lack of the electric engine - was 3.3, while its efficiency in relation to
the cooling load required and the temperature of cold water entering the condenser
allowed us to identify the transfer function, using the minimum square method with
experimental data [9]. This correlates the mechanical power required from the
compressor Ec%, again as a percentage of the maximum, with the percentage of the
cooling load compared to the project load Qc% and with the temperature of cold water
entering the condenser Tc (°C):
3 2 2 2 2
% % %
2 4 2 4 2 6 2 2% % % %
6.956 0.475 2.457 10 3 10 1.047 10
1.968 10 2.5 10 5.125 10 5.871 10
c c c c c
c c c c c c c c
E Q Q T T
Q T Q T Q T Q T
(3)
Considering the planned mechanical power supplied by thermo-mechanical
generating unit, equal to 300 kW, and the planned COP, equal to 3.3, a maximum
cooling power of 1,000 kW emerges.
The absorption refrigerating system, operating at an evaporation temperature Te of -
13°C and condensation temperature varying with the conditions of the evaporation
tower, is characterized by a response of absorbed thermal power (Ea%), as a
percentage fraction of the planned power, to the required cooling power (Qa%), again
as a percentage of the planned power, according to the following equation obtained
from data [9] with the minimum square method:
2 3 2 2 2% % %
2 4 2 4 2 6 2 2% % % %
26.829 5.653 10 6.998 10 2.172 5.451 10
2.834 10 1.63 10 2.432 10 1.136 10
a a a c c
a c a c a c a c
E Q Q T T
Q T Q T Q T Q T
(4)
Here the influence of the temperature of cold water entering the condenser, Tc, can

6536 D. Friso
still be seen and is expressed in °C as in function (3).
Under project conditions this machine is characterised by a COP of 0.46 which, with
the thermal power supplied by the cogeneration engine, gives the remaining 250 kW
of cooling power.
With regard to the water cooling towers for the condensers and absorption system, an
equation has been hypothesised giving the temperature of water entering the
condensers, Tc:
c wb apT T T (5)
where Twb is the wet bulb temperature of ambient air and Tap is the increase due to the
tower's actual working. Only in ideal conditions can Tap be hypothesised as zero,
while in the simulation it was taken as constant at 5 °C. In reality the temperature Tc
could be determined more precisely by using a thermal balance which would equate
the heat to be disposed of at the tower, equal to the cooling load plus the work
supplied to the compressor or plus the heat supplied to the absorber, with the increase
in enthalpy experienced in the air. Taking all this into account and assuming air and
water deliveries to be constant, it emerged that expression (5), though referred to
project conditions alone, gives a fairly accurate picture of the behaviour of the
towers, even with reduced loads corresponding to lower wet and dry bulb
temperatures of ambient air.
As far as the conventional refrigerating machine (CES) is concerned, as this is a
compression cycle the transfer function (3) may be used, adding the effect of the
electric engine's efficiency which is assumed to be constant at 0.86.
Considering that there are few absorption refrigerating systems available that are able
to operate at evaporation temperatures lower than 0°C, we decided to proceed with a
second analysis, involving an absorption system using lithium bromide/water and
which is more frequently marketed. In this case the evaporation temperature is
necessarily higher than 0°C, given that the frigorific fluid is water. Here the only
possibility is to use the cold produced as a source of pre-refrigeration, with
secondary water refrigerated to 5°C coming out of the evaporator and used directly in
the pre-refrigeration plant (fig. 3).
Figure 3- Scheme of TES* (left) and CES* (right).
COMPRESSION
COOLING SYSTEM
ABSORTION COOLING
SYSTEM
COGENERATION UNIT
STORE ROOMS PRE-Refrigeration PRE-Refrigeration STORE ROOMS
COMPRESSION
COOLING SYSTEM 1
COMPRESSION
COOLING
SYSTEM 2
TES* CES*

Energy saving with total energy system for cold storage 6537
In this situation the compressor machine in the total energy system (TES*) has to
provide the entire refrigeration for the cold store rooms, hence with a planned power
of 1250 kW. The planned mechanical power of the cogeneration unit thus rises to
380 kW and thermal power reaches 680 kW. The new absorption system operates
with a planned COP of 0.74, corresponding to a cooling power of 500 kW, sufficient
to provide pre-refrigeration daily for a quantity of fruit and vegetables equal to 10%
of the goods stored in the refrigeration rooms, assuming product temperature Tp of
30°C on entry to the plant and 7 °C on exit. Two further considerations should be
made regarding the closure of the pre-refrigeration plant in the winter months and the
need, in order to make a fair comparison, to examine a conventional compression
pre-refrigeration plant.
Therefore, the total energy system TES* was compared with a conventional system
(CES*) consisting of a compression refrigerating machine for loads of cold storage
and a second compression refrigerating machine for loads of pre-refrigeration (fig.
3).
2.2 Simulation program
The equations (1), (2), (3), (4) and (5) outlined above are the basis for setting up a
computer programme in Visual Basic language simulating the two TES
configurations presented along with the two conventional systems (CES) for
comparison.
With regard to the first total energy system in which the absorption refrigerating
system refrigerates the cold storage rooms, since the cogeneration unit is
characterised by a variation in the relationship between thermal power and
mechanical power according to the mechanical load, it was necessary to set up a
simultaneous calculation simulation, using an algorithm based on a method
identifying the zeros of a suitable function. The flow chart in Figure 4 illustrates the
structure of this algorithm.
The flow chart is completed with blocks determining the COP of the two
refrigerating machines comprising the TES and the conventional system (CES), as
well as energy consumption for the TES and the electric power station supplying
energy to the conventional machine (CES), assuming an overall efficiency from
electricity production and transport of 0.36 [10].
A block has also been added to calculate exergetic flows on entry and exit from the
various units, hence exergetic efficiency. In determining these flows we adopted
Borel’s approach, [11, 5 and 12], with the following hypotheses: ambient
temperature variable and equal to average monthly dry bulb temperature (table 3);
exergetic value of the fuel equal to its calorific value; exergetic/transformation
powers on exit from the refrigerating machines calculated on the final fluid, i.e. on
refrigerated air within the cold store rooms, or on the cold water in the case of pre-
refrigeration.

6538 D. Friso
In the case of the second total energy system (TES*), as the absorption system's function is
basically independent of the compressor's function - i.e. to cool water for pre-refrigeration
according to the latter's variable loads - a simpler programming model was used, involving so-
called sequential calculation simulation.
Figure 4 - Flow-chart of simulation program.
Xb = X, Yb = Y Xa = X, Ya = Y
False
COOLING LOADS AND TEMPERATURES
MONTH M = 1,12
START
LOAD ALLOTMENT BETWEEN COMPR. (Qc) AND ABS. (Qa)
Qa/Qc RATIO = X
ENERGY POWER OF COMPR. (Ec) AND ABS. (Ea)
COGENERATION RATIO R
DIFFERENCE (Ea/Ec) – R = Y
THE CALCULATION OF X AND Y IS REPEATED TWICE
THE TWO COUPLES OF VALUES ARE (Xa, Ya) (Xb, Yb)
Ya∙ Yb<0
> 0
True
X = (Xa∙Yb – Xb∙Ya)/(Yb - Ya), Y=F(X)
= 0
< 0
Ya ∙ Y
TEST
ENERGY POWER REQUIREMENT
COEFFICIENT OF PERFORMANCE (COP)
EXERGETIC EFFICIENCY
END
DATA ERROR

Energy saving with total energy system for cold storage 6539
2.3 Economic analysis formulation
A cost-benefit analysis was undertaken, adopting the method of profitability index
calculation (Rv) [5] for the two versions of the total energy system (TES and TES*),
in relation to the cost of the substitute energy source (methane from natural gas or
bio-methane).
This profitability index, the ratio between PNV - present net value - and the higher
investment of the TES plant with respect to the conventional one (CES), was a
function of the following parameters, partly derived from the previous energy
analysis, the results of which are reported in the following section:
1) annual savings on electricity (cost 0.125 €/kWh [13]), TES: 256,000 €, TES*:
335,000 €;
2) annual methane consumption, TES: 472 km3; TES*: 660 km3;
3) higher annual cost of ordinary and extraordinary maintenance (7.5% of higher
investment of plant), TES: 18,500 €, TES*: 22,700 €;
4) higher investment of plant, TES: 246,000 €; TES*: 303,000 €;
5) working life of all the refrigerating machines, on a cautionary basis, as 20 years;
10 for the cogeneration unit;
6) interest rate: 5%;
7) methane price: 0.33 €/m3 [13].
3 Results
As far as the energetic analysis is concerned, the results of computer simulation of
the total energy system (TES), with the cold produced by the absorption system
being used directly in the store rooms, compared with the conventional system
(CES), show (Figure 5) an undulatory pattern of energy consumption - required
thermal power Qt - with a maximum corresponding logically to the highest average
monthly temperature of both the ambient and the products stored. With regard to the
conventional system (CES), this consumption should be understood as the flow of
thermal energy Qt expended in the electric power station, calculated from the flow of
electricity absorbed by the compressor, assuming a constant efficiency rate in
electricity production and transport of 0.36 [10].

6540 D. Friso
0
200
400
600
800
1000
1200
1 2 3 4 5 6 7 8 9 10 11 12
Pri
mar
y th
erm
al p
ow
er
Qt(k
W)
Month
CES: average q = 646 kW
TES: average q = 508 kW
Figure 5 - Pattern of required primary thermal power Qt, in the course of a complete year, of
TES (Total Energy System) and conventional CES (Compression Energy System).
In the winter months the performance of the two systems is similar, as the TES
engine, operating at lower loads, is less energy-efficient.
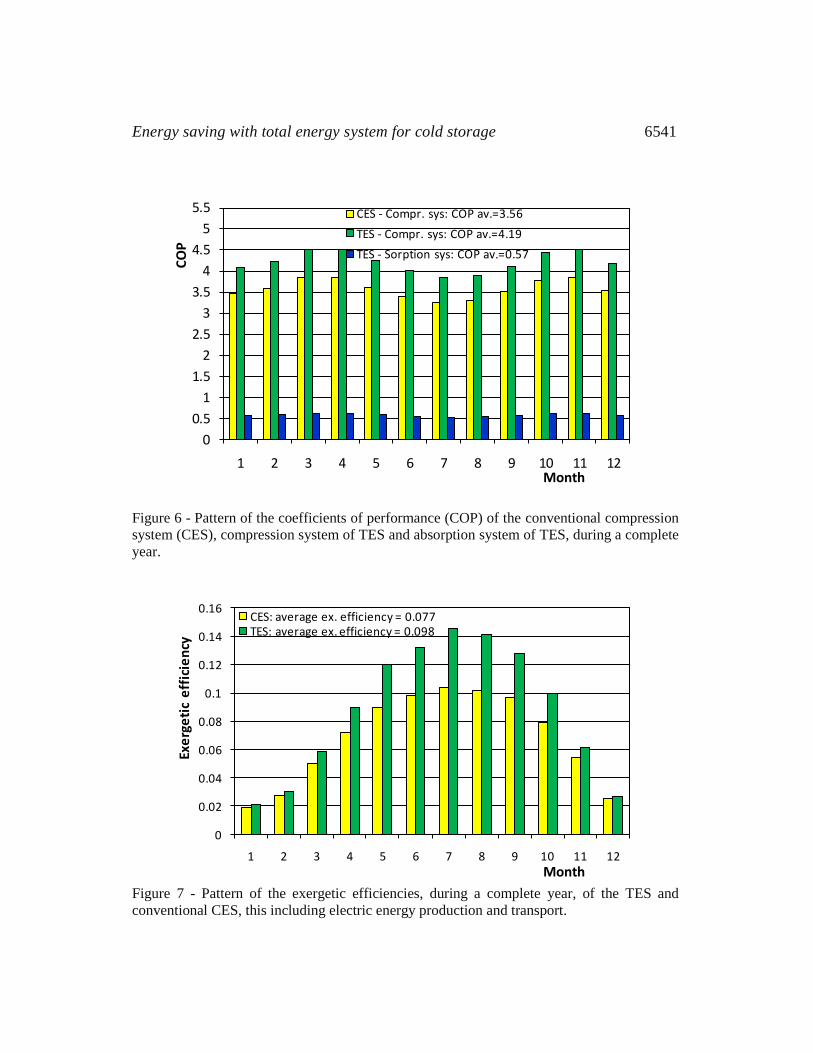
Again with regard to the energetic approach, Figure 6 shows the trends in
coefficients of performance for the two refrigerating machines comprising the TES
and for the conventional system (CES). Here too an undulatory pattern may be
observed, though with double frequency, due on the one hand to the influence of the
condensation temperature which tends to lower the COP in the summer months, and
on the other hand to the lower values of the cooling loads in winter which also tend
to reduce the COP.
The higher values found for the TES compression system, with respect to the
conventional one (CES), are due to the lack of the electric engine powering the
compressor. The overall average values of energy consumption, 646 and 508 kW for
the conventional system (CES) and the TES respectively, show energy savings of
21% for the latter, corresponding to 0.105 MTep/year of energy saving expected for
Italy.
With regard to exergetic analysis, Figure 7 shows overall exergetic efficiency for the
TES and the conventional system CES respectively, with the latter including the
electricity production and transportation processes.
Energy saving with total energy system for cold storage 6541
0
0.5
1
1.5
2
2.5
3
3.5
4
4.5
5
5.5
1 2 3 4 5 6 7 8 9 10 11 12
CO
P
Month
CES - Compr. sys: COP av.=3.56
TES - Compr. sys: COP av.=4.19
TES - Sorption sys: COP av.=0.57
Figure 6 - Pattern of the coefficients of performance (COP) of the conventional compression
system (CES), compression system of TES and absorption system of TES, during a complete
year.
0
0.02
0.04
0.06
0.08
0.1
0.12
0.14
0.16
1 2 3 4 5 6 7 8 9 10 11 12
Exe
rge
tic
eff
icie
ncy
Month
CES: average ex. efficiency = 0.077TES: average ex. efficiency = 0.098
Figure 7 - Pattern of the exergetic efficiencies, during a complete year, of the TES and
conventional CES, this including electric energy production and transport.

6542 D. Friso
Average values are around 0.098 and 0.077 for the TES and the conventional system
(CES), showing 21% greater efficiency for the former in using primary thermal
energy; moreover, this figure is identical to the corresponding savings in energy
consumption. This result is better than that obtained from [14] (about 10%). This is
both for the different climatic conditions in the UK that for their lower efficiency of
the cogeneration unit (CHP) that include electric generator and motor.
It is interesting to note that the exergetic efficiency of both systems is reduced about
ten times then passing from the summer to the winter months, an indication that it is
not advisable, in terms of the 2nd law of thermodynamics, to expend relatively
expensive energy, such as high temperature thermal energy corresponding to
combustion in an electric power station or an engine, in order to obtain, as a final
effect, an air temperature in the refrigeration rooms which is not very different from
the ambient air temperature.
As far as the economic valuation is concerned, it emerged that with the current
discounted natural-gas price of 0.33 €/m3 [13], the profitability index is around 3.15,
corresponding to 3.7 years for pay-back.
The proposed total energy system is thus a valid solution from the exergetic point of
view and is also economically advisable. The cost-benefit analysis illustrated in
Figure 8 shows that the system is profitable up to a methane cost of 0.46 €/m3.
Therefore it is necessary that bio-methane has a cost lower than this limit.
-1
0
1
2
3
4
0.300.320.340.360.380.400.420.440.460.480.50
Pro
fita
bil
ity
ind
ex
Rv
Methane-gas cost (€/m3)
Figure 8 - Profitability index of TES under variable methane-gas price. For a natural gas
price of 0.33 €/m3, the profitability index results of 3.15. For a bio-methane cost of 0.46
€/m3, the profitability index results zero.

Energy saving with total energy system for cold storage 6543
The second system hypothesised, (TES*), with the absorption used for pre-
refrigeration, shows a pattern of primary thermal power requirement which is
illustrated in Figure 9.
0
200
400
600
800
1000
1200
1400
1600
1 2 3 4 5 6 7 8 9 10 11 12
Pri
mar
y t
he
rmal
po
we
r Q
t (k
W)
Month
CES*: average q = 849 kW
TES*: average q = 713 kW
Figure 9 - Pattern of required primary thermal power Qt, in the course of a complete year, of
the second total energy system TES* and comparative conventional CES* (double
compression system).
0
0.02
0.04
0.06
0.08
0.1
0.12
0.14
1 2 3 4 5 6 7 8 9 10 11 12
Exe
rge
tic
eff
icie
ncy
Month
CES*: average ex. efficiency = 0.068
TES*: average ex. efficiency = 0.081
Figure 10 - Pattern of the exergetic efficiencies, during a complete year, of the second total
energy system TES* and comparative conventional CES*, this including electric energy
production and transport.

6544 D. Friso
Comparison with the corresponding conventional system (double compression system
CES*) shows greater consumption in the colder months when the absorption system in
TES* is not operative, so that the thermal energy available in the cogeneration unit is
dispersed through the relative evaporation tower, while the lower cooling loads required
correspond to a significant reduction in the efficiency of the TES* engine. All in all
energy saving is lower, with an annual average of around 16%. This latter value is also
confirmed by exergetic analysis, the results of which are shown in Figure 10. Again with regard to TES*, cost-benefit analysis shows a similar situation to TES, with a
profitability index of 2.87, again with a discounted natural-gas price of 0.33 €/m3.
4 Conclusions Energetic analysis of the total energy system (TES), consisting of a methane-powered
engine supplying mechanical power to a compression refrigerating machine and thermal
power to an absorption system, both of which are used for cooling the refrigeration
rooms, has shown a significant reduction in energy consumption of 21%, with respect to
the conventional cooling system (CES). This figure was obtained by means of a
comparison between primary energy consumption in the engine and the electric power
station respectively.
In order to overcome the limitations of this traditional kind of energy calculation, based
on the principle of metrological equivalence among different energy sources, an
exergetic analysis was undertaken -based on the operative equivalence of energy
sources- which not only confirmed the previous result, but also pointed out the
behaviour of each single machine, showing that the greatest exergetic loss takes
place in the refrigerating machines operating in winter.
The cost-benefit analysis, showing a profitability index of 3.15, demonstrated that
this type of cooling system for fruit and vegetable storage is economically viable.
A similar analysis carried out on the second proposed system, (TES*), with
absorption used for pre-refrigeration, showed energy savings of 16% and hence
equally greater exergetic efficiency with respect to the corresponding conventional
system (CES*). In economic terms, a profitability index of 2.87 emerged, similar to
the former one.
To conclude, both systems are of interest in terms of energy consumption, though to
different extents, as they would provide energy savings at Italian level up to 100
kTep if they were adopted on a wide scale, a fact which would be greatly encouraged
by their unquestionable economic benefits. To ensure that the economic benefits will
occur also fueling the engine with bio-methane, it is necessary that the bio-methane
has a cost less than 0.46 €/m3.

Energy saving with total energy system for cold storage 6545
References
[1] L. Mattarolo, R. Lazzarin, Cold Storage, Conference Proceeding on Cold
Storage Design, Bari, Italy, 1991.
[2] G. Toscano, G. Riva, D. Duca, E.F. Pedretti, F. Corinaldesi, G. Rossini, Analysis
of the characteristics of the residues of the wine production chain finalized to
their industrial and energy recovery, Biomass and Bioenergy, 55 (2013), 260-
267. http://dx.doi.org/10.1016/j.biombioe.2013.02.015
[3] E. Dinuccio, P. Balsari, F. Gioielli, S. Menardo, Evaluation of the biogas
productivity potential of some Italian agro-industrial biomasses, Bioresource
Technology, 101 (2010), 3780–3783.
http://dx.doi.org/10.1016/j.biortech.2009.12.113
[4] F. Bosnjakovic, Technische Thermodinamik, Theodor Steinkopf, Dresden, 1965.
[5] D. Friso, S. Grigolato, R. Cavalli, Energetic and exergetic analysis of steam
production for the extraction of coniferous essential oils, Biomass and
Bioenergy, 35 (2011), 4045-4056. http://dx.doi:10.1016/j.biombioe.2011.06.044
[6] D. Friso, Ingegneria dell’industria alimentare: operazioni unitarie del food
engineering, Ed. CLEUP, Padova, 2013.
[7] C.N.R., Dati climatici per la progettazione edile ed impiantistica, Piano
Finalizzato Energetica, Consiglio Nazionale delle Ricerche, Roma, 1982.
[8] J. B. Heywood, Internal Combustion Engine Fundamentals, Mac Graw-Hill,
New York, 1989.
[9] ASRAE, Handbook-Refrigeration, ASRAE, New York, 2010.
[10] http://www.terna.it/default/Home/Archivio_Documenti.aspx, Dati statistici
sull’energia elettrica in Italia, 2012_It_5-PRODUZIONE.pdf, tab. 32, impianti
con sola produzione di energia elettrica, 105.
[11] L. Borel, D. Favrat, Thermodynamique et energétique, Presses Polytechniques et
Universitaires Romandes, Lausanne, 2005.

6546 D. Friso
[12] Q. Liu, Y. Duan, H. Song, Thermal performance analysis of a biomass-fired
organic rankine cycle, Zhongguo Dianji Gongcheng Xuebao/Proceedings of the
Chinese Society of Electrical Engineering, 33 (26) (2013), 60-67.
[13] Enel, Eni, Elettricity and methane costs, Personal communications, 2014.
[14] G.G. Maidment, G. Prosser, The use of CHP and absorption cooling in cold
storage, Applied Thermal Engineering, 20 (2000), 1059-1073.
Received: June 1, 2014