energy saving possibilities in twin or triple propeller ... · pdf fileenergy saving...
TRANSCRIPT

Third International Symposium on Marine Propulsors smp’13, Launceston, Tasmania, Australia, May 2013
ENERGY SAVING POSSIBILITIES IN TWIN OR TRIPLE PROPELLER CRUISE LINERS
Raimo Hämäläinen1, Jaap van Heerd2
1STX Finland (STX EUROPE), Turku, Finland
2Maritime Research Institute (MARIN), Wageningen, Netherlands
ABSTRACT More environmentally friendly solutions are required for future ships like recently STX Finland’s delivered LNG powered cruise ferry. The fuel economy and green things are playing a more important role.
The ship hull form and its appendages are the best energy saving possibilities. Success in hydrodynamic design is following the whole vessel, its operation life and makes it better possibility to compete in the harder markets.
Today RANSE based CFD tools (Figure 1) have shown their usefulness in detailed hydrodynamic designs and they are in routine use in the yards’ design offices.
The good solutions for improved ship designs are podded propulsion, Dual-End CRP, ECO efficient conventional propulsion concept and hybrid propulsion concept.
The different kind of ECO efficient steps are looked for twin and triple screw cruise liners. These steps are looking how to reduce appendage resistance case by case, what are possible to reach by ESDs and what practical propulsion alternatives are available for twin screw cruise liners.
As a concluding remark, the future scenario for energy saving devices for twin screw propulsion concepts is given.
Keywords ECO efficient hull form, low appendage resistance, Energy Saving Devices, high propulsion efficiency, CFD RANSE calculations.
Figure 1. RANSE CFD calculations to cruise line aftbody
NOMENCLATURE CFD Computational Fluid Dynamics CPP Controllable Pitch Propeller CRP Contra Rotating Propeller DM Diesel Mechanical DE Diesel Electric ESD Energy Saving Device Fn Froude number [-], Vs/sqrt(g*Lpp) FPP Fixed Pitch Propeller n Propeller rotation rate [hz] N Propeller rotation rate [RPM] OW Open water PD Propulsion power [kW] PE Effective power of the ship [kW]. PS Shaft power [kW] Q Torque [kNm] RANSE Reynolds Average Navier Stokes Equation Rn Reynolds number RT Ship resistance [kN] Ts Total thrust [kN] t Thrust deduction fraction (1-R/T) w Effective wake fraction (1-Va/Vs) Vs Ship speed [knots]
55

Va Speed of advance [knots] WDA Wave Damping Aftbody ηD Propulsion efficiency ηH Hull efficiency ηO Open water efficiency ηR Rotation efficiency
INTRODUCTION The shipbuilding industry in Europe is changing, in part, from simple conventional vessels to more advanced ships. Nowadays, cruise liners and ferries are sailing at more economical ways, optimal trim and most economical behavior in the route are following. More environmentally friendly solutions are required for recently developed ships like LNG powered cruise ferry with car deck. The fuel economy and green things are playing a more important role. Conventional twin-screw propulsion concepts do not always have the capability to fulfill these higher requirements. A rather good solution for an improved ship design is the so-called ECO efficient concept, podded propulsion and hybrid propulsion concept combined with Wave Damping Aftbody. The term hybrid propulsion means that two different propulsion types are combined (Figure 2) into one propulsion system. A general description of the hydrodynamic behavior, efficiencies of different propeller concepts, resistance versus effective wake and the advantages and disadvantages of a CRP propulsion system are described. A number of rules of thumb for propeller loading and optimum POD / propeller locations are given. A description of the hybrid concept is given for special CRP cruise liner and for world largest cruise liner. The advantages and the drawbacks of the podded propulsion units combined with the conventional propeller concept and the triple POD propulsion system configuration are reviewed. A CRP propulsion concept designed for a fast large Cruise Liner is described and compared with conventional concepts. As a concluding remark, the future scenario for hybrid propulsion concepts is given.
Figure 2. Ship model of a Hybrid Cruise Ferry
HYDRODYNAMIC DESIGN In cruise liner projects many critical hydrodynamic aspects have to be taken into account to be sure that the whole ship behaves well. Some of these items are:
- Low resistance behavior (WDA-effect is required by optimum LCB location and long aft part) in deep and shallow water. - Propeller hull excitations (vibration, under water
noise, clearance limitations, etc.). - Erosion and interactions specially in CRP-case. - Cavitation in propellers and appendages. - Good seakeeping ability (slamming behavior, motions, swinging, green water, etc.). - Good maneuverability (course stability, crabbing, etc.). - Steering in wind milling and locked case. The rules of thumb for different hydrodynamic subjects are very useful at the beginning of a project, because they give a rough idea of the critical points and help the designer to concentrate carefully on the correct and most important subjects. They can also help to make good compromises. With cruise liner concepts, the most important rules concern the propeller loading, tip speed of the propeller, erosion, aft body slamming and swinging. Some general information and rules of thumb regarding hull lines design (WDA), propeller loading, flow direction and breadth draught ratio (B/T) effects are presented in the authors’ earlier papers. (Hämäläinen R., 1998). The most ECO-efficient is to put attention to ship hull form and its appendages under water and also its aerodynamic resistance. Generally we can say that by energy saving devices you could not get huge savings if hull form, propeller and appendages have been optimized well. In bad hull and appendage case can give bigger fuel saving.
56

There are variable amount of appendages in twin or triple screw ships, which increase the resistance of the ship such as rudders, shafts, bossing, shaft struts, stabilizers, thruster openings etc. The appendage’s resistance amounts from 7 to 15 % of the bare hull resistance at lower ship speed and from 10 to 20 % at higher ship speeds. These values are mainly generated by the propulsion appendages in conventional shaft arrangement. The other remarkable thing, which is effecting to needed power and fuel economy, is propulsion system and specially its interaction with the hull and appendages. Today RANS based CFD together with model tests are common tools to look for the highest propulsion efficiency to the whole project. The propulsion efficiency (ηO) can be defined when open water characteristics are measured during open water test and when both thrust (T) and torque (Q) are measured during propulsion tests (ηD): ηD = PE/PD = (RT•VS)/(2•π•n•Q) = (1-t) / (1-WT) • (T•VA) / (2•π•n•Q) • QO/QP = ηH • ηO • ηR WT = 1- VA / VS t = (T-(RT-FD)) / T WT is the wake fraction, t is thrust deduction and FD is towing force compensating for the differences in model and full-scale frictional coefficient.. The wake fraction has been defined by using the difference between the total velocity with operating propeller and the propeller-open water induced velocities. WT = 1 - JO / JP The propeller’s thrust measured during the model tests is not equal to the resistance, due to the fact that the propeller is working in water flow in different directions. This water flow generates low pressure in aft body, which effect against sailing direction. In a twin screw vessel, a larger propeller diameter results in a decrease t and WT values. The shaft struts and shaft tube effect the wake quite high but and has a minor effect to the trust deduction. The rotation efficiency describes normally how suitable the propeller is to the hull and its flow field. More homogenous flow and vortex effect to the values of the rotation efficiency. The general type of explanation which is normally given to the interaction coefficients: thrust deduction
fraction (t), wake fraction WT and relative rotation efficiency ηR, is based on the interaction of the propeller with the hull. The thrust deduction fraction is explained as an extra resistance of the hull, the wake fraction as a displacement and viscous effect of the hull and the rotation efficiency as a factor influenced by the irregular flow field behind the hull. It is noticed that there is a rudder effect on the interaction coefficients. The water in the propeller slipstream is rotating, which is a loss of energy because the rotating motion contains kinetic energy that is transmitted from the propeller into the wake of the vessel. If the rudder is located directly in the propeller slipstream, it can recover part of the rotational energy. The amount of energy that is recovered by the rudder is dependent on the rudder profile form, aspect ratio and rudder location . Before to look more detailed way devices for energy savings it is important to know how energy is going to different items as shown in Figure 3.
Figure 3. Energy to different items (Power/v^3): flat plate, form effect and roughness, appendages, transom immersion, waves, propulsive efficiency, cavitation influence The purpose is to reach the lowest resistance to the selected main dimensions, which fulfill needs of the shipyard’s client. Different limits to main dimensions and forms effect operation things, speed, route, ports, maximum draught etc. Ship resistance can be divided in many ways as shown in Figure 4.
57

Figure 4. Power/V^3 acc. to speed. From top efficiency, air resistance, wave resistance, appendage resistance and friction resistance to modern conventional propulsion cruise liner
The resistance of the fore body is mainly wave resistance and the resistance of the aft body is mainly viscous resistance (friction and pressure resistance). Viscous resistance is made up of two components: frictional and pressure resistance.
VISCOUS RESISTANCE
Frictional resistance is mainly generated due to the setting up of shear stresses in the fluid and the consequent formation of a velocity gradient. In order to reduce frictional resistance for a given speed the product of frictional coefficient and wetted surface must be reduced. This is possible only by making the surface smoother or increasing Reynolds number (longer body or higher speed). In order to reduce the pressure resistance (form factor) it is necessary to reduce the loss of static head to a minimum. This in turn implies a reduction in the momentum loses in the boundary layer (=acceleration of flow and separation). The viscous resistance can be divided to pressure and friction resistance. At low Froude number the viscous resistance is remarkable. The pressure resistance is bigger at full block ships and its effect is big specially in aft part of ship. Different hull forms are not effecting so much to the frictional resistance if wetted surface is constant, therefore frictional resistance reduction has to be carried out e.g. by changing main dimensions in order to reduce wetted surface. For example the designer knows that in twin skeg hull form the wetted surface is bigger than in buttock flow twin screw ship and in the tunnel shape wetted surface is bigger than in no tunnel form aft body. The hull roughness has significant effect to the frictional resistance and via fuel consumption. The hull roughness can be divided to two parts: material and biological.
The coatings are developing rapidly. Today paints are developed to reduce frictional resistance and prevent fouling. By the modern day coating about 2-3 % fuel savings are possible in new building ship in delivery situation depending on ship type. These figures are much lower than numbers in general articles and coating producer’ advertisements. Today almost in all ships smoothed welding seams are wanted to reach some power savings. This has done specially to the fore body welding seams where boundary layer is the thinnest and that’s why it is the most important part of the hull. The welding seams effect to saving are about 2 – 3 %, when 30 % and 60 % smoothing are looked. The steel plate straightness has same effect than in welding seams. There are a lot of information on air lubrications. It can be micro-bubble type, air layer type or air cavity type. There is a lot of controversial information on power savings. Most likely about 3- 7 % savings are possible if it is possible to keep air layer in the hull surface. This is for typical cruise liners. The savings can be bigger for special type of catamaran vessels where air cavity system are used or in big tanker with huge flat bottom area as shown in Figure 5.
Figure 5. Air layers in the flat bottom of tanker WAVE RESISTANCE
Wave resistance is important when Fn>0.15. A typical wave resistance curve is shown in figure 6 with the typical ranges for the various ship types indicated (Holtrop J., 1993). Both the resistance and the non-dimensional resistance curves are shown as a function of the Froude number. The magnitude of the non-dimensional wave resistance depends on the main dimensions, the form coefficients and the shape of the hull form. Most notable is the main hump at a Froude number of Fn=0.5.
58

At the speeds corresponding to a Froude number of 0.25 the wave resistance is quite important. Splashing, breaking and some spray at the bow are usually present. Interference of the bow and stern waves becomes important at Froude numbers of about 0.3. At this speed a significant unwanted interference hump on the resistance curve is often found. The transverse waves carry a large part of the energy away. At Froude numbers greater than 0.4 the wave length becomes in the order of the length of the ship. This results in a sharp increase of the wave resistance beyond this speed towards the main hump. The ship is sailing at hull speed when Fn=0.4. In this case ship fore and aft bodies are in hump wave and wave length is equal with ship’s length.
Figure 6: Wave resistance as a function of Fn In the following Table 1 a typical amount of wave resistances for the different vessel types is shown. Table 1: Percentage of wave resistance and appendage resistance from total resistance
Type of vessel
Tanker Cruise Liner
Fast Ropax
Navy Frigate
Wave resistance
5- 15% 15-30% 30-40% 60%
Appendage resistance
1 -10% 4-17% 7-20% 7-15%
Speed 14-20 kn 18-26 kn 25-32 kn 25-45 knFn 0.2 0.25 0.35 0.5 Today CFD RANSE tools are suitable to reduce wave resistance to minimum and they can estimate very accurately even transom wave systems. In the following figure 7 is transom wave comparison between model tests and CFD-calculations.
-
Figure 7. Calculated transom wave in above part and measured in model scale in lower part
DUCKTAIL AND INTERCEPTOR
For vessels sailing at higher Froude number (Fn = 0.23 to 0.30), it is nowadays recommended to increase the length of the aft body. Today very typical way is to use a so called ducktail without increasing the overall length of the ship. Using a ducktail is an effective way to reduce the height of the transom wave pattern behind the transom and to improve the trim of the vessel. In addition to the ducktail, nowadays an interceptor plate (straight plate at the transom to generate more lift) is often used (see figure 8) . Trim wedges, having the same principle than interceptor plates, are not any more so popular than earlier, because an interceptor plate is easier to fit on.
Figure 8. Operation principle of an interceptor plate
Determination of the optimum height of the
interceptor plate is very often done by means of model tests (propulsion tests). During these tests, a range of ship speeds with different heights of the interceptor plate are tested. It is important to measure the required power, to measure the trim and sinkage and to observe the behavior of the wave pattern behind the transom by means of video recordings. A more accurate method nowadays is to measure the height of the waves behind the transom at various locations by means of acoustic transducers. Sometimes a variation of the width and the shape of
59
the interceptor plates are investigated too.
An important subject to further investigate, are the scale effects. The thickness of the boundary layer in the aft body is effecting the optimum height of the interceptor determined during model experiment and the optimum height to be used on the real ship. Viscous flow computations by means of MARIN’s code PARNASSOS have learned that the optimum height of the full-scale amounts approximately 0.7 * height model * model scale
For large cruise vessel, power savings of 10 per cent have been reached for a ducktail / interceptor combination. 4 per cent by ducktail only and an additional 6 per cent by the interceptor plate. Generally we can say that combination of ducktail and interceptor can save about 3 -12 % in power and the effects are significantly are varying of the speed range. In some cases big wedge angle with S-buttock form is better than straight buttocks with interceptor. The highest advantages are possible to reach in fast and medium speed vessels. Typical application can be shown in Figure 9.
Figure 9. Example of a long ducktail with an interceptor plate fitted to a large cruise liner.
THE BULBOUS BOW
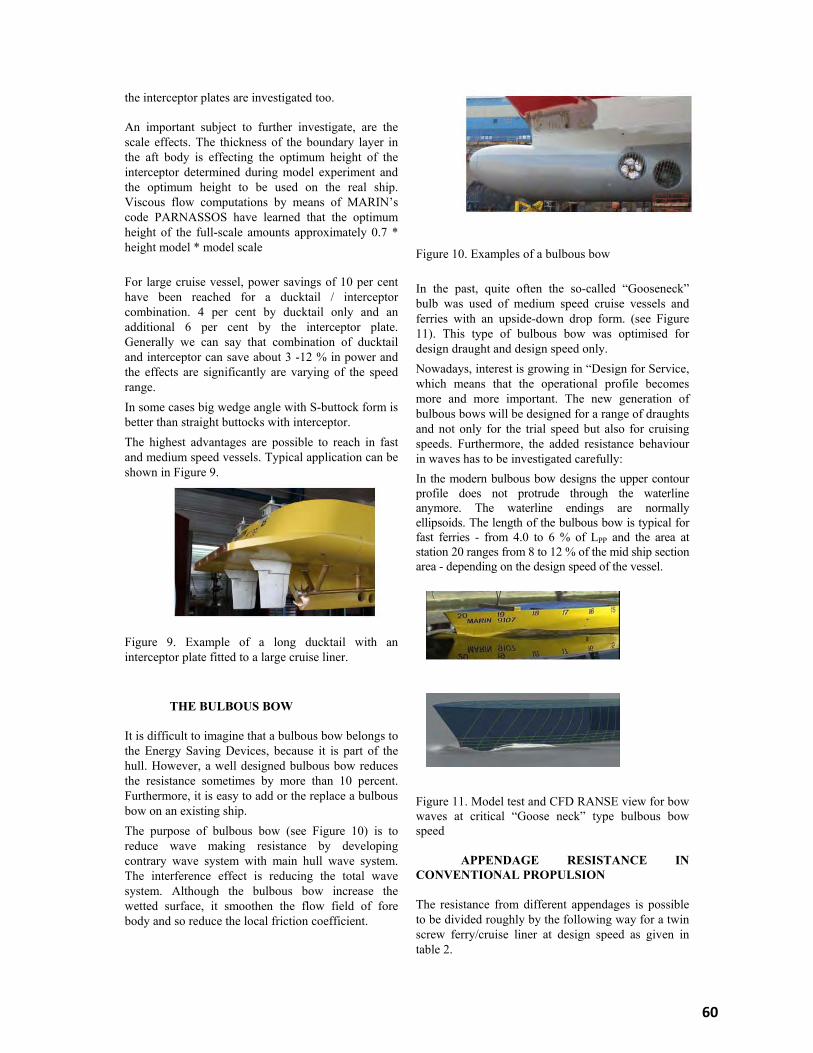
It is difficult to imagine that a bulbous bow belongs to the Energy Saving Devices, because it is part of the hull. However, a well designed bulbous bow reduces the resistance sometimes by more than 10 percent. Furthermore, it is easy to add or the replace a bulbous bow on an existing ship. The purpose of bulbous bow (see Figure 10) is to reduce wave making resistance by developing contrary wave system with main hull wave system. The interference effect is reducing the total wave system. Although the bulbous bow increase the wetted surface, it smoothen the flow field of fore body and so reduce the local friction coefficient.
Figure 10. Examples of a bulbous bow
In the past, quite often the so-called “Gooseneck” bulb was used of medium speed cruise vessels and ferries with an upside-down drop form. (see Figure 11). This type of bulbous bow was optimised for design draught and design speed only. Nowadays, interest is growing in “Design for Service, which means that the operational profile becomes more and more important. The new generation of bulbous bows will be designed for a range of draughts and not only for the trial speed but also for cruising speeds. Furthermore, the added resistance behaviour in waves has to be investigated carefully: In the modern bulbous bow designs the upper contour profile does not protrude through the waterline anymore. The waterline endings are normally ellipsoids. The length of the bulbous bow is typical for fast ferries - from 4.0 to 6 % of LPP and the area at station 20 ranges from 8 to 12 % of the mid ship section area - depending on the design speed of the vessel.
Figure 11. Model test and CFD RANSE view for bow waves at critical “Goose neck” type bulbous bow speed
APPENDAGE RESISTANCE IN CONVENTIONAL PROPULSION
The resistance from different appendages is possible to be divided roughly by the following way for a twin screw ferry/cruise liner at design speed as given in table 2.
60

Table 2. The resistance for different appendages.
Propulsion devices: rudders, headboxs, shaft, struts etc
8 - 12 %
Stern thrusters: 1-2 units 1-2 % Bow thrusters: 1-3 units 2 - 6 % Stabilizers: 1 pair 0.5 – 1.5 %
According to the table, appendage resistance to conventional arrangement is about 10 – 20 %. By adding tight grids to bow thruster tunnels, it is possible to reduce opening resistance by 1 % per opening. Generally we can say that the thruster opening in aft CL-skeg increase resistance by 0.6 % without grids. The grids have marginal effect to drag in aft CL-skeg opening. In Figure 12 different ships’ appendage resistances in per cents are shown.
Figure 12. The appendage resistance per cent for modern twin screw ships when speed is increasing.
SIDE THRUSTERS
The drag of the side thrusters is part of appendage resistance. Very important role here is playing the location of the tunnel and thruster corner form in hull design. The thruster openings in the bulbous bow have a smaller resistance effects than to the thrusters, which locate in big water line angle area without bulbous bow form effect. The tight grids reduce the opening drag by improving water flow around it. For bow thrusters in bulbous bow region the drag is: +2 % per opening without grids +1 % per opening with tight grids In the figure 13 is tight grid opening in CFD calculation without connection grids.
Figure 13. Tight grids in 3 tunnel openings In stern thruster openings the grids have marginal effects to drag. In Figure 14 is CFD calculation results for two stern thruster openings. See importance of aft corners in the tunnels.
Figure 14. Stern thruster openings without grids in CFD calculations
STABILIZER RECESS
The stabilizer opening direction: forward direction opening or aft direction opening stabilizer recess is playing very important role. When stabilizer is aftwards opening type, its resistance is higher than in the other type, because opening is more open to flow. The location of the opening has big effect: if it is frontside of midship location, its resistance increase compared to case where it is in aftside of mid ship frame. The scallop is improving the situation in many cases in trailing edge of the opening when it locate in mid ship part or in front of mid ship part. Typical forward and afterward opening systems are shown in Figure 15 and 16 respectively.
Figure 15. Forward opening type, where cover plate
61

Figure 16. Aftwards opening type without recess
Typical resistance values for stabilizer openings are: 0.5 (Figure 15) – 1.5 (Figure 16) % in contributing to the appendage resistance. It can be even 7 % in the worst longitudinal location (e.g. in front of fore shoulder).
CL-SKEG AND HEADBOX DESIGN
The CL skeg is needed for docking purposes, for enough course stability and roll damping. These skeg dimensions are also used to add extra volume in order to reach optimum volume distribution. However, strong attention should be paid to interaction effects with other appendages and free water surface. Enough distance is needed between skeg and propeller The leading edge of skeg (not connected to flat bottom) should be designed carefully to avoid vortices. (standard leading edge section). The trailing edge of the skeg should follow also normal profile design to avoid flow separations.
The CL skeg can be made thinner in pod aft body, since there is no need to fit the stern thrusters. Lengthening the skeg will increase the wetted area but the directional stability is also increased. The skeg should not be made too long to avoid blocking of the flow from the propellers during the harbour manoeuvring. The docking loads should also be taken into account when considering the length of the skeg. Rounding of the connection of the skeg and the hull will decrease resistance about 1-3%, but increase building costs.
The headbox at the connection of the pod to the hull should be made as small and smooth as possible to minimize resistance. In some cases the rotation axis of pod has been inclined (e.g. four degrees) perpendicular to the hull in order to avoid the headbox
In Figure 17 a well streamlined headbox is shown. The resistance effect amounts 0.5 %. A small, round headbox acc. to pod cylinder part as presented in figure 18 gives resistance increase from 0.5 to 1.5 %.
Figure 17. Well streamlined headbox
Figure 18. Small, round headbox
Big headbox gives resistance increase from 1 to 2 %. This headbox is used also ice protection purposes as shown in Figure 19.
Figure 19. Big headbox above flap type rudder with ice knife.
SHAFT LINE DESIGN
The shaft line, brackets, and bossing play a very important role, because they have a major effect on aft appendage resistance and the wake field. The wake field is the most important source of propeller-hull excitations. The advantages of pod propulsion are coming from optimum, the best possible wake field with excellent tangential wake components and small aft appendage resistance.
62

The shaft line direction, in waterline section, should be converging to aft, but a shaft line parallel to the centreline is also good. Diverging shaft lines generate a bigger shadow of shaft into the wake field and its drag increase also. The angle between flow-line (buttock line) and shaft-line should be less than 20 degrees in a profile view. The propeller and shaft line hull section distance should be more than 3.2×Dp. The shaft length, shaft coupling size, and bossing construction have a large effect on a shaft bossing dimensions. The strength and vibration analysis defines bearing locations. The critical whirling frequencies are kept outside the operating RPM-range. This is achieved by spacing the supporting bearings. The first critical mode normally affects the aft part of the shafting. An I-bracket should be at least 0.9×Dp distance separated from the bossing. In closer situations, it is better to use a longer bossing and to remove the I-bracket. The shaft arrangement without bossings is also seen today and there SKF is inside the local shaft enlargement. This arrangement can be quite beneficial for the wake field. Typically aft appendages (propulsion devices, rudders, headboxs, struts etc.) correspond 8 -12 % of total resistance.
Propeller distance from CL should be at least 98% of propeller diameter depending on CL skeg size in order to avoid bad interaction effects.
In the figure 20, we can see modern high comfort class appendages for twin screw vessel. In this type of arrangements long shaft lengths are normally used. The shaft length is typically 21 – 24 m.
The distance between the propeller plane and the protrusion of the shaft through the hull is almost 6 times the propeller diameter. It is noticed that the axial wake peak amounts to about 27% at the 0.7 R and tangential velocity component about 11%.
Figure 20. Modern aft appendages in high comfort class cruise ferry The circumferential distribution of the axial wake component is quite normal for this type of vessel. Only a small wake peak is visible in the area behind the outer struts of the V-brackets. The long shaft tube generates typical shaft shadow above propeller hub. The bossing is far enough to generate deep wake peak. The outer strut’s small effect in wake field can be seen in Figure 21.
Figure 21. Axial wake for modern Ferry Today by CFD RANSE the designer can evaluate quite easy way different alternatives to his project by calculating wake and drag to different designs. The designer can see quite quickly the best possible compromise to his project. The calculations are very accurate and the designer can evaluate also full scale results. The propeller maker can use these results for propeller design as shown in Figure 22 and 23..
63

Figure 22. CFD RANSE calculation for shaft line arrangement
Figure 23. CFD results to ship’s axial wake
RUDDER AND STRUT
If the vessels are sailing at speeds of 22 knots and higher with the rudder located in the propeller slipstream, and if the propeller loading defined by P/(Dp2*π/4) is higher than 700 kW/m2, the risk of rudder/pod arm cavitation will occur (Hämäläinen R. 1998).Rudder cavitation erosion is of interest only if it happens within the range of rudder angles δ = ± 5 deg. used for course keeping.
Rudder location variations
The longitudinal location of the rudder has interaction effect with propeller and hull as typically shown in Figure 24. The optimum location can be about 1 – 2 % better than original location selection.
Figure 24. Longitudinal rudder location alternatives
PRE-SWIRL STATOR
The main objective of the design of the pre-swirl
stator and propeller will be to optimize the propulsive efficiency of the propeller-stator combination. The idea is to reduce the rotational losses incurred by the
propeller.
- - - Figure. 25: blade stator in twin screw ship
Hydrodynamic aspects The blades of the pre-swirl stator mainly induce circumferential velocities (swirl) in front of the propeller. Thereafter, the pre-swirl flow is neutralized by the propeller induced velocities which means that less kinetic energy remains. However, efficiency gains due to this stator are not only from recovery of rotation energy but also from reduced friction drag (smaller optimum propeller diameter). Design procedure The design procedure of a pre-swirl stator can be divided in three steps. The first step is the preliminary design using lifting-line model, resulting in a selection of diameter, loading distribution and blade area of the of pre-swirl stator and propeller The next step in the design will be the analysis and systematic variation using unsteady BEM. A propeller cavitation analysis will be done and thereafter the final design variant will be selected Finally a verification with a viscous flow solver the identification of scale effects in model experiments will be carried out. Final remarks Pre-swirl stators can potentially bring a substantial energy saving of up to 5% for both single as well as twin-screw ships. Pre-swirl stators could be practically be integrated with other ship appendages such as shaft brackets and upstream nozzles In case only 2 struts are used for the pre-swirl stator design a gain of approximately 2 per cent could be expected. Since serious scale effects on the performance of stators on model scale should be reckoned with a
64
strict geometrical similarity might have to be sacrificed.
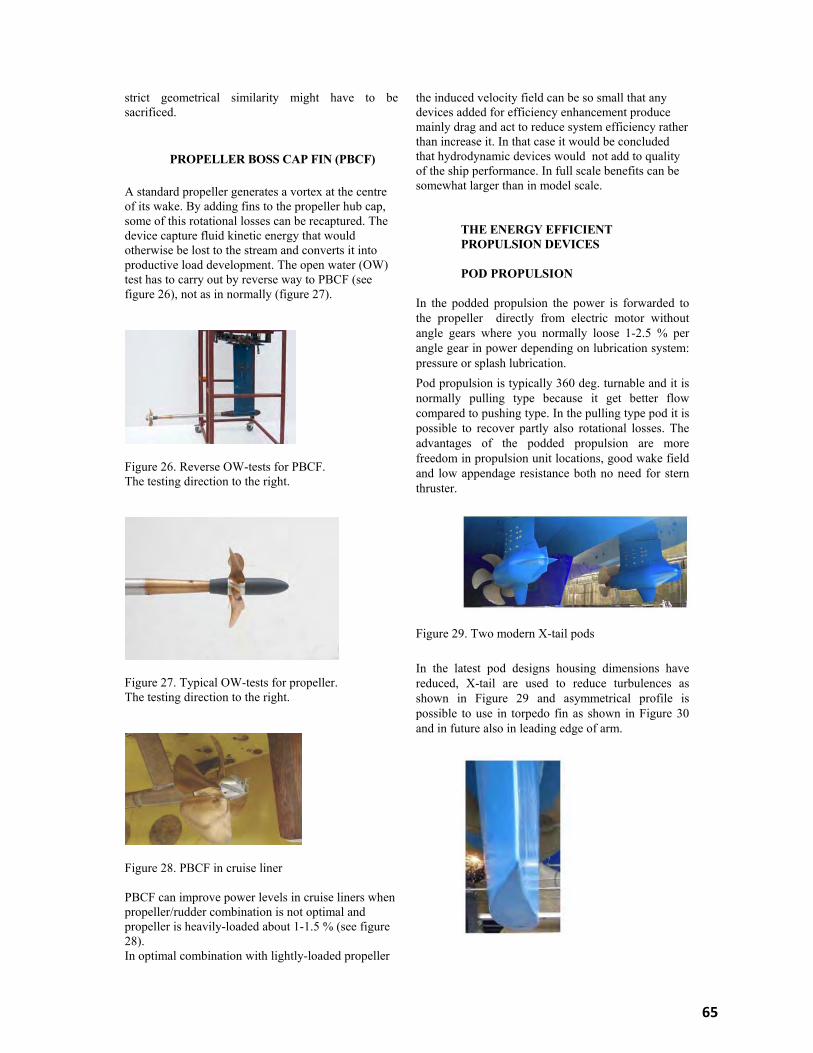
PROPELLER BOSS CAP FIN (PBCF) A standard propeller generates a vortex at the centre of its wake. By adding fins to the propeller hub cap, some of this rotational losses can be recaptured. The device capture fluid kinetic energy that would otherwise be lost to the stream and converts it into productive load development. The open water (OW) test has to carry out by reverse way to PBCF (see figure 26), not as in normally (figure 27).
Figure 26. Reverse OW-tests for PBCF. The testing direction to the right.
Figure 27. Typical OW-tests for propeller. The testing direction to the right.
Figure 28. PBCF in cruise liner PBCF can improve power levels in cruise liners when propeller/rudder combination is not optimal and propeller is heavily-loaded about 1-1.5 % (see figure 28). In optimal combination with lightly-loaded propeller
the induced velocity field can be so small that any devices added for efficiency enhancement produce mainly drag and act to reduce system efficiency rather than increase it. In that case it would be concluded that hydrodynamic devices would not add to quality of the ship performance. In full scale benefits can be somewhat larger than in model scale.
THE ENERGY EFFICIENT PROPULSION DEVICES
POD PROPULSION
In the podded propulsion the power is forwarded to the propeller directly from electric motor without angle gears where you normally loose 1-2.5 % per angle gear in power depending on lubrication system: pressure or splash lubrication. Pod propulsion is typically 360 deg. turnable and it is normally pulling type because it get better flow compared to pushing type. In the pulling type pod it is possible to recover partly also rotational losses. The advantages of the podded propulsion are more freedom in propulsion unit locations, good wake field and low appendage resistance both no need for stern thruster.
Figure 29. Two modern X-tail pods
In the latest pod designs housing dimensions have reduced, X-tail are used to reduce turbulences as shown in Figure 29 and asymmetrical profile is possible to use in torpedo fin as shown in Figure 30 and in future also in leading edge of arm.
65
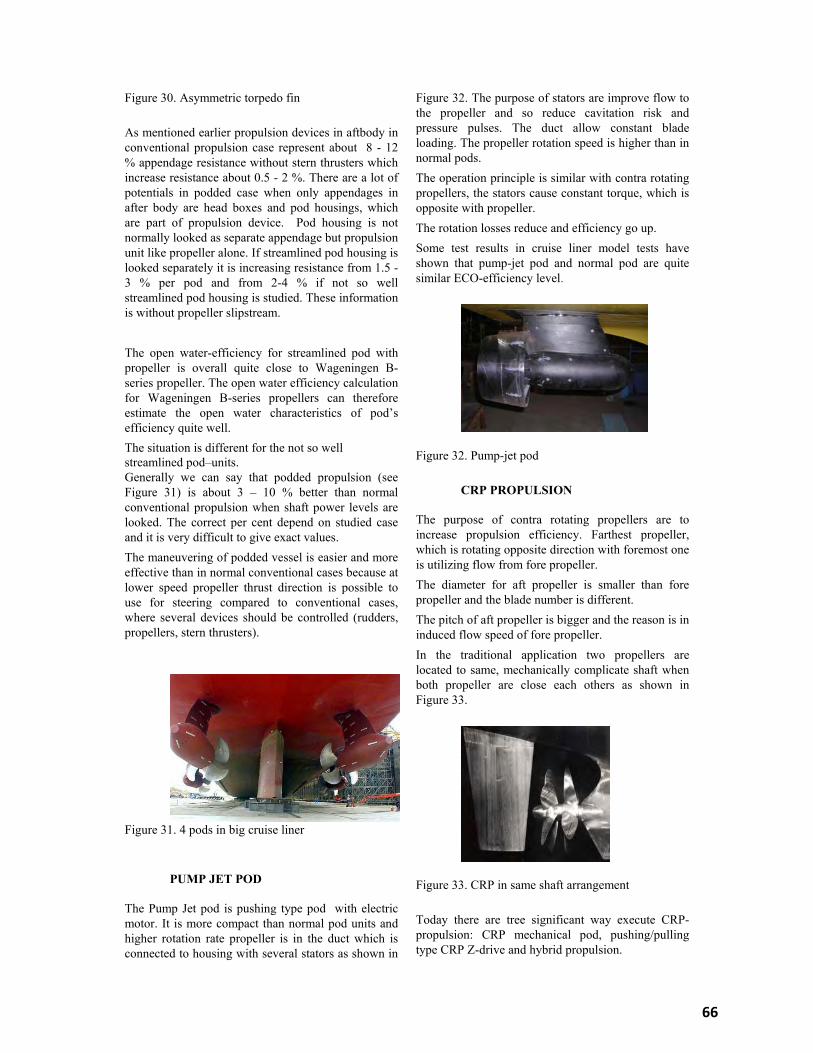
Figure 30. Asymmetric torpedo fin
As mentioned earlier propulsion devices in aftbody in conventional propulsion case represent about 8 - 12 % appendage resistance without stern thrusters which increase resistance about 0.5 - 2 %. There are a lot of potentials in podded case when only appendages in after body are head boxes and pod housings, which are part of propulsion device. Pod housing is not normally looked as separate appendage but propulsion unit like propeller alone. If streamlined pod housing is looked separately it is increasing resistance from 1.5 - 3 % per pod and from 2-4 % if not so well streamlined pod housing is studied. These information is without propeller slipstream. The open water-efficiency for streamlined pod with propeller is overall quite close to Wageningen B-series propeller. The open water efficiency calculation for Wageningen B-series propellers can therefore estimate the open water characteristics of pod’s efficiency quite well. The situation is different for the not so well streamlined pod–units. Generally we can say that podded propulsion (see Figure 31) is about 3 – 10 % better than normal conventional propulsion when shaft power levels are looked. The correct per cent depend on studied case and it is very difficult to give exact values. The maneuvering of podded vessel is easier and more effective than in normal conventional cases because at lower speed propeller thrust direction is possible to use for steering compared to conventional cases, where several devices should be controlled (rudders, propellers, stern thrusters).
Figure 31. 4 pods in big cruise liner
PUMP JET POD
The Pump Jet pod is pushing type pod with electric motor. It is more compact than normal pod units and higher rotation rate propeller is in the duct which is connected to housing with several stators as shown in
Figure 32. The purpose of stators are improve flow to the propeller and so reduce cavitation risk and pressure pulses. The duct allow constant blade loading. The propeller rotation speed is higher than in normal pods. The operation principle is similar with contra rotating propellers, the stators cause constant torque, which is opposite with propeller. The rotation losses reduce and efficiency go up. Some test results in cruise liner model tests have shown that pump-jet pod and normal pod are quite similar ECO-efficiency level.
Figure 32. Pump-jet pod CRP PROPULSION
The purpose of contra rotating propellers are to increase propulsion efficiency. Farthest propeller, which is rotating opposite direction with foremost one is utilizing flow from fore propeller. The diameter for aft propeller is smaller than fore propeller and the blade number is different. The pitch of aft propeller is bigger and the reason is in induced flow speed of fore propeller. In the traditional application two propellers are located to same, mechanically complicate shaft when both propeller are close each others as shown in Figure 33.
Figure 33. CRP in same shaft arrangement
Today there are tree significant way execute CRP-propulsion: CRP mechanical pod, pushing/pulling type CRP Z-drive and hybrid propulsion.
66
Dual-End CRP
This propulsion unit is mechanical and 360 degrees turn able device as shown in Figure 34. -
Figure 34. Dual-End CRP Pod Dual-End CRP is about 10 per cent better than normal conventional propulsion case when propellers are heavily loaded. Main reasons for differences are better propulsion efficiency and smaller appendage resistance. Dual-End CRP is about 3 per cent better than normal podded case in shaft power. In CRP case angle gears losses and in podded case ventilation cooling losses should take into account when total power are compared. This type of propulsion is suitable also for high speed and ice going vessels. Its maneuvering ability is close podded case.,
CRP mechanical Z-drive
Figure 35. CRP X-drive
This propulsion unit is mechanical and 360 degrees turn able device. There are two angle gears to transfer power to the propellers. Power saving about 7 – 10 %. This type of device is normally suitable for lower speeds as shown in Figure 35.
Hybrid CRP propulsion in ferry
In this hybrid propulsion case DM conventional CPP propeller in gondola form is connected DE turnable FPP pod unit.
Figure 36. Conventional twin screw and
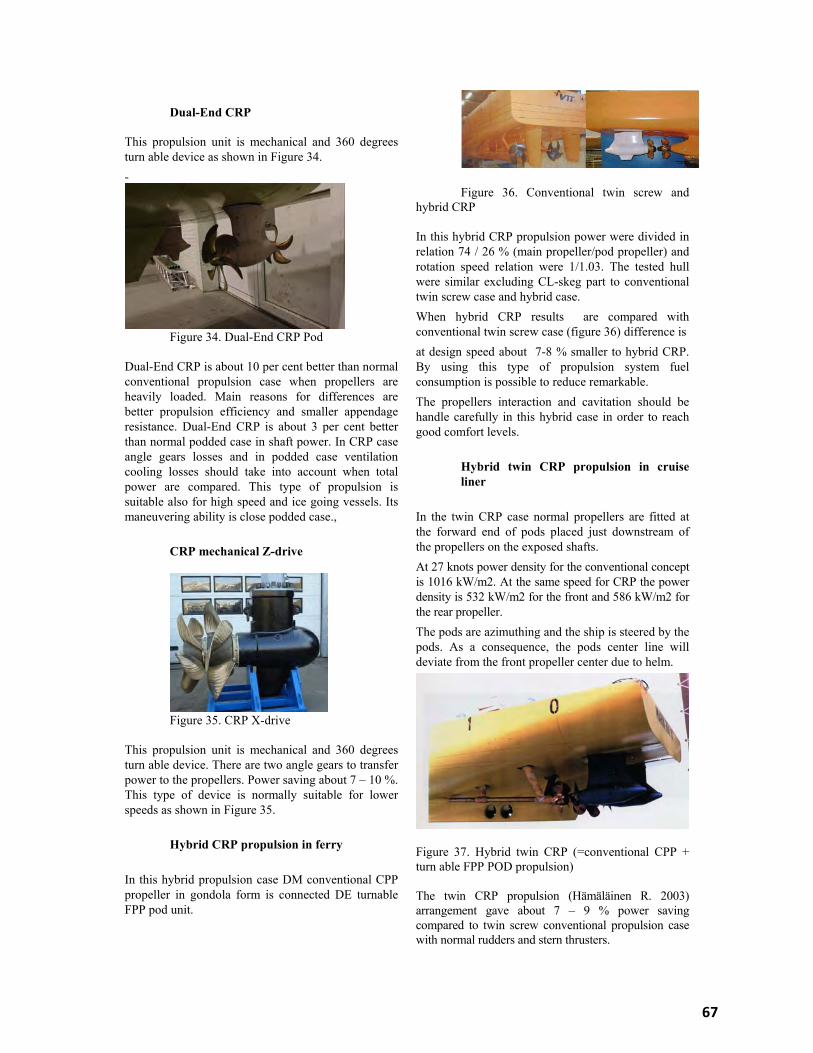
hybrid CRP
In this hybrid CRP propulsion power were divided in relation 74 / 26 % (main propeller/pod propeller) and rotation speed relation were 1/1.03. The tested hull were similar excluding CL-skeg part to conventional twin screw case and hybrid case. When hybrid CRP results are compared with conventional twin screw case (figure 36) difference is at design speed about 7-8 % smaller to hybrid CRP. By using this type of propulsion system fuel consumption is possible to reduce remarkable. The propellers interaction and cavitation should be handle carefully in this hybrid case in order to reach good comfort levels.
Hybrid twin CRP propulsion in cruise liner
In the twin CRP case normal propellers are fitted at the forward end of pods placed just downstream of the propellers on the exposed shafts. At 27 knots power density for the conventional concept is 1016 kW/m2. At the same speed for CRP the power density is 532 kW/m2 for the front and 586 kW/m2 for the rear propeller. The pods are azimuthing and the ship is steered by the pods. As a consequence, the pods center line will deviate from the front propeller center due to helm.
Figure 37. Hybrid twin CRP (=conventional CPP + turn able FPP POD propulsion) The twin CRP propulsion (Hämäläinen R. 2003) arrangement gave about 7 – 9 % power saving compared to twin screw conventional propulsion case with normal rudders and stern thrusters.
67

Hybrid triple propeller cruise liner Passenger comfort, operational safety and efficiency were the main targets in the hydrodynamic design of the world’s largest cruise liners. The multi Pod propulsion concept gives many additional benefits over a classical twin propeller system. Triple Podded propulsion makes the comfort classes of the classification societies easier to reach and their redundancy is higher. Typical alternative has been earlier one fixed pushing type pod and two turn able pulling pods as shown in Figure 38.
. Figure 38. Hybrid Cruise Liner: pushing type Fixipod and two pulling type Pods
When size are increased even more, triple pulling pod alternative is given more benefits than hybrid alternative with standard pods with higher efficiency and stronger steering capacity as shown in Figure 39.
Figure 39. 3 pulling pods in big cruise liner
CONCLUSION With careful appendage and propulsion design a lot of fuel saving is possible to reach. With the aid of CFD tools, new hull form concepts can be developed prior to the model-testing phase of a project. Today’s routine CFD tools are very helpful when optimal appendages are looked together with wake field and power information. These tool helps younger designers to increase hydrodynamics understanding and helps to concentrate to the most important aspects in hydrodynamic design where designer has to do many compromises.
Many practical ESD are available for twin/triple screw vessels. They can be helpful if optimal design is not possible to reach with normal way. The Hybrid concept is very interesting, because it possess a lot of benefits compared to normal often used cases. The power savings give a lot of abilities to compete better in the hard Ropax market in the future. Passenger comfort, operational safety and efficiency were the main targets in the hydrodynamic design of the world’s largest cruise liner. The multi Pod propulsion concept gives many additional benefits over a classical twin propeller system. Triple Podded propulsion makes the comfort classes of the classification societies easier to reach.
REFERENCES
Holtrop, J., “Introduction to hull form design”. Training course on CFD in hull form design, 1993. Hämäläinen R. and Heerd J., “Hydrodynamic development for a large fast monohull passenger ferry”, The Society of Naval Architects and Marine Engineers, Nov. 1998. Hämäläinen R. and Heerd J., “The Wave Damping Aftbody Revolutionizes Aftbody Design In All Types Of Fast Vessels”, IMAM 2000. Hämäläinen R. and Heerd J., “Wave Damping Aftbody with hybrid podded propulsors”, SNAME 2003.
68