energy saving concepts for the european ceramic...
TRANSCRIPT

EIE/06/222/SI2.444565 CERAMIN – Public Final Report
KI Keramik-Institut GmbH, Ossietzkystr. 37a, D-01662 Meißen 18.12.09
1
Supported by
Energy saving concepts for the European ceramic industry
CERAMIN
Public Final Report
written by KI Keramik-Institut GmbH
Rüdiger Köhler
Legal disclaimer The sole responsibility for the content of this publication lies with the authors. It does not necessarily reflect the opinion of the European Communities. The European Commission is not responsible for any use that may be made of the information contained therein.
Contract number
EIE/06/222/SI2.444565

EIE/06/222/SI2.444565 CERAMIN – Public Final Report
KI Keramik-Institut GmbH, Ossietzkystr. 37a, D-01662 Meißen 18.12.09
2
Table of Contents
Basic project data ............................................................................................................ 5
Executive summary ......................................................................................................... 6
0 Introduction ......................................................................................................... 8
1 Energy consumption figures of different ceramic branches and EU-countries .. 11
1.1 Procedure for data collecting and data from the partner -countries .................. 11
1.2 Energy consumption figures - United Kingdom ................................................. 12
1.3 Energy consumption figures - Poland ............................................................... 14
1.4 Energy consumption figures - Italy .................................................................... 15
1.5 Energy consumption figures - Germany ............................................................ 16
1.6 Energy consumption figures - Spain ................................................................. 18
1.7 Energy consumption figures - France ............................................................... 19
1.8 Energy consumption figures - Austria, Netherlands, Portugal and further
countries ........................................................................................................... 19
1.9 Summery of European Energy consumption in the ceramic industry divided into
sub branches .................................................................................................... 20
2 Judgement of existing labels supporting low energy consumption in relation to
the “Triple-E-Label” ........................................................................................... 23
2.1 Existing labels - ECO-Label .............................................................................. 25
2.2 Existing labels - Energy Star ............................................................................. 26
2.3 Existing labels - European Union energy label ................................................. 27
2.4 Existing labels - The European Energy Trophy ................................................. 28
2.5 Existing labels - KlimaHaus/CasaClima ............................................................ 30
2.6 Summary about existing labels ......................................................................... 31
3 The CERAMIN-Label: Characteristics, awarding and verification procedures .. 32
3.1 Course of data collection at each national partner ............................................ 32
3.2 Rules for calculation from collected data .......................................................... 34
3.3 Rules for awarding ............................................................................................ 35
3.4 Verification of data ............................................................................................ 35
4 Results of the championship ............................................................................. 36
5 Tutorial about energy saving ............................................................................. 40

EIE/06/222/SI2.444565 CERAMIN – Public Final Report
KI Keramik-Institut GmbH, Ossietzkystr. 37a, D-01662 Meißen 18.12.09
3
6 Individual final reports from the partner countries ............................................. 41
7 Summary .......................................................................................................... 42
8 Prospect, „Triple-E-Label” awarding from 2010 to 2015 ................................... 43
Annex 1: Data to be collected from companies, who wants to apply for one of the
„Triple-E-Labels” ............................................................................................... 45
Annex 2: Verification questionaire ................................................................................. 47
Annex 3: Results of data collection of energy consumption .......................................... 51
Annex 4: Example of a Certificate ................................................................................. 54
Annex 5: Chapter “Masonry bricks” as example of “Tutorial about energy saving” ........ 55
Annex 6: Short final report by CERAM – United Kingdom ............................................. 61
Annex 7: Short final report by Institute of Glass, Ceramics, Refractory and Construction
Materials – Poland ............................................................................................ 64
Annex 8: Short final report by ETA – Italy ...................................................................... 69
List of Tables
Table 1: Project-Partner data ........................................................................................ 5
Table 2: Different use of the European decree about CO2-trading in the partner -
countries ....................................................................................................... 12
Table 3: Number of companies per branch and country that take part in the CERAMIN
project until 31.10.2009 ................................................................................ 36
Table 4: Companies with lowest absolute energy consumption and largest energy
mitigation per ceramic sub branch. ............................................................... 37
Table 5: Winners of CERAMIN ................................................................................... 39
List of Pictures
Picture 1: Energy consumption of the ceramic industry in the UK in 2002-2006........... 13
Picture 2: Number of enterprises of British ceramic industry in 2002-2006 .................. 13
Picture 3: Energy consumption of Polish ceramic sub branches in 2005 ...................... 14
EIE/06/222/SI2.444565 CERAMIN – Public Final Report
KI Keramik-Institut GmbH, Ossietzkystr. 37a, D-01662 Meißen 18.12.09
4
Picture 4: Energy consumption in some Italian ceramic sub branches 2002-2004 ....... 15
Picture 5: Number of German ceramic companies, divided into sub-branches............. 17
Picture 6: Energy consumption of German ceramic companies, divided into sub-
branches ....................................................................................................... 17
Picture 7: Energy consumption of Spanish ceramic companies, divided into sub-
branches ....................................................................................................... 18
Picture 8: Energy consumption of French ceramic companies, divided into sub-
branches ....................................................................................................... 19
Picture 9: Energy consumption of European ceramic industries sub branches ............ 21
Picture10: Energy consumption and number of ceramic enterprises of different EU-
countries (calculated from CO2-emissions) .................................................. 22
Abbreviations
CERAMIN Acronym of the Project
EEE Extraordinary Energy Efficient OR Energy Efficiency Enhancement
BREF Best available Techniques REFerence document
SEC Specific Energy Consumption
EUTS European Union Emission Trading Scheme
GHG Green House Gas (e.g. CO2)
UK United Kingdom
I Italy
PL Poland
F France
E Spain
D Germany

EIE/06/222/SI2.444565 CERAMIN – Public Final Report
KI Keramik-Institut GmbH, Ossietzkystr. 37a, D-01662 Meißen 18.12.09
5
Basic project data
Full title of the Project: Energy saving concepts for the European ceramic industry
Acronym of the Project: CERAMIN
Agreement Duration: 36 month
Starting date: 01.11.2006
End date: 31.10.2009
Coordinator: Leipziger Institut für Energie GmbH
Torgauer Str. 116
D 04347 Leipzig
Project-Partner:
Participant name Participant
short name
Country
Instytut Szkla, Ceramiki, Materialow
Ogniotrwalych i Budowlanych (E) ISIC Poland
CERAM Research Ltd.(E) CR United Kingdom
Societe Francaise de Ceramique (E) SFC France
ETA – Energia, Trasporti, Agricoltura srl ETA Italy
Centre recursos d’iniciatives i autocupacio, s.l. CRIA Spain
KI Keramik-Institut Meißen GmbH (E) KI Germany
Table 1: Project-Partner data
(E) ...Expert Partner
EIE/06/222/SI2.444565 CERAMIN – Public Final Report
KI Keramik-Institut GmbH, Ossietzkystr. 37a, D-01662 Meißen 18.12.09
6
Executive summary
The CERAMIN project was created to encourage the European ceramics industry to
decrease their specific energy consumption (SEC) by means of a competition and by a
“Tutorial about energy saving” for the ones who haven’t won. The ceramics industry was
divided into sub branches that are as similar as possible to the BREF Ceramic
Manufacturing Industry. Focus is laid on items of mass-production with a high-energy
input.
The procedure of the championship was similar to a round robin that is executed to
evaluate e.g. laboratories: Producers of ceramics from 6 European countries were
invited to report energy consumption data to their national partner. This partner reported
anonymous data to the KI Keramik-Institut GmbH, who was responsible to calculate
energy consumption data as well as energy mitigation data by the comparison of energy
consumption from two years (page 34). The results were sorted within each sub branch.
The awarding rules were:
1. An Extraordinary Efficiency Energy award for a ceramic sub branch will be given if at
least 6 companies from at least 2 European countries apply within one sub branch.
The (one!) company with the lowest specific energy consumption per branch can be
awarded.
2. An Energy Efficiency Enhancement award for a ceramic sub branch will be given if
at least 6 companies from at least 2 European countries apply within that branch.
The round down quarter (25%) with the greatest energy mitigation of the applying
companies can be awarded.
If a company has won the national partner was informed. He informed the respective
company and verified their data if not already done by the EUTS. After the national
partner had the data of the respective company confirmed, the company could be
awarded if it wanted. Then it got a certificate (Annex 4) and the name of the company
was published.
In total nine companies were awarded in 2009 (page 39).

EIE/06/222/SI2.444565 CERAMIN – Public Final Report
KI Keramik-Institut GmbH, Ossietzkystr. 37a, D-01662 Meißen 18.12.09
7
Only Polish and UK-partners were winners of the „Triple-E-Label” awarding in
2009.
In four sub branches industries partners were awarded.
Three awards on the base of absolute figures were handed out
Six awards of energy efficiency enhancement were established.
Another main results of the CERAMIN-project is the “Tutorial about energy saving”. The
recommendations or remarks collected in the “Tutorial about energy saving” are based
on remarks of the winning companies, on general experiences and on a lot of
references marked in the tutorial’s text and the references list at the end of this tutorial.
All knowledge was given or collected by the expert partners. The tutorial about energy
saving is divided into chapters covering the ceramic sub branches except refractories
and technical ceramics. Each chapter of the covered sub branches gives advice for the
technological steps of the respective sub branch. There are tutorials in 6 European
languages, which can be found on: http://www.ceramin.eu/Ceramin/downloads.htm.
The championship will continue from 2010 to 2015. The rules of the championship are
unchanged. New awards can be given if at least new data from 3 industry partners are
collected within one sub-branch until the 31st of October each year. The calculation of
new energy data and the update of the order concerning energy consumption or
mitigation will be free of charge. Companies who could newly be awarded have to agree
themselves and have to accept a fee for the efforts of the awarding and certificate.

EIE/06/222/SI2.444565 CERAMIN – Public Final Report
KI Keramik-Institut GmbH, Ossietzkystr. 37a, D-01662 Meißen 18.12.09
8
0 Introduction
The CERAMIN project was created to encourage the European Ceramics industry to
decrease their specific energy consumption (SEC) by means of a competition and by a
tutorial about energy saving for the ones who haven’t won. Focus is laid on items of
mass-production with a high-energy input.
The whole producers of ceramics will be subdivided into the following subgroups (sub
branches) of producers or enterprises in accordance to the main products produced.
The division of the ceramic branch into sub branches refers mostly to BREF Ceramic
Manufacturing Industry, December 2006 (BREF.... Best available Techniques
REFerence document) as shown below:
Masonry bricks, lightweight bricks, (kiln temperature mostly < 1000 °C)
Facing bricks, paving bricks (kiln temperature mostly > 1050 °C)
Roofing tiles
BREF summarizes these sub branches to
“Bricks and roof tiles”.
For the objectives of CERAMIN it is necessary to divide them into the above written sub
branches. Sometimes, when no divided data are available, this class will be used as
sum.
Vitrified clay pipes
Refractory products
Expanded clay aggregates
Wall and floor tiles
Table- and ornamental ware (household ceramics)
Sanitary ware
Technical ceramics
Inorganic bounded abrasives

EIE/06/222/SI2.444565 CERAMIN – Public Final Report
KI Keramik-Institut GmbH, Ossietzkystr. 37a, D-01662 Meißen 18.12.09
9
The target group are key market players. They will benefit in different manners.
Information on “Best Available Technologies” show possible developments and
strategies for more efficient production. The applied benchmarks indicate the possible
improvements for the different production processes. Due to a high percentage of
energy input and overall rising energy costs, reducing the specific energy input per
product, will result in decreasing production costs and therefore will strengthen the
position of the company. Market players are highly depended on consumers. Lower
possible prices on products and an improved image will strengthen the position in the
market furthermore.
The project partners involved in the project come from the major ceramic producing
countries in Europe. They represent nearly all of the key players in this market and are
directly involved into the results of this project, due to workshops, meetings and the
setting of benchmarks. Among them are enterprises that deal with energy and energy-
efficiency. Other ceramic enterprises federations, research establishments and
institutions, not directly involved, were invited to national and international workshops.
They are encouraged to discuss and disseminate information as well as to exchange
experiences.
The first step of work was to identify the ceramic sub branches that have a high-energy
consumption compared to the other ones. Chapter 1 shows the results of this
investigation.
Parallel to the identification of huge energy consumers within the ceramic sub branches
the presence similar rewards, tests, logos or championships, concerning low energy
consumption, was checked. This has been done to learn from the experiences of the
other examples. The ones with the greatest importance for the project are shown in
Chapter 2. From the experiences and knowledge of the examined labels the criteria of
the CERAMIN Label are derived respectively adjusted.
EIE/06/222/SI2.444565 CERAMIN – Public Final Report
KI Keramik-Institut GmbH, Ossietzkystr. 37a, D-01662 Meißen 18.12.09
10
Chapter 3 deals with the procedures of data collection from ceramic producers about
their energy consumption, with validation of the data and with the criteria for the
championship about energy saving.
Chapter 4 shows the results of data collection and the winners of the championship
about energy saving.
In Chapter 5 a short overview about the Tutorial of energy saving is given. This tutorial
is one of the main outcomes of the project and therefore available in 6 languages on
www.ceramin.eu.
Chapter 6 summarizes the results and experiences of the project.
Chapter 7 describes the rules to award ceramic producers that save energy in their
production for the years 2010 to 2015
EIE/06/222/SI2.444565 CERAMIN – Public Final Report
KI Keramik-Institut GmbH, Ossietzkystr. 37a, D-01662 Meißen 18.12.09
11
1 Energy consumption figures of different ceramic branches and
EU-countries
The objective of this chapter is to give a brief report about the collected data on energy
consumption of the EU ceramic-industry and to identify the ceramic branches and sub-
branches with the highest energy consumption. The complete report is available on
http://www.ceramin.eu/Ceramin/downloads/Report_on_energy_consumption.pdf
For this report mainly the partner-countries of CERAMIN
Poland, Germany, France, United Kingdom, Italy and Spain
are taken into consideration.
Further countries (e.g. Netherlands, Austria and Portugal) will be considered as far as
data are available.
1.1 Procedure for data collecting and data from the partner -countries
All partners of the CERAMIN project had a template table available with the request to
fill it in with all reachable data. Objective of the request was to get a lot of data that can
be analysed by general ceramic knowledge.
The origin of the collected data varies from 2002 to 2006. If different years from the
some source were considered, average data were calculated.
In a lot of cases only data for CO2-emissions were available. For these numbers the
energy consumption was calculated by the assumption that only natural gas is used and
the assumption that this gas is responsible for 0,05 tonsCO2 per GJ.
The data are mostly originated from the national authority responsible for CO2-trading.
For that reason it has to be taken into consideration which companies have to take part
in CO2-trading in which country. The European decree demands: All companies that
1. Have a production of more than 75 tons of ceramic products per day

EIE/06/222/SI2.444565 CERAMIN – Public Final Report
KI Keramik-Institut GmbH, Ossietzkystr. 37a, D-01662 Meißen 18.12.09
12
AND/OR
2. Have a firing aggregate (kiln) with more than 4 cubic meters volume and have more
than 300 kg ceramic products per cubic meter.
have to take part in CO2-trading.
According to the AND/OR written in capitals different EU-countries have different
national rules for CO2-trading. These rules influence the number of companies (and the
data) reported by the respective country. In table 2 the four possibilities and the rules of
each country are listed for the period 2002-2006 if available. Possibility 2 is among this
possibilities the strongest one and possibility 1 the weakest.
Possibility 1 companies that fulfil item 1 AND 2 have to take part UK, I, PL
Possibility 2 companies that fulfil item 1 OR 2 have to take part F
Possibility 3 companies that fulfil item 1 have to take part
Possibility 4 companies that fulfil item 2 have to take part D
Table 2: Different use of the European decree about EUTS in the partner –
countries for the years 2002-2006
The classification of the companies from the general classification “Ceramics” to the
sub-branches defined in Chapter 2 was done by the knowledge of the respective
company, by checking their Internet site or by a personal phone call.
1.2 Energy consumption figures - United Kingdom
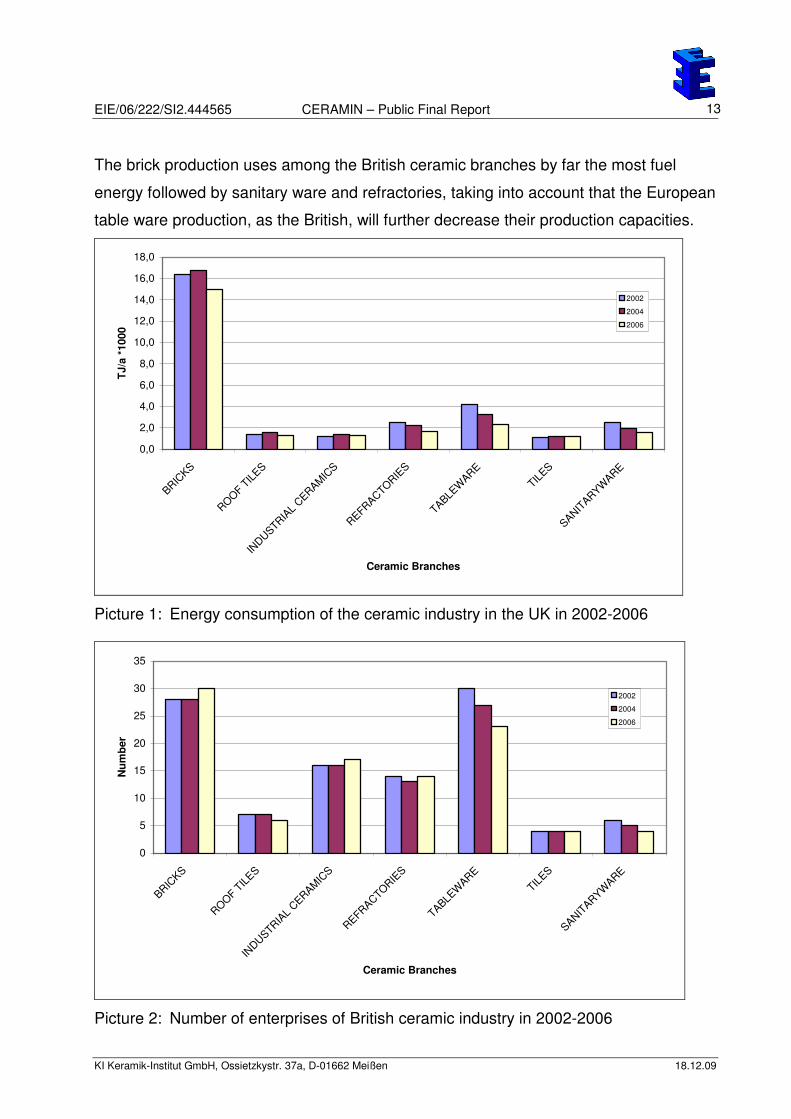
Pictures 1 and 2 show the (fuel-) energy consumption level of the British ceramic
industry. For tableware, sanitary ware and refractories a decreasing energy
consumption level is shown. Especially for tableware the decreasing level of energy
consumption is due to a decreasing production level. The decreasing energy
consumption level of refractories branch could be due to technical improvements.
Because of a not decreasing European market for refractories, it is assumed that the
British production level of refractories remained on at least the same level from 2002 to
2006.
EIE/06/222/SI2.444565 CERAMIN – Public Final Report
KI Keramik-Institut GmbH, Ossietzkystr. 37a, D-01662 Meißen 18.12.09
13
The brick production uses among the British ceramic branches by far the most fuel
energy followed by sanitary ware and refractories, taking into account that the European
table ware production, as the British, will further decrease their production capacities.
0,0
2,0
4,0
6,0
8,0
10,0
12,0
14,0
16,0
18,0
BRICKS
ROOF TIL
ES
INDUSTRIA
L CERAM
ICS
REFRACTORIES
TABLEW
ARE
TILES
SANITARYW
ARE
Ceramic Branches
TJ/a
*1000
2002
2004
2006
Picture 1: Energy consumption of the ceramic industry in the UK in 2002-2006
0
5
10
15
20
25
30
35
BRICKS
ROOF TIL
ES
INDUSTRIA
L CERAM
ICS
REFRACTORIES
TABLEW
ARE
TILES
SANITARYW
ARE
Ceramic Branches
Nu
mb
er
2002
2004
2006
Picture 2: Number of enterprises of British ceramic industry in 2002-2006

EIE/06/222/SI2.444565 CERAMIN – Public Final Report
KI Keramik-Institut GmbH, Ossietzkystr. 37a, D-01662 Meißen 18.12.09
14
1.3 Energy consumption figures - Poland
Only data from 2005 are available. The best subdivision into sub branches was done by
the Energy Market Agency. This data represent a lot of Polish ceramic production,
although not all, as the last bar in picture 3 shows. According to picture 3 tiles and
coarse ceramics production are the main consumers of energy in the ceramics industry
of Poland.
0,0
5,0
10,0
15,0
20,0
25,0
30,0
Porce
lain
(Chin
a-war
e)
Sanita
ry w
are
Electric
al po
rcela
in
Techn
ical c
eram
ics
not c
lassif
ied in
oth
er su
bbra
nche
s
Refrac
torie
s
Ceram
ic tile
s
coar
se ce
ramics
Total
- Ene
rgy M
arke
t Ang
ency
Fine ce
ram
ics
Refrac
torie
s
Tiles a
nd co
arse
cera
mics
Total
- Cen
tral s
tatis
tical
offic
e
CO2-tra
ding
Ceram
ic en
terp
rises
Ceramic branches
En
erg
y c
on
su
mp
tio
n in
TJ
/a *
10
00
Picture 3: Energy consumption of Polish ceramic sub branches in 2005
Energy market agency central statis-tical office

EIE/06/222/SI2.444565 CERAMIN – Public Final Report
KI Keramik-Institut GmbH, Ossietzkystr. 37a, D-01662 Meißen 18.12.09
15
1.4 Energy consumption figures - Italy
0
2
4
6
8
10
12
Bricks Facing Roofing Heavy Sum Aggregates Tiles Household Sanitary Technical
1.5.1.1 1.5.1.2 1.5.1.3 1.5.1 1.5.4 1.5.5 1.5.6 1.5.7 1.5.8
ceramic b ranches, ref er t o chapt er 2
Picture 4: Energy consumption in some Italian ceramic sub branches 2002-2004
For Italy only data about companies that have to take part in EUTS are available
(possibility #1, refer to table 2). The CO2-values allocated for 2005 and 2006 are
reported. Normally these data are originated from the CO2-emissions and therefore they
represent the energy consumption of the reporting period from 2002-2004. For a lot of
enterprises no clear classification into the coarse ceramic sub-branches defined in
chapter 0 is possible because of their broad production spectrum. The expanded clay
aggregates industry has a surprisingly high share of energy compared to coarse
ceramics. The very well developed and strong Italian tile industry is according to the
rules of EUTS unfortunately not reported, although this branch could share a high
amount of energy compared to the other branches.

EIE/06/222/SI2.444565 CERAMIN – Public Final Report
KI Keramik-Institut GmbH, Ossietzkystr. 37a, D-01662 Meißen 18.12.09
16
1.5 Energy consumption figures - Germany
The German data have their origin mostly in data published by the Deutsche
Emissionshandelsstelle (www.dehst.de). In Germany only companies that fulfil
Possibility 4 according to table 2 have to take part in CO2-trading.
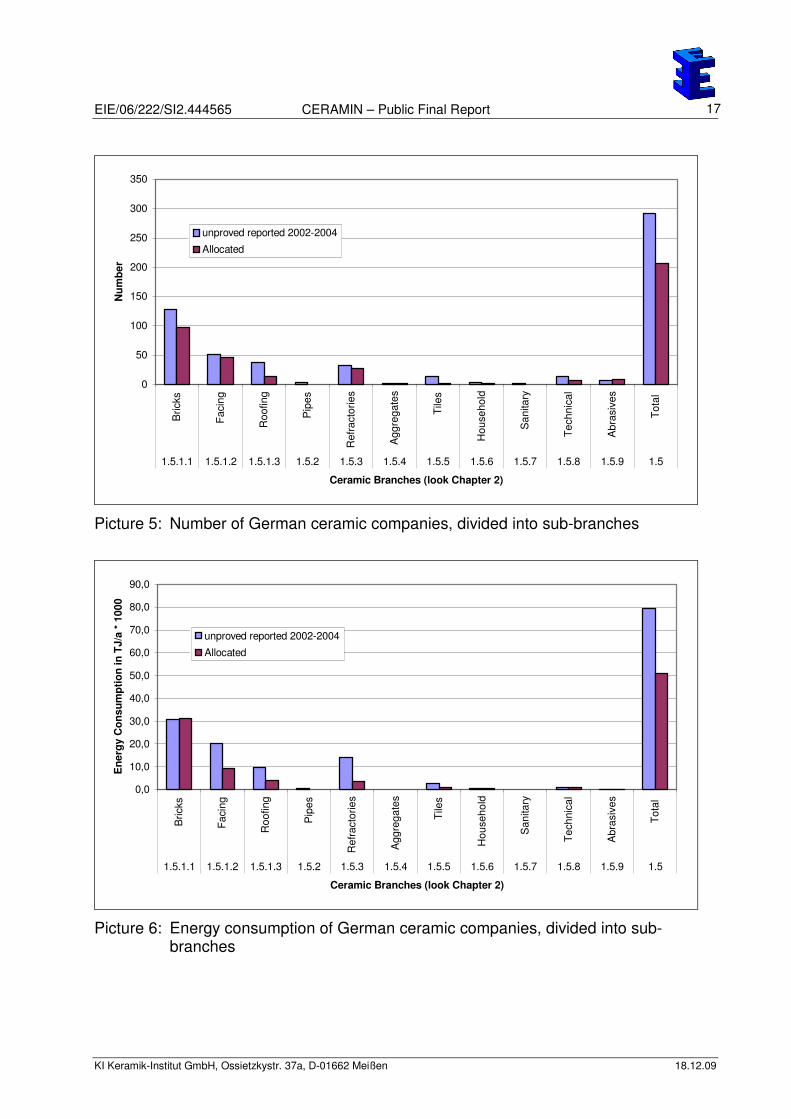
The 2002 to 2004 data are originated by an unproved data collection initiated in 2004 to
get information about the companies that have to take part in EUTS and to allocate the
free of charge emission rights. The information given by the respective companies was
published without prove. For that reason some CO2-emission-numbers are wrong and
what is important as well, a lot of companies, which are not forced to take part in CO2-
trading, report their CO2-emissions. In numbers: 292 companies report their data and
only 206 are forced to take part in CO2-trading. According to the EU and the German
regulations about CO2-trading some branches are completely not considered (and
allocated) for CO2-trading (e.g. a big share of the roof tile production, all of tile
production).
Pictures 5 and 6 show the comparison of the unproved and later allocated CO2-
emissions. The unproved numbers were used for the table and figures that show the
whole European situation (Chapter 1.9), because of the broader spectrum of branches
considered.
The differences between allocated and verified CO2-emissions are due to companies
not operating at full (or allocated) capacity, with a slow increase from 2005 to 2006 and
presumable with further increase to 2007 due to the economical development in
Germany.
EIE/06/222/SI2.444565 CERAMIN – Public Final Report
KI Keramik-Institut GmbH, Ossietzkystr. 37a, D-01662 Meißen 18.12.09
17
0
50
100
150
200
250
300
350B
ricks
Fac
ing
Roo
fing
Pip
es
Ref
ract
orie
s
Agg
rega
tes
Tile
s
Hou
seho
ld
San
itary
Tec
hnic
al
Abr
asiv
es
Tot
al
1.5.1.1 1.5.1.2 1.5.1.3 1.5.2 1.5.3 1.5.4 1.5.5 1.5.6 1.5.7 1.5.8 1.5.9 1.5
Ceramic Branches (look Chapter 2)
Nu
mb
er
unproved reported 2002-2004
Allocated
Picture 5: Number of German ceramic companies, divided into sub-branches
0,0
10,0
20,0
30,0
40,0
50,0
60,0
70,0
80,0
90,0
Bric
ks
Fac
ing
Roo
fing
Pip
es
Ref
ract
orie
s
Agg
rega
tes
Tile
s
Hou
seho
ld
San
itary
Tec
hnic
al
Abr
asiv
es
Tot
al
1.5.1.1 1.5.1.2 1.5.1.3 1.5.2 1.5.3 1.5.4 1.5.5 1.5.6 1.5.7 1.5.8 1.5.9 1.5
Ceramic Branches (look Chapter 2)
En
erg
y C
on
su
mp
tio
n in
TJ
/a *
10
00
unproved reported 2002-2004
Allocated
Picture 6: Energy consumption of German ceramic companies, divided into sub-branches

EIE/06/222/SI2.444565 CERAMIN – Public Final Report
KI Keramik-Institut GmbH, Ossietzkystr. 37a, D-01662 Meißen 18.12.09
18
1.6 Energy consumption figures - Spain
Picture 7 shows the energy consumption data for Spain. For the heavy ceramics
industry and the tile producing industry the greatest amounts of energy consumption are
reported compared with the other considered EU-countries. That is due to the really
strong Spanish ceramic industry but it can also be due to the source of data: the
Spanish brick manufactures association and the Spanish tile manufactures association
respectively. The data of these both authorities cover the whole branch and not only the
huge manufactures. Unfortunately there are no data available, that divide the heavy
ceramics products into their sub groups and there are no data available for the other –
but presumable smaller- sub branches.
0
10
20
30
40
50
60
70
80
Bric
ks
Fac
ing
Roo
fing
Hea
vy S
um
Ref
ract
orie
s
Agg
rega
tes
Tile
s
Hou
seho
ld
San
itary
Tec
hnic
al
1.5.1.1 1.5.1.2 1.5.1.3 1.5.1 1.5.3 1.5.4 1.5.5 1.5.6 1.5.7 1.5.8
En
erg
y c
on
su
mp
tio
n
0
50
100
150
200
250
300
350
400
450
Nu
mb
er
Energy consumption
Number of enterprises
no d
ata
avai
labl
e
no d
ata
avai
labl
e
no d
ata
avai
labl
e
no d
ata
avai
labl
e
no d
ata
avai
labl
e
no d
ata
avai
labl
e
no d
ata
avai
labl
e
no d
ata
avai
labl
e
Picture 7: Energy consumption of Spanish ceramic companies, divided into sub-branches
EIE/06/222/SI2.444565 CERAMIN – Public Final Report
KI Keramik-Institut GmbH, Ossietzkystr. 37a, D-01662 Meißen 18.12.09
19
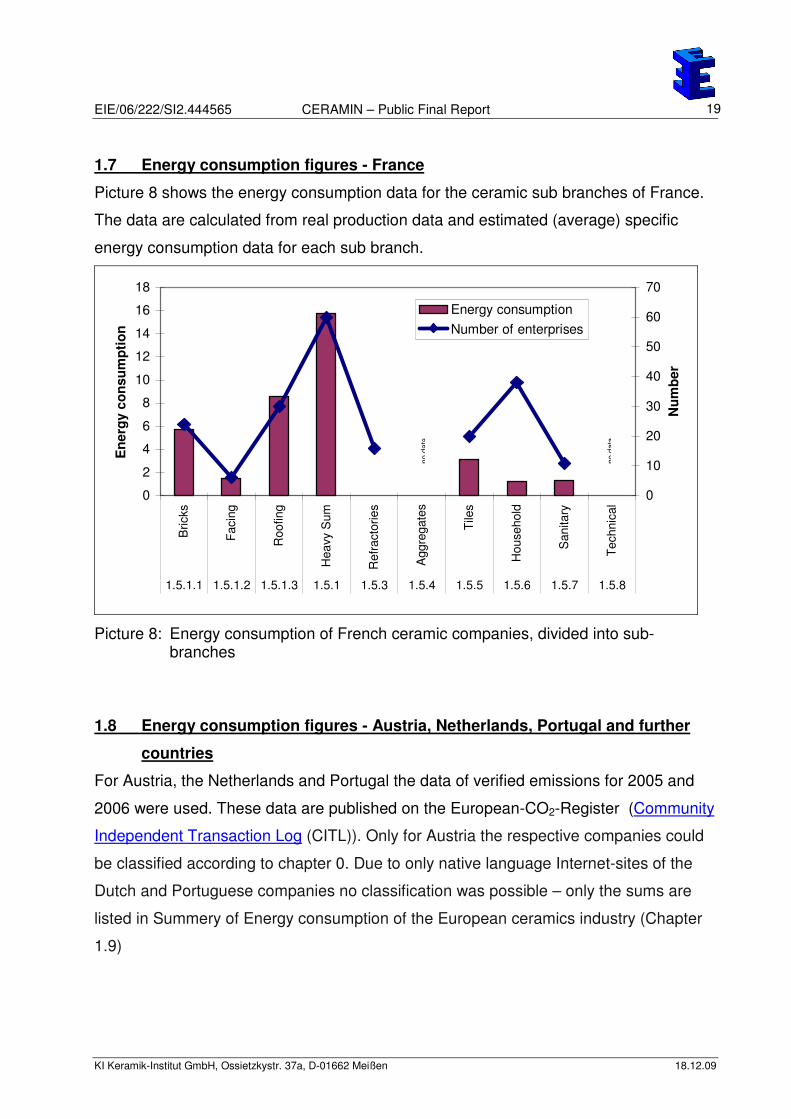
1.7 Energy consumption figures - France
Picture 8 shows the energy consumption data for the ceramic sub branches of France.
The data are calculated from real production data and estimated (average) specific
energy consumption data for each sub branch.
0
2
4
6
8
10
12
14
16
18
Bric
ks
Fac
ing
Roo
fing
Hea
vy S
um
Ref
ract
orie
s
Agg
rega
tes
Tile
s
Hou
seho
ld
San
itary
Tec
hnic
al
1.5.1.1 1.5.1.2 1.5.1.3 1.5.1 1.5.3 1.5.4 1.5.5 1.5.6 1.5.7 1.5.8
En
erg
y c
on
su
mp
tio
n
0
10
20
30
40
50
60
70
Nu
mb
er
Energy consumption
Number of enterprises
no d
ata
no d
ata
Picture 8: Energy consumption of French ceramic companies, divided into sub-branches
1.8 Energy consumption figures - Austria, Netherlands, Portugal and further
countries
For Austria, the Netherlands and Portugal the data of verified emissions for 2005 and
2006 were used. These data are published on the European-CO2-Register (Community
Independent Transaction Log (CITL)). Only for Austria the respective companies could
be classified according to chapter 0. Due to only native language Internet-sites of the
Dutch and Portuguese companies no classification was possible – only the sums are
listed in Summery of Energy consumption of the European ceramics industry (Chapter
1.9)
EIE/06/222/SI2.444565 CERAMIN – Public Final Report
KI Keramik-Institut GmbH, Ossietzkystr. 37a, D-01662 Meißen 18.12.09
20
1.9 Summery of European Energy consumption in the ceramic industry divided
into sub branches
According to the Picture 9 the tiles and heavy ceramics sub branches are the ones with
the greatest energy consumption. The difference between these two sub branches is
smaller then expected. The very strong tile industries of Italy and Spain are responsible
for that. Beside these two branches the refractories have mentionable energy
consumption, mainly due to German factories. The numbers of this sub branch might be
much higher if the strong French refractories branch could be also taken in account (16
French companies, but no energy consumption data available). Additionally the dividing
between refractories and technical ceramics is sometimes a bit mixed up, because
differences are mainly defined by the application of the product (refractory: support high
temperature processes, technical ceramics: electrical, medicine, engineering use).
From the technical point of view the energy consumption for heavy ceramics products
and tiles are high due to huge production amounts and the fair high-energy
consumption of refractories is due to high kiln temperatures. That means a small
decrease of energy consumption per unit of heavy ceramics or tiles has great effects on
the whole energy consumption of the sub branch. For refractories respectively technical
ceramics the situation is more complicated due to mostly sophisticated and special
products.
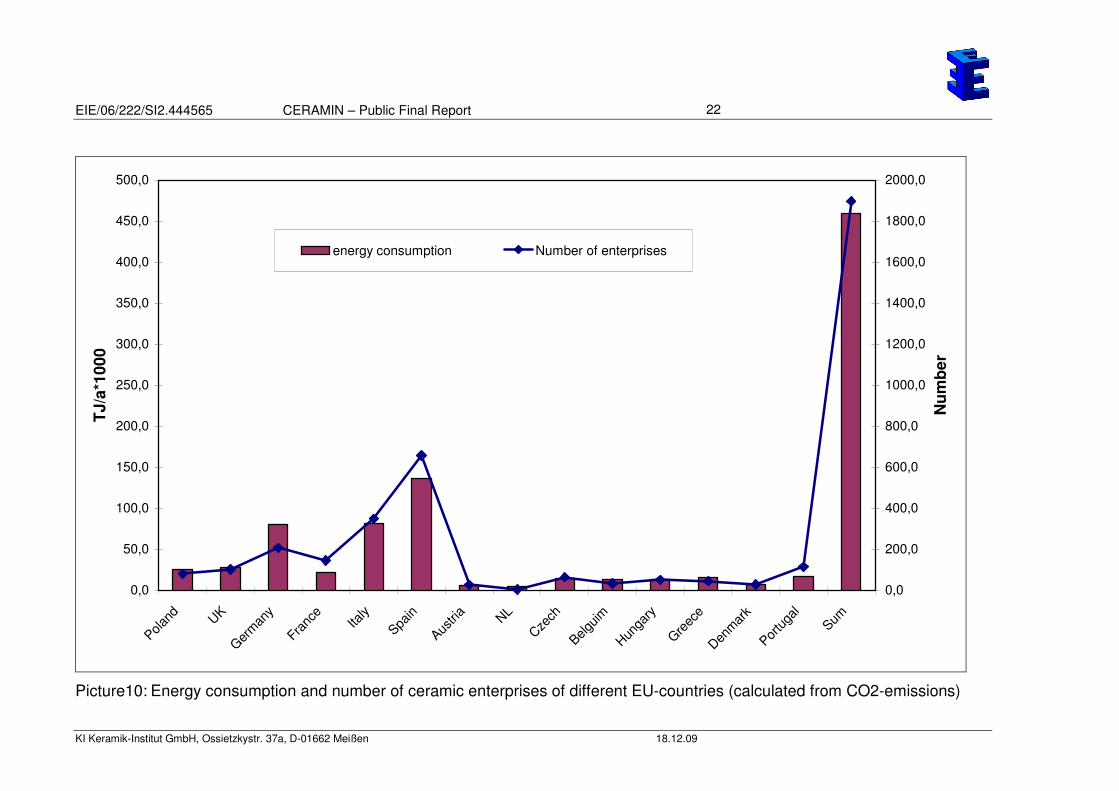
According to picture 10 Italy, Spain and Germany consume the greatest part of energy
used for ceramics production in Europe, followed by Poland, the UK and France. From
that point of view and by the number of enterprises the consortia of the CERAMIN
project consist of the main European “ceramic countries”.

EIE/06/222/SI2.444565 CERAMIN – Public Final Report
KI Keramik-Institut GmbH, Ossietzkystr. 37a, D-01662 Meißen 18.12.09
21
0
20
40
60
80
100
120
140
160
180
200
Bricks Facing Roofing Heavy Sum Pipes Refractories Aggregates Tiles Household Sanitary Technical Abrasives
1.5.1.1 1.5.1.2 1.5.1.3 1.5.1 1.5.2 1.5.3 1.5.4 1.5.5 1.5.6 1.5.7 1.5.8 1.5.9
Ceramic Branch according to BREF Ceramic and Subbranch Definition of CERAMIN (look chapter 2)
En
erg
y C
on
su
mp
tio
n T
J/a
Poland UK Germany France Italy Spain Austria NL Portugal Sum
Picture 9: Energy consumption of European ceramic industries sub branches
= 1.5.1.1 + 1.5.1.2 + 1.5.1.3
+ companies that can’t be clearly classified
EIE/06/222/SI2.444565 CERAMIN – Public Final Report
KI Keramik-Institut GmbH, Ossietzkystr. 37a, D-01662 Meißen 18.12.09
22
0,0
50,0
100,0
150,0
200,0
250,0
300,0
350,0
400,0
450,0
500,0
Poland UK
Germ
any
Franc
e
Italy
Spain
Austri
a NL
Czech
Belguim
Hunga
ry
Greec
eDen
mark
Portu
gal
Sum
TJ
/a*1
00
0
0,0
200,0
400,0
600,0
800,0
1000,0
1200,0
1400,0
1600,0
1800,0
2000,0
Nu
mb
er
energy consumption Number of enterprises
Picture10: Energy consumption and number of ceramic enterprises of different EU-countries (calculated from CO2-emissions)
EIE/06/222/SI2.444565 CERAMIN – Public Final Report
KI Keramik-Institut GmbH, Ossietzkystr. 37a, D-01662 Meißen 18.12.09
23
2 Judgement of existing labels supporting low energy
consumption in relation to the “Triple-E-Label”
This chapter describes main principles and rules for a label and trophy awarding of
intelligent energy use (low(er) energy consumption) in the European ceramic industry.
Therefore general possibilities of influence on energy use are discussed briefly and
existing labels or trophies are analysed further on.
The name of the proposed label is: “Triple-E-Label” – which shall award and stimulate
1. Extraordinary Energy Efficient
2. Energy Efficiency Enhancement
ceramic products and production
Possible ways to reach these objectives vary:
1. Benchmarks or regulations created and forced by national or EU-authorities (e.g.
CO2-limits for branches or countries)
Advantage:
• The objectives will be reached for sure
Disadvantage:
• Distortion of competition with regions or countries who are not under the power of
the regulations
• All companies will be treated mostly the same, with no consideration about
specialities of their situation.
• Takes money to force the regulation
• Strong and/or modern companies do not do as much as they could and weaker
ones might be overtaxed.
2. Voluntary self obligation of whole industry branches, worked out by associations
or representatives (e.g. obligation of producers of passenger vehicles to
decrease the average CO2-emissions of cars to 140 g/km until 2008)
Advantage:

EIE/06/222/SI2.444565 CERAMIN – Public Final Report
KI Keramik-Institut GmbH, Ossietzkystr. 37a, D-01662 Meißen 18.12.09
24
• The respective branch will not take any damage by this obligation. The power,
the annual turnover or the jobs are not endangered
Disadvantage:
• The public can not be sure that the obligation represents the best possible
figures for the whole branch
• Some or more companies will not join the voluntary obligation and will not
change anything for this reason
3. EU-Authorities or representatives of the EU or private associations create labels
for low energy consumption. (similar to ISO 9001 regulations)
Advantage:
• Participation is optional
• The companies that apply for the label or the ones that are awarded are well
controlled. It is approved for these companies, that the objective numbers are
reached.
• Getting or keeping the label could be part of the marketing strategy of the
companies.
Disadvantage:
• Only a limited number of companies will take part
• The “black sheep” can waste energy as before
• Success of such a label depends on the choice of not to restrictive criteria.
4. Organizing championships for low energy consumption together with labels
and/or trophies.
Advantage:
• Participation is optional
• The companies that apply for the label/trophy or are awarded are well controlled.
For these companies it is approved that the objective numbers are reached
• Getting or keeping the label/trophy could be part of marketing strategy of the
companies

EIE/06/222/SI2.444565 CERAMIN – Public Final Report
KI Keramik-Institut GmbH, Ossietzkystr. 37a, D-01662 Meißen 18.12.09
25
• One can be sure that the companies among the top ten or top twenty of the
intelligent energy use competition do their best to become the champion
• No criteria necessary
• Information about the smartest energy use can be collected.
Disadvantage:
• Only a limited number of companies will take part
• The “black sheep” can waste energy as before
• Organising a championship takes more effort than simple label awarding
In the following some labels/trophies used in Europe that reward intelligent energy use
are listed and analysed. Main view will be on the principles of the labels/trophies
regarding their advantages and disadvantages, if used in the European ceramics
industry.
2.1 Existing labels - ECO-Label
According to http://www.eco-label.com/default.htm:”There are currently
twenty-three different product groups, and already more than 250
licences have been awarded for several hundred products.”
The Eco-Label is given by EU-Authorities on a voluntary obligation, with
fixed regulations for each product or process or branch.
Characteristics
• The Label is organized and accepted on a EU-basis
• Same regulations for all companies that want to apply
• Clear published criteria for products and processes.

EIE/06/222/SI2.444565 CERAMIN – Public Final Report
KI Keramik-Institut GmbH, Ossietzkystr. 37a, D-01662 Meißen 18.12.09
26
• Energy consumption limitation for hard floor coverings (=floor tiles) are ambitious
compared to BREF Ceramics Industry.
• Long term effects if the regulations are updated regularly
• The regulations (paper and hard floor coverings were checked) are difficult to
understand for end users
Conclusion
CERAMIN should take the advantages of ECO label, but make sure that national
specialities are taken into consideration and that the public dissemination is better.
2.2 Existing labels - Energy Star
According to http://www.energystar.gov: “ENERGY STAR is
a joint program of the U.S. Environmental Protection Agency
and the U.S. Department of Energy helping us all save
money and protect the environment through energy efficient
products and practices.”
In 1992 the US Environmental Protection Agency (EPA) introduced ENERGY STAR as
a voluntary labelling program designed to identify and promote energy-efficient products
to reduce greenhouse gas emissions. Computers and monitors were the first labelled
products. Through 1995, EPA expanded the label to additional office equipment
products and residential heating and cooling equipment. In 1996, EPA partnered with
the US Department of Energy for particular product categories. The ENERGY STAR
label is now on major appliances, office equipment, lighting, home electronics, and
more. EPA has also extended the label to cover new homes and commercial and
industrial buildings.
Characteristics
• Well known all over the world
• End-user and product orientated

EIE/06/222/SI2.444565 CERAMIN – Public Final Report
KI Keramik-Institut GmbH, Ossietzkystr. 37a, D-01662 Meißen 18.12.09
27
• Same regulations for all companies that want to apply
• Clear published criteria for products and processes.
• Available for a broad range of products, that is steadily enlarged
• Concerning temperature insulation in buildings quite weak regulations, all other
regulations can’t be judged
• No regulations for production processes
Conclusion
The Energy Star is a successful label concerning its spreading over the world. There is
a poor transparency for end-users. It can’t give an example for CERAMIN label,
because of its dimensions the governmental organization and product orientation
2.3 Existing labels - European Union energy label
“European Union energy label is given by EU-Authorities with a governmental, urgent
obligation for fixed types of products (e.g. washing machines, refrigerators), with fixed
testing principles for each product group.
“According to several different EU Directives (92/75/CEE,
94/2/CE, 95/12/CE, 96/89/CE, 2003/66/CE, et alia) most white
goods, light bulb packaging and cars must have an EU Energy
Label clearly displayed when offered for sale or rent.” The
energy efficiency of the appliance is rated in terms of a set of
energy efficiency classes from A to G on the label, A being the
most energy efficient, G the least efficient. The labels also give
other useful information to the customer as they choose
between various models. The information should also be given
in catalogues and included by Internet retailers on their
websites” from Wikipedia, the free encyclopaedia. Between
1995 and 2000 0,75 Mill tons CO2 were saved by new
techniques used for whiteware.

EIE/06/222/SI2.444565 CERAMIN – Public Final Report
KI Keramik-Institut GmbH, Ossietzkystr. 37a, D-01662 Meißen 18.12.09
28
Characteristics
• The Label is organized and accepted on a EU-basis
• Well known by end users, high transparency due to classification into groups of
energy-consumption
• Same regulations for all products that have been applied for
• Clear published criteria for products, makes it easy for producers to define objectives
of further product development
• Producers are able to justify higher prices if their product has a low energy
consumption
• The testing costs increase costs of all products
• Regular need for updating Label-regulations to cover the technical progress
• Due to the status of a fixed European decree, the Label is presumable not as flexible
as non governmental labels or labels on voluntary obligation might be
Conclusion
The European Union energy label is a very effective tool to increase the awareness of
energy consumption. Organized on European decree basis – for that reason not
comparable with CERAMIN. It is expensive to define the parameters for the different
classes to compare products.
2.4 Existing labels - The European Energy Trophy
The European Energy-Trophy award is organised
by European NGO’s as championship between the
participants about saving the highest amount of
energy in office buildings. According to
http://www.energytrophy.org/en-home: “The
European Energy Trophy is an EU-wide

EIE/06/222/SI2.444565 CERAMIN – Public Final Report
KI Keramik-Institut GmbH, Ossietzkystr. 37a, D-01662 Meißen 18.12.09
29
competition of companies and public administrations for saving energy in office
buildings. ...The aim was to award the Energy Trophy to participants who saved the
most energy in one office building in one year using cost-free measures only
Characteristics
• Companies and public administrations are addressed
• The Label is organized and accepted on a EU-basis
• Companies with the highest energy consumption have the best chance to win the
championship, if they are engaged because the highest amount of energy saving is
awarded
• No negotiations about limits of e.g. CO2-waste rights necessary.
• Easy to handle, because of simple rules
• Possibility to have national and international winners of the championships at the
same time
• Short term effects, after winning the championship there is no guarantee that the low
energy consumption remains
• Sponsors for the trophy are necessary
• It is only proofed that the energy consumption (or CO2-emission) are lowered, it is
not proofed that they are lowered the most possible amount
• The winning company has cost saving effects and the honour of winning, but it has
no marketing effects for their products.
Conclusion
The principle of European Energy Trophy is quite near to the objectives of CERAMIN,
the missing label weakens the tool concerning his long-term effects and concerning the
marketing benefits for the participating companies.

EIE/06/222/SI2.444565 CERAMIN – Public Final Report
KI Keramik-Institut GmbH, Ossietzkystr. 37a, D-01662 Meißen 18.12.09
30
2.5 Existing labels - KlimaHaus/CasaClima
KlimaHaus/CasaClima is organised by a regional governmental organisation, labelling
the energy consumption of houses in 3 Levels on voluntary obligation. According to
http://www.klimahausagentur.it/en/casaclima/klimahauscasaclima.html:
“KlimaHaus/CasaClima is a term developed to describe energy-saving construction and
dynamic living. In a time when oil and gas reserves are being
depleted, economic factors are increasingly important in building
and renovation.
KlimaHaus/CasaClima has found a way to fuse well-being and
savings. The category of energy saving, rather than architectural style, determines
whether a building is classified as a KlimaHaus/CasaClima. A practical calculation
system is used to determine a building’s energy requirement, making the
KlimaHaus/CasaClima programme simple and user-friendly.
The energy index and KlimaHaus/CasaClima placard are the fundamental pillars of the
organisation, and the positive image associated with KlimaHaus/CasaClima has
inspired builders’ imitation. Significantly, KlimaHaus/CasaClima not only focuses on new
construction, but also on the lasting renovation. Furthermore the Label itself defines the
degree it is awarded for: All buildings certified with KlimaHaus/CasaClima categories
Gold, A or B may display the corresponding KlimaHaus/CasaClima placard directly at
the entrance, testifying to its low energy class. This increases the image, not to mention
the value, of the property. The placard is provided by an independent authority, namely
the KlimaHaus/CasaClima Agency!”
Characteristics
• The Label is organized and accepted on governmental regional Basis
• Label awarding by proofed specialists
• Clients can be sure to get an energy efficient building
• Offer is been completed with championships to architects and technicians to erect
the building with lowest energy consumption and with education offers.
• High level of public dissemination e.g. testing and betting of how long a block of ice
will exist in a well temperature insulated building

EIE/06/222/SI2.444565 CERAMIN – Public Final Report
KI Keramik-Institut GmbH, Ossietzkystr. 37a, D-01662 Meißen 18.12.09
31
• The label has to adapt from time to time to cover the momentarily available
techniques.
• The organisers of the championships or bets need prices for the winning company or
person
Conclusion
KlimaHaus/CasaClima is a perfect mixture of labelling, championship and dissemination
to promote low energy consumption of complex and complicated products. CERAMIN
can learn a lot from this label.
2.6 Summary about existing labels
Successful labels need a lot of effort to disseminate them. The most successful label is
presumable the European Union energy label and the Energy Star. The European
Union energy label is successful because it is obligatory in all EU-countries for
whiteware – and it has a good level of valued information for end users about energy
consumption. Due to its obligatory basis also products with poor energy consumption
have to be labelled.
The Energy Star is well known all over the world from the use of computer equipment.
The criteria are not really transparent, therefore the end user can only trust the EPA or
not. The European-Eco--label is similar to the Energy Star, concerning its criteria, but it
is not as well known as the Energy Star. All three labels cannot give an example for
CERAMIN because of its governmental basis. The transparency of the European Union
energy label is exemplary.
Energy Trophy and Klimahaus are two labels that shall give example for the CERAMIN
label. The character of a championship of both labels can be easily used in CERAMIN
in a national and a EU-wide championship.
The idea of CERAMIN label to award only the top-third or the top-quarter of products of
enterprises could not be found in use by another label: This procedure should be as
EIE/06/222/SI2.444565 CERAMIN – Public Final Report
KI Keramik-Institut GmbH, Ossietzkystr. 37a, D-01662 Meißen 18.12.09
32
transparent as the European Union energy label is. One advantage of the Energy
Trophy had to be kept in mind in the CERAMIN project. It is to create championships in
2 disciplines:
1. Absolute lowest specific energy consumption per product or branch
2. Greatest decrease of specific energy consumption per product or branch
3 The CERAMIN-Label: Characteristics, awarding and verification procedures
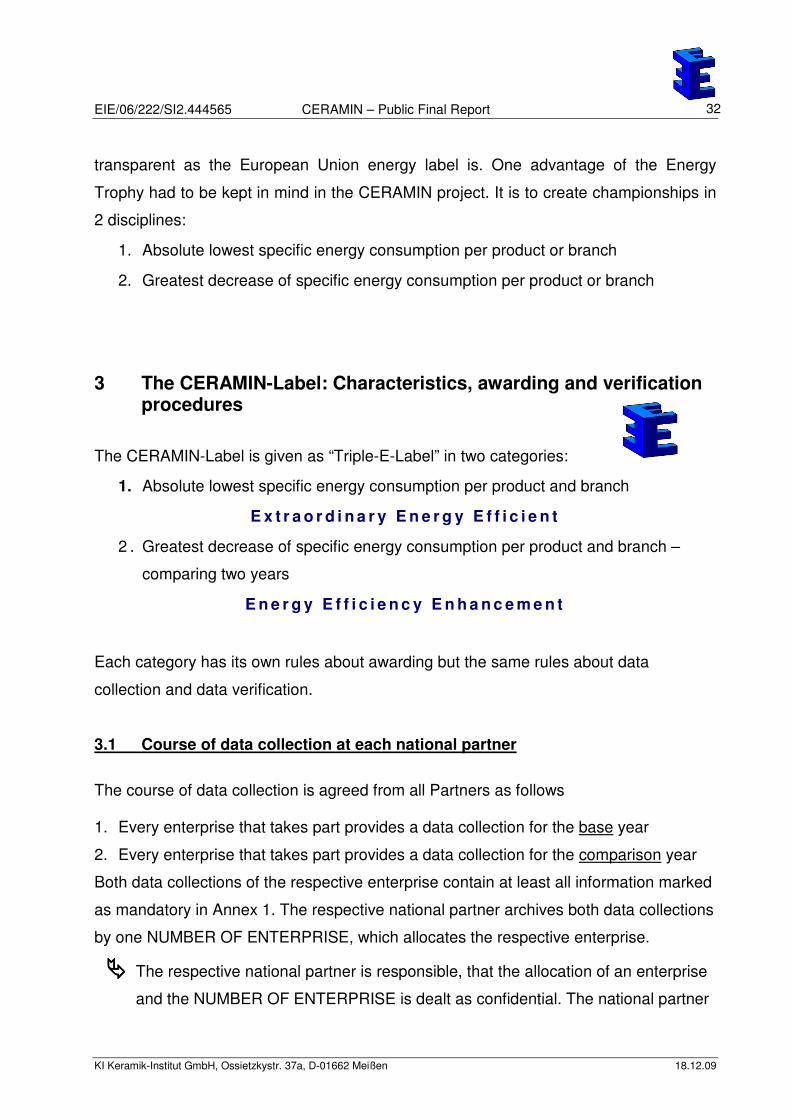
The CERAMIN-Label is given as “Triple-E-Label” in two categories:
1. Absolute lowest specific energy consumption per product and branch
E x t r a o r d i n a r y E n e r g y E f f i c i e n t
2 . Greatest decrease of specific energy consumption per product and branch –
comparing two years
E n e r g y E f f i c i e n c y E n h a n c e m e n t
Each category has its own rules about awarding but the same rules about data
collection and data verification.
3.1 Course of data collection at each national partner
The course of data collection is agreed from all Partners as follows 1. Every enterprise that takes part provides a data collection for the base year
2. Every enterprise that takes part provides a data collection for the comparison year
Both data collections of the respective enterprise contain at least all information marked
as mandatory in Annex 1. The respective national partner archives both data collections
by one NUMBER OF ENTERPRISE, which allocates the respective enterprise.
The respective national partner is responsible, that the allocation of an enterprise
and the NUMBER OF ENTERPRISE is dealt as confidential. The national partner

EIE/06/222/SI2.444565 CERAMIN – Public Final Report
KI Keramik-Institut GmbH, Ossietzkystr. 37a, D-01662 Meißen 18.12.09
33
is only allowed to inform third parties after getting a written permission by the
respective enterprise.
The reported data should (if not CASE 2 applies) fulfil the following directives,
proved by verification
• DIRECTIVE 2003/87/EC OF THE EUROPEAN PARLIAMENT AND OF THE
COUNCIL of 13 October 2003 establishing a scheme for greenhouse gas
emission allowance trading within the Community and amending Council
Directive 96/61/EC [Link]
• COMMISSION DECISION of 29 January 2004 establishing guidelines for the
monitoring and reporting of greenhouse gas emissions pursuant to Directive
2003/87/EC of the European Parliament and of the Council [Link]
Both of these directives have to have a pendant in the national right and legislative of
each partner country
CASE 1: The data are verified by national or rather European rules:
The enterprise has the possibility of getting the „Triple-E-Label” without
further proving.
CASE 2: The data are NOT verified by national or rather European rules.
The respective enterprise has to accept a verifying procedure by his
national partner before getting the „Triple-E-Label” (-if it is among the
enterprises who are invited to get the label). This procedure is defined by a
“Verification Questionnaire” described in Chapter 3.3 and Annex 2.
The national partner collects data presented in Annex 1 from the reports or the
companies and transmits them to the project coordinator. At least two sets per company
(base and comparison year) have to be transmitted.
EIE/06/222/SI2.444565 CERAMIN – Public Final Report
KI Keramik-Institut GmbH, Ossietzkystr. 37a, D-01662 Meißen 18.12.09
34
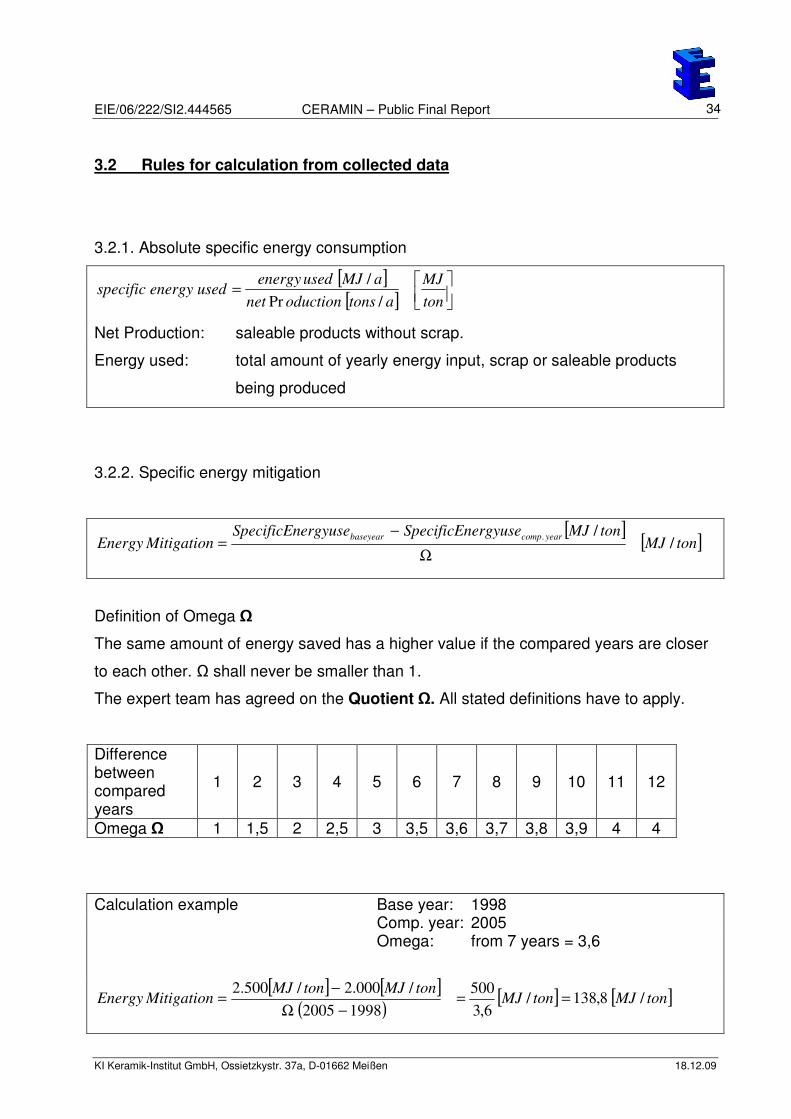
3.2 Rules for calculation from collected data
3.2.1. Absolute specific energy consumption
[ ][ ]
=
ton
MJ
atonsoductionnet
aMJusedenergyusedenergyspecific
/Pr
/
Net Production: saleable products without scrap.
Energy used: total amount of yearly energy input, scrap or saleable products
being produced
3.2.2. Specific energy mitigation
[ ][ ]tonMJ
tonMJergyuseSpecificEnergyuseSpecificEnMitigationEnergy
yearcompbaseyear/
/.
Ω
−=
Definition of Omega Ω
The same amount of energy saved has a higher value if the compared years are closer
to each other. Ω shall never be smaller than 1.
The expert team has agreed on the Quotient Ω. All stated definitions have to apply.
Difference between compared years
1 2 3 4 5 6 7 8 9 10 11 12
Omega Ω 1 1,5 2 2,5 3 3,5 3,6 3,7 3,8 3,9 4 4
Calculation example Base year: 1998 Comp. year: 2005 Omega: from 7 years = 3,6
[ ] [ ]( )
[ ] [ ]tonMJtonMJtonMJtonMJ
MitigationEnergy /8,138/6,3
500
19982005
/000.2/500.2==
−Ω
−=

EIE/06/222/SI2.444565 CERAMIN – Public Final Report
KI Keramik-Institut GmbH, Ossietzkystr. 37a, D-01662 Meißen 18.12.09
35
3.3 Rules for awarding
There is no right to get an award. The national partner is allowed to award a company
from his country if it fulfils the rules described in the following chapters 3.3.1 and 3.3.2.
The national partner can decline to award a national company. The national partner
should give reason for declining to the company that isn’t awarded. A declining is
definite, until the company delivers changed or new data.
3.3.1 Rules for Extraordinary Energy Efficient awarding
An award for a ceramic sub branch will be given if at least 6 companies from at least 2
European countries apply within that branch. The (one!) company with the lowest
specific energy consumption (specific energy used according to chapter 3.2.1.) per
branch can be awarded.
3.3.2 Rules for Energy Efficiency Enhancement awarding
An award for a ceramic sub branch will be given if at least 6 companies from at least 2
European countries apply within that branch. The round down quarter with the greatest
energy mitigation (according to chapter 3.2.2) of the applying companies can be
awarded.
3.4 Verification of data
Each company that wants to be awarded has to allow a verification of the reported data
by the national partner. A verification questionnaire can be found in Annex 2. In case of
data taken from an already verified EUTS report (Annex 1, case 1) a separate
verification isn’t necessary, but it is strongly recommended to check the correct transfer
of data from the EUTS report to the data collection sheet. The national partners confirm
on the award (certificate) the correctness of the reported data.

EIE/06/222/SI2.444565 CERAMIN – Public Final Report
KI Keramik-Institut GmbH, Ossietzkystr. 37a, D-01662 Meißen 18.12.09
36
4 Results of the championship
According to the rules of chapter 3 ceramic producing companies from the 6 partner
countries were invited to share their energy consumption data with the respective
partner.
Table 3 shows the number of participating companies per branch and country per 31st
of October 2009, it shows all branches that were covered and it shows the partner
countries.
The branches with the most participating companies are the pavements and wall bricks
branch as well as the refractories and tableware branch. Unfortunately there was no
reported data from Italy and only a few from Spain and France.
UK E F I D PL
Sum of
branches
Select 1 1
Masonry bricks 1 5 6
Pavement and wall bricks 9 13 2 24
Roof tiles 1 1
Refractories 2 2 1 2 7
Wall and floor tiles 1 1 1 3
Wall tiles (only) 1 1
Floor tiles (only) 0
Sanitary ware 1 1 1 3
Table ware 4 1 2 7
Technical ceramics 0
Sum of Countries 16 3 5 0 15 14 53
Table 3: Number of companies per branch and country that take part in the
CERAMIN project until 31.10.2009

EIE/06/222/SI2.444565 CERAMIN – Public Final Report
KI Keramik-Institut GmbH, Ossietzkystr. 37a, D-01662 Meißen 18.12.09
37
Table 4 shows the results of the competition. The rules for calculation of energy
mitigation are described in chapter 3.2. According to the rules, at least two years of
production of one company had to be covered. From these two years, only one result of
mitigation per company is calculated. For this reason both last columns of table 4 are
empty for the base year. The participating companies are sorted by branch and the level
of energy mitigation. Only the data of the winners of energy mitigation and absolute
energy consumption per branch are listed in table 4 (without notice of the rules of
chapter 3.3.1). The whole table of all participants will be found in Annex 3. According to
chapter 3.4. only the data of the winners are verified (proofed). All other data was not
verified initially with the exception of the heavy ceramics branches where verification
according to EUTS was available for most of the companies.
Table 4: Companies with lowest absolute energy consumption and largest energy
mitigation per ceramic sub branch.
Red bold: Energy mitigation winners
Number of
Enterprise
Number
of PlantBranch
Sum of energy
consumption [GJ]
specific
energy
use [GJ/t]
Place-
ment
absolut
Energy
mitigation
Placement
mitigation
PL PL-10 PL-10 Masonry... 1.548.350 14,02 11 2,66 1
PL PL-12 PL-12 Masonry... 65.850 0,99 1 0,18 6
PL PL-10 PL-10 Masonry... 1.509.927 16,68 12
UK 5 1 Pavement... 56.609 10,63 42 3,81 1
UK 3 1 Pavement... 21.388 4,24 32 1,63 2
UK 8 1 Pavement... 9.768 3,16 25 1,10 3
UK 1 1 Pavement... 4.024 1,37 1
UK 8 1 Pavement... 13.168 4,26 33
UK 3 1 Pavement... 35.812 5,88 39
UK 5 1 Pavement... 62.746 14,45 46
PL PL-5 PL-5-1 roof... 78.481 4,27 1 12,08
UK 9 1 refractories 90.397 16,31 14 6,27 1
PL PL-9 PL-9 refractories 225.906 4,11 4 -0,37 7
PL PL-9 PL-9 refractories 204.396 3,75 2 -0,84 8
PL PL-9 PL-9 refractories 144.576 2,90 1 not awarded, look text
UK 13 1 tiles 475.346 8,80 7 0,67 1
F B 1 tiles 349.200 5,00 1
UK 13 1 tiles 491.282 9,46 8
F A 1 sanitary... 176.090 20,79 5 3,02 1
PL PL-7 PL-7 sanitary... 118.560 10,68 1 1,03 2
UK 11 1 table... 131.907 56,35 11 13,18 1
PL PL-2 PL-2 table... 454.358 31,21 1 9,30 3
UK 11 1 table... 169.593 76,12 13

EIE/06/222/SI2.444565 CERAMIN – Public Final Report
KI Keramik-Institut GmbH, Ossietzkystr. 37a, D-01662 Meißen 18.12.09
38
Green bold: Absolute energy consumption winners
Black bold: Winner, but not awarded, because of “6 companies rule”
(Look chapter 3.3.1)
The company PL9 from the refractories branch has the lowest specific energy
consumption (SEC) in 2003. From 2003 to 2005 the SEC has increased. That might be
due to new or different products. Generally exist a strong dependency between the kind
of products and the SEC in the refractories branch, which makes it difficult to award
SEC. The consortia together with the national partner decided that no SEC-award will
be given for the refractories branch.
Table 5 lists the companies that have been awarded. Annex 4 shows an example of a
certificate.
Coincidentally when the collecting of data for table 4 was about to be completed, the
economic problems of the years 2008/2009 arose. As a result of these problems, the
willingness of companies to participate decreased in an unpredictable manner. For this
reason only very view companies were ready to give data about their own success of
energy saving to the respective project expert partners.
The consortium decided that additionally to the awarding of „Triple-E-Labels”, every
participating industry partner will receive an official document, which certifies their
participation in the CERAMIN project (2009) and allows the use of the “Triple-E” logo for
advertisement and promotion. This on the other hand will promote the „Triple-E-Label”
and its awarding procedure.

EIE/06/222/SI2.444565 CERAMIN – Public Final Report
KI Keramik-Institut GmbH, Ossietzkystr. 37a, D-01662 Meißen 18.12.09
39
Country – No. Name of Company Type of award / Branch Web
UK-1 Michelmersh Brick Group Winner absolute energy consumption /
Pavement and wall bricks branch
www.michelmersh.com
UK-5 Cheshire Brick Makers Winner energy mitigation / Pavement and
wall bricks branch
UK-3 Raeburn Brick Ltd 2nd energy mitigation / Pavement and wall
bricks branch
www.raeburnbrick.co.uk
UK-8 Phoenix Brick Company Ltd 3rd energy mitigation / Pavement and wall
bricks branch
www.bricksfromphoenix.co.uk
PL-10 Przedsiebiorstwo Ceramiki
Budowlanej PLECEWICE S.A
Winner energy mitigation / Masonry bricks http://pcb-plecewice.pl/
PL-12 Zakład Ceramiki Budowlanej
MARKOWICZE S.A.
Winner absolute energy consumption /
Masonry bricks
www.markowicze.com.pl
UK-11 Portmerion Potteries Ltd Winner energy mitigation / Tableware www.portmeirion.co.uk/
PL-2 Zaklady Porcelany Stolowej
„LUBIANA” S.A.
Winner absolute energy consumption /
Tableware
www.lubiana.com.pl
Table 5: Winners of CERAMIN

EIE/06/222/SI2.444565 CERAMIN – Public Final Report
KI Keramik-Institut GmbH, Ossietzkystr. 37a, D-01662 Meißen 18.12.09
40
5 Tutorial about energy saving
One of the main results of the CERAMIN-project is the “Tutorial about energy saving”.
When the CERAMIN project started, the idea of the tutorial was to cover the knowledge
and the experiences of the participating companies and especially the winning
companies to spread it over the whole branch. In the course of the project even before
the economical crises arose all partners had to learn that knowledge about energy
saving is part of the know-how of the companies. For that reason technologies or
experiences of energy saving are dealt confidential in nearly all cases. This behaviour
can be explained by the immense energy costs of each ceramic product. With the
arising of the economic difficulties the willingness to share knowledge decreased even
further. The consequence is that most of the recommendations or remarks collected in
the “Tutorial about energy saving” are based on remarks of the winning companies, on
general experiences and on a lot of references marked in the text and the references list
at the end of this tutorial. All knowledge were given or collected by the expert partners.
The tutorial about energy saving is divided into chapters covering the sub branches of
table 3 except refractories and technical ceramics. The refractories and technical
ceramics branch wasn’t taken into account because of its broad range of products and
technologies. For the technical ceramics branch were, in addition, no companies found
that want to share their energy data. In each of the covered sub-branches is given
advice for the technological steps
Body and raw materials
Shaping
Drying
Firing (Kiln and kiln car design, Fuel and firing technology)
The tutorial about energy saving refers to older companies and very modern ones, as
well. For that reason: Please bear in mind: Only a few recommendations of the tutorial
will fit your respective production or your needs about costs and benefits, exactly.

EIE/06/222/SI2.444565 CERAMIN – Public Final Report
KI Keramik-Institut GmbH, Ossietzkystr. 37a, D-01662 Meißen 18.12.09
41
The tutorial was translated into the languages of the CERAMIN-Partners. The tutorial is
available on http://www.ceramin.eu/Ceramin/downloads.htm in
English (Authorized by the 4 Expert-Partners, according to table 1)
Polish
French
Italian (the Italian “Tutorial about Energy saving” differs particularly from the
authorized English tutorial)
Spanish
German
6 Individual final reports from the partner countries
The Annexes 6 to 8 show the short final reports from United Kingdom, Poland and Italy.
Especially the reports from the UK and Poland confirm the general awareness of energy
consumption in their countries but they also confirm that the readiness of sharing
energy consumption data or technological know-how is low.
From Spain and France no individual short final report is available; the same applies for
Germany where this present report was written.
EIE/06/222/SI2.444565 CERAMIN – Public Final Report
KI Keramik-Institut GmbH, Ossietzkystr. 37a, D-01662 Meißen 18.12.09
42
7 Summary
The main outcome of the project is the awarding of 9 enterprises from the ceramics
branch in the categories:
Extraordinary Energy Efficient - Lowest absolute energy consumption, without
electric energy
Energy Efficiency Enhancement – Greatest energy mitigation between a base and
a comparison year
This awarding shall encourage the whole branch to decrease their energy consumption.
An example of the award is been shown in annex 4.
At the beginning of the project a survey about energy consumption of the European
ceramic industry was executed. In the result of that survey the masonry bricks branch
and the tiles branch were identified as the branches with the greatest energy
consumption, followed by other heavy ceramics branches and the refractories branch.
The main ceramic energy consumers are situated in Italy and Spain according to their
strong tile industry. The ceramic industries of Poland, Germany and the United Kingdom
are also quite great consumers compared to other European countries mainly driven by
their heavy ceramics companies.
10 different labels that have objectives similarly to the “Triple-E-Label” were examined
to adjust the rules and characteristics of the awarding procedure. The so-called
Klimahaus (http://www.klimahausagentur.it/en/casaclima/klimahauscasaclima.html:) and
the energy trophy (http://www.energytrophy.org/en-home) were used to give example
for the CERAMIN-“Triple-E-Label”.
The data to be collected from a company that wants to be awarded are fuel
consumption data and production data (without scrap) from a base year and a
comparison year (for details look chapter 3). From this data and the before agreed
calculation rules (chapter 3) an energy consumption per mass [GJ/t] is calculated and

EIE/06/222/SI2.444565 CERAMIN – Public Final Report
KI Keramik-Institut GmbH, Ossietzkystr. 37a, D-01662 Meißen 18.12.09
43
used to compare the companies within their branch. The awarding rules are also listed
in chapter 3.
In total nine certificate documents have been distributed to the national partners. Only
Polish and UK-partners were winners of the „Triple-E-Label” awarding in 2009. In four
sub branches industries partners were awarded: Three awards on the base of absolute
figures were handed out. Six awards of energy efficiency enhancement were
established.
The consortium decided that additionally to the awarding of „Triple-E-Labels”, every
participating industry partner will receive an official document, which certifies their
participation in the CERAMIN project (2009) and allows the use of the “Triple-E-Label”
for advertisement and promotion. This on the other hand will promote the „Triple-E-
Label” and its awarding procedure.
8 Prospect, „Triple-E-Label” awarding from 2010 to 2015
In total 52 industry partners from 7 sub-branches of the ceramic industry in 5 partner
countries are participating, at present state. The finalisation of the Tutorial on energy
saving, the national workshops in the partner countries and other dissemination
activities show the effect that further industry partners are interested and that, especially
in the partner countries where only little response was witnessed so far, the
development is seen more optimistic. Here more positive response is foreseen and the
„Triple-E-Label” awarding in 2010 might be of greater interest.
The course and rules of data collection during the time after the project duration are as
follows:
1. The project partners will be ready to collect data from industry partners during the
next years free of charge (2010 to 2015).
2. In autumn of the years from 2010 to 2015 each project partner reports new
companies, that want to apply (deadline: 31.10. each year)

EIE/06/222/SI2.444565 CERAMIN – Public Final Report
KI Keramik-Institut GmbH, Ossietzkystr. 37a, D-01662 Meißen 18.12.09
44
3. The calculation of energy consumption data respectively energy mitigation data and
the reporting of a new order per sub branch will be done by the KI Keramik-Institut
GmbH free of charge as well, if at least new data from 3 industry partners is
collected within one sub-branch at the deadline.
4. The results will be communicated to all partners until the 30.11. each year. Together
with the results a suggestion about awarding for the respective year will be
presented.
5. New awards can be given if rules of „Triple-E-Label” awarding described in chapter 3
are fulfilled. That means each national partner has to decide finally, whetherf a
company is awarded or not.
6. In addition to the rules of chapter 3 the awarding will only take place if the respective
company accepts an awarding fee, which has to be applied from 2010 onward. This
awarding fee is 250,- Euro per award. The fee has to be paid once per award and
before the award is handed out

EIE/06/222/SI2.444565 CERAMIN – Public Final Report
KI Keramik-Institut GmbH, Ossietzkystr. 37a, D-01662 Meißen 18.12.09
45
Annex 1: Data to be collected from companies, who want to apply for one of the „Triple-E-Labels”
COUNTRY NUMBER OF ENTERPRISE NUMBER OF PLANT (if an enterprise consists of more then one plant, and distinctive numbers of net production and energy consumption are available you should enter these data in different data records. Then the following data refer to the NUMBER OF PLANT.) DESCRIPTION OF PLANT (e.g. “whole enterprise”-if the enterprise consists of only one plant or “roof tile production”, “extruded tiles line”, “plant 2” ) YEAR OF REPORT BRANCH (choice from a list) TYPE OF YEAR OF REPORT (Base or Comp) NETTO-PRODUCTION in [t * 1000/a] TYPE OF FUEL 1 QUANTITY OF FUEL 1 in [t/a or 1000 Nm3/a] LOWER CALORIFIC VALUE 1 in [GJ/t] or [GJ/1000Nm³] ENERGY-CONSUMPTION 1 in [GJ*1000/a] -calculated TYPE OF FUEL 2 QUANTITY OF FUEL 2 in [t/a or 1000 Nm3/a] LOWER CALORIFIC VALUE 2 in [GJ/t or GJ/1000Nm3] ENERGY-CONSUMPTION 2 in [GJ*1000/a] -calculated TYPE OF FUEL 3 QUANTITY OF FUEL 3 in [t/a or 1000 Nm3/a] LOWER CALORIFIC VALUE 3 in [GJ/t or GJ/1000Nm3] ENERGY-CONSUMPTION 3 in [GJ*1000/a] -calculated TYPE OF FUEL 4 QUANTITY OF FUEL 4 in [t/a or 1000 Nm3/a] LOWER CALORIFIC VALUE 4 in [GJ/t or GJ/1000Nm3] ENERGY-CONSUMPTION 4 in [GJ*1000/a] -calculated TYPE OF FUEL 5 QUANTITY OF FUEL 5 in [t/a or 1000 Nm3/a] LOWER CALORIFIC VALUE 5 in [GJ/t or GJ/1000Nm3] ENERGY-CONSUMPTION 5 in [GJ*1000/a] -calculated

EIE/06/222/SI2.444565 CERAMIN – Public Final Report
KI Keramik-Institut GmbH, Ossietzkystr. 37a, D-01662 Meißen 18.12.09
46
QUANTITY OF ORGANIC CARBON IN THE BODY (TOC) in [t/a] ENERGY-BENEFIT from TOC in [GJ*1000/a] –calculated with a calorific value of 32,9 GJ/t[TOC] TYPE OF KILN (Choice from a list of kiln types, e.g. “roller kiln”, “tunnel kiln” or “more then one”, “not in list” ) DESCRIPTION OF THE KILN(S) (free text to describe the kiln(s) – mandatory if you have chosen for TYPE OF KILN; “more then one” or “not in list”) LAST_UPDATE_CONCERNING_ENERGY_CONSUMPTION (List of Years) MAXIMUM TEMPERATURE in [°C] TIME_COLD_TO_COLD in [h] DAYS_OF_PRODUCTION_PER_YEAR DESCRIPTION OF TECHNOLOGY (Please give a short description about the technology used in the plant)
Underlined fields are mandatory
the red marked fields define each data record
Each plant (in most cases an enterprise will just consists of one plant!) needs at least one data record with the TYPE OF YEAR OF REPORT „Base“ and one data record with the TYPE OF YEAR OF REPORT „Comp“.

EIE/06/222/SI2.444565 CERAMIN – Public Final Report
KI Keramik-Institut GmbH, Ossietzkystr. 37a, D-01662 Meißen 18.12.09
47
Annex 2: Verification questionaire

EIE/06/222/SI2.444565 CERAMIN – Public Final Report
KI Keramik-Institut GmbH, Ossietzkystr. 37a, D-01662 Meißen 18.12.09
48
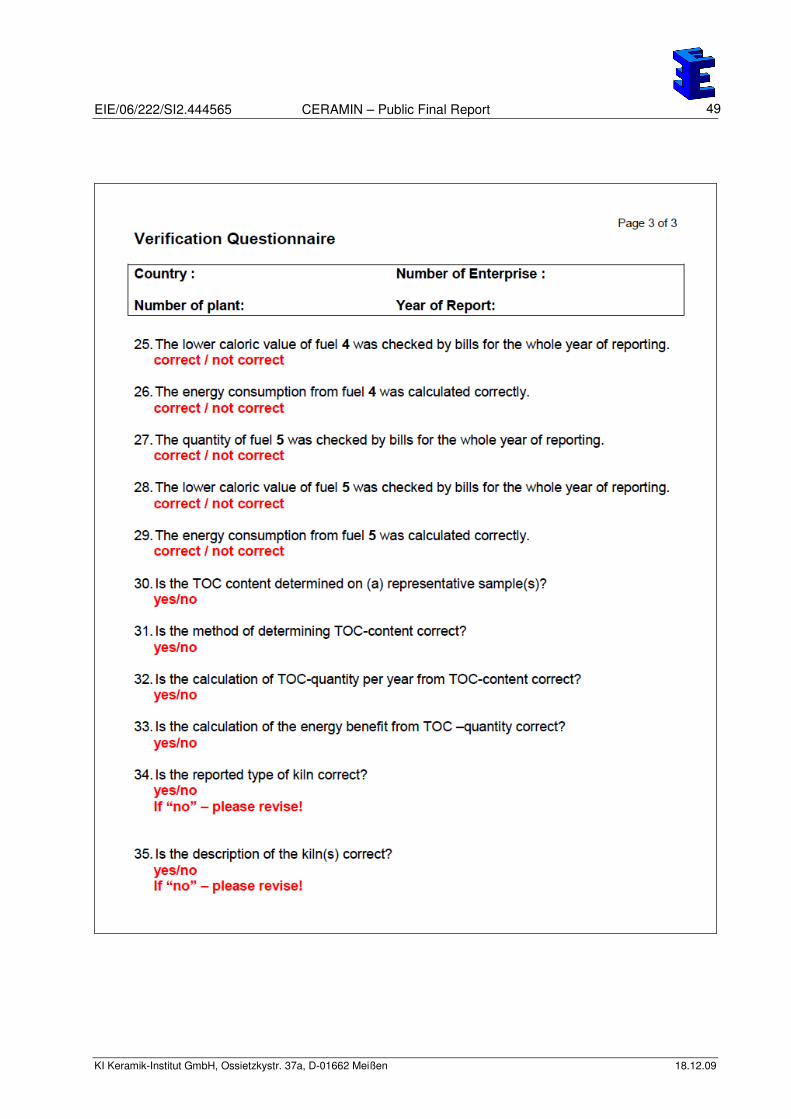
EIE/06/222/SI2.444565 CERAMIN – Public Final Report
KI Keramik-Institut GmbH, Ossietzkystr. 37a, D-01662 Meißen 18.12.09
49

EIE/06/222/SI2.444565 CERAMIN – Public Final Report
KI Keramik-Institut GmbH, Ossietzkystr. 37a, D-01662 Meißen 18.12.09
50
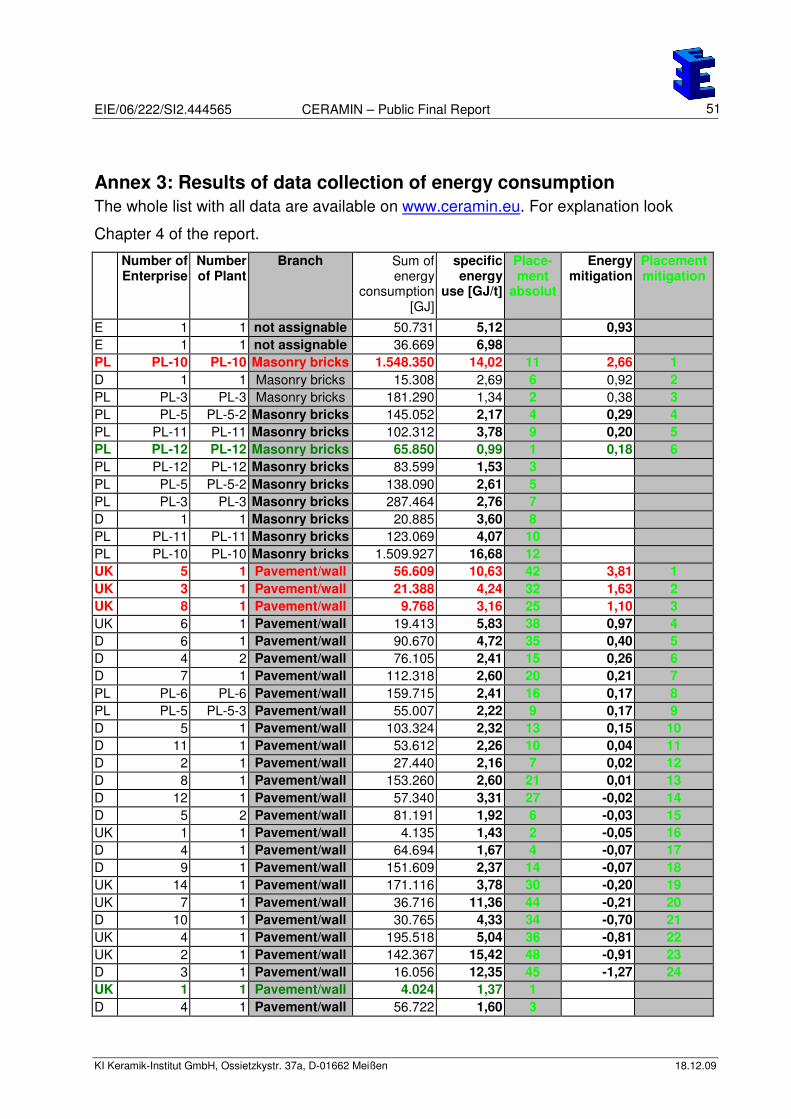
EIE/06/222/SI2.444565 CERAMIN – Public Final Report
KI Keramik-Institut GmbH, Ossietzkystr. 37a, D-01662 Meißen 18.12.09
51
Annex 3: Results of data collection of energy consumption
The whole list with all data are available on www.ceramin.eu. For explanation look
Chapter 4 of the report.
Number of Enterprise
Number of Plant
Branch Sum of energy
consumption [GJ]
specific energy
use [GJ/t]
Place-ment
absolut
Energy mitigation
Placement mitigation
E 1 1 not assignable 50.731 5,12 0,93
E 1 1 not assignable 36.669 6,98
PL PL-10 PL-10 Masonry bricks 1.548.350 14,02 11 2,66 1
D 1 1 Masonry bricks 15.308 2,69 6 0,92 2
PL PL-3 PL-3 Masonry bricks 181.290 1,34 2 0,38 3
PL PL-5 PL-5-2 Masonry bricks 145.052 2,17 4 0,29 4
PL PL-11 PL-11 Masonry bricks 102.312 3,78 9 0,20 5
PL PL-12 PL-12 Masonry bricks 65.850 0,99 1 0,18 6
PL PL-12 PL-12 Masonry bricks 83.599 1,53 3
PL PL-5 PL-5-2 Masonry bricks 138.090 2,61 5
PL PL-3 PL-3 Masonry bricks 287.464 2,76 7
D 1 1 Masonry bricks 20.885 3,60 8
PL PL-11 PL-11 Masonry bricks 123.069 4,07 10
PL PL-10 PL-10 Masonry bricks 1.509.927 16,68 12
UK 5 1 Pavement/wall 56.609 10,63 42 3,81 1
UK 3 1 Pavement/wall 21.388 4,24 32 1,63 2
UK 8 1 Pavement/wall 9.768 3,16 25 1,10 3
UK 6 1 Pavement/wall 19.413 5,83 38 0,97 4
D 6 1 Pavement/wall 90.670 4,72 35 0,40 5
D 4 2 Pavement/wall 76.105 2,41 15 0,26 6
D 7 1 Pavement/wall 112.318 2,60 20 0,21 7
PL PL-6 PL-6 Pavement/wall 159.715 2,41 16 0,17 8
PL PL-5 PL-5-3 Pavement/wall 55.007 2,22 9 0,17 9
D 5 1 Pavement/wall 103.324 2,32 13 0,15 10
D 11 1 Pavement/wall 53.612 2,26 10 0,04 11
D 2 1 Pavement/wall 27.440 2,16 7 0,02 12
D 8 1 Pavement/wall 153.260 2,60 21 0,01 13
D 12 1 Pavement/wall 57.340 3,31 27 -0,02 14
D 5 2 Pavement/wall 81.191 1,92 6 -0,03 15
UK 1 1 Pavement/wall 4.135 1,43 2 -0,05 16
D 4 1 Pavement/wall 64.694 1,67 4 -0,07 17
D 9 1 Pavement/wall 151.609 2,37 14 -0,07 18
UK 14 1 Pavement/wall 171.116 3,78 30 -0,20 19
UK 7 1 Pavement/wall 36.716 11,36 44 -0,21 20
D 10 1 Pavement/wall 30.765 4,33 34 -0,70 21
UK 4 1 Pavement/wall 195.518 5,04 36 -0,81 22
UK 2 1 Pavement/wall 142.367 15,42 48 -0,91 23
D 3 1 Pavement/wall 16.056 12,35 45 -1,27 24
UK 1 1 Pavement/wall 4.024 1,37 1
D 4 1 Pavement/wall 56.722 1,60 3

EIE/06/222/SI2.444565 CERAMIN – Public Final Report
KI Keramik-Institut GmbH, Ossietzkystr. 37a, D-01662 Meißen 18.12.09
52
D 5 2 Pavement/wall 95.331 1,88 5
D 2 1 Pavement/wall 27.442 2,18 8
D 11 1 Pavement/wall 54.716 2,30 11
D 9 1 Pavement/wall 146.616 2,30 12
PL PL-5 PL-5-3 Pavement/wall 38.293 2,47 17
D 5 1 Pavement/wall 105.437 2,54 18
PL PL-6 PL-6 Pavement/wall 170.985 2,58 19
D 8 1 Pavement/wall 192.608 2,62 22
D 4 2 Pavement/wall 81.834 2,67 23
D 7 1 Pavement/wall 119.668 2,81 24
D 12 1 Pavement/wall 55.593 3,29 26
UK 14 1 Pavement/wall 171.478 3,59 28
D 10 1 Pavement/wall 30.846 3,63 29
UK 4 1 Pavement/wall 206.573 4,23 31
UK 8 1 Pavement/wall 13.168 4,26 33
D 6 1 Pavement/wall 99.921 5,12 37
UK 3 1 Pavement/wall 35.812 5,88 39
UK 6 1 Pavement/wall 21.743 6,80 40
D 3 1 Pavement/wall 20.887 10,44 41
UK 7 1 Pavement/wall 33.227 11,15 43
UK 5 1 Pavement/wall 62.746 14,45 46
UK 2 1 Pavement/wall 135.379 14,51 47
PL PL-5 PL-5-1 roof tiles 78.481 4,27 12,08
PL PL-5 PL-5-1 roof tiles 34.822 22,38
UK 9 1 refractories 90.397 16,31 14 6,27 1
E 2 2 refractories 44.031 8,16 10 1,72 2
PL PL-4 PL-4 refractories 304.986 4,91 6 1,13 3
F D 1 refractories 50.026 10,88 11 0,51 4
E 2 1 refractories 57.675 3,77 3 0,24 5
UK 15 1 refractories 260.154 7,70 8 0,12 6
PL PL-9 PL-9 refractories 225.906 4,11 4 -0,37 7
PL PL-9 PL-9 refractories 204.396 3,75 2 -0,84 8
PL PL-9 PL-9 refractories 144.576 2,90 1
E 2 1 refractories 53.184 4,66 5
PL PL-4 PL-4 refractories 347.730 6,04 7
UK 15 1 refractories 268.268 7,82 9
F D 1 refractories 45.543 11,39 12
E 2 2 refractories 51.487 13,32 13
UK 9 1 refractories 145.421 25,72 15
UK 13 1 tiles 475.346 8,80 7 0,67 1
PL PL-1 PL-1 tiles 505.728 5,13 3 0,28 2
F C 1 tiles 212.677 8,33 5 0,13 3
F B 1 tiles 300.240 5,12 2 -0,12 4
F B 1 tiles 349.200 5,00 1
PL PL-1 PL-1 tiles 356.082 5,55 4
F C 1 tiles 196.815 8,73 6
UK 13 1 tiles 491.282 9,46 8
F A 1 sanitary ware 176.090 20,79 5 3,02 1
PL PL-7 PL-7 sanitary ware 118.560 10,68 1 1,03 2
D 13 1 sanitary ware 81.472 10,76 2 0,65 3

EIE/06/222/SI2.444565 CERAMIN – Public Final Report
KI Keramik-Institut GmbH, Ossietzkystr. 37a, D-01662 Meißen 18.12.09
53
D 13 1 sanitary ware 82.198 12,07 3
PL PL-7 PL-7 sanitary ware 138.484 14,69 4
F A 1 sanitary ware 178.351 25,33 6
UK 11 1 table ware 131.907 56,35 11 13,18 1
UK 16 1 table ware 18.788 54,46 8 12,34 2
PL PL-2 PL-2 table ware 454.358 31,21 1 9,30 3
PL PL-8 PL-8 table ware 259.203 44,57 5 4,96 4
F E 1 table ware 125.536 52,39 6 3,90 5
UK 12 1 table ware 241.809 33,13 2 1,01 6
UK 10 1 table ware 212.099 56,59 12 -2,30 7
UK 12 1 table ware 277.784 34,65 3
PL PL-2 PL-2 table ware 475.088 36,10 4
UK 10 1 table ware 263.633 54,29 7
PL PL-8 PL-8 table ware 287.050 54,50 9
F E 1 table ware 122.729 56,30 10
UK 11 1 table ware 169.593 76,12 13
UK 16 1 table ware 24.480 85,30 14

EIE/06/222/SI2.444565 CERAMIN – Public Final Report
KI Keramik-Institut GmbH, Ossietzkystr. 37a, D-01662 Meißen 18.12.09
54
Annex 4: Example of a Certificate

EIE/06/222/SI2.444565 CERAMIN – Public Final Report
KI Keramik-Institut GmbH, Ossietzkystr. 37a, D-01662 Meißen 18.12.09
55
Annex 5: Chapter “Masonry bricks” as example of “Tutorial about
energy saving”
2 Masonry bricks
2.1 Body and raw materials
Additives for improving the insulation should be also energy sources. The combustion
temperature of these additives has to overlap a broad temperature range. Waste graphite47
,
Petroleum coke17
or coal-clays19
can help you to get sintering energy up to 800°C.
Sintering additives like ashes, waste glasses, glass and mineral wools or low sintering clays
can help you to reduce the sintering temperature or to produce (dry and fire) lighter products
with same mechanical properties.47, 29, 35, 65
Shaping needs plasticity, especially for modern lattice bricks. It is necessary that the right
amount of water is used to get the correct plasticity. Saving water by using better clays that
are easy to form or adding special additives that help to get the correct plasticity is a way to
save drying energy.47,48,21,37
2.2 Shaping
It’s possible to save energy by stiff pressing. However, not all body formulations are suitable,
as sometimes the energy saving is consumed at the extruding press as electric energy and
finishing.48, 1
Try to use the shaping (extruding) temperature while entering the dryer.36, 5, 6, 26
2.3 Drying
In the ceramic industry, drying generally means the evaporation or volatilisation of physically bound
water. It is well known that water is characterised by a high specific thermal capacity (4.2 kJ/kg K) and a
very high evaporation heat (2.500 kJ/kg). These material properties inevitably cause a high-energy
consumption. The only objective can be to approach the theoretical (minimum) consumption as close as
possible. Figure 1 shows: At the moment up to 50 % of thermal energy in ceramic production is used for
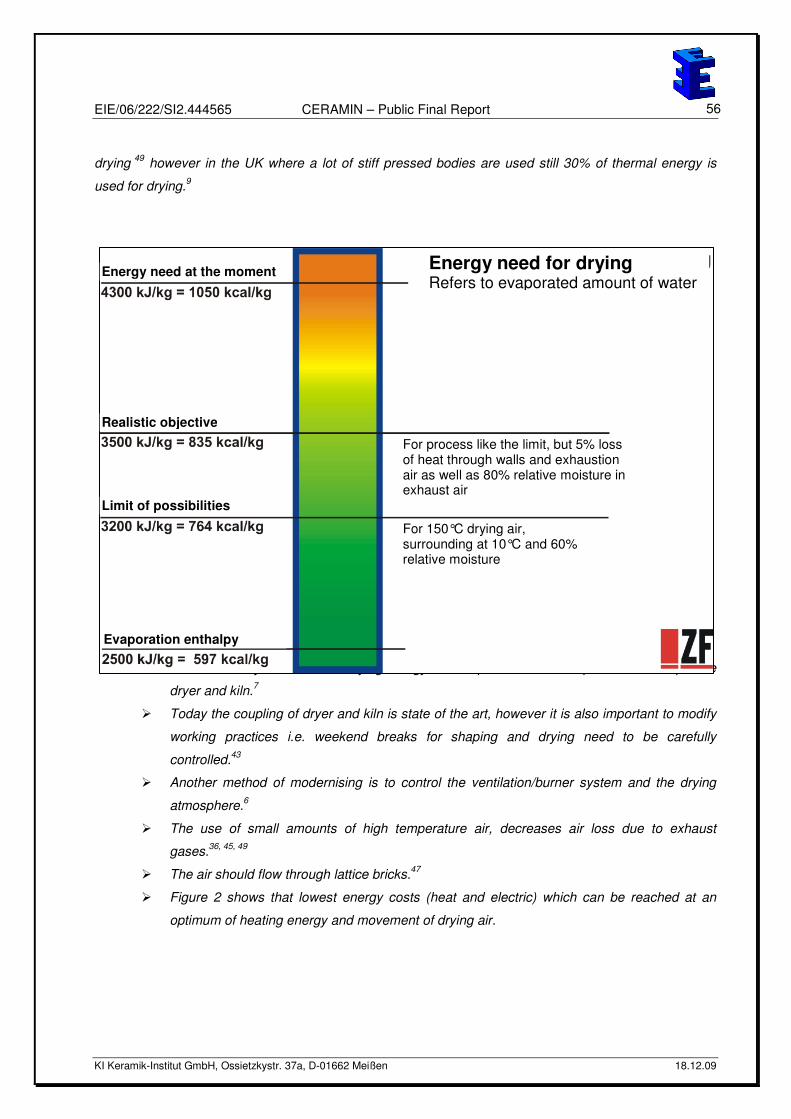
EIE/06/222/SI2.444565 CERAMIN – Public Final Report
KI Keramik-Institut GmbH, Ossietzkystr. 37a, D-01662 Meißen 18.12.09
56
drying 49
however in the UK where a lot of stiff pressed bodies are used still 30% of thermal energy is
used for drying.9
Figure 1: State of the art of drying
A common way to reduce the drying energy consumption in older companies is to couple the
dryer and kiln.7
Today the coupling of dryer and kiln is state of the art, however it is also important to modify
working practices i.e. weekend breaks for shaping and drying need to be carefully
controlled.43
Another method of modernising is to control the ventilation/burner system and the drying
atmosphere.6
The use of small amounts of high temperature air, decreases air loss due to exhaust
gases.36, 45, 49
The air should flow through lattice bricks.47
Figure 2 shows that lowest energy costs (heat and electric) which can be reached at an
optimum of heating energy and movement of drying air.
Energy need for drying Refers to evaporated amount of water
Energy need at the moment
Realistic objective
For process like the limit, but 5% loss of heat through walls and exhaustion air as well as 80% relative moisture in exhaust air
Limit of possibilities
For 150°C drying air, surrounding at 10°C and 60% relative moisture
Evaporation enthalpy

EIE/06/222/SI2.444565 CERAMIN – Public Final Report
KI Keramik-Institut GmbH, Ossietzkystr. 37a, D-01662 Meißen 18.12.09
57
Figure 2: Energy demand of heat vs. energy demand of air recirculation in dryers
The setters and the setting density should ensure that most of the surfaces are easy reached
by the drying air.5
Shorter drying times save energy.5, 6, 41, 44
To achieve the required humidity for drying avoid adding moisture and if required increase
the setting density.9
Redirecting airflows can improve consistency and reduce drying time; intermittent airflow
patterns can reduce drying time and improve yield.9.
Software to simulate the drying process. Links to control data via specialized companies are
a good way to optimise drying.36
In the case of a coupled system between dryer and kiln, the kilns energy supply and not the
dryers demand determines the energy level that the dryer gets, otherwise poor energy use in
the dryer causes a higher energy consumption for firing.36, 42
The system that connects the hot air from the kiln with the dryer should be well insulated.47
Most modern drying equipment and technology can save up to 90% of drying time compared
to conventional drying.49
Alternative drying systems are available using a steam atmosphere, this is called ‘airless
drying’ and is claimed to have reduced drying times up to 80%.63
Specific energy demand [kJ/kg water]
energy demand of air recirculation [kJ/kg water]
heat power costs

EIE/06/222/SI2.444565 CERAMIN – Public Final Report
KI Keramik-Institut GmbH, Ossietzkystr. 37a, D-01662 Meißen 18.12.09
58
Alternative I/R burner systems are available using a mesh, these can be powered by a
number of different gases are easy to control and are very energy efficient. These can be
incorporated into existing dryer cabinets.64
2.4 Firing
The specific energy consumption for sintering ceramic products depends on the required firing
temperature. The temperature is determined by the composition of the body, the processes of material
formation and the intended properties. Figure 3 shows an exponential increase of the specific demand for
energy with the temperature.
Spezifischer Energieaufwand in Abhaengigkeit von der Brenntemperatur
900 1000 1100 1200 1300 1400Brenntemperatur in C
0
5
10
15
20Spezifischer Energieaufwand in MJ/kg
Minimum Maximum
Dachziegel
Klinker
Steinzeugrohre
Sanitaerporzellan
Glattbrand Porzellan
Mauerziegel
Figure 3: Energy consumption of different ceramic products with its different firing temperatures.48
SEC vs. firing temperature
SEC in MJ/kg
firing temperature in °C
masonry bricks
roof tiles
facing bricks
stoneware pipes
sanitary ware
final firing / porcelain

EIE/06/222/SI2.444565 CERAMIN – Public Final Report
KI Keramik-Institut GmbH, Ossietzkystr. 37a, D-01662 Meißen 18.12.09
59
Figure 4: Balance of a tunnel kiln for masonry bricks (Sankey Figure) 47
Figure 4 shows the energy balance of a tunnel kiln for masonry bricks. The values of greatest energy loss
are the different exhaust air streams partly used for drying.
2.4.1 Kiln and kiln car design
There are two general ways of energy loss influenced by the design of the kiln and the kiln cars:
1. Leakages from surrounding air into the kiln
”However one of the best possibilities to save energy is still to eliminate leakages” Don Denison,
Denison Inc.21
2. Weight of kiln materials and kiln car materials that have to be heated
“Wheel flanges of kiln car wheels should in principle should be located on the outside”.2
“The kiln car decks should consist of high quality and lightweight insulating materials with a
minimum content of heavy chamotte. It is recommended that the layers from the bottom deck
to the top deck should be adapted to cope for the different respective temperature
stresses”.2, 3, 20
A picture for calculating the optimum car deck thickness can be seen in 2.
Sand seals should be designed to avoid leakages over a long time, suggestions are made in
2, 33.

EIE/06/222/SI2.444565 CERAMIN – Public Final Report
KI Keramik-Institut GmbH, Ossietzkystr. 37a, D-01662 Meißen 18.12.09
60
Try to avoid self-supporting kiln sidewalls. Such walls tend to bend towards the firing channel
because of the temperature differences over the cross section. It is important to consider the
design very carefully and have a wall sustained by the kiln roof. 2
Special designed kiln roofs avoid leakages due to heat expansion and make roof cooling
redundant.2
2.4.2 Fuel and firing technology
In the main firing zone an excess pressure of 10-15 Pa is recommended. 74
For some brick producers it is still a possibility to make energy savings by changing from
solid fuel like coal to LPG or oil which will increase the energy efficiency.51
Use of renewable energies, i.e. biogases produced by companies in their own reactors can
save costs and CO2 emissions11
; however biogases can’t cover the whole energy need of a
brick maker.47.
Increasing control of firing with new burner systems and multi zone control.33,51,34
Impulse burners are more efficient than conventional ones. 74
High velocity burners (velocity of heated gases > 100 m/s) are recommended for the
preheating zone until 700 °C. At this lower temperature heating by convection mostly takes
place. Kilns can be modernised with these modern burners, to save energy. 74
Techniques already described for drying are also important for firing: allow the hot gases
best heat transition to your working load.33,34
The combustion air should be preheated; at higher firing temperatures preheating saves
energy. The preheating should be done by using kiln exhaust air.40
Use preheated working loads from the dryer, e.g. setting pallets for drying and firing or by
direct setting on kiln cars for drying.1,23
The final development that some producers in the brick industry have used is emissivity
coatings in certain sections of the kiln to reflect the heat to the required area thus reducing
the temperature lag between ‘part’ and surrounding air. This in theory has reduced gas costs
by up to 10%.51
Reduce waste air losses by re-circulating them for heating over the whole length of kiln.33
The hot gases should pass through the holes of bricks to increase the area between load
and hot gases called ‘Perfusion firing’.47
Use heat recovery from waste gases and flue gas from post combustion.18,47

EIE/06/222/SI2.444565 CERAMIN – Public Final Report
KI Keramik-Institut GmbH, Ossietzkystr. 37a, D-01662 Meißen 18.12.09
61
Annex 6: Short final report by CERAM – United Kingdom
Review of CERAMIN work carried out by CERAM CERAM carried out a literature and internet search in an attempt to identify 2 national or
international labels concerning energy efficiency in any industry sector. Unfortunately
very little information was found in the UK apart for the carbon trust.
CERAM working in conjunction with British Ceramic Confederation (BCC) the UK trade
association for the ceramic industry collected energy consumption data for each the
Brick, Roof Tiles, Industrial Ceramics, Refractories, Tableware, Wall and Floor Tile, and
Sanitaryware sectors.
Total Energy Use kWh Sector 2002 2004 2006 Brick 4,550,630,538 4,659,605,596 4,160,949,376 Roof Tiles 396,455,569 433,223,119 365,731,802 Industrial Ceramics 323,048,779 380,824,493 364,361,643 Refractories 710,565,918 618,659,334 475,302,965 Tableware 1,160,651,290 910,745,581 641,092,910 Tiles 316,566,865 327,210,856 326,056,090 Total 8,169,192,453 7,863,288,562 6,782,313,749 CERAM also working BCC and CICS (Complete Integrated Certification Services Ltd)
both companies who also specialise in CCA (Climate Change Agreement) and EUTS
identified a number of companies in the UK, Eire and Scandinavia (the geographical
location that CERAM had to work in) to speak to with regard to attracting them as
members of the CERAMIN project.
In total 31 companies were identified across these countries covering 6 different
ceramic sectors, and 50% of these agreed to join the project. The breakdown re country
and sector is as follows:
Participated Non participation
Countries

EIE/06/222/SI2.444565 CERAMIN – Public Final Report
KI Keramik-Institut GmbH, Ossietzkystr. 37a, D-01662 Meißen 18.12.09
62
Eire 2 0 Scandinavia 0 2 UK 14 13 Sectors Bricks 9 4 Tiles 1 1 Tableware 4 6 Refractories 1 1 Sanitaryware 0 1 Roof tiles 1 2 CERAM worked with all the above participants and all of these were involved either in
CCA or EUETS hence verification was made simpler; the only change required for the
CCA companies was to remove any electricity information from their declared data.
The UK same as all the other European countries the ceramic sectors was heavily
affected by the recession. CERAM were in discussion with the partners who did not
initially participate in the project and all companies that we have been in discussion with
stated that survival in was their main priority, and all are looking for cost reductions both
in cash and resources, hence project work whether R&D or environmental is the least of
their priorities. When discussions were all held re the energy related workshop we were
told that in the current climate this was of very little interest despite the obvious energy
saving information that may result from it, however they would be interested in any
documentation that could be provided.
CERAM along with the other members of the expert group contributed to the ‘Tutorial
about Energy saving without electricity’, and a number of new or alternative processes
were put forward. Subsequently this document and general project dissemination was
carried out at CERAM before the sector technical committees. This route was chosen
as a number of workshops had previously been proposed by other sectors within the
organisation, however uptake was very poor. The final tutorial was also sent to all of the
CERAM membership (157) which is worldwide, BCC for circulation to their membership
base as well being published on the CERAM website.

EIE/06/222/SI2.444565 CERAMIN – Public Final Report
KI Keramik-Institut GmbH, Ossietzkystr. 37a, D-01662 Meißen 18.12.09
63
The dissemination to the technical committees was as follows:
Whiteware – 58
Brick sector – 6 (however these are the major companies who represent their group
members as well)
CERAM has been actively involved in all of the project meetings.

EIE/06/222/SI2.444565 CERAMIN – Public Final Report
KI Keramik-Institut GmbH, Ossietzkystr. 37a, D-01662 Meißen 18.12.09
64
Annex 7: Short final report by Institute of Glass, Ceramics, Refractory and Construction Materials – Poland
Description of action in CERAMIN project by the Institute of Glass, Ceramics, Refractory and Construction Materials
I. In the beginning of the project we collected and sent to coordinator general data of energy consumption, CO2 emission and production quantities in sub-branches of polish ceramic industry. The data was acquired by contacts with polish statistical office and emission trading office. Two examples of the plant’s CO2 emission reports (mandatory in Poland) were submitted to the CERAMIN coordinator.
II. We were establishing the close contact with industrial partners and we collected their data concerning energy use. The following working procedure has been applied:
Stage 1:
- At first stage a list of potential industrial partners has been prepared and 18 companies from various ceramic branches were chosen which represent the highest importance and scale of production. A method of an individual contact with companies was accepted since in Poland there are no associations of ceramics producers that could be helpful by influencing the company decision and play an intermediating role at the contacts
- The first contacts were the phone talks with the responsible person at companies, that earlier cooperated with the Institute. Next step was to send the official informative and invitation letters. Similar letters explaining goals and description of cooperation were submitted to companies, which had no previous cooperation contacts with us.
- 4 companies were visited by our representatives in order to present personally ideas and goals of CERAMIN projects.
- Parallel, an information action was carried out in ceramic journals. Invitation to CERAMIN and information was published in 5 journals of all-Polish range. One company (CERRAD) reported to our institute as a result of this action.
- At the first stage of finding close contacts partners, 6 companies sent back the filled questionnaires.
Stage 2:
- The second stage was begun with telephone and mail inquiries directed to companies, to which official letters were sent earlier. Also renewed official letters were sent.
- A new list of potential industrial partners was made and new attempts were made to contact new companies.
- As a result of stage II of the action, 6 new companies delivered close contact sheets

EIE/06/222/SI2.444565 CERAMIN – Public Final Report
KI Keramik-Institut GmbH, Ossietzkystr. 37a, D-01662 Meißen 18.12.09
65
- Out of 12 companies, which reported their readiness to cooperate by filling close contact sheet, 10 sent detailed data of production scale and energy consumption, 1 company has not decided because the owner still hesitates and 1 company resigned.
Stage 3:
Invitations to participate in the project along with CERAMIN handout were sent to the following Czech ceramic plants:
• Wienerberger cihlářský průmysl, a. s. Plachého 388/28, 370 46 České Budějovice
• Wienerberger ČESKÉ CIHELNY Josef Meindl, spol. s r.o. Sokolská 566, 333 44 Stod, Česká republika
• Laufen CZ V Tůních 3/1637, 120 00 Praha 2, Česká republika • Karlovarský porcelán, a.s Nova Role Tovární 242, 362 25 Nová Role • Karlovarský porcelán, a.s Concordia a.s. Sadov 119, 360 01 Sadov – Lesov Česká republika
• Karlovarský porcelán, a.s Klášterec n.O Pražská 394, 431 51 Klášterec nad Ohří • G.BENEDIKT KARLOVY VARY S.R.O 1. máje 30, 360 06 Karlovy Vary, • Porcelánová manufaktura Royal Dux Bohemia Sadová 1414, 419 42 Duchcov • Elektroporcelán Louny a.s. Postoloprtská 2685, 440 15 Louny • LASSELSBERGER, s.r.o. Adelova 2549/1, 320 00 Plzeň - Jižní Předměstí
Česká republika • LASSELSBERGER, s.r.o. RAKO a.s. Šamotka 246, 269 43 Rakovník • LASSELSBERGER, s.r.o. Chlumčanské keramické závody a.s. U Keramičky
448 334 42 Chlumčany
• LASSELSBERGER, s.r.o. Horni Briza, 330 12 Horní Bríza, Czech Republic • IDEAL STANDARD S.A. Zemska 623, 415 74 Teplice Republika Czeska
There was no one answer for these invitations!
Stage 4:
- The last attempt to contact the earlier informed potential partners and the new companies (rather small companies), because of unsatisfactory total number of industrial partners was resulted in sending the data of additional 4 enterprises.
Conclusions:
1. A considerable difficulty in successful contacting the polish companies is caused by missing of existing associations that could be an active mediator in contacts.
2. The largest difficulty was encountered in convincing the companies in usefulness of their participation and confidentiality in dealing with collected data.
3. More ready to participate are smaller firms than the large and known ones.
4. A convenient condition for collecting more data seems to be an extension of project duration.
EIE/06/222/SI2.444565 CERAMIN – Public Final Report
KI Keramik-Institut GmbH, Ossietzkystr. 37a, D-01662 Meißen 18.12.09
66
IV. The Institute organized the meeting for the project partners in Warsaw
CERAMIN 3rd Meeting, Warsaw Friday, 9th - 10th of November 2007 took place in The Institute of Glass, Ceramics, Refractory and Building Materials, Postepu Street 9, Warsaw Agenda: 9.10.2007 10:00 - Start of the Meeting 13:00 - 14:00 - Lunch break 16:00 - 16:15 - Coffee break 18:00 - End of the session 20:00 - Dinner in the restaurant in Warsaw Old Town 10.10.2007 9:00 - 14:00 - Warsaw sightseeing tour (voluntary)
V. Representatives of the Institute were participating in all partners meeting within the project and were actively participating in elaborating of the energy mitigation calculation principles.
VI. We reported the situation of ceramic industry in Poland in the context of economic crisis 2009. Few remarks from telephone and e-mail surveys with representatives of several manufactures corresponding to different branches of ceramic industry are presented below:
Pavement and wall bricks
We contacted 3 partners. None of them reported reduction of working hours, but all of them are waiting for the “building season”. Now it is very difficult to predict the level of production even in the nearest future, as a result of the impact of the crisis.
Refractories
2 partners responded to inquiries. Both factories didn’t reduce working hours so far, but the production now is 10-15% lower than in the same period of 2008. They report that the production level is closely related to steel industry orders, so the situation can change in any moment in the future. In opinion of our partners such a situation is typical in the majority of factories of polish refractory branch.
Wall and floor tiles
2 partners were inquired. In comparison to the level of production during the last year the production capacity in 2008 is only 50-60%. Only a part of technological lines are busy - some of them do not work now. Our partners expect that according to optimistic predictions their production might reach 75% of that of recent years.

EIE/06/222/SI2.444565 CERAMIN – Public Final Report
KI Keramik-Institut GmbH, Ossietzkystr. 37a, D-01662 Meißen 18.12.09
67
Tableware
1 partner was contacted. For the moment as a consequence of the crisis one furnace for porcelain firing was turned off in the factory. The present production level corresponds to 75-78% of the one of the recent years and the manufacturer expects to maintain it.
Conclusion
1. Most of the partners inquired reported a decrease of production; the values depend on the branch.
2. All partners reported that the situation is very unstable and it can change in any moment.
3. We have informed our partners about the planned meeting, but we feel that they were not very interested in the information.
VII. Organization of National Workshop held in Warsaw on 27th of April 2009 for the industrial partners.
A. Statistics of the Meeting: 1. Number of sent invitations to enterprises 46 invitations 2. Number of participants from the industry reported before the meeting 23 3. Number of participants present at the meeting 18 (from 15 plants + 5 from the Institute) 4. Number of completed questionnaires 16 5. Amount of resources sent from Institute after the meeting 11 6. During the meeting the preliminary contacts were established with 13 new plants.
B. Issues raised by participants: - Lack of comparability of different plants in one branch, such as the production of hotel porcelain (thick and heavy) and China ware (thin and light) when comparing the energy consumption per tones of product - Why project program did not take into account the consumption of electricity? - Lack of representativeness of some industries such as tiles - why this happened? - Almost all interlocutors stressed that the reduction of energy consumption is an important target at factories every day, but the budget for purchasing of new equipment and technology limits the improvement.
C. Material presented at this meeting was accepted with a great interest mainly because the problem of energy saving was presented in a complex, uniform and way for all ceramics factories using clear energy saving coefficients. The tutorial was also well evaluated by participants and was commonly taken in discussion as a base to comparison of actual technical state at factories and the tutorial recommendations
EIE/06/222/SI2.444565 CERAMIN – Public Final Report
KI Keramik-Institut GmbH, Ossietzkystr. 37a, D-01662 Meißen 18.12.09
68
VIII. We have published an short information on main aims, methods and expected results coming from the CERAMIN project as well as the invitation for new industrial partners to join CERAMIN in the following branch periodicals:
Materialy Ceramiczne, LX, 1, 2008, 51
Materialy Budowlane, 426, 2, 2008, 80
Szklo i Ceramika, 59, 1, 2008, 26-27,
Ceramika Budowlana, LVI, 1, 2008, 29-30
PRACE Instytutu Szkla, Ceramiki, Materialow Ogniotrwalych i Budowlanych, 3, 2009, 259
IX. We have published articles summarizing partial results of the research conducted within the project and selected considerations and recommendations concerning energy saving in ceramic industry, based on the Tutorial About Energy Saving in the following branch periodicals:
Szklo i Ceramika, 60, 5, 2009, 14-21,
Ceramika Budowlana, LVII, 3, 2009, 11-16
X. We plan to publish 2-3 additional articles summarizing results of the research conducted within the project.
XI. We plan to keep contact with our industrial partners and encourage them to send new data in 2010. We are also planning to organize solemn ceremony for Polish winners of the competition for the EEE label and send to all partners the certificates of their participation in the project together with the full result list of competition. We will strongly encourage them to participate at the next year competition
EIE/06/222/SI2.444565 CERAMIN – Public Final Report
KI Keramik-Institut GmbH, Ossietzkystr. 37a, D-01662 Meißen 18.12.09
69
Annex 8: Short final report by ETA – Italy
1.3 Identified problems and corrective actions taken during the action – Comment on the most
important problems during the action explaining also their impact and the corrective actions undertaken.
In Italy, since the very beginning of the project, the general approach was to try to involve the most important representatives of the Italian ceramic industry: thus, ETA, being unable to involve the industrial partners individually, contacted directly the managers of the most important and influent trade associations and research centres of the Italian ceramic industry and namely: • Dott. Luciano Galassini, Dott Andrea Canetti of Confindustria Ceramica (Confindustria
Ceramica is the main Italian Association of Italian ceramic tile, refractory material, sanitary and table ware and technical ceramic manufacturers which is responsible for representing, supporting, informing and liaising between member companies)
• Ing. Giovanni D’Anna manager of the Energy/Environment sector of ANDIL (“Associazione Nazionale degli Industriali dei Laterizi” the main Italian Association of Italian pavement bricks, wall bricks and roof manufacturers which is responsible for representing, supporting, informing and liaising between member companies).
• Ing. Guido Nassetti e Dott. Arturo Salamoni of the Italian Ceramic centre “Centro Ceramico Bologna” (CCB is the main research centre on the ceramic materials in Italy, managed by a University Consortium).
During the first six months of the project both Confindustria Ceramica and ANDIL provided the annual statistical data of the different sub-sectors’ energy consumptions and demonstrated a positive interest and availability for discussing their participation in the Ceramin Project. During the first meeting with Confindustria Ceramica organised the 21/03/2007 (Dott. Luciano Galassini, Dott Andrea Canetti) and Centro Ceramico Bologna (Ing. Nassetti), Confindustria was asked to select 15 of their associated partners to be involved in the Ceramin Project as industrial partners. Their interest in the project was positive but their main doubt, regarded the mechanism itself of participation: according to them, the definition of the performance criteria of the production processes, and therefore the EEE label, was somehow related to the quality, in terms of energy efficiency, of the selected industrial partners that agree to participate and share their data with the project partners: the competition, according to them, had the same limit because the decision to consider the 25%, in each ceramic sub branch, as deserving, is necessarily related to the overall quality of the voluntary participants. Another concern was the worthiness of the EEE label after the project completion and how it could be compared with the Ecolabel considering that all products bearing the flower have been checked by “Independent Bodies” like TÜV for complying with strict ecological and performance criteria. The outcomes of this meeting were reported to the coordinator by email the 26th of March 2007.

EIE/06/222/SI2.444565 CERAMIN – Public Final Report
KI Keramik-Institut GmbH, Ossietzkystr. 37a, D-01662 Meißen 18.12.09
70
The representative of ANDIL Ing. D’Anna, once contacted, even if positively interested, commented with a general scepticism regarding the participation of their associated partners in the Ceramin initiative: he reported that the general approach of the industrial partners was to participate in research activities promoted by the Association itself and only when a budget is foreseen for the development of the activities. With the development of the activities by the project partners a new meeting with Ing. Guido Nassetti and Dott. Arturo Salamoni of the Centro Ceramico Bologna was organised the 6th of November 2008. Confindustria did not attend being represented by the Centro Ceramico Bologna acting as their energy efficiency consultant. According to their opinion the outcomes of this meeting were: 1. The presence of other well accepted product-labels (i.e. ECOLABEL) and Eco-Management
and Audit Schemes (i.e. EMAS) based on European norms, already defining the products and the energy savings measures by using the best available technologies on the market, made, according to Confindustria, the EEE label redundant.
2. The dignity of the EEE Label was invalidated by a verification mechanism different from country to country and not managed by a single European Independent Body.
3. The awarding mechanism of the EEE label was based on the quality of the participants and it was not based on an absolute criteria so being part of the “winners” did not imply to represent the “state of the art” of the market.
4. With the decision to use the EU-ETS for the verification procedure, taken during the meeting in Paris, considering that in Italy not all the ceramic producers are forced to comply with the emission trading scheme but only the biggest ones (corresponding to only the 4% of the Italian market) and considering also that the small size companies potentially adhering to the project do not fall in the EU-ETS, a deep survey was carried out by ETA in order to verify the feasibility of this methodology. Three Italian verifiers of the EU-ETS, officially recognised by the Italian Ministry of the Environment, were contacted and three conference calls were organized with representatives of Lloyd’s Registered Quality Assurance Italy srl, PricewaterhouseCoopers S.p.a., and Ernst & Young Financial Business Advisors. The outcomes of these calls underlined the inadequacy in Italy of the EU-ETS for the Ceramin goals:
• the purchased electric energy in not considered in the emission report (in Italy the
tiles’ and refractories’ sectors have a consumption of 1.500 millions of cubic
meter/year of natural gas but also an electric energy demand of 1.800 GWh/year with
only 500 GWh/year auto-produced by CHP so, in the emission trading scheme, 1.300
GWh/year aren’t considered at all).
• Ing. Francesco Sacchetto of PricewaterhouseCoopers reported that “Companies
adhering to the Project are below the EU ETS applicability threshold. According to
Dir.2003/87/EC, an “opt-in option” exists by which entire sectors can apply for
joining the EU ETS but no chance is offered to single companies below the threshold
already belonging to trading sectors like ceramic)”.(For more detail please refer to
Annex ITA1)

EIE/06/222/SI2.444565 CERAMIN – Public Final Report
KI Keramik-Institut GmbH, Ossietzkystr. 37a, D-01662 Meißen 18.12.09
71
As discussed during the meeting in Stock on Trent the potentially interested Italian ceramic
producers have been asked to report, on voluntary basis, their data verified by a new
verification procedure set up as an alternative to the EU-ETS (CASE 2 of the “Course of data
collection”): this has inevitably increased the scepticism of the Industrial partners.
Furthermore the Centro Ceramico Bologna was not interested in covering the role of verifier,
like the Ceramin expert groups does in other European countries, for the above reported
reasons (1,2,3) and the general difficulty and visibility that the EEE Label would have if
compared with other well established labels.
• The recent economic crisis hit the ceramic tile industry: Confindustria reported that the Italian production and sales were down by 6%, the Italian market by 9%; costs have risen in 2008 (+4.6%) and a further, even if more limited, fall in production and expected personnel reduction of about 20% was expected in 2009. Energy efficiency was not a priority in this situation.
These remarks were reported in a formal letter, in Italian, by the Centro Ceramico Bologna issued after the meeting of November. The outcomes of this meeting were reported to the coordinator and the project partners during the project meeting in Florence (December 2008). (Annex ITA2) In spite of ETA’s strong commitment, de facto, the main Italian associations decided not to involve their associated partners to the championship mechanism so the first round of the awarding phase does not include any Italian industrial partners. 1.4 Activities and impact after end of the action – Give an overview on the activities planned
after the end of the action; review the short/medium/long term impact of the action; demonstrate sustainability.
In Italy the main trade associations (Confindustria Ceramica and ANDIL), although not interested to propose to their associated partners the championship mechanism, decided to present the main outcomes of the CERAMIN project: • the Italian version of the “Tutorial on energy savings” based on the English version of the
CERAMIN expert group, translated and revised by Ing. Guido Nassetti of the Centro Ceramico Bologna (CCB) in order to show the last technical solutions for the tile, refractories, and sanitary sectors, was disseminated to the entire Italian industrial world: the document was presented by the trade association responsible to about 190 associated enterprises with Confindustria Ceramica and to about 120 associated enterprises of ANDIL. (Annex ITA3)
• the first awarding, with the participation of German, French, British, and Polish enterprises was presented as a first initiatives that will be replicated in the following two years: the interested Italian industrial partners could see the E3 label, as a more solid initiative, already established in the European market and not a “feasibility study” like it could be considered before the first award came out.

EIE/06/222/SI2.444565 CERAMIN – Public Final Report
KI Keramik-Institut GmbH, Ossietzkystr. 37a, D-01662 Meißen 18.12.09
72
• The Italian workshop held the 27th of October 2009 in Florence organised with the support of Confindustria (the Florentine department) and CEF (Florentine Energy Consortium) was attended by 18 participants some of them representing the famous ceramic Florentine district (well know for the “Cotto”, pavement bricks, earthenware, and hand worked ceramics). (Annex ITA4: invitation letter, agenda, registration form, list of participants, presentation)