energy return on investment, peak oil, and the end of economic growth
TRANSCRIPT

Ann. N.Y. Acad. Sci. ISSN 0077-8923
ANNALS OF THE NEW YORK ACADEMY OF SCIENCESIssue: Ecological Economics Reviews
Energy return on investment, peak oil, and the endof economic growth
David J. Murphy and Charles A. S. HallCollege of Environmental Science and Forestry, State University of New York, Syracuse, New York
Address for correspondence: David J. Murphy, 302 Illick Hall, College of Environmental Science and Forestry, State Universityof New York, Syracuse, New York 13210. [email protected]
Economic growth over the past 40 years has used increasing quantities of fossil energy, and most importantly oil.Yet, our ability to increase the global supply of conventional crude oil much beyond current levels is doubtful,which may pose a problem for continued economic growth. Our research indicates that, due to the depletion ofconventional, and hence cheap, crude oil supplies (i.e., peak oil), increasing the supply of oil in the future wouldrequire exploiting lower quality resources (i.e., expensive), and thus could occur only at high prices. This situationcreates a system of feedbacks that can be aptly described as an economic growth paradox: increasing the oil supplyto support economic growth will require high oil prices that will undermine that economic growth. From this weconclude that the economic growth of the past 40 years is unlikely to continue in the long term unless there is someremarkable change in how we manage our economy.
Keywords: economic growth; peak oil; EROI; Hubbert; net energy
Preferred citation: David J. Murphy and Charles A. S. Hall. 2011. Energy return on investment, peak oil, and the end ofeconomic growth in “Ecological Economics Reviews.” Robert Costanza, Karin Limburg & Ida Kubiszewski, Eds. Ann. N.Y.Acad. Sci. 1219: 52–72.
Introduction
Historically, economic growth has been highly cor-related with increases in oil consumption, and, asidefrom a few short supply interruptions, oil supplieshave kept pace with growing demand. As a result,real gross domestic product (GDP) tripled in valuewhile oil consumption grew by 40% from 1970through 2008. Unfortunately, the oil world of todayis much different from the oil world over the past40 years. Numerous analyses offer evidence that weconsider quite convincing that global society is en-tering the era of peak oil,a that is, the era in whichconventional oil supply is unable to increase signif-icantly and will eventually begin to decline.1–3
Oil, more than any other energy source, is vitalto economies because of its ubiquitous applicationas fuels and feedstocks in manufacturing and in-dustrial production, as well as in transportation.
a Period in which global oil production reaches a maxi-mum.
Since 1970, spikes in the price of oil have been aroot cause of most recessions. For example, in 1973,precipitated by the Arab Oil Embargo, the price ofoil jumped from $3 to $12 a barrel (bbl) in a mat-ter of months, creating the largest recession theretosince the Great Depression. The price spike had atleast four immediate effects within the economy: (1)oil consumption declined, (2) a large proportion ofcapital stocks and existing technology became tooexpensive to use, (3) the marginal cost of produc-tion increased for nearly every manufactured good,and (4) the cost of transportation fuels increased.4
On the other hand, expansionary periods tend tobe associated with the opposite oil signature: pro-longed periods of relatively low oil prices that in-crease aggregate demand and lower marginal pro-duction costs, all leading to, or at least associatedwith, economic growth.
Numerous theories attempting to explain busi-ness cycles have been posited over the past century,each offering a unique explanation for the causesof—and solutions to—recessions, including Key-nesian theory, the Monetarist model, the Rational
doi: 10.1111/j.1749-6632.2010.05940.x52 Ann. N.Y. Acad. Sci. 1219 (2011) 52–72 c© 2011 New York Academy of Sciences.

Murphy & Hall EROI, peak oil, and the end of economic growth
Figure 1. Energy production and GDP for the world from 1830 to 2000. Data from Kremmer and Smil.5,6 (In color in Annalsonline.)
Expectations model, Real Business Cycle models,New (Neo-) Keynesian models, etc.4 Yet, for all thedifferences among these theories, they all share oneimplicit assumption: a return to a growing economy,that is, growing GDP, is in fact possible. Historically,there has been no reason to question this assump-tion, as GDP, incomes, and most other measures ofeconomic growth have in fact grown steadily overthe past century. But if we are entering an era of peakoil, then for the first time in history we may be askedto grow the economy while simultaneously decreas-ing oil consumption, something that has yet to occurwithin the United States since the discovery of oil.
ObjectivesThe primary objectives of this review are to examine(1) the degree to which abundant and inexpensiveoil is integral to economic growth, and how thefuture supply of that oil is in jeopardy; (2) the dis-course on peak oil and provide what we believe isboth novel and compelling evidence indicating thatsociety is indeed in the era of peak oil; (3) the dis-course on net energyb and discuss how searching fornew sources of oil may decrease the amount of netenergy provided to society and also exacerbate theeffects of oil depletion on the economy; and (4) how
b Energy remaining from a process after accounting forthe energy used in that process.
peak oil and net energy indicate that increasing oilsupply will require high oil prices in the future.
Economic growth and business cyclesfrom an energy perspective
Economic growth, from an energy perspective, hasmany of the same characteristics as the fundamentalgrowth process that every living creature, species,and population on earth undertakes during theirlifetime. Energy is captured by a system (the econ-omy or a creature) and allocated first to the mainte-nance (metabolism) of the system and then, if thereis energy remaining, to growth and/or reproduc-tion. For example, each of us must ingest enoughfood during the growth phases of life to pay notonly for our metabolism but also to convert someof the additional food into bone, connective tissue,etc., which is used to grow the body or create off-spring. Likewise, the economy must acquire enoughenergy to pay not only for its metabolism, for exam-ple, fighting depreciation of existing capital, but alsoto pay for the construction of replacement or, some-times, new capital. The important point here is thatthe construction of new capital, that is, economicgrowth, requires the input of “net” energy, whichis the energy beyond that required for metabolicpurposes.
By extension, for the economy to grow over timethere must be an increase in the flow of net energy
Ann. N.Y. Acad. Sci. 1219 (2011) 52–72 c© 2011 New York Academy of Sciences. 53

EROI, peak oil, and the end of economic growth Murphy & Hall
Figure 2. Correlation of YoY changes in oil consumption with YoY changes in the real GDP, for the United States from 1970through 2008. Oil consumption data from the BP Statistical Review of 2009 and real GDP data from the St. Louis Federal Reserve.7,8
and materials through the economy. Quite simply,economic production is a work process, and workrequires energy. This logic is an extension of thelaws of thermodynamics, which state that (1) energycannot be created nor destroyed, and (2) energyis degraded during any work process so that theinitial inventory can do less work. As Daly and Farleydescribe, the first law places a theoretical limit onthe supply of goods and services that the economycan provide, and the second law sets a limit on thepractical availability of matter and energy.5 In otherwords, the laws of thermodynamics state that toproduce goods and services, energy must be used,and once this energy is used it is degraded to apoint where it can no longer be reused to power thesame process again. Thus to increase productionover time, that is, to grow the economy, we musteither increase the energy supply or increase theefficiency with which we use our source energy.
This energy-based theory of economic growth issupported by data: the consumption of every ma-jor energy source has increased with GDP since themid-1800s (Fig. 1). Throughout this growth period,however, there have been numerous oscillations be-tween periods of growth and recessions. Recessionsare defined by the Bureau of Economic Researchas “a significant decline in economic activity spreadacross the economy, lasting more than a few months,normally visible in real GDP, real income, employ-
ment, industrial production, and wholesale-retailsales.”10 From 1970 until 2007, there have beenfive recessions within the United States, and exam-ining these recessions from an energy perspectiveelucidates a common mechanism underlying recentbusiness cycles: oil consumption tends to be higherduring expansions and lower during recessions, andprices tend to be lower during expansions and higherduring recessions.
Plotting the year-on-year (YoY) growth rates ofoil consumption and real GDP provides a moreexplicit analysis of the relation between economicgrowth and oil consumption (Fig. 2). About half ofthe variation in economic growth, that is, recession-ary versus expansionary periods, can be explainedby the variation in oil consumption alone. But cor-relation is not causation, and the important ques-tion is whether increasing oil consumption causeseconomic growth, or conversely, whether economicgrowth causes increases in oil consumption.
There are a myriad of publications on the topicof whether or not energy consumption causeseconomic growth.11 Unfortunately, the literature isconfounding, due mainly to two issues: energy qual-ity and substitution effects. Energy quality refers tomany things, but in the economic sense energy qual-ity pertains mainly to the utility of a fuel, which is acombination of its transportability, storability, en-ergy density, etc. Consequently, the utility of a fuel
54 Ann. N.Y. Acad. Sci. 1219 (2011) 52–72 c© 2011 New York Academy of Sciences.

Murphy & Hall EROI, peak oil, and the end of economic growth
is reflected in its price, which is why the price perenergy unit of coal is much lower than the price perenergy unit of electricity, that is, electricity isdeemed to have a higher quality. Yet despite this dif-ference in quality, most energy-economic analysesassume that a BTU of coal has the same economicutility as a BTU of electricity. Consequently, thesubstitution of high-quality energy sources, such aselectricity, for low-quality energy sources, such ascoal, is often missed.12
Cleveland et al. analyzed the impact of these twofactors on the causal relation between energy con-sumption and economic growth.12 Their results in-dicated that increases in energy consumption causedeconomic growth when they adjusted the data forquality and accounted for substitution. Other sub-sequent analyses that adjusted for energy qualitysupport the result that energy consumption causeseconomic growth.13 It is important to observe thatthe notion of causality used in this sense is not thesame as generic causality, and hence it should be in-terpreted differently. The statistical causality used inthese studies means more that “energy is a limitingfactor in economic growth” (p. 281).13,14
In sum, our analysis indicates that about 50%of the changes in economic growth over the past40 years are explained by the changes in oil con-sumption alone. In addition, the work by Cleve-land et al.12 indicates that changes in oil consump-tion cause changes in economic growth, or thateconomic growth is bound by the energy avail-able. These two points support the idea that en-ergy consumption, and oil consumption in par-ticular, is of the utmost importance for economicgrowth.
Yet, oil consumption is rarely used by neoclassi-cal economists as a means of explaining economicgrowth. For example, Knoop describes the 1973 re-cession in terms of high oil prices, high unemploy-ment, and inflation, yet omits mentioning that oilconsumption declined 4% during the first year and2% during the second year.4 Later in the same de-scription, Knoop4 claims that the emergence fromthis recession in 1975 was due to a decrease in boththe price of oil and inflation, and an increase inmoney supply. To be sure, these factors contributedto the economic expansion in 1975, but what isomitted, again, is the simple fact that lower oil pricesled to increased oil consumption enabling greatereconomic output.
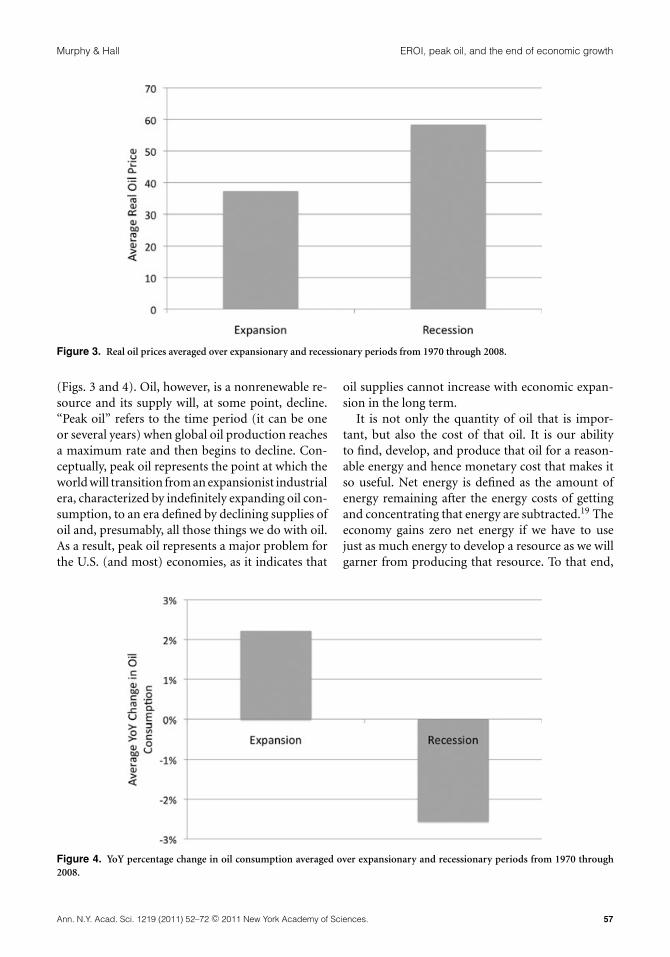
Thus, we present the hypothesis that higher oilprices and lower oil consumption are indicativeof recessions. Likewise, economic growth requiresmaintaining lower oil prices while simultaneouslyincreasing oil supply. The data support these hy-potheses: the inflation-adjusted price of oil averagedacross all expansionary years from 1970 to 2008 was$37/bbl compared to $58/bbl averaged across re-cessionary years, whereas oil consumption grew by2% on average per year during expansionary yearscompared to decreasing by 3% per year during re-cessionary years (Table 1, Figs. 3 and 4).
Although this analysis of recessions and expan-sions may seem like simple economics, that is, highprices lead to low demand and low prices lead tohigh demand, the exact mechanism connecting en-ergy, economic growth, and business cycles is a bitmore complicated. Hall et al. and Murphy and Hallstate that when energy prices increase, expendituresare reallocated from areas that had previously addedto GDP, mainly discretionary consumption, towardpaying for more expensive energy.15,16 In this way,higher energy prices lead to recessions by divert-ing money from the economy toward energy only.The data show that major recessions seem to occurwhen energy expenditures as a percentage of GDPclimb above a threshold of roughly 5.5% (Fig. 5). Itis worth noting, however, that this relation did nothold for the smaller recessions of the early 1990s and2000s. This is probably a result of the fact that thecost of oil is only one of the many possible causesof—and solutions to—recessions.
The following two questions become particularlygermane: What are the implications for economicgrowth if (1) oil supplies are unable to increase withdemand, or (2) oil supplies increase but at an in-creased price? To undertake this inquiry, we mustexamine first the current and future status of oilsupply; then, we can make inferences about whatthe future of oil supply and price may mean for eco-nomic growth. The subsequent section discusses thefuture of oil supplies, specifically how both deple-tion and high-cost oil can or are likely to impacteconomic growth.
Peak oil and net energy
Each recession and expansionary period has hadthe same energy signature: low oil consumptionand high oil price during recessions and high oilconsumption and low oil price during expansions
Ann. N.Y. Acad. Sci. 1219 (2011) 52–72 c© 2011 New York Academy of Sciences. 55

EROI, peak oil, and the end of economic growth Murphy & Hall
Table 1. Breakdown of recessions and expansionary years from 1973 through 2008, including the YoY change in oilprice, oil consumption, and real GDP
YoY change in
Oil price Oil consumption Real GDP
RecessionsThe Arab Oil Embargo, 1973 25% 6% 6%November 1973–March 1975 1974 217% −4% −1%
1975 −9% −2% 0%The Iranian Revolution, January1980–November 1982
1980 3% −7% 0%1981 −12% −6% 3%1982 −14% −5% −2%
Early 1990s, July 1990–March 1991 1990 24% −2% 2%1991 −19% −2% 0%
Dot-com and September 11th, March2001–November 2001
2001 −17% 0% 1%
Current recession, December2007–N/A
2007 8% 0% 2%2008 29% −6% 0%
Average across all recessions 21% −3% 1%Expansions
1976–1979 1976 5% 7% 5%1977 2% 6% 5%1978 −6% 2% 6%1979 103% −2% 3%
1983–1989 1983 −13% 0% 5%1984 −9% 3% 7%1985 −5% 0% 4%1986 −49% 4% 3%1987 24% 2% 3%1988 −22% 4% 4%1989 16% 0% 4%
1992–2000 1992 −6% 2% 3%1993 −14% 1% 3%1994 −9% 3% 4%1995 5% 0% 3%1996 18% 3% 4%1997 −9% 2% 4%1998 −33% 2% 4%1999 36% 3% 5%2000 54% 1% 4%
2002–2007 2002 0% 1% 2%2003 12% 1% 2%2004 29% 3% 4%2005 38% 0% 3%2006 16% −1% 3%2007 8% 0% 2%
Average across all expansions 7% 2% 4%
Sources: Energy data are from the EIA.7 GDP data are from the St. Louis Federal Exchange.7 Data on recessions arefrom the BEA.18
56 Ann. N.Y. Acad. Sci. 1219 (2011) 52–72 c© 2011 New York Academy of Sciences.
Murphy & Hall EROI, peak oil, and the end of economic growth
Figure 3. Real oil prices averaged over expansionary and recessionary periods from 1970 through 2008.
(Figs. 3 and 4). Oil, however, is a nonrenewable re-source and its supply will, at some point, decline.“Peak oil” refers to the time period (it can be oneor several years) when global oil production reachesa maximum rate and then begins to decline. Con-ceptually, peak oil represents the point at which theworld will transition from an expansionist industrialera, characterized by indefinitely expanding oil con-sumption, to an era defined by declining supplies ofoil and, presumably, all those things we do with oil.As a result, peak oil represents a major problem forthe U.S. (and most) economies, as it indicates that
oil supplies cannot increase with economic expan-sion in the long term.
It is not only the quantity of oil that is impor-tant, but also the cost of that oil. It is our abilityto find, develop, and produce that oil for a reason-able energy and hence monetary cost that makes itso useful. Net energy is defined as the amount ofenergy remaining after the energy costs of gettingand concentrating that energy are subtracted.19 Theeconomy gains zero net energy if we have to usejust as much energy to develop a resource as we willgarner from producing that resource. To that end,
Figure 4. YoY percentage change in oil consumption averaged over expansionary and recessionary periods from 1970 through2008.
Ann. N.Y. Acad. Sci. 1219 (2011) 52–72 c© 2011 New York Academy of Sciences. 57

EROI, peak oil, and the end of economic growth Murphy & Hall
Figure 5. Petroleum expenditures as a percentage of GDP and real oil price. The dotted line represents the threshold above whichthe economy moves toward recessions. Petroleum expenditures includes distillate fuel oil, residual fuel oil, motor gasoline, liquifiedpetroleum gas, and jet fuel.
energy resources that produce a high level of net en-ergy are considered to be of higher value than thosethat produce a small amount of net energy.
Since oil consumption is important for economicgrowth, understanding how both peak oil and netenergy will impact oil supply and price is importantto understanding the ability of our economy to growin the future. To that end, we will review both thetheory and current status of peak oil and net energyas they pertain to oil supply, and then discuss howboth of these may influence oil price.
Peak oilThe concept of peak oil originated from an analysisperformed by M. King Hubbert in 1956.20 Hub-bert aggregated the production profiles of individ-ual oil wells into a singular production profile foran entire oil field and found that the shape of theproduction profile could be estimated closely by abell-shaped curve, with production (commonly inunits of barrels per year) on the y-axis and time(years) on the x-axis (Fig. 6).20 The notion of peakoil is derived from this curve, which has a distinctpoint at which production is at its highest. Afterthis peak, the production of the field enters a phaseof generally irreversible decline. The concept andthe mathematics can be applied at many levels, in-cluding specific oilfields, regions, or globally. Globalpeak oil refers mainly to the peaking of global oilproduction, which is simply the aggregation of the
production profiles for all oil fields around the worldinto one production pattern over time.
It is sometimes possible, using very few parame-ters, to predict both the timing of a peak’s occurrenceand the level of production at the peak. In 1956,Hubbert20 used his model to predict that the oil pro-duction of the lower 48 United States would peakin the late 1960s or early 1970s at a rate of roughly3 billion barrels of oil (billion barrels of oil = giga-barrels of oil = Gbo) per year. Many in the indus-try claimed his predictions were ludicrous, and thatU.S. oil production would increase indefinitely. Butin fact oil production in the United States peaked in1970 at a rate of roughly 3.5 Gbo per year. Hubbert’smodel was validated, within a reasonable margin oferror, by the actual production data 14 years afterhis prediction. He later refined his model to its cur-rent form, called simply the “Hubbert Curve,” andtoday it is used commonly to predict oil productionfrom fields all over the world.
Hubbert20 predicted that peak oil for the worldwould occur around 2000 based on an estimatedultimate recoverable quantity (EUR) for global oilof 1,250 Gbo. An analysis by Deffeyes predicted thatglobal crude oil production would peak in 2003based on an EUR of 2,120 Gbo.2 Campbell estimatedthat the peak in global oil would occur in 2003,as well, but his estimate was based on an EUR of1,800 Gbo.2 Campbell and Deffeyes used modelsbased on different data sets estimating global oil
58 Ann. N.Y. Acad. Sci. 1219 (2011) 52–72 c© 2011 New York Academy of Sciences.

Murphy & Hall EROI, peak oil, and the end of economic growth
Figure 6. Hubbert curve of oil production for the world (from Hubbert).20
production and reserves, yielding the same peak yeardespite a large difference in EUR. A similar analysisby Campbell and Laherrere predicted that the peakin global oil production would occur at some pointin the decade of 2000–2009 based on an EUR ofroughly 1,850 Gbo.3 Numerous other analyses haveestimated the peak in global oil production to occurwithin the decades from 2000 to 2020.21–24
Despite these analyses, some researchers doubtthat the world is even near a peak in global oilproduction.25,26 One way to check whether a peakin oil production has occurred is to compare oilproduction data from fields around the world; amethod that is more straightforward in theory thanin practice, as the majority of global oil productionhas shifted from independent oil companies (IOCs),such as ExxonMobil, to nationalized oil companies(NOCs), such as Saudi Aramco. Today, NOCs pro-duce over half of world’s oil and control nearly 90%of the world’s oil reserves, yet NOCs are not requiredto provide reserve estimates or any data whatso-ever, and historically, much of the data that were re-ported have been suspect.27,28 In the mid-1980s, forexample, the Organization for Petroleum Export-ing Countries (OPEC) changed its policy regulat-ing production quotas so that each OPEC membercould produce oil in proportion to their reserves—that is, countries with high reserves could producemore oil. Since all of these nations had large govern-mental debts or at least expenditures, each countrywanted to sell more oil and hence was incentivizedto have higher reserves. During this same period,the reserve estimates within OPEC increased by
300 Gbo without reporting any new major discov-eries. Many analysts today still doubt the validity ofthese increases.3
Due to these inaccuracies or rather unknownssurrounding OPEC and NOC data, determining theexact year of peak oil from estimates of productionand reserves may be possible only retroactively. Butsuch a determination is inessential because oil pro-duction is likely to plateau for several years bothbefore and after the actual peak, and it is during thisperiod that oil supply may fall short of demand.29
Estimating when oil production enters this plateauera is useful, as it may be an early sign of peak oil.
There are three lines of evidence that societyappears to be at or at least approaching peak oil.These are (1) production is outpacing discoveries,as global society consumes at least two barrels ofoil for every new barrel discovered; (2) productionremained flat during a four-year period of increas-ing oil prices; and (3) most of the easy-to-find andeasy-to-produce oil has been found and produced—Ghawar in Saudi Arabia, the world’s largest oil field,was discovered in 1948 and society has yet to finda field of nearly the same caliber, despite advancesin exploration technology. Details of each of theselines of evidence follow.
The first line of evidence is related to the factthat oil production lags discoveries by roughly 10years.1,20,29 That is to say, discoveries made todaywill begin to impact oil supply in 10 years. Usingthis lag effect, Hubbert was able to predict in 1956that the peak in oil production for the lower 48United States would occur around 1970—the data
Ann. N.Y. Acad. Sci. 1219 (2011) 52–72 c© 2011 New York Academy of Sciences. 59

EROI, peak oil, and the end of economic growth Murphy & Hall
Table 2. Oil demand in 2008 and projected for 2030, according to four different sources, and the average annual rateof oil discovery
Oil Demand Average annual Projected:rate of discovery, Discovered to discovered to
2008 Projected 2030 1998–2007 consumed, 2008 consumed, 2030
Dargay and Gately 30 49 15 1–2 1–3.3IEA 30 39 15 1–2 1–2.6EIA 30 39 15 1–2 1–2.6OPEC 30 39 15 1–2 1–2.6
Note: Units for oil demand are in gigabarrels of oil.Source: Data for projected demand from Dargay and Gately,30 and data for discoveries are from Harper31 and Jackson.32
IEA, International Energy Agency; EIA, Energy Information Administration
were already in! With this in mind, we can lookat recent discoveries to make estimates of futureproduction. From 1998 to 2007, the annual rateof discovery of oil was 15 Gbo per year while theconsumption of oil in 2008 was 30 Gbo, indicatingthat in 2008 the world produced and consumed atleast 2 bbl for every barrel it found.32,33 Oil demandis projected to be 39–49 Gbo per year by 2030, and,if the rate of discoveries remains constant, the worldwill be consuming between 2.6 and 3.3 bbl of oilfor every barrel found (Table 2).30,33 From thesedata, it is clear that discoveries are being outpacedby production—a condition indicative of peak oil.
Second, from 2004 to 2008 oil production lev-eled off even while the price of oil increased from$30 to $142/bbl (Fig. 7). Basic supply and de-mand economics indicates that supply should in-crease given an increase in price; yet oil supplyremained flat. Further evidence can be seen in theestimates of OPEC spare capacity for the same timeperiod. OPEC spare capacity decreased from almost6 million barrels per day (mbpd) in 2002 to lessthan 2 mbpd in 2008 (Fig. 8).34 Thus, any increasesin global oil production that may have occurredbetween 2004 and 2008 are probably attributable tothe drawdown of OPEC spare capacity rather than
Figure 7. Global oil supply by month from January 2002 through December 2009 and monthly West Texas Intermediate (WTI)spot prices in dollars.
60 Ann. N.Y. Acad. Sci. 1219 (2011) 52–72 c© 2011 New York Academy of Sciences.

Murphy & Hall EROI, peak oil, and the end of economic growth
Figure 8. Annual estimates of OPEC spare capacity and average West Texas Intermediate (WTI) spot prices ($/bbl) from 2001through 2008. Data on OPEC spare capacity from McKinsey.34
new production coming online. Given these data,it seems reasonable to assume that stagnating oilproduction from 2004 to 2008, in an era with all-time high prices, was due to the fact that the globaloil industry was producing oil at its maximumrate—another condition indicative of peak oil.
Third, most of the easy-to-find and easy-to-produce oil has already been found and produced.3
Global oil discoveries peaked during the 1960s andhave declined steadily since (Fig. 9). In addition
to finding less oil, new discoveries are located in-creasingly in areas that are geologically harder toproduce, such as deep offshore areas. Discoveries indeepwater areas increased from under 10% of totaldiscoveries in 1990 to nearly 60% by 2005 (Fig. 10).These three lines of evidence suggest that societyis entering the era of peak oil. Note, we are sim-ply stating that the evidence indicates that oil sup-plies were constrained from 2004 to 2008, and thatthe most likely explanation is that the supply of
Figure 9. Total oil discoveries per decade from 1930 through 2007, in gigabarrels of oil (Gbo). Data from Jackson.32
Ann. N.Y. Acad. Sci. 1219 (2011) 52–72 c© 2011 New York Academy of Sciences. 61

EROI, peak oil, and the end of economic growth Murphy & Hall
Figure 10. Deepwater oil discoveries as a percentage of total discoveries from 1990 through 2005. Data from Jackson.32
conventional crude oil is nearing (or possibly past)its peak. Other explanations for the constraint in oilsupply from 2004 to 2008 is a lack of investment ininfrastructure from the oil industry, but we couldnot find much evidence to support his claim, espe-cially considering the large investments made intothe oil sands and deepwater exploration during thisperiod.
Summary of peak oil. Long-term economic growthhas been correlated with increasing oil consump-tion, but the evidence presented here indicates thatglobal society is entering an era in which prolongedincreases in the production of oil are not possible.Despite not knowing the exact date of the peak, wecan conclude with confidence that we are enteringan era of at least a constrained oil supply, based onthe three lines of evidence summarized above.
Critiques of peak oil theory and our response.There are two main criticisms of peak oil theorythat are often cited in the literature. The first assertsthat peak oil theory is fundamentally flawed becauseit assumes a fixed value for EUR when in fact theamount of EUR depends upon a number of factorsthat are not fixed, such as technology, price, andinfrastructure.25,26 The second major criticism isthat society will find substitutes for oil as oil growsscarce.26,35–37 Both of these criticisms are used by
peak oil naysayers to claim that peak oil is a redherring. We address both of these concerns in turn.
First, we cannot produce what we cannot find.Global discoveries have been in a steady decline sincethe peak in 1948, or the decadal peak in the 1960s,despite advances in technology (Fig. 9). Others ar-gue that as the price of oil increases known sourcesof oil that were previously too expensive to developwill become economical. To some extent this is true:oil sand development in Canada, for example, is ex-pensive and economically feasible at high oil pricesonly. However, the oil sands are not conventionaloil sources and are not new discoveries, and are al-ready incorporated into many models of future oilsupply.3
Even if the value for EUR is incorrect, this wouldonly delay the issue of peak oil, not change it.24
Bartlett calculates that for every additional billionbarrels of oil we find beyond two trillion barrelsdelays the peak in global oil production by only5.5 days.24 He also found that doubling the EUR (tofour trillion barrels) delays the peak by only 26 years.We came to a similar conclusion using the data fromCampbell and Laherrere.3 For example, if we assumethat the EUR is twice that assumed by Campbell andLaherrere, that is, EUR is 3,700 Gbo (an almost im-possibly large increase in EUR and one that the liter-ature has not supported), and that oil consumptiongrows by 2% per year, then global oil production
62 Ann. N.Y. Acad. Sci. 1219 (2011) 52–72 c© 2011 New York Academy of Sciences.

Murphy & Hall EROI, peak oil, and the end of economic growth
would peak in 2032 versus 2005 (Fig. 11); that is,the peak is delayed roughly 27 years. In sum, ourbest estimates place the peak within the decade of2000–2010, and even if these best estimates are faroff the mark, the peak will still occur within a fewdecades’ time.
The second critique of peak oil states that as oilbecomes scarce we can substitute toward other en-ergy sources. We argue that there is no substitute forconventional oil that is of the same quantity, quality,and available for the same price. The closest substi-tutes for conventional oil currently in large-scaleproduction are the oil sands of Canada and biofu-els, produced mainly from corn and sugarcane. Theoil sands present a vast amount of potential energy,but it is in a less accessible form than conventionaloil. The oil sands must be heated and refined justto form crude oil and then refined further to formthe various crude oil derivatives. Estimates fromCambridge Energy Research Associates show thatthe cost of production for the oil sands is roughly$85/bbl, which is more than double the average priceof oil during expansionary periods ($37/bbl).38
The usual assumption is that the oil sands will berate limited, not resource limited, because of theirlarge demands for water and natural gas and theirlarge environmental impacts.3 So, even though there
are large amounts of potential energy, productionof oil sands cannot be increased enough to offset alarge decline in conventional oil production.
Biofuels are recent plant material that has beenconverted through some combination of chemi-cal and/or thermal processes into a liquid fuel.The main fuel products from these processes arebiodiesel, or more commonly ethanol. There arenumerous reasons why alcohols do not produce asgood fuel as gasoline, and we present here two.First, the energy density of ethanol is only abouttwo-thirds that of gasoline. Second, and most com-pelling, the energy contained within the biofuelproduct is nearly the same as the energy used to pro-duce the biofuel. In other words, producing biofu-els provides roughly zero net energy to society.39–43
Oil, on the other hand, produces roughly 18 unitsof energy per unit invested, and gasoline roughly10 units per unit invested.44,45 These points indicatethat gasoline and biofuels are imperfect substitutesand place doubt on their ability to replace oil.
Another reason indicating that substituting foroil will be difficult is that it takes a very long timeto construct the infrastructure to move from onesource of primary energy to another. Marchetti an-alyzed the time it took global society to transitionfrom wood to coal and subsequently from coal to oil
Figure 11. Two estimates of global conventional oil production: the light gray estimate is based on an EUR of 1,850 Gb, and thedark gray estimate is based on an EUR of 3,700 Gb. In other words, doubling the EUR delays the peak in global oil production by27 years.
Ann. N.Y. Acad. Sci. 1219 (2011) 52–72 c© 2011 New York Academy of Sciences. 63

EROI, peak oil, and the end of economic growth Murphy & Hall
and found that it takes about a century for society toincrease its adoption of a primary energy substitutefrom 1% to 50% of market capacity.46 Thus, even ifsociety adopts alternative energy quickly, it will stilltake decades to substitute for just half of the oil usein the world.
Hirsch et al. came to a similar conclusion when ex-amining the specific strategies that the United Statesmight take to mitigate its oil dependence.47 Theyexamined numerous, large-scale methods by whichthe United States could substitute for conventionaloil, including: (1) conservation—implementinghigher efficiency energy equipment, that is, high-mileage automobiles; (2) gas-to-liquids; (3) fuelswitching to electricity; and (4) coal liquefaction.Their main conclusion is that “waiting until worldoil production peaks before taking crash programaction leaves the world with a significant liquid fueldeficit for more than two decades”(p. 59).47
In sum, neither changing the EUR used in peak oilanalysis nor trying to substitute for oil repeals thegeneral argument put forth by peak oil theorists,that is, peak oil will restrict the supply of oil in thenear future.
Energy return on investment and net energyThe following discussion of net energy is an ex-tension of the third main point from the peak oilsection: how a shift from easy-to-access oil to hard-to-access oil is changing the net energy deliveredto society and how this may exacerbate the effectsof peak oil on economic growth. Howard Odumnoted that “the true value of energy to society isthe net energy” (p. 220).19 But the impacts of netenergy on peak oil and economic growth are oftenoverlooked and/or misunderstood. Fundamentally,net energy measures the useful energy for society,expanding the supply of net energy aids economicgrowth while decreasing the supply of net energyconstricts economic growth.
There has been a surge recently in the amountof literature published related to net energy, drivenmainly by escalating oil prices from 2004 to 2008and the subsequent growth in the alternative energymarket.16 Most studies use a statistic related to netenergy called energy return on investment (EROI),c
c Energy produced from an energy extraction process di-vided by the energy used in extraction.
which is defined as the gross energy produced di-vided by the energy invested to produce the grossenergy and is sometimes referred to as net energyratio or energy return on energy investment.16 EROIis calculated as follows:
EROI = Gross Energy Produced
Energy Invested to get that Energy(1)
Net energy is calculated as
Net Energy = Gross Energy Produced
− Energy Invested to get that Energy(2)
The most important mathematical distinction be-tween EROI and net energy is that EROI is a unitlessratio used to compare outputs to inputs while netenergy is a finite amount of energy with a definedunit. It is also important, at this point, to note thedifference between primary energy sourcesd and en-ergy carriers (adapted from Ref. 48).e A primary en-ergy source is an energy source that exists in natureand can be used to generate energy carriers (e.g.,solar radiation, fossil fuels, or waterfalls). An energycarrier is a vector derived from a primary energysource (e.g., electricity, gasoline, or steam).48 Thus,the calculation of EROI must use energy inputs andoutputs in units assigned to energy carriers.
There is a clear trend in the literature on EROI ofglobal oil production toward lower EROIs. Gagnonet al. report that the EROI for global oil extrac-tion declined from 36:1 in the 1990s to 18:1 in2008.44 This downward trend results from at leasttwo factors: First, increasingly supplies of oil origi-nate from sources that are inherently more energyintensive to produce, simply because firms developcheaper resources before expensive ones. For exam-ple, in 1990 only 2% but by 2005 60% of discoverieswere located in ultradeepwater locations (Fig. 10).Second, enhanced oil recovery techniques are beingimplemented increasingly in the world’s largest con-ventional oil fields. For example, nitrogen injectionwas initiated in the once supergiant Cantarell fieldin Mexico in 2000, which boosted production for4 years, but since 2004, production from the field
d Physical energy sources that exist in nature and thatare used to generate energy carriers (e.g., solar radiation,crude oil, coal, natural gas, and waterfalls).e Energy vectors derived from primary energy sources(e.g., electricity, gasoline, and steam).
64 Ann. N.Y. Acad. Sci. 1219 (2011) 52–72 c© 2011 New York Academy of Sciences.

Murphy & Hall EROI, peak oil, and the end of economic growth
has declined precipitously (Fig. 12). Although en-hanced oil recovery techniques increase productionin the short term, they also increase significantly theenergy inputs to production, offsetting much of theenergy gain for society.
Declining EROIs mean that more energy is re-quired to get energy, and therefore the amount ofnet energy provided to society from an oil field de-creases. Take, for example, the following two hy-pothetical societies (Figs. 13A and 13B). Society Ahas an energy source that can be extracted at anEROI of 18. Society B has an energy source thatcan be extracted at an EROI of 1.2. In this exam-ple both societies extract 100 units of energy, butdue to the different EROIs with which that energyis extracted, the amount of net energy provided tosociety is much different. Society A must invest sixunits of energy to maintain the energy investmentsneeded to extract 100 units of energy, while SocietyB must invest 80 units of energy. The end result isthat Society A has 96 units of net energy to allocateto whichever means it desires, while Society B hasonly 20 units of net energy. The relation betweennet and gross energy is summarized in equations 3–5 (equations 4 and 5 adapted from Refs. 49 and 50):
Gross Energy Produced = Net Energy
+ Investment Energy(3)
Net Energy = Gross Energy ∗ [(EROI − 1)/EROI)
(4)
Gross Energy = Net Energy/[(EROI − 1)/EROI)(5)
Another way to examine these scenarios is to lookat how much gross energy must be extracted tomaintain a constant supply of net energy to soci-ety. To supply society with 100 units of net energy,through an extraction process that has an EROI of18, society would need to extract 106 units of grossenergy (Fig. 14A). Six units are used to maintainthe investments associated with energy extraction.To deliver the same amount of net energy from aprocess with an EROI of 1.2, society would need toproduce 600 units of gross energy (Fig. 14B). Mostof the gross energy produced (500 units) is neededto maintain the investments associated with energyextraction. But all of the investment, both monetaryand energy, is nonetheless needed to maintain theflow of energy that society needs. Thus, those whoargue that we should be running our energy econ-omy on, for example, corn-derived ethanol with anEROI of 1.2 need to think of these implications.
Declining EROIs exacerbate oil depletion by re-quiring an acceleration of the extraction of resourcesto simply offset a decline in EROI. For example, let’sassume that today’s oil is produced at an EROI of18:1. That means that of the 30.8 Gb of gross oil pro-duced in 2008, 29.1 Gb were delivered to society as“net oil,” using equation 4 to calculate the amountof net oil given gross oil and EROI. Let’s also assumethat the world has roughly 925 Gb of oil remaining
Figure 12. Production from the Cantarell oil field in the Mexican Gulf of Mexico. Source: Energy Information System, FederalGovernment of Mexico, published on 7/27/09. http://graphics.thomsonreuters.com/ce-insight/CANTARELL.pdf.
Ann. N.Y. Acad. Sci. 1219 (2011) 52–72 c© 2011 New York Academy of Sciences. 65

EROI, peak oil, and the end of economic growth Murphy & Hall
Figure 13. The flow of energy from the point of extraction to society accounting for the energy cost of extraction. Values werecalculated using equation 4, assuming 100 units are extracted at an EROI of 18 for A and 1.2 for B.
(50% of the EUR of 1,850 Gb).3 If society were tomaintain that rate of consumption of oil (29.1 Gb),then we would have 30 years of conventional oil re-maining (925/30.8). However, if the EROI were todecrease by half (9), then we would have only 27
years remaining (925/34.6), due to the lower EROI,the gross amount of oil extracted must increase tomaintain a constant amount of net energy deliveredto society. Or, if the EROI were to decrease to 3:1,then we would have only 20 years of conventional
Figure 14. The flow of energy from the point of extraction to society accounting for the energy cost of extraction. Values werecalculated using equation 5, assuming that 100 units are delivered to society, and the energy source is extracted at an EROI of 18for A and 1.2 for B.
66 Ann. N.Y. Acad. Sci. 1219 (2011) 52–72 c© 2011 New York Academy of Sciences.

Murphy & Hall EROI, peak oil, and the end of economic growth
oil remaining, at current levels of consumption(925/46.2). If consumption of conventional oil in-creases we will exhaust our remaining crude oil sup-plies even faster.
Summary of net energy. Both the literature anddata indicate that the EROI for global oil produc-tion is declining. According to the algebraic relationdescribed in equations 3–5, maintaining the flowof net energy to society given declining EROIs willrequire an increase in the extraction of gross en-ergy, accelerating the depletion of oil. This meansthat it will be very difficult to offset peak oil byfinding and developing new, low EROI fields be-cause new fields must produce enough oil to notonly match the depletion of the existing field stockbut also to overcome the decline in EROI. As a re-sult, we have anywhere between 20 and 30 years ofconventional oil remaining at current levels of con-sumption, depending upon the average EROI of oilproduction.
The depletion of conventional oil will most likelyfollow an exponential decline, as peak oil the-ory suggests, taking much longer for productionto completely exhaust supplies.3 Nonetheless, theconditions described herein will not change as oilproduction declines, that is, new sources of oil willbe harder to produce on average leading to lowernet energy gain per field.
Peak oil, net energy, and oil price
The analyses presented in this review indicate thateconomic growth over the past 40 years has requiredboth an increasing oil supply and also a relativelylow oil price. So far the discussion has focused al-most exclusively on the supply side of this argument,concluding that over the past 40 years oil prices re-mained relatively low, due in part to the fact thatthere were amply supplies of high EROI oil availablefor extraction. Society is entering the era of peak oiland the supply of conventional oil (high EROI) hasor will plateau and eventually decline. In additionthe EROI of oil production is declining, requiringmore energy just to offset the declining amount ofenergy. Thus, low EROI oil indicates that there willbe high oil prices in the future.
Forecasting the price of oil, however, is a muchmore difficult endeavor as oil price depends, in the-ory, on the supply and demand for oil at a given mo-ment in time. What we can examine with some ac-curacy is the cost of production of various sources ofoil, in order to calculate the price at which differenttypes of oil resources become economical (Fig. 15).In theory, if the price of oil is below the cost of pro-duction, then most producers will cease operation.If we examine the cost of production in the areasin which we are currently discovering oil, hence theareas that will provide the future supply of oil, we
Figure 15. Estimations of the cost of oil production for various locations and types of resources around the world. Data fromCERA.38
Ann. N.Y. Acad. Sci. 1219 (2011) 52–72 c© 2011 New York Academy of Sciences. 67

EROI, peak oil, and the end of economic growth Murphy & Hall
can calculate a theoretical floor price below whichan increase in oil supply is unlikely.
Roughly 60% of the oil discoveries in 2005 werein deepwater locations (Fig. 10). Based on estimatesfrom CERA,38 and the cost of developing that oil isbetween $60 and $85/bbl depending on the specificdeep water province. Oil prices therefore, at a min-imum, must exceed roughly $60/bbl to support thedevelopment of even the best deepwater resources.The average price of oil during recessionary periodshas been $57/bbl, so it seems that increasing oil pro-duction in the future will occur only at recessionaryprices. All of this indicates that an expensive oil fu-ture is necessary if we are to produce the remainingoil resources, and, as a consequence, the economicgrowth witnessed by the United States and globeover the past 40 years will be difficult to realize inthe future.
Since EROI is a measure of the efficiency withwhich we use energy to extract energy resourcesfrom the environment, it can be used as a roughproxy to estimate whether the cost of productionof a particular resource will be high or low. Forexample, the oil sands have an EROI of roughly3:1, whereas the production of conventional crudeoil has an average EROI of 18:1. The production
costs for oil sands are roughly $85/bbl comparedto $20/bbl for Saudi Arabian conventional crude.38
As we can see from these data there is an inverserelation between EROI and price, indicating thatlow EROI resources are generally more expensive todevelop whereas high EROI resources are generallyinexpensive to develop (Fig. 16). As oil productioncontinues, we can expect to move further toward theupper right of Figure 16.
Summary
The main conclusions to draw from this discussionare that (1) over the past 40 years, economic growthhas required increasing oil production; (2) thesupply of high EROI oil cannot increase muchbeyond current levels for a prolonged period oftime; (3) the average global EROI of oil productionwill almost certainly continue to decline as wesearch for new sources of oil in the only placeswe have left—deep water, arctic, and other hostileenvironments; (4) we have globally roughly 20–30years of conventional oil remaining at currentrates of consumption and current EROIs, andeven less if oil consumption increases and/or EROIdecreases; (5) increasing oil supply in the future
Figure 16. Oil production costs from various sources as a function of the EROI of those sources. The dotted lines represent thereal oil price averaged over both recessions and expansions during the period from 1970 through 2008. EROI data for oil sandscome from Murphy and Hall, the EROI values for both Saudi Crude and ultradeep water were interpolated from other EROI data inMurphy and Hall, data on the EROI of average global oil production are from Gagnon et al., and the data on the cost of productioncome from CERA.16,38,44
68 Ann. N.Y. Acad. Sci. 1219 (2011) 52–72 c© 2011 New York Academy of Sciences.

Murphy & Hall EROI, peak oil, and the end of economic growth
will require a higher oil price because mostly onlyhigh-cost resources remain to be discovered; and(6) using oil-based economic growth as a solutionto recessions is untenable in the long term, as boththe gross and net supplies of oil has or will begin,at some point, an irreversible decline.
Synthesis
We can divide the oil age into three eras, each witha distinct model of economic production driven bythe availability of inexpensive oil. The three eras are(1) prepeak, (2) peak, and (3) postpeak, and we willdescribe each in turn (Fig. 17).
The prepeak era is defined by exponentially in-creasing supplies of oil, which is the era from oildiscovery in 1861 through the peak in oil discov-eries in the 1960s (i.e., prepeak = 1861–1969). Oildiscoveries continually outpaced production dur-ing this era, and the discoveries that were made hadvery high EROIs. In fact, the EROI of oil productiondid not change significantly during this era. For ex-ample, the average EROI of the East Texas Oil Field,discovered in 1930, was probably comparable to thatof Ghawar, discovered in 1948. And since increasingdemand for oil was met with oil supplies from thesehigh EROI resources, the inflation-adjusted priceof oil over the period of 1861–1969 remained low:$23/bbl (in 2008 dollars) on average.
Abundant, inexpensive oil led to a model of eco-nomic growth during the prepeak era that can be de-scribed by the following cycle of events (Fig. 18): (1)increasing oil consumption led to economic growthand an increasing demand for oil; (2) increasingdemand for oil led to increasing production of oil;initially oil came from high EROI sources; therefore,the cost of production remained low during this pe-riod, depressing oil price; and (3) low oil prices ledto increasing oil consumption and higher economicoutput and the cycle began again. This cycle con-tinued indefinitely as long as all oil was cheap toproduce, which was the case until the supply of oilbecame constrained or the EROI of oil declined sig-nificantly, both of which occurred during the sub-sequent peak era.
The peak era began after the peak in global dis-coveries (1970) and continues through the peakin global production (sometime between 2000 and2020). Although discoveries had peaked during the1960s, the production of oil continued to increase,though at a slower rate, during this era due to the factthat more oil was discovered than produced duringthe prepeak era. Thus, the peak era can be describedas beginning during an era of diminishing marginalreturns to production and ending after the peak inproduction.
In addition to a dwindling number of discov-eries, the EROI of the discoveries that were made
Figure 17. Division of the age of oil into three eras.
Ann. N.Y. Acad. Sci. 1219 (2011) 52–72 c© 2011 New York Academy of Sciences. 69

EROI, peak oil, and the end of economic growth Murphy & Hall
Figure 18. Prepeak model of economic growth.
after the 1960s tended also to be lower. Prud-hoe Bay, for example, was discovered in 1968 butproduction did not begin until the Alaska pipelinewas finished nearly a decade later. Although Prud-hoe Bay had vast reserves, it was certainly morecostly to develop than East Texas because of pipelineconstruction, among other expenses. In the 1980s,the United States began to rely increasingly on im-ported oil, adding transportation costs and foreignlevies to the total cost of the U.S. oil supply. To-day, we are expanding production to ultradeep wa-ter and to unconventional sources of oil, both ofwhich have much higher costs. Since the costs haveincreased since 1970, predictably, so has the price.The average inflation-adjusted price of oil from 1970through 2008 was $43/bbl, almost double the previ-ous era. In other words, it was not the depletion of oilper se, but the depletion of high EROI oil that con-tributed to an increase in the price of oil over the longterm.
Due, apparently, to the depletion of high EROIoil, the economic model for the peak era, that is,roughly 1970–2020, is much different than the pre-peak model and can be described by the followingfeedbacks (Fig. 19): (1) economic growth increasesoil demand; (2) higher oil demand increases oil pro-
duction from lower EROI resources; (3) increas-ing extraction costs leads to higher oil prices; (4)higher oil prices stall economic growth or cause eco-nomic contractions; (5) economic contraction leadsto lower oil demand; and (6) lower oil demand leadsto lower oil prices, which spur another short bout ofeconomic growth until this cycle repeats itself. Thissystem of insidious feedbacks is aptly described as agrowth paradox: maintaining business as usual eco-nomic growth will require the production of newsources of oil, yet the only sources of oil remainingrequire high oil prices, thus hampering economicgrowth.
The growth paradox leads to a highly volatileeconomy that oscillates frequently between expan-sion and contraction periods, and as a result, theremay appear to be numerous peaks in oil production.In terms of business cycles, the main difference be-tween the pre and peak era models is that businesscycles appear as oscillations around an increasingtrend in the prepeak model while during the peakera model they appear as oscillations around a flattrend. Colin Campbell referred to this as an undu-lating plateau.51
We predict that business cycles in the postpeakera, that is, the period when oil production decreases
Figure 19. Peak era model of the economy.
70 Ann. N.Y. Acad. Sci. 1219 (2011) 52–72 c© 2011 New York Academy of Sciences.

Murphy & Hall EROI, peak oil, and the end of economic growth
on average year after year (2020+), will appear asoscillations around a declining trend. It is difficultto predict what the economic model of the post-peak era will look like, but it will undoubtedly besimilar to the peak era model, as oil production andthe EROI of oil production will both continue todecline.
It is important to emphasize that these models as-sume that society will continue to pursue business-as-usual economic growth, that is, the models as-sume that businesspersons will continue to assumethat oil demand will continue to increase in thefuture. The model also ignores the increasingly im-portant and intricate role that debt accumulationhas in the greater energy economy, or the role thateconomies of scale may play when transitioningfrom a mature fossil fuel industry to an immaturerenewable energy industry.
But what if economic growth was no longerthe goal? What if society began to emphasizeenergy conservation over energy consumption?Unlike oil supply, oil demand is not governed bydepletion, and incentivizing populations to makeincremental changes that decrease oil consumptioncan completely alter the relation between oil andthe economy that was described in the aforemen-tioned models. Decreasing oil consumption in theUnited States by even 10% would release nearly 2million barrels of oil onto the global oil markets eachday.
For the economy of the United States and al-most every other nation, the prospects for future,oil-based economic growth are bleak. Maintainingthe status quo of growth economics based on an oilenergy base is simply not possible for more than adecade or two at most, presuming that trade linesand international politics remain amenable. For theUnited States, which is currently in the deepest re-cession since the Great Depression, it seems highlyunlikely that oil production can increase enough, fora long enough period of time, to grow the economyfrom this recession, let alone any future recessions.Furthermore, even if oil production can increase inthe near term, the price of oil needed to maintainthat production will be high enough on its ownto incite a recession. Taken together, it seems clearthat the economic growth of the past 40 years willnot continue for the next 40 years unless there issome remarkable change in how we manage oureconomy.
Acknowledgments
Many thanks to Tim Volk, Chris Nelder of GetRe-alList, Jim Hansen, and two anonymous reviewersfor many helpful comments on early drafts of thiswork.
Conflicts of interest
The authors declare no conflicts of interest.
References
1. Deffeyes, K.S. 2001. Hubbert’s Peak: The Impending WorldOil Shortage. Princeton University Press. New Jersey.
2. Campbell, C.J. 1997. The Coming Oil Crisis. Multi-SciencePublishing Company and Petroconsultants. Essex, UK.
3. Campbell, C.J. & J.H. Laherrere. 1998. The end of cheap oil.Sci. Am. 278: 78–83.
4. Knoop, T.A. 2010. Recessions and Depressions: UnderstandingBusiness Cycles. Praeger. Santa Barbara, CA.
5. Kremmer. 2010. Historic population and GDP data.http://www.historicalstatistics.org/ (accessed November 24,2010).
6. Smil, V. 2010. Energy Transitions: History, Requirements,Prospects. Praeger. Santa Barbara, CA.
7. Federal, R. 2009. St. Louis Federal Reserve. http://research.stlouisfed.org/fred2/series/CPIAUCNS (accessedMarch 15, 2009).
8. Hayward, T. 2010. BP Statistical Review of World Energy.British Petroleum. London, UK.
9. Daly, H.E. & J. Farley. 2003. Ecological Economics: Principlesand Applications. Island Press. Washington, DC.
10. NBER. 2010. US Business Cycle Expansions and Con-tractions. National Bureau of Economic Research.http://www.nber.org/cycles/cyclesmain.html (accessed July10, 2010).
11. Karanfil, F. 2009. How many times again will we examinethe energy-income nexus using a limited range of traditionaleconometric tools? Energy Policy 37: 1191–1194.
12. Cleveland, C.J., R.K. Kaufmann & D.I. Stern. 2000. Aggre-gation and the role of energy in the economy. Ecol. Econ. 32:301–317.
13. Stern, D.I. 2000. A multivariate cointegration analysis of therole of energy in the US macroeconomy. Energy Econ. 22:267–283.
14. Stern, D.I. 1993. Energy use and economic growth inthe USA, a multivariate approach. Energy Econ. 15: 137–150.
15. Hall, C.A.S., R. Powers & W. Schoenberg. 2008. Peak oil,EROI, investments, and the economy in an uncertain future.In Biofuels, Solar and Wind as Renewable Energy Systems:Benefits and Risks. D. Pimentel, Ed.: 109–132. Springer. TheNetherlands.
16. Murphy, D.J. & C.A.S. Hall. 2010. Year in review—EROIor energy return on (energy) invested. Ann. N.Y. Acad. Sci.1185: 102–118.
17. EIA. 2009. Energy Information Administration. http://tonto.eia.doe.gov/dnav/pet/pet˙cons˙top.asp (accessed Oc-tober 21, 2009).
Ann. N.Y. Acad. Sci. 1219 (2011) 52–72 c© 2011 New York Academy of Sciences. 71

EROI, peak oil, and the end of economic growth Murphy & Hall
18. BEA. 2009. Bureau of economic analysis. http://www.bea.gov/industry/gpotables/gpo action.cfm?anon=865 (ac-cessed July 12, 2009).
19. Odum, H.T. 1973. Energy, ecology, and economics. Ambio2: 220–227.
20. Hubbert, M.K. 1956. Nuclear energy and the fossil fuels.Spring Meeting of the Southern District Division of Pro-duction, San Antonio, Texas.
21. Edwards, J.D. 1997. Crude oil and alternate energy produc-tion forecasts for the twenty-first century: the end of thehydrocarbon era. Bull. Am. Assoc. Pet. Geol. 81: 1292–1305.
22. Ivanhoe, L.F. 1997. King Hubbert—updated. Colo. Sch.Mines 97: 1–8.
23. MacKenzie, J.J. 1996. Oil as a finite resource: when is globalproduction likely to peak? World Resources Institute. Wash-ington, DC.
24. Bartlett, A.A. 2000. An analysis of U.S. and world oil pro-duction patterns using Hubbert-style curves. Math. Geol. 32:1–17.
25. Lynch, M.C. 2002. Forecasting oil supply: theory and prac-tice. Q. Rev. Econ. Finance 42: 373–389.
26. Lomborg, B. 2001. Running on empty. The Guardian, August16.
27. Heinberg, R. 2003. The Party’s Over. New Society Publishers.Gabriola Island, BC, Canada.
28. Downey, M. 2009. Oil 101. Wooden Table Press. New York.29. Hirsch, R.L. 2008. Mitigation of maximum world oil pro-
duction: shortage scenarios. Energy Policy 36: 881–889.30. Dargay, J.M. & D. Gately. 2010. World oil demand’s shift
toward faster growing and less price-responsive productsand regions. Energy Policy 38: 6261–6277.
31 Harper, F. 2004. Oil Peak—A Geologist’s View. Energy Insti-tute. London, UK.
32. Jackson, P.M. 2009. The Future of Global Oil Supply. Cam-bridge Energy Research Associates. Cambridge, MA.
33. Intenational Energy Agency 2009. World Energy Outlook2009.
34. McKinsey. 2009. Averting the Next Energy Crisis: The DemandChallenge. McKinsey Global Institution. New York.
35. Barnett, H. & C. Morse. 1963. Scarcity and Growth: TheEconomics of Natural Resource Availability. Johns HopkinsUniversity Press. Baltimore.
36. Nordhaus, W.D. & J. Tobin. 1973. Is growth obsolete. InThe Measurement of Economic and Social Performance, Stud-ies in Income and Wealth. M. Moss, Ed.: 509–532. NEBR.Cambridge, MA.
37. Solow, R.M. 1974. The economics of resources or the re-sources of economics. Am. Econ. Rev. 64: 1–14.
38. CERA. 2008. Ratcheting Down: Oil and the GlobalCredit Crisis. Cambridge Energy Research Associates.Cambridge, MA.
39. Murphy, D.J., C.A.S. Hall & B. Powers. 2011. New perspec-tives on the energy return on (energy) investment (EROI) ofcorn ethanol. Environment, Development and Sustainability12: 179–202.
40. Farrell, A.E., R.J. Plevin, B.T. Turner, et al. 2006. Ethanol cancontribute to energy and environmental goals. Science 311:506–508.
41. Hammerschlag, R. 2006. Ethanol’s energy return on invest-ment: a survey of the literature 1990—present. Environ. Sci.Technol. 40: 1744–1750.
42. Patzek, T. 2004. Thermodynamics of the corn-ethanol bio-fuel cycle. Crit. Rev. Plant Sci. 23: 519–567.
43. Pimentel, D. & T.W. Patzek. 2005. Ethanol production us-ing corn, switchgrass, and wood; biodiesel production usingsoybean and sunflower. Nat. Resour. Res. 14: 65–76.
44. Gagnon, N., C.A.S. Hall & L. Brinker. 2009. A prelim-inary investigation of the energy return on energy in-vested for global oil and gas extraction. Energies 2: 490–503.
45. Cleveland, C. 2005. Net energy from the extraction of oiland gas in the United States. Energy 30: 769–782.
46. Marchetti, C. 1977. Primary energy substitution models: onthe interaction between energy and society. Technol. Forecast.Soc. Change 10: 345–356.
47. Hirsch, R.L., R. Bezdek & R. Wendling. 2005. Peaking ofWorld Oil Production: Impacts, Mitigation, and Risk Man-agement . SAIC. McLean, VA. pp. 1–91.
48. Giampietro, M. & K. Mayumi. 2010. Assessing the qualityof alternative energy sources: energy return on investmentand the metabolic pattern of societies and energy statistics.ICTA Technical Report.
49. Giampietro, M. & K. Mayumi. 2008. Complex systems think-ing and renewable energy systems. In Biofuels, Solar andWind as Renewable Energy Systems: Benefits and Risks. D.Pimentel, Ed.: 173–214. Springer. New York.
50. Giampietro, M. & K. Mayumi. 2009. The Biofuel Delu-sion: The Fallacy Behind Large-Scale Agro-Biofuels Produc-tion. Earthscan Research. London, UK.
51. Campbell, C. 2005. The dawn of the second half of the age ofoil. ASPO News Letter. http://www.peakoil.ie/newsletter/479(accessed July 7, 2010).
72 Ann. N.Y. Acad. Sci. 1219 (2011) 52–72 c© 2011 New York Academy of Sciences.