energy return on investment for aquaponics: case studies ... · energy return on investment for...
TRANSCRIPT
Vol.:(0123456789)1 3
Biophys Econ Resour Qual (2017) 2:3 DOI 10.1007/s41247-017-0020-5
ORIGINAL PAPER
Energy Return on Investment for Aquaponics: Case Studies from Iceland and Spain
Reynir Smari Atlason1 · Ragnar Ingi Danner2 · Runar Unnthorsson3 · Gudmundur Valur Oddsson3 · Fernando Sustaeta4 · Ragnheidur Thorarinsdottir5
Received: 28 November 2016 / Accepted: 23 February 2017 / Published online: 16 March 2017 © Springer International Publishing Switzerland 2017
system as fertilizer for plants. In this paper, we analyse the operational performance of three aquaponic systems. Two systems were located in Iceland, and one in northern Spain. We also analyse the energy output with respect to edible protein contents. After 10 years of partially simulated oper-ation, the EROI of the Hondarribia, Sudarvogur and Akur systems was 0.055:1, 0.016:1 and 0.106:1, respectively. Our results indicate that aquaponic operations benefit from operating within a greenhouse and that direct electricity consumption is the largest energy input in the aquaponics systems. The aquaponics systems studied returned one half to one tenth the EROI as compared to conventional fisher-ies or aquaculture.
Introduction
Humans have moved away from being hunter-gatherers to food producers. We are no longer dependent to the same extent on external factors on what we can eat. This change in behaviour has, in recent decades, been driven by the use of fossil fuels where larger quantities of food are being produced in a relatively shorter timespan. In fact, the rela-tion between human well-being in general and energy use has been demonstrated in quite some detail (Pimentel and Pimentel 2007; Lambert et al. 2014). It is known that the standard of living has been raised by the use of depletable fossil fuels (Pimentel and Pimentel 2007). However, as the global population grows, the need for food increases. For example, the production of fish is expected to increase by 19% from the period 2012–2014 to 2024 (OECD/FAO 2015). Most of this increase is expected to be a result of increased aquaculture production. The Food and Agricul-ture Organization of the United Nations (FAO) expects that aquaculture contributes 96 Mt to the global 191 Mt fish
Abstract Energy use in food production is linked to envi-ronmental impact, as most agricultural practices are reliant on fossil fuels. It is therefore of importance to locate food production methods that are less energy intensive than cur-rent methods and are also less polluting. Energy return on investment (EROI) is the ratio between the energy used to construct and maintain a given energy production system, against the energy that is provided by the system. Aqua-ponic systems have environmental benefits over conven-tional aquaculture systems as the waste is used within the
* Reynir Smari Atlason [email protected]
Ragnar Ingi Danner [email protected]
Runar Unnthorsson [email protected]
Gudmundur Valur Oddsson [email protected]
Fernando Sustaeta [email protected]
Ragnheidur Thorarinsdottir [email protected]
1 Faculty of Engineering, Department of Technology and Innovation, University of Southern Denmark, Odense M, Denmark
2 Faculty of Life and Environmental Sciences, University of Iceland, Sturlugata 7, 101 Reykjavik, Iceland
3 Faculty of Industrial Engineering, Mechanical Engineering and Computer Science, University of Iceland, Hjardarhagi 6, 107 Reykjavik, Iceland
4 Breen, Breeded in Green Ltd., Barcelona, Spain5 Faculty of Civil and Environmental Engineering, University
of Iceland, Hjardarhagi 6, 107 Reykjavik, Iceland

Biophys Econ Resour Qual (2017) 2:3
1 3
3 Page 2 of 12
production by 2024. According to the FAO, aquaculture production surpassed conventional fisheries in raw output for the first time between 2012 and 2014. Global consump-tion of fish per capita per year is also expected to increase from 19.7 kg in 2012 in to 21.5 kg in 2024. Future con-sumption of fish will inevitably depend heavily on aqua-culture (OECD/FAO 2015). This reliance on aquaculture is closely connected to the increase in global fish consump-tion since the late 1990s. Figure 1 demonstrates that fish consumption has grown proportionally with global popula-tion until around 1995 where an increase in fish production is shown clearly.
To avoid over exploitation of the most common wild fish species, other methods need to be used for fish production. Aquaculture has been shown to be suitable for high output production but has various impact on the natural environ-ment. This is especially the case for offshore aquaculture production where two-way interactions between the pro-duction system and the environment are numerous. Off-shore aquaculture systems modify the surrounding natural habitats, soil, water, landscape, and wildlife (Dosdat 2002). Aquaculture can not only help relieve pressure on fish stocks, but also put pressure on surrounding ecosystems. Fish is a desired product for its energy content, but moreo-ver for its high protein content. As protein is a sought-after source, it is valuable to examine which production method provides the highest protein and energy yield. Such infor-mation should prove valuable for decision makers as it can serve as a guide to which production technology should be promoted and eventually used to supply protein and energy in food form to societies. It is the intention of this paper to shed light on the energy intensity of fish production using aquaponic technologies. To do this, the energy return on investment (EROI) methodology was used where three sys-tems were analysed: two in Iceland and one in Spain. These locations were chosen because of good access to real data and operational experience. Two methods were used in this paper, the first estimates all energy as equal in inputs and outputs. We then use a method, perhaps more suitable to
EROI studies on food production, which estimates only the protein energy from the food product: the edible pro-tein energy return on investment (epEROI) (Hamilton et al. 2013). The EROI methodology is in line with the method-ology used in Life Cycle Assessment (LCA), where LCA focuses on environmental impact of systems, while EROI focuses on energy efficiency. Similar data are gathered in EROI and LCA calculations, whereas subsequent compu-tations differ. Similar studies were conducted by Vázquez-Rowe et al. (2014), Hamilton et al. (2013) and Pracha and Volk (2011), where the edible protein EROI (epEROI) was demonstrated and calculated. The findings of this paper can assist policymakers when constructing policies regard-ing food production. This is of particular importance when multiple types of energy are available within a region. The paper can also serve producers of fish considering alterna-tive production methods which may potentially be more energy efficient depending on location.
Aquaponics
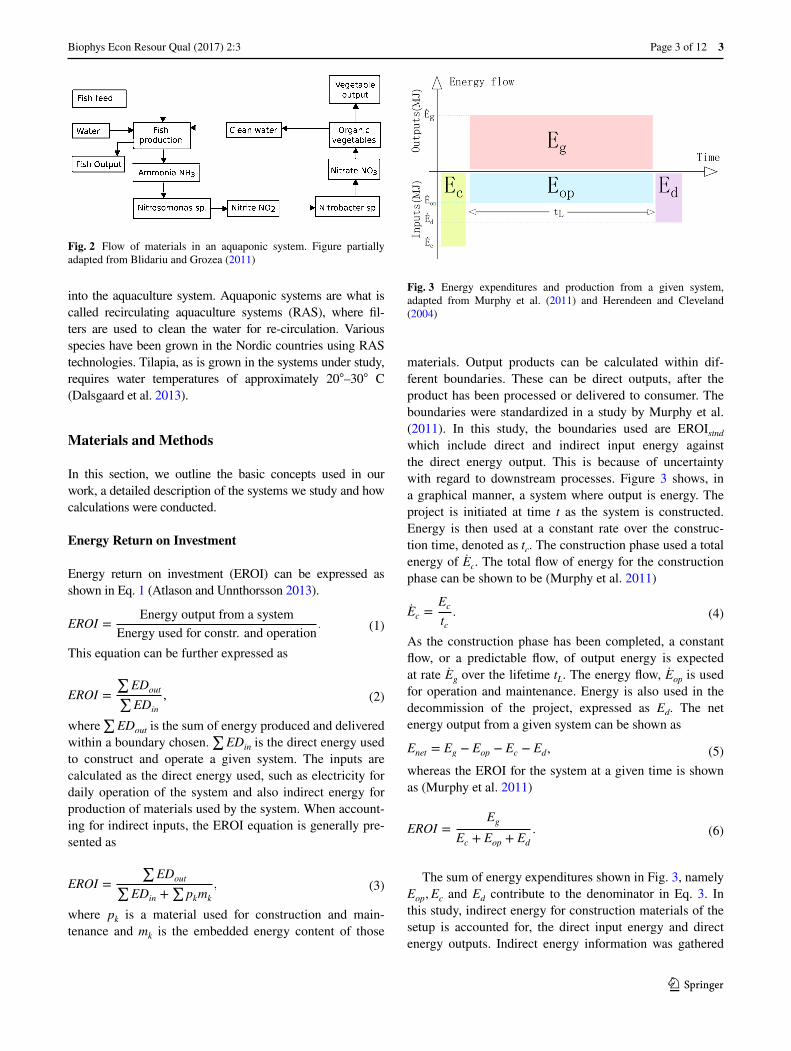
The term aquaponics is used to describe combined systems of aquaculture and hydroponics. The method has received increased interest recently due to its potential for improve-ments with regard to sustainability (Thorarinsdottir et al. 2015; Goddek et al. 2015). Aquaculture is the practice of producing aquatic animals and plants, especially fish, in ponds, tanks or containers (Blidariu and Grozea 2011). Hydroponics are systems where plants are produced with-out the need for soil. Aquaponic systems attempt to solve the negative effects of aquaculture and hydroponics sys-tems (Blidariu and Grozea 2011). Hydroponics also require expensive nutrients and flushing of the systems can lead to issues regarding waste disposal. Aquaculture systems need to be constantly cleaned, a process where nutrient-rich water is disposed of and replaced with fresh water. In aquaponic systems, nutrient-rich water from the aquacul-ture is deliberately used as nutrient for the hydroponic sys-tem. This not only eliminates the disposal problem of the aquaculture system but also eliminates the feedstock prob-lem for the hydroponic system (Blidariu and Grozea 2011). This circular flow is shown in Fig. 2.
Ammonia, along with faeces, uneaten food etc., accumu-late in aquaculture systems. Such accumulation is toxic for fish. Using a biofilter, the ammonia is oxidized to nitrite, and subsequently to nitrate. Ammonia and nitrite are toxic to fish in small concentration. Nitrate on the other hand can be tolerated in higher levels. The conversion from ammonia to nitrite and nitrate, respectively, is carried out by the bacte-ria Nitrosomonas species and Nitrobacter species. Having a nitrate-rich solution, a suitable fertilizer is available for plant production. The excess water from the hydroponic system has lower nitrate levels, therefore ready to be recirculated
Fig. 1 Global fish catchments (y-axis on the left) and human popula-tion (y-axis on the right) (OECD 2015)
Biophys Econ Resour Qual (2017) 2:3
1 3
Page 3 of 12 3
into the aquaculture system. Aquaponic systems are what is called recirculating aquaculture systems (RAS), where fil-ters are used to clean the water for re-circulation. Various species have been grown in the Nordic countries using RAS technologies. Tilapia, as is grown in the systems under study, requires water temperatures of approximately 20◦–30◦ C (Dalsgaard et al. 2013).
Materials and Methods
In this section, we outline the basic concepts used in our work, a detailed description of the systems we study and how calculations were conducted.
Energy Return on Investment
Energy return on investment (EROI) can be expressed as shown in Eq. 1 (Atlason and Unnthorsson 2013).
This equation can be further expressed as
where ∑
EDout is the sum of energy produced and delivered within a boundary chosen.
∑
EDin is the direct energy used to construct and operate a given system. The inputs are calculated as the direct energy used, such as electricity for daily operation of the system and also indirect energy for production of materials used by the system. When account-ing for indirect inputs, the EROI equation is generally pre-sented as
where pk is a material used for construction and main-tenance and mk is the embedded energy content of those
(1)EROI =Energy output from a system
Energy used for constr. and operation.
(2)EROI =
∑
EDout∑
EDin
,
(3)EROI =
∑
EDout∑
EDin +∑
pkmk
,
materials. Output products can be calculated within dif-ferent boundaries. These can be direct outputs, after the product has been processed or delivered to consumer. The boundaries were standardized in a study by Murphy et al. (2011). In this study, the boundaries used are EROIstnd which include direct and indirect input energy against the direct energy output. This is because of uncertainty with regard to downstream processes. Figure 3 shows, in a graphical manner, a system where output is energy. The project is initiated at time t as the system is constructed. Energy is then used at a constant rate over the construc-tion time, denoted as tc. The construction phase used a total energy of Ec. The total flow of energy for the construction phase can be shown to be (Murphy et al. 2011)
As the construction phase has been completed, a constant flow, or a predictable flow, of output energy is expected at rate Eg over the lifetime tL. The energy flow, Eop is used for operation and maintenance. Energy is also used in the decommission of the project, expressed as Ed. The net energy output from a given system can be shown as
whereas the EROI for the system at a given time is shown as (Murphy et al. 2011)
The sum of energy expenditures shown in Fig. 3, namely Eop,Ec and Ed contribute to the denominator in Eq. 3. In this study, indirect energy for construction materials of the setup is accounted for, the direct input energy and direct energy outputs. Indirect energy information was gathered
(4)Ec =Ec
tc.
(5)Enet = Eg − Eop − Ec − Ed,
(6)EROI =Eg
Ec + Eop + Ed
.
Fig. 2 Flow of materials in an aquaponic system. Figure partially adapted from Blidariu and Grozea (2011)
Fig. 3 Energy expenditures and production from a given system, adapted from Murphy et al. (2011) and Herendeen and Cleveland (2004)

Biophys Econ Resour Qual (2017) 2:3
1 3
3 Page 4 of 12
from the inventory of carbon and energy (ICE) published by the sustainable energy research team at the University of Bath (Hammond and Jones 2008). Energy contents of vari-ous food products was gathered through the nutrient value database provided by the U.S. Department of Agriculture (USDA 2015). To estimate the calorific value of the feed, information was gathered from several sources. First, infor-mation from the producer of the feed in use in the systems was studied. Then, three studies outlining energy content of fish feed were used as a complementary material (Cuzon 1985; Einen and Roem 1997; Refstie et al. 1998). To cal-culate the edible protein energy return on investment of the different tilapia systems, only the energy content of the pro-tein content is evaluated as an output. Of raw tilapia, 20% is assumed to be protein (USDA 2015). The protein is also estimated to contain 16.73 MJ/kg (WHO 1991). The equa-tion to calculate the edible protein energy return on invest-ment (epEROI) is therefore as follows:
where ∑
Tmass is the total mass of tilapia output from a given system and Pcont is the protein content of a given fish species, raw.
Characterization of the Studied Systems
In this section, the three aquaponic systems used for the EROI calculations are briefly described. Two small systems are located in Iceland, while a larger system is located in Hondarribia, Spain.
Hondarribia System
The aquaponic system located in Hondarribia was designed and constructed by Breen aquaponic technolo-gies, Spain. The system produces on average 2 t of tila-pia, 230 kg of lettuce, 250 kg of tomatoes, 2 kg basil, 3
(7)epEROI =
∑
Tmass ∗ Pcont ∗ 16.73∑
EDin +∑
pkmk
,
kg parsley, 20 kg chili pepper and 10 kg of peppers annu-ally. Also, 875 kg of vermicompost is produced. The system manages to keep its waste to a bare minimum, where the total mass of sludge is converted into compost. Energy for heating the system is excluded, as it manages to use waste heat from a co-generation system.
No synthetic fertilizers are used within the Hondar-ribia system. Fresh water is gathered using rain water. On average, 10% of the water within the system is renewed weekly. This results in approximately 9 m3 of new water every month. Table 1 demonstrates the mass of materi-als used in the Hondarribia system. Figure 4 shows the system constructed in Hondarribia. Figure 5 depicts sche-matically how the system operates. One can see that water outputs from the tilapia are fed into a tank of Australian lobster culture. The lobster consumes uneaten food from the tilapia, delivering cleaner water. The lobster serves more as a water filter than a food source. The lobster is in small quantities and is not calculated as an output from the system. The Hondarribia system is located in a green-house, allowing for the natural environment to provide lighting and heating.
Fig. 4 The aquaponic system installed in Hondarribia by Breen aquaponic systems
Fig. 5 A schematic description of the Hondarribia system
Biophys Econ Resour Qual (2017) 2:3
1 3
Page 5 of 12 3
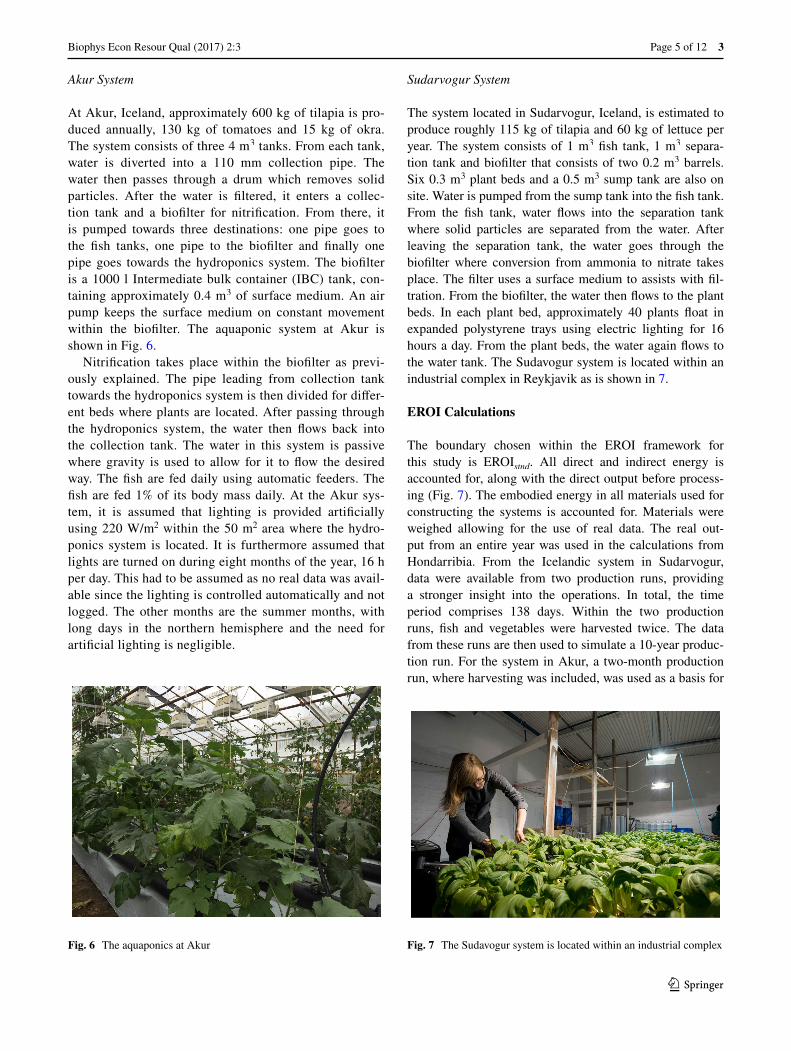
Akur System
At Akur, Iceland, approximately 600 kg of tilapia is pro-duced annually, 130 kg of tomatoes and 15 kg of okra. The system consists of three 4 m3 tanks. From each tank, water is diverted into a 110 mm collection pipe. The water then passes through a drum which removes solid particles. After the water is filtered, it enters a collec-tion tank and a biofilter for nitrification. From there, it is pumped towards three destinations: one pipe goes to the fish tanks, one pipe to the biofilter and finally one pipe goes towards the hydroponics system. The biofilter is a 1000 l Intermediate bulk container (IBC) tank, con-taining approximately 0.4 m3 of surface medium. An air pump keeps the surface medium on constant movement within the biofilter. The aquaponic system at Akur is shown in Fig. 6.
Nitrification takes place within the biofilter as previ-ously explained. The pipe leading from collection tank towards the hydroponics system is then divided for differ-ent beds where plants are located. After passing through the hydroponics system, the water then flows back into the collection tank. The water in this system is passive where gravity is used to allow for it to flow the desired way. The fish are fed daily using automatic feeders. The fish are fed 1% of its body mass daily. At the Akur sys-tem, it is assumed that lighting is provided artificially using 220 W/m2 within the 50 m2 area where the hydro-ponics system is located. It is furthermore assumed that lights are turned on during eight months of the year, 16 h per day. This had to be assumed as no real data was avail-able since the lighting is controlled automatically and not logged. The other months are the summer months, with long days in the northern hemisphere and the need for artificial lighting is negligible.
Sudarvogur System
The system located in Sudarvogur, Iceland, is estimated to produce roughly 115 kg of tilapia and 60 kg of lettuce per year. The system consists of 1 m3 fish tank, 1 m3 separa-tion tank and biofilter that consists of two 0.2 m3 barrels. Six 0.3 m3 plant beds and a 0.5 m3 sump tank are also on site. Water is pumped from the sump tank into the fish tank. From the fish tank, water flows into the separation tank where solid particles are separated from the water. After leaving the separation tank, the water goes through the biofilter where conversion from ammonia to nitrate takes place. The filter uses a surface medium to assists with fil-tration. From the biofilter, the water then flows to the plant beds. In each plant bed, approximately 40 plants float in expanded polystyrene trays using electric lighting for 16 hours a day. From the plant beds, the water again flows to the water tank. The Sudavogur system is located within an industrial complex in Reykjavik as is shown in 7.
EROI Calculations
The boundary chosen within the EROI framework for this study is EROIstnd. All direct and indirect energy is accounted for, along with the direct output before process-ing (Fig. 7). The embodied energy in all materials used for constructing the systems is accounted for. Materials were weighed allowing for the use of real data. The real out-put from an entire year was used in the calculations from Hondarribia. From the Icelandic system in Sudarvogur, data were available from two production runs, providing a stronger insight into the operations. In total, the time period comprises 138 days. Within the two production runs, fish and vegetables were harvested twice. The data from these runs are then used to simulate a 10-year produc-tion run. For the system in Akur, a two-month production run, where harvesting was included, was used as a basis for
Fig. 6 The aquaponics at Akur Fig. 7 The Sudavogur system is located within an industrial complex

Biophys Econ Resour Qual (2017) 2:3
1 3
3 Page 6 of 12
the calculations. To see the development of the systems in time, it was assumed that the systems would operate for 10 years without any major maintenance or incidents, keep-ing a constant output from their base year. It was assumed that electricity and feed consumption would also be kept constant. Heating for all systems is excluded for different reasons in every case. The Hondarribia system uses waste heat from generators for heating. The use of this waste heat is excluded in this study. Also, the Akur and Sudavogur systems uses hot water from the abundant renewable geo-thermal resources in their vicinity for heating. Geothermal resources are in this study assumed to be a public good as they are non-rivalrous, especially in Iceland (Simon 2007). However, if energy used for heating would be included, the EROI results would likely decline to some extent. Public or common goods such as sunlight or wind energy are gener-ally not included in EROI calculations and will therefore be excluded in this study. As the protein content is of high importance, the edible protein energy return on investment is calculated. This method assumes that the output is only the energy content of the protein. The protein energy con-tent is assumed to be 16.73 MJ/kg for tilapia (Tyedmers 2004; WHO 1991).
Results
The total input energy used for the system in Hondarribia was 230,234 MJ. Of that, the system used 22,400 kWh (80,640 MJ) of electricity annually. The output from the system was 8380 MJ and is assumed to be kept constant. The majority of output energy was in the form of tilapia, or 8034 MJ. After one year of operation, the system has an EROI of 0.036:1. As the original investment energy is only consumed in the beginning of the lifetime, the EROI improves as the system operates for longer. It is assumed that only electricity and feed are needed for the operation of the plant. The EROI of the Hondarribia system therefore reached 0.055:1 10 years in the future, approaching its pla-teau of diminishing returns. It can be seen that the limit for the Hondarribia system is around 0.06:1. This development is shown in Fig. 8 and Table 2.
The distribution of inputs for the Hondarribia system is shown in Fig. 9. One can see that electricity consumption contributes the most to the inputs, followed by the feed and PVC pipes. After operating for 10 years, the electricity con-sumption grows even further.
EROI for the Sudarvogur system after one year of operation was 0.012:1. After operating for 10 years, the system reached an EROI of 0.016:1. The development of the Sudarvogur system can be compared to the Hondar-ribia system in Fig. 8. This difference in EROI results can be linked to the relatively high use of electricity in the
Sudarvogur system, where 8427 kWh were used over a period of one year. This is a quarter of the usage by the Hondarribia system, even though the Sudarvogur system is much smaller when looking at energy outputs. The rea-son for this is the location of the systems. The Hondarribia system is located within a greenhouse in northern Spain, where relatively little additional lighting is required and sunlight is abundant for the plants. The Sudarvogur sys-tem is located inside an industrial complex where lighting mostly needs to be provided for, hence the heavy usage of electricity. The relatively heavy usage of electricity is fur-ther visualized in Fig. 10.
The Akur system is located within a greenhouse. It is less reliant on artificial lighting than the Sudarvogur sys-tem. Electricity consumption at the Akur system was 9267 kWh, followed by the construction of the system, in par-ticular the use of wood used to construct plant beds (499 kg). The output from the system over the first year was calculated to be 3678.4 MJ and is considered to be kept constant for the continuous operation. A dissemination of the energy used in the construction of the Akur system is shown in Fig. 11. The EROI from the Akur system was 0.085 after the first year of operation. After 10 years of operation, the system has returned an EROI of 0.106:1. The results from Akur are considerably better than the other Icelandic system located in Sudarvogur and more than two-fold improvement when compared to the Hondarribia system.
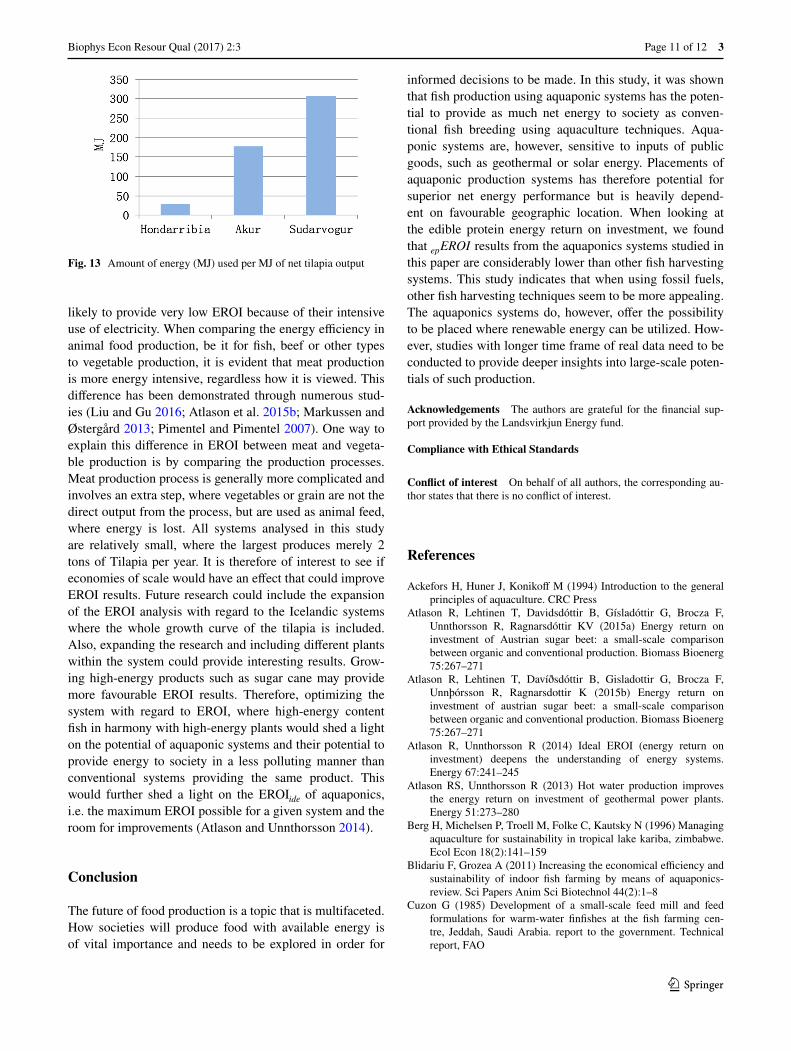
When looking at the increase of energy in biomass of tilapia within the systems, one can see that the increase is 8,034 MJ in the Hondarribia system, 136 MJ in the Sudar-vogur system and 177 MJ in the Akur system. Compar-ing the input energy to the net energy increase of tilapia, it is evident that the Hondarribia system outperforms the Icelandic systems. For each MJ of increased tilapia bio-mass, the Hondarribia system used 29 MJ, the Akur sys-tem 178 MJ and the Sudarvogur system 308 MJ. This can be directly related to the fact that the Hondarribia system is the only system growing fish from the very early stage, and the Sudarvogur system is heavily reliant on artificial lighting.
Edible Protein Energy Return on Investment
The intention of producing fish is not to create net energy for society, but rather high protein output. We are therefore asking the question, “how much protein will this amount of energy provide?”. In this case, epEROI is perhaps a more suitable indicator when looking at food production. When assuming that the output protein of the tilapia is the main output, we found the EROI to be lower. After 1 year of operation, the Akur, Hondarribia and Sudavogur systems have an epEROI of 0.043:1, 0.029:1 and 0.009:1

Biophys Econ Resour Qual (2017) 2:3
1 3
Page 7 of 12 3
respectively. Also, after 10 years of operation, the sys-tems have an epEROI of 0.059:1, 0.045:1 and 0.012:1. The epEROI development is shown in Fig. 12.
In these calculations, the input energy is the same as in previous calculations, but only the output energy is calcu-lated using equation 7. The development for edible protein energy return on investment is shown in Table 3.
Relation to Previous ep
EROI Results
The EROI methodology has previously been used to study fish production; for example, salmon farming has been shown to return approximately 0.15:1 unit of edible protein energy for each unit used in the production process, com-pared to values of 0.012:1 to 0.056:1 in this study (Folke 1988; Tyedmers 2004). From industrial fisheries, the EROI is quite dependent on the equipment used in the process. Herring, caught using purse seine, has been shown to have an EROI of 0.56:1, which is some of the highest ratios reported. Other industrially harvested species have shown to have lower returns. Cod for example, caught in the North Atlantic, returns around 0.1 unit for every unit used in the harvesting process. Tuna, caught using longline, has an EROI of 0.022:1 (Tyedmers 2004). The average EROI for European fishing fleets is approximately 0.11:1 (Guillen et al. 2016). Data from Icelandic fisheries was presented in a previous study by Tyedmers (2001). The year sampled was 1997 using data from 1443 vessels. The lowest EROI from Icelandic fisheries was from vessels using gillnet, generally landing cod, plaice, haddock and redfish, result-ing in an EROI of 0.029:1 (Tyedmers 2001). The high-est EROI from Icelandic fisheries was shown to be from trawlers catching cod, haddock, redfish and saithe. Those trawlers returned an EROI of 0.093:1. These values are representative for Northern Atlantic fisheries from Canada, Norway, Iceland and Germany, who all received similar EROI values (Tyedmers 2001). In contrast to many EROI studies, only the edible parts of the fish and vegetables are calculated as an output. Even though other parts of the fish may be rich in energy and suitable as feed or any other co-product. It is, however, considered that the waste will not be contributed to society, hence it is excluded. Tilapia from an Israeli aquaculture system has been shown to have an EROI 0.066:1 (Tyedmers 2004). Also, tilapia farmed in a Zimbabwe pond system was shown to have an EROI of 0.06:1. Tilapia farmed in an intensive cage culture in Zim-babwe has an EROI of 0.025:1 (Tyedmers 2004). Table 4 illustrates some of the major findings from previous studies and places the findings from this study in context. Table 4 demonstrates that the aquaponics systems in this study scored relatively low compared to other fish production systems when looking at epEROI.
Until now, the literature has lacked any information about the EROI of aquaponic production. Previous EROI studies for farmed tilapia provide a comparison to the tila-pia farmed in the aquaponic systems presented in this study. As shown in Table 4, aquaponics systems have a relatively low epEROI. What is, however, not demonstrated in this study is the fuel intensity of such production. The electric-ity consumed in Iceland comes from a renewable source, either geothermal or hydro while offshore ships conducting trawling for example need diesel oil.
It can be concluded, by looking at the comparison shown in this section, that aquaponics systems have a consider-ably lower epEROI values than many other fish harvesting methods.
Discussion
As we demonstrate, the Hondarribia data did not include the input of juvenile fish. This is because the energy con-tent of the juveniles is of very little significance and will not have any effects on the EROI results. We also found that the low EROI provided by the Sudarvogur system is directly related to the heavy reliance on electricity for arti-ficial lighting. It is, however, questionable if electricity consumption in Spain and Iceland can be compared joule by joule as most, if not all, electricity consumed within the capital area in Iceland is produced using either hydropower or geothermal energy. All forms of energy are not equal, because of differences in usability, price and other factors. The difference in usability is often referred to as energy quality. Methods are, however, available to adjust for energy quality. Even though quality correction is attempted in this study, quality correction for food is a field within the EROI literature that has to be cleared to some extent as bio fuels often require the same inputs as food. This is partially addressed in this study by comparing the systems based on protein output. When looking at Table 4, it is evident that the EROI values from this study are very low com-pared to other forms of fish harvesting. The studies pre-sented in Table 4 are not adjusted for energy quality. This may skew the results as the input energy (heat and electric-ity) in the study presented are mostly from geothermal and hydro (renewable sources), while most other methods rely on fossil fuels in their harvesting procedures. It is notable that the Akur system outperformed the Hondarribia sys-tem as it seems that the Hondarribia system produces more fish compared to the electricity used. At Akur 0.07, MJ of tilapia is returned for each MJ of electricity consumed. At the Hondarribia system, 0.1 MJ is returned. Table 1 shows that the input fish to the Akur system has already grown to some extent and does not go through the whole growth curve while located at Akur. The Hondarribia system may

Biophys Econ Resour Qual (2017) 2:3
1 3
3 Page 8 of 12
Table 1 Input and output energies from the examined aquaponic systems
Note that 1 kWh = 3.6 MJ
Product MJ/kg Hondarribia Sudarvogur Akur
Amount (kg) Total (MJ) Amount (kg) Total (MJ) Amount (kg) Total (MJ)
Input energies PVC Pipes 67 738 49,446 6.19 415 8.6 576.2 PP Pipes 84.4 80 6752 32.25 2722 1.6 135.04 Fibreglass cont. 28 15 420 – – 144 1344 Expanded clay 3 1120 3360 – – – – Steel 20.1 100 2.010 – – – – Steel tubes 19.8 – – 8.12 161 8.1 160.8 PE Film 89.3 50 4465 – – – – Wood 7.11 234 1663 193 1372 499 3548 Plywood 15 – – 277 4155 – – Copper 42 1 42 – – – – PC 112.9 23 2596 – – – – PU sheet 86.4 – – 17.2 1486 16.2 1399 Expanded PS 88.6 – – 2.5 222 – – PE 85.83 216 18,539 – – – – Electricity 22,400 kWh 80,640 8427 kWh 30,339 9267 kWh 33,360 Plant seed 1.8 – – 0.96 1.7 – – Small fish 4.017 – – 80 321.3 554.4 2227 Feed 20.1 3000 60,300 43.8 880.38 66.5 1337.5 Total – 230,234 – 42,073 – 44,088
Output energies Tilapia 4.017 2000 8034 114 458 598.7 2405 Lettuce 0.58 230 133 101 34.22 – – Tomatoes 0.66 250 165 – – 130.1 1030.6 Basil 0.96 2 1.9 – – – – Okra 1.38 – – – – 14.7 243 Parsley 1.5 3 4.5 – – – – Chili pepper 1.67 20 33.4 – – – – Pepper 0.83 10 8.3 – – – – Total – 2515 8380 173 492 743.5 3678.4
Table 2 EROI results for the first 10 years of operation from the sys-tems under study
The Sudarvogur system includes two production runs
Year Hondarribia Sudarvogur* Akur
1 0.036:1 0.012:1 0.078:12 0.045:1 0.014:1 0.091:13 0.049:1 0.015:1 0.097:14 0.051:1 0.016:1 0.100:15 0.052:1 0.016:1 0.102:16 0.053:1 0.016:1 0.103:17 0.054:1 0.016:1 0.104:18 0.055:1 0.016:1 0.105:19 0.055:1 0.016:1 0.105:110 0.055:1 0.016:1 0.106:1
Fig. 8 EROI developments of the systems under study

Biophys Econ Resour Qual (2017) 2:3
1 3
Page 9 of 12 3
therefore provide a more holistic result as it depicts the production system from the juvenile stage of the tilapia throughout its life within the system. Overall, the Icelan-dic systems can be effectively compared to each other. The comparison to the Hondarribia system is questionable, but the results from that particular system contribute to the EROI literature on a standalone basis. To attempt a com-parison, the energy use per tilapia biomass increase was
calculated. By doing so, one can see that the Hondarribia system outperformed the Icelandic systems as it required less energy input for every fish output gained. The differ-ence in energy use for each MJ of tilapia output is shown in Fig. 13.
The relatively favourable results of the Akur system can also be contributed to its favourable geological location. The location of both Icelandic systems allow for an easy access to a renewable heat source, excluding any need for heating to be conducted using fossil fuels or other means of non-renewable energy sources. Using non-renewable energy sources, which can not be considered as a public good, would inevitably lead to inclusion in the calculations and result in a much lower EROI. We also found that the Icelandic systems are delivering much less tilapia output per energy input; this is because the systems are still in the development phase and have great potential for improve-ment. In relation to the previous aquaculture-specific stud-ies, we found that the Hondarribia system returned simi-lar results to the Israeli aquaculture farm and also similar results to those of the Zimbabwe pond system. The Akur
Fig. 9 Inputs to the Hondarribia system for the first year measured in MJ. Y-axis values are shown in thousands
Fig. 10 Inputs to the Sudarvogur system for the first year measured in MJ. Y-axis is shown in thousands
Fig. 11 Inputs to the Akur system for the first year measured in MJ. Y-axis values are shown in thousands
Fig. 12 The development of epEROI for the systems under study
Table 3 EROI results for the first 10 years of operation from the sys-tems under study when looking at the edible protein energy return on investment,
epEROI
Year Hondarribia Sudarvogur Akur
1 0.029:1 0.009:1 0.045:12 0.036:1 0.011:1 0.054:13 0.039:1 0.011:1 0.056:14 0.041:1 0.011:1 0.056:15 0.042:1 0.012:1 0.057:16 0.043:1 0.012:1 0.057:17 0.044:1 0.012:1 0.058:18 0.044:1 0.012:1 0.058:19 0.044:1 0.012:1 0.059:110 0.045:1 0.012:1 0.059:1

Biophys Econ Resour Qual (2017) 2:3
1 3
3 Page 10 of 12
farm provided more favourable results than the Israeli or Zimbabwe farms. In fact, the Akur system returned simi-lar results to Icelandic trawlers catching cod, haddock, red-fish and saithe (Guillen et al. 2016). The production at the Akur system provided considerably less EROI compared to salmon farming. The Sudarvogur system performed much
worse with respect to EROI than any other aquaculture farms with published EROI results. Even the lowest per-forming Icelandic gillnet vessels provided three times more favourable EROI than that of the Sudavogur system (Guil-len et al. 2016). It is then a strong indicator that aquaponic systems, when located inside industrial complexes are
Table 4 Comparison of epEROI values from this study with other findings
Findings are listed in an order of EROI values, highest first
Country Year Gear type Top four species landed (by weight) Edible protein return
Reference
Canada 1999 Mobile-seine Cod 0.25:1 Tyedmers (2001)Norway 1998 n/a Herring-Cod-Saithe-Ling 0.22:1 Tyedmers (2001)Norway 1998 Mobile-seine Herring-Cod-Saithe-Haddock 0.17:1 Tyedmers (2001)Sweden 1988 Ranching w/o offshore fishery Salmon 0.14:1 Folke (1988)Canada 1999 Trawl Redfish-Flatfish-Cod-Gr.Halibut 0.13:1 Tyedmers (2001)Norway 1998 Longline Cod-Ling-Tusk-Catfishes 0.13:1 Tyedmers (2001)Sweden 1988 Cages Salmon 0.13:1 Folke (1988)Canada 1999 Mobile-seine Plaice-Witch-Cod- 0.12:1 Tyedmers (2001)Norway 1998 n/a Cod-Saithe-Herring-Ling 0.12:1 Tyedmers (2001)Canada 1999 Trawl Silver-hake-Haddock-Saithe-Cod 0.11:1 Tyedmers (2001)Norway 1998 GN-HL Cod-Herring-Saithe-Haddock 0.11:1 Tyedmers (2001)Norway 1998 Trawl Saithe-Cod-Herring-Haddock 0.11:1 Tyedmers (2001)Germany 1998 Trawl Redfish-BlWhiting-Herring-Capelin 0.11:1 Tyedmers (2001)Norway 1998 Mobile-seine Cod-Herring-Haddock-Saithe 0.099:1 Tyedmers (2001)Canada 1999 Longline Cod-Haddock-White-hake-Tusk 0.093:1 Tyedmers (2001)Iceland 1997 Gillnet Cod-Saithe-Haddock-Porbeagle 0.093:1 Tyedmers (2001)Iceland 1997 Trawl Redfish 0.093:1 Tyedmers (2001)Iceland 1997 Trawl Cod-Haddock-Saithe-Redfish 0.092:1 Tyedmers (2001)Iceland 1997 Trawl Cod-Redfish-Saithe-Haddock 0.092:1 Tyedmers (2001)Norway 1998 Trawl Cod-Saithe-Haddock-Shrimp 0.088:1 Tyedmers (2001)Iceland 1997 Mobile-seine Cod-Dab-Plaice-Haddock 0.086:1 Tyedmers (2001)Norway 1998 n/a Cod-Herring-Saithe-Mackerel 0.085:1 Tyedmers (2001)Iceland 1997 Longline Cod-Haddock-Catfish-Tusk 0.084:1 Tyedmers (2001)Norway 1998 Longline Cod-Haddock-Herring-Gr.Halibut 0.079:1 Tyedmers (2001)Iceland 1997 Handline Cod-Saithe-Redfish-Haddock 0.078:1 Tyedmers (2001)Iceland 1997 Longline Cod-Catfish-Haddock-Tusk 0.071:1 Tyedmers (2001)Norway 1998 Trawl Cod-Saithe-Redfish-Haddock 0.07:1 Tyedmers (2001)Iceland 1997 Handline Cod-Saithe-Catfish-Redfish 0.069:1 Tyedmers (2001)Israel 1993 Aquaculture Tilapia 0.066:1 Ackefors et al. (1994)Germany 1998 Trawl Cod-Saithe-Sprat-Flounder 0.06:1 Tyedmers (2001)Zimbabwe 1996 Semi-intensive pond culture Tilapia 0.06:1 Berg et al. (1996)Iceland 2016 Aquaponics (greenhouse) Tilapia 0.056:1 This studySpain 2016 Aquaponics (greenhouse) Tilapia 0.045:1 This studySweden 1988 Ranching with offshore fishery Salmon 0.04:1 Folke (1988)Canada 1999 Gillnet Cod-Saithe-Gr.-Halibut-White-hake 0.031 Tyedmers (2001)Iceland 1997 Gillnet Cod-Plaice-Haddock-Redfish 0.029 Tyedmers (2001)Zimbabwe 1996 Aquaculture Tilapia 0.025 Berg et al. (1996)Germany 1998 Trawl Plaice-Sole-Cod 0.018 Tyedmers (2001)Germany 1998 Trawl Cod-Plaice-Haddock-Sole 0.016 Tyedmers (2001)Iceland 2016 Aquaponics (industrial complex) Tilapia 0.012 This study
Biophys Econ Resour Qual (2017) 2:3
1 3
Page 11 of 12 3
likely to provide very low EROI because of their intensive use of electricity. When comparing the energy efficiency in animal food production, be it for fish, beef or other types to vegetable production, it is evident that meat production is more energy intensive, regardless how it is viewed. This difference has been demonstrated through numerous stud-ies (Liu and Gu 2016; Atlason et al. 2015b; Markussen and Østergård 2013; Pimentel and Pimentel 2007). One way to explain this difference in EROI between meat and vegeta-ble production is by comparing the production processes. Meat production process is generally more complicated and involves an extra step, where vegetables or grain are not the direct output from the process, but are used as animal feed, where energy is lost. All systems analysed in this study are relatively small, where the largest produces merely 2 tons of Tilapia per year. It is therefore of interest to see if economies of scale would have an effect that could improve EROI results. Future research could include the expansion of the EROI analysis with regard to the Icelandic systems where the whole growth curve of the tilapia is included. Also, expanding the research and including different plants within the system could provide interesting results. Grow-ing high-energy products such as sugar cane may provide more favourable EROI results. Therefore, optimizing the system with regard to EROI, where high-energy content fish in harmony with high-energy plants would shed a light on the potential of aquaponic systems and their potential to provide energy to society in a less polluting manner than conventional systems providing the same product. This would further shed a light on the EROIide of aquaponics, i.e. the maximum EROI possible for a given system and the room for improvements (Atlason and Unnthorsson 2014).
Conclusion
The future of food production is a topic that is multifaceted. How societies will produce food with available energy is of vital importance and needs to be explored in order for
informed decisions to be made. In this study, it was shown that fish production using aquaponic systems has the poten-tial to provide as much net energy to society as conven-tional fish breeding using aquaculture techniques. Aqua-ponic systems are, however, sensitive to inputs of public goods, such as geothermal or solar energy. Placements of aquaponic production systems has therefore potential for superior net energy performance but is heavily depend-ent on favourable geographic location. When looking at the edible protein energy return on investment, we found that epEROI results from the aquaponics systems studied in this paper are considerably lower than other fish harvesting systems. This study indicates that when using fossil fuels, other fish harvesting techniques seem to be more appealing. The aquaponics systems do, however, offer the possibility to be placed where renewable energy can be utilized. How-ever, studies with longer time frame of real data need to be conducted to provide deeper insights into large-scale poten-tials of such production.
Acknowledgements The authors are grateful for the financial sup-port provided by the Landsvirkjun Energy fund.
Compliance with Ethical Standards
Conflict of interest On behalf of all authors, the corresponding au-thor states that there is no conflict of interest.
References
Ackefors H, Huner J, Konikoff M (1994) Introduction to the general principles of aquaculture. CRC Press
Atlason R, Lehtinen T, Davidsdóttir B, Gísladóttir G, Brocza F, Unnthorsson R, Ragnarsdóttir KV (2015a) Energy return on investment of Austrian sugar beet: a small-scale comparison between organic and conventional production. Biomass Bioenerg 75:267–271
Atlason R, Lehtinen T, Davíðsdóttir B, Gisladottir G, Brocza F, Unnþórsson R, Ragnarsdottir K (2015b) Energy return on investment of austrian sugar beet: a small-scale comparison between organic and conventional production. Biomass Bioenerg 75:267–271
Atlason R, Unnthorsson R (2014) Ideal EROI (energy return on investment) deepens the understanding of energy systems. Energy 67:241–245
Atlason RS, Unnthorsson R (2013) Hot water production improves the energy return on investment of geothermal power plants. Energy 51:273–280
Berg H, Michelsen P, Troell M, Folke C, Kautsky N (1996) Managing aquaculture for sustainability in tropical lake kariba, zimbabwe. Ecol Econ 18(2):141–159
Blidariu F, Grozea A (2011) Increasing the economical efficiency and sustainability of indoor fish farming by means of aquaponics-review. Sci Papers Anim Sci Biotechnol 44(2):1–8
Cuzon G (1985) Development of a small-scale feed mill and feed formulations for warm-water finfishes at the fish farming cen-tre, Jeddah, Saudi Arabia. report to the government. Technical report, FAO
Fig. 13 Amount of energy (MJ) used per MJ of net tilapia output

Biophys Econ Resour Qual (2017) 2:3
1 3
3 Page 12 of 12
Dalsgaard J, Lund I, Thorarinsdottir R, Drengstig A, Arvonen K, Pedersen PB (2013) Farming different species in RAS in Nordic countries: current status and future perspectives. Aquacult Eng 53:2–13
Dosdat A (2002) Environmental impact of aquaculture. Fish Aquacu - Volume IV, p 208
Einen O, Roem A (1997) Dietary protein/energy ratios for atlan-tic salmon in relation to fish size: growth, feed utilization and slaughter quality. Aquac Nutr 3(2):115–126
Folke C (1988) Energy economy of salmon aquaculture in the Baltic Sea. Environ Manage 12(4):525–537
Goddek S, Delaide B, Mankasingh U, Ragnarsdottir KV, Jijakli H, Thorarinsdottir R (2015) Challenges of sustainable and commer-cial aquaponics. Sustainability 7(4):4199–4224
Guillen J, Cheilari A, Damalas D, Barbas T (2016) Oil for fish: An energy return on investment analysis of selected european union fishing fleets. J Ind Ecol 20(1):145–153
Hamilton A, Balogh SB, Maxwell A, Hall CA (2013) Efficiency of edible agriculture in Canada and the US over the past three and four decades. Energies 6(3):1764–1793
Hammond G, Jones C (2008) Inventory of carbon & energy: ICE. Sustainable Energy Research Team, Department of Mechanical Engineering, University of Bath Bath, UK
Herendeen RA, Cleveland CJ (2004) Net energy analysis: concepts and methods. Encycl Energy 4:283–289
Lambert JG, Hall CA, Balogh S, Gupta A, Arnold M (2014) Energy, eroi and quality of life. Energy Policy 64:153–167
Liu X, Gu S (2016) A brief discussion on energy use and greenhouse gas emission in organic farming. Int J Plant Prod 10(1):
Markussen MV, Østergård H (2013) Energy analysis of the danish food production system: food-eroi and fossil fuel dependency. Energies 6(8):4170–4186
Murphy DJ, Hall CAS, Dale M, Cleveland C (2011) Order from chaos: a preliminary protocol for determining the EROI of fuels. Sustainability 3(10):1888–1907
OECD (2015) OECD statistics database (accessed 07.10.15)OECD, FAO (2015) OECD-FAO agricultural outlook 2015–2024.
OECD Publishing, ParisPimentel D, Pimentel MH (2007) Food, energy, and society. CRC
PressPracha AS, Volk TA (2011) An edible energy return on investment
(eeroi) analysis of wheat and rice in pakistan. Sustainability 3(12):2358–2391
Refstie S, Storebakken T, Roem AJ (1998) Feed consumption and conversion in atlantic salmon (salmo salar) fed diets with fish meal, extracted soybean meal or soybean meal with reduced con-tent of oligosaccharides, trypsin inhibitors, lectins and soya anti-gens. Aquaculture 162(3):301–312
Simon CA (2007) Alternative energy: political, economic, and social feasibility. Rowman & Littlefield
Thorarinsdottir R, Kledal PR, Skar SLG, Sustaeta F, Ragnarsdottir KV, Mankasingh U, Pantanella E, van de Ven R, Shultz C (2015) Aquaponics guidelines. Technical report. University of Iceland
Tyedmers P (2001) Energy consumed by North Atlantic fisheries. Fish Impact N Atl Ecosyst Catch Effort Natl/Reg Data Sets 9:12–34
Tyedmers P (2004) Fisheries and energy use. Encycl Energy 2:683–693
USDA (2015) USDA national nutrient database for standard reference (accessed 03.10.15). https://ndb.nal.usda.gov/ndb/
Vázquez-Rowe I, Villanueva-Rey P, Moreira MT, Feijoo G (2014) Edible protein energy return on investment ratio (ep-eroi) for spanish seafood products. Ambio 43(3):381–394
WHO (1991) Energy and protein requirements: report of a joint FAO/WHO/UNU expert consultation. World Health Organization