energy resources - california state university, northridgelcaretto/me496alt/01-resources.pdf ·...
TRANSCRIPT

Resources January 27, 2009
ME 496ALT – Alternative Energy 1
Energy ResourcesEnergy Resources
Larry CarettoMechanical Engineering 496ALT
Alternative EnergyAlternative Energy
January 27, 2009
Reading assignments:Today – Chapter 2Thursday, January 29 – Chapter 3Next Tuesday, February 3 – Chapter 5Download combustion notes for background details on analysis results to be presented next TuesdayHomework:First assignment due today.Second assignment due next Tuesday.

Resources January 27, 2009
ME 496ALT – Alternative Energy 2
2
Today’s Class• Review Monday lecture• Definitions of resources and reserves• Geological measures• Hubbert curves• Text approach
– Ultimate resources are unknowable, but environmental problems are driving force for changed energy use patterns

Resources January 27, 2009
ME 496ALT – Alternative Energy 3
3
Review Wednesday Lecture• Energy units: 1 Btu = 1055.056 J; 1 W =
1 J/s = 3.412 Btu/hr, 1 quad = 1015 Btu• Fuel equivalencies: 1 ft3 natural gas ≈
1000 Btu; 1 bbl crude = 5.8 MMBtu; 1 Mtoe oil = 41.868x10¹⁵ J = 0.0387 quads
• Energy use 2005: world ~450 quads; US ~ 100 quads
• Forecast: continued increase ~2%/yr
The conversion factors become important as we see energy statistics reported in many different units. The Energy Information Administration (EIA) of DOE uses quads. The International Energy Agency (IEA) of the OECD uses million tonnes of oil equivalent (Mtoe). One tonne = 2000 kg is a metric ton. According to the IEA one Mtoe equals 41.868x10¹⁵ J = 41.868 PJ, = 39.683x10¹² Btu = 0.039685 quads. Although forecasts are scenario based with alternative scenarios, the base case calls for continued increase in energy use and production, in line with past history, for several years. Typical forecast horizons are now 2030 to 2040.Projections are done on a “business-as-usual” case. Alternative projections are based on increased conservation to address concerns of global warming and decreases in oil production sometime in this century.

Resources January 27, 2009
ME 496ALT – Alternative Energy 4
4
World Energy Use
Petroleum
Dry Natural Gas
Coal
HydroelectricNuclear
Other Renewable
0
50
100
150
200
250
300
350
400
450
500
1980 1985 1990 1995 2000
Year
Ener
gy (q
uads
Plotted from data on spreadsheet obtained from EIA web site: http://www.eia.doe.gov/iea/wecbtu.htmlSite is for International Energy Annual 2004 report. Spreadsheet is for Table 1.8, World Consumption of Primary Energy by Energy Type and Selected Country groups.

Resources January 27, 2009
ME 496ALT – Alternative Energy 5
5
World Energy Use
y = 2E-13e0.0176x
y = 3E-09e0.0124x
0
100
200
300
400
500
600
1980 1985 1990 1995 2000 2005 2010 2015 2020
Year
Ener
gy u
se (q
uads
Total DataOil DataTrendlineOil trendline
5.24425101786.1)2004(
01750.011 −=
− Ytotal
exquadsinYtoC
5.1297110176.2)2004(
01246.07 −=
− Yoil
exquadsinYtoC
Plotted from data on spreadsheet obtained from EIA web site: http://www.eia.doe.gov/iea/wecbtu.htmlSite is for International Energy Annual 2004 report. Spreadsheet is for Table 1.8, World Consumption of Primary Energy by Energy Type and Selected Country groups.An exponential trend line was fit to the data for both total energy and for petroleum use; the equations for both trend lines are shown on the graph. The exponent 0.0176 in the trend line for total energy is the instantaneous growth rate. The annual growth rate is e0.0176 – 1 = 0.01775. A calculation with more significant figures gives the equation as Total EnergyConsumption = 2.074x10⁻¹³ e0.01760y, where y is the year.The exponent 0.0124 in the trend line for petroleum energy is the instantaneous growth rate. The annual growth rate is e0.0124 – 1 = 0.01246. A calculation with more significant figures gives the equation as Annual Oil Consumption = 2.694x10⁻⁹ e0.01246y, where y is the year.The consumption of total energy or petroleum energy for a set of future years from 2004 to year Y can be found by integrating the equation for the appropriate forecast line from 2004 to Y. This gives the total energy consumed over this period as 2.074x10⁻¹³ ( e0.01760Y – e0.02167(2004))/0.01760 = 1.1786x10⁻¹¹ e0.01760Y – 24425.5. The integrated oil consumption would be 2.694x10⁻⁹ (e0.01246Y – e0.01246(2004))/0.01246 = 2.176x10⁻⁷ e0.01246Y – 12971.5.

Resources January 27, 2009
ME 496ALT – Alternative Energy 6
6
Nonrenewable Energy Sources• Oil (petroleum)• Natural gas and natural gas liquids• Coal• Nuclear• Unconventional
– Oil sands (formerly known as tar sands)– Oil shale– Peat
Each of these sources has its own advantages and disadvantages.Oil has a high energy per unit volume that makes it a good transportation fuel (compact fuel storage). It is not as environmentally benign as natural gas.Natural gas has a high energy per unit weight (compared to oil) but a lower energy per unit volume. It is either used directly as in gas appliances in homes, stores and factories or it is stored as compressed or liquefied natural gas for transportation uses.Coal is difficult to burn and environmentally the most harmful fossil fuel. It’s low energy per unit mass make it appropriate for large combustion applications, like electric power plant boilers, where its lower fuel cost offsets the initially higher costs of construction and environmental aftertreatment.Nuclear energy produces no chemical emissions, but has proven costly to implement because of the costs of plants. No new nuclear facilities have been constructed in the US for several years, but many foreign countries get the majority of their electricity from nuclear energy.Unconventional fuels are typically expensive to use and have severe environmental effects. They are also costly to extract. However, they constitute a large resource and oil shale was extensively studied following the energy crises in the 1970s. Oil (tar) sands are currently being mined, but there is a high energy cost in doing so.

Resources January 27, 2009
ME 496ALT – Alternative Energy 7
7
Resources vs. Reserves
ResourcesResourcesNot
economical to recover
ResourcesReservesEconomical to Recover
UnknownKnown
This is the classical distinction between reserves and resources. Unknown means that the resource is expected to be there based on geological evidence and estimates, but the actual amount present can only be estimated, based on geological information. Such estimates are often reported as a range, reflecting their uncertainty. The amount of reserves are based on preliminary resource recovery (e.g. test wells for oil) that allow some measure of the amount of material actually in place.Note that resources can move into reserves in two ways: by exploratory surveys that give a good measure of the material in place (moving from unknown to known) and by new technology (or increases in price) that make a material newly economic to recover. For oil, the ability to drill offshore and to drill deeper wells has allowed more oil-in-place to be economically produced.The reserves in an existing oil field have been observed to grow as the field produces oil. This is due to the increased knowledge about the oil present and the ability to better predict how much oil can be developed.US oil company reserve estimation and valuation is governed by rules of the US Security and Exchange Commission (SEC). Their present rules for valuing reserves, established in 1978, have come under recent criticism in a report by the Cambridge Energy Research Associates (CERA). A summary of this report was found on January 28, 2007 at the following web site: http://petrochemical.ihs.com/news-05Q1/cera-us-oil-gas-reporting-standards.jsp

Resources January 27, 2009
ME 496ALT – Alternative Energy 8
8
Classifications• Vertical axis denotes
maturity of the accumulation
• Horizontal axis repre-sents uncertainty
• From SPE, WPC and AAPG
• Reserves and resour-ces are really a range
Reference: http://www.spe.org/spe/jsp/basic/0,2396,1104_12171_0,00.html#fig1The abbreviations SPE, WPC, and AAPG represent the Society of Petroleum Engineers, the World Petroleum Council, and the American Association of Petroleum Geologists, respectively.CONTINGENT RESOURCES. estimated to be potentially recoverable from known accumulations, but which are not currently considered to be commercially recoverable.UNDISCOVERED PETROLEUM-INITIALLY-IN-PLACE. petroleum which is estimated to be contained in accumulations yet to be discovered.PROSPECTIVE RESOURCES. petroleum which is estimated to be potentially recoverable from undiscovered accumulations.ESTIMATED ULTIMATE RECOVERY. those quantities of petroleum whichare estimated to be potentially recoverable from an accumulation, plus those quantities already produced. Often abbreviated as EUR.RANGE OF UNCERTAINTY. "Best Estimate" is considered to be the closest to the quantity that will actually be recovered from the accumulation between the date of the estimate and the time of abandonment. This is usually the most likely/mode, median/P50 or mean value of a probability distribution. The terms "Low Estimate" and "High Estimate" are typically the 90% and 10% probability estimatesAll terms are dependent on the date the estimate is made.
Resources January 27, 2009
ME 496ALT – Alternative Energy 9
9
Some Oil Terms
5.13160
5.141−=
FatgravitySpecificAPI o
o
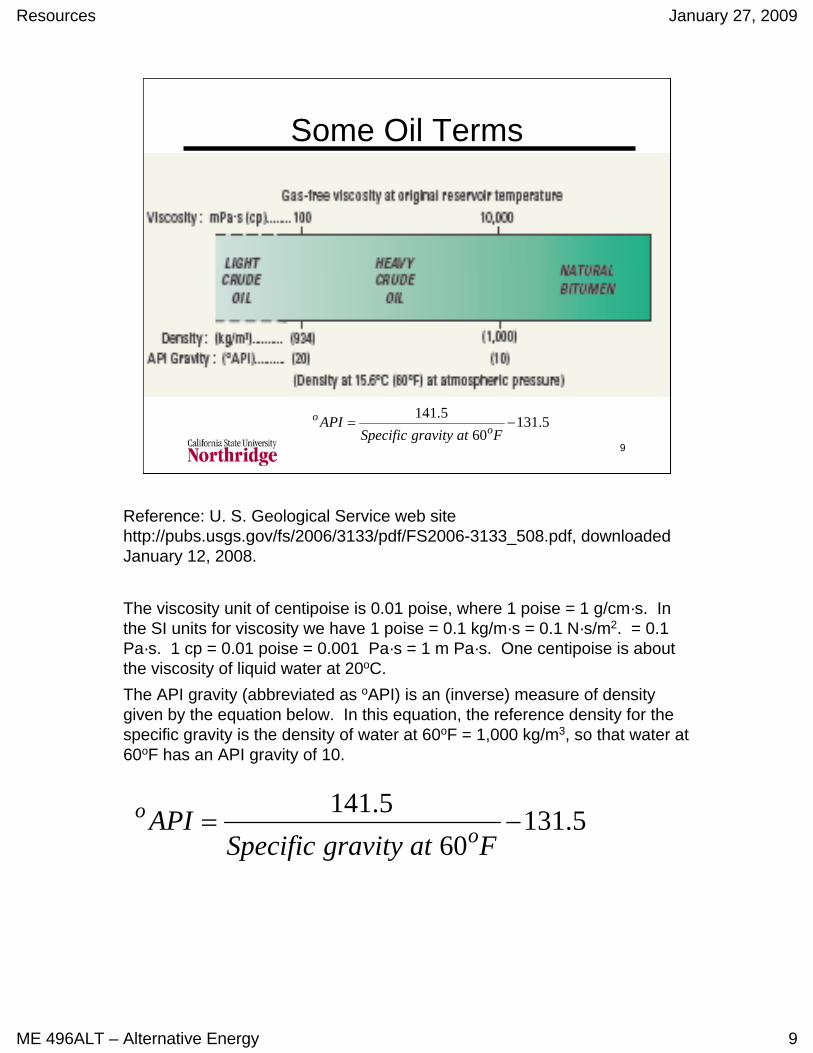
Reference: U. S. Geological Service web site http://pubs.usgs.gov/fs/2006/3133/pdf/FS2006-3133_508.pdf, downloaded January 12, 2008.
The viscosity unit of centipoise is 0.01 poise, where 1 poise = 1 g/cm·s. In the SI units for viscosity we have 1 poise = 0.1 kg/m·s = 0.1 N·s/m2. = 0.1 Pa·s. 1 cp = 0.01 poise = 0.001 Pa·s = 1 m Pa·s. One centipoise is about the viscosity of liquid water at 20oC.The API gravity (abbreviated as oAPI) is an (inverse) measure of density given by the equation below. In this equation, the reference density for the specific gravity is the density of water at 60oF = 1,000 kg/m3, so that water at 60oF has an API gravity of 10.
5.13160
5.141−=
FatgravitySpecificAPI o
o

Resources January 27, 2009
ME 496ALT – Alternative Energy 10
10
Unconventional Oil• Conventional oil exists as liquid in place• Unconventional oil has to be processed
to make a liquid– Oil sands in Venezuela and Alberta,
Canada and oil shale in Utah and Colorado• Oil sands is new name for tar sands
– Resources are very large, but processing costs are high
– Environmental problems in processing basic material to produce liquid
In addition to these definitions of unconventional oil, some tabulations include petroleum products manufactured from natural gas or coal under the heading of unconventional oil. Some long-range projections of oil consumption include oil produced from sources shown in the chart as well as from oil manufactured from other fossil fuels.There are several environmental problems. Oil sands are mined and then the fuel, called bitumen, a hydrocarbon fraction consisting mainly of polycyclic aromatic hydrocarbons with a boiling point about 525oC is extracted from the sands. The bitumen is then processed to produce a synthetic crude oil.Oil shale is neither oil nor shale. Instead it is a rock with a solid
hydrocarbon called kerogen which is released as a liquid when the rock is heated. In this process, the rock is crushed and the volume of the crushed rock (after extraction of the kerogen) is 15-25% larger than the original volume of rock extracted. The best shale contains 25 to 50 gallons per ton of oil. Thus, a barrel of oil will require the mining of 1 ton of rock and adding an extra 0.15 to 0.15 tons of rock to the surface. Alternative processes using heating of the rock in place (so-called in-situ processes) are still in an experimental stage. Shale processing also requires large amounts of water (about 3 gallons of water per gallon of oil). Since most shale deposits are located in dry parts of the Western US, the water requirement is a significant problem.

Resources January 27, 2009
ME 496ALT – Alternative Energy 11
11
Different Oil Reserves 109 bbl
1,1201,3171,201World Total363340Asia & Oceania
110114114Africa712739743Middle East12399123Eurasia
161618Europe76103104
Central & South America
4621360North AmericaBP WOO&GJ
These data were obtained from a spreadsheet downloaded from the EAI web sitehttp://www.eia.doe.gov/emeu/international/oilreserves.html on January 12, 2008. The link used was the “most recent estimates”.The spreadsheet lists oil reserve estimates from different sources.BP denotes the statistical summary produced by the company BP for year-end 2005O&GJ denotes the data published in the Oil and Gas Journal for January 1, 2007WO denotes the data published in World Oil for year end-2005The estimate for North America is higher in the Oil and Gas Journal estimate because they count Canadian oil sands among the reserves.These data show the difficulty in estimating reserves accurately. There is a difference of about 17% between the highest and lowest figures. These are for reserves. For resources, which are more speculative, the differences would be even greater.Taking an average of 1200x109 bbl at 5.8x10⁶ Btu/bbl gives a total world reserve of 6960 quads. The following equation on notes page 5 gives the integrated oil energy consumption between 2004 and year Y for the currently projected growth rate: 2.176x10⁻⁷ e0.01246Y – 12971.5. Setting this equation equal to 6960 quads we can find the year Y when this oil is consumed: 6960 = 2.176x10⁻⁷ e0.01246Y – 12971.5. This gives Y = 2039.

Resources January 27, 2009
ME 496ALT – Alternative Energy 12
12
U.S. Crude Oil Proved Reserves (Million Barrels)
0
5000
10000
15000
20000
25000
30000
35000
40000
45000
1900 1910 1920 1930 1940 1950 1960 1970 1980 1990 2000 2010
Year
Res
erve
s (m
illio
n ba
rrel
s
Plotted on spreadsheet, pet_crd_pres_dcu_NUS_a.xls, downloaded from EIA web site on January 28, 2007: http://tonto.eia.doe.gov/dnav/pet/pet_crd_pres_dcu_NUS_a.htmSharp increase in 1970 is due to the addition of Alaskan oil into the reserve basis.The units here, million barrels, are different from those in the previous table (billion barrels). This figure shows that the most recent reserves in the US were about 22,000x106 bbl = 22x109 bbl. The North American data on the previous table are larger than this due to the oil reserves in Mexico and Canada.

Resources January 27, 2009
ME 496ALT – Alternative Energy 13
13
World Proved Oil Reserves
North AmericaCentral & South
AmericaEurope
Eurasia
Middle East
AfricaAsia & Oceania
0
200
400
600
800
1000
1200
1400
1980 1985 1990 1995 2000 2005Year
Res
erve
s (b
illio
n ba
rrel
s)
Plotted from spreadsheet data obtained on January 12, 2008, from EIA web site http://www.eia.doe.gov/emeu/international/oilreserves.html. (Data for January 1 of year shown.) That web site contains the following disclaimer: “Reserve estimates for oil, natural gas, and coal are very difficult to develop. The Energy Information Administration (EIA) develops estimates of reserves of oil, natural gas, and coal for the United States but does not attempt to develop estimates for foreign countries. As a convenience to the public, EIA makes available foreign fuel reserve estimates from other sources, but it does not certify these data. Please carefully note the sources of the data when using and citing estimates of foreign fuel reserves. “(Emphasis in original.)The large jump for North America between 2002 and 2003 is from the inclusion of the Alberta oil sands (formerly tar sands) in the North America reserve figures. Even without this addition, there would be a growth in the world reserves despite the continued consumption of oil.The increase in stated reserved between 1987 and 1988 is widely regarded as due to a restatement of reserves by OPEC countries, without any significant new discoveries. This is attributed to a change in OPECs internal rules which set allowable sales by a country to be proportional to its stated reserves. This created an incentive for countries to overstate their reserves to increase their allowed sales. Other authors have noted that this may be a valid restatement from a conservative approach used before companies were nationalized. In addition, OPEC countries have reported the same amount of reserves from year to year in recent years despite the continued production and no significant new discoveries.
Resources January 27, 2009
ME 496ALT – Alternative Energy 14
14
World Crude Oil Production(million barrels per day)
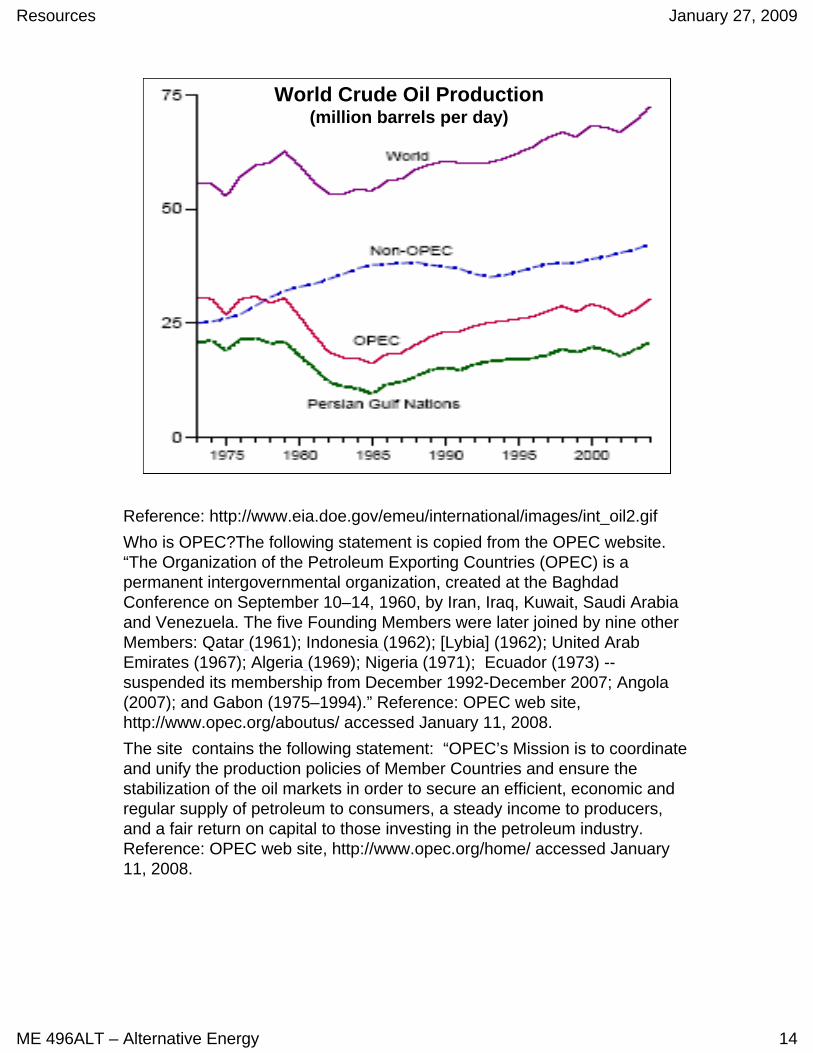
Reference: http://www.eia.doe.gov/emeu/international/images/int_oil2.gifWho is OPEC?The following statement is copied from the OPEC website. “The Organization of the Petroleum Exporting Countries (OPEC) is a permanent intergovernmental organization, created at the BaghdadConference on September 10–14, 1960, by Iran, Iraq, Kuwait, Saudi Arabia and Venezuela. The five Founding Members were later joined by nine other Members: Qatar (1961); Indonesia (1962); [Lybia] (1962); United Arab Emirates (1967); Algeria (1969); Nigeria (1971); Ecuador (1973) --suspended its membership from December 1992-December 2007; Angola(2007); and Gabon (1975–1994).” Reference: OPEC web site, http://www.opec.org/aboutus/ accessed January 11, 2008.The site contains the following statement: “OPEC’s Mission is to coordinate and unify the production policies of Member Countries and ensure the stabilization of the oil markets in order to secure an efficient, economic and regular supply of petroleum to consumers, a steady income to producers, and a fair return on capital to those investing in the petroleum industry. Reference: OPEC web site, http://www.opec.org/home/ accessed January 11, 2008.

Resources January 27, 2009
ME 496ALT – Alternative Energy 15
15
USGS Resource Analyses• In-place: Amount present without
regard to recoverability or economics• Recoverable: Amount that can be
recovered using current technology without regard to cost
• Economically recoverable: Costs of discovery, development, production, and return on capital are less than a given well-head price
These definitions were taken from the US Geological Survey (USGS) publication, The Oil and Gas Resource Potential of the Artcic National Wildlife Refuge 1002 Area, Alaska, http://energy.cr.usgs.gov/OF98-34/ANWR1002.pdf.The next few charts outline the process used by the USGS in evaluating oil resources. This process is in the public domain. Private companies are likely to use similar approaches to determining resources.The purpose of this presentation is to illustrate the process by which estimates of resources are made.

Resources January 27, 2009
ME 496ALT – Alternative Energy 16
16
Resource Probabilities
Reference: http://energy.cr.usgs.gov/OF98-34/ANWR1002.pdfThe USGS geological assessments consider the probabilities of finding a certain amount of a resource. (In USGS analyses these probabilities are often expressed as fractions, called fractiles, similar to the more familiar academic term, percentiles, where the probabilities are represented in percents.) For a given amount of the resource, these number represent the probability that at least that amount of resource will be found. Published reports typically report 5% and 95% probability amounts. When you ask how much oil (or any other resource) will you find with a 95% probability, the number will be small, because a 95% probability is almost a certainty. However, when you ask how much you will find with a 5% probability, the number will be quite large, because a 5% probability is close to an educated guess.The USGS reports also give a mean value for the expected amount of the resource. This mean value is close to, but not the same as the 50% probability because the Monte Carlo simulations used in the calculations can produce a non-uniform probability distribution. (Only a uniform probability distribution, like the conventional normal distribution, has the mean value at the midpoint (50% point) of the distribution.)

Resources January 27, 2009
ME 496ALT – Alternative Energy 17
17
Reference: http://energy.cr.usgs.gov/OF98-34/AO.pdfOverview of USGS process for assessing resources. Part one of two. This chart notes the inputs in orange and outputs in yellow. Note that the inputs are probabilities for the various geological parameters in the assessment. Monte Carlo simulations are then used to assess the overall probabilities of the final results.A play is defined as follows by the USGS: “A set of known or postulated oil and gas accumulations sharing similar geologic, geographic, and temporal properties, such as source rock, migration pathway, timing, trapping mechanism, and hydrocarbon type. A play differs from an assessment unit; an assessment unit can include one or more plays.”
Resources January 27, 2009
ME 496ALT – Alternative Energy 18
18
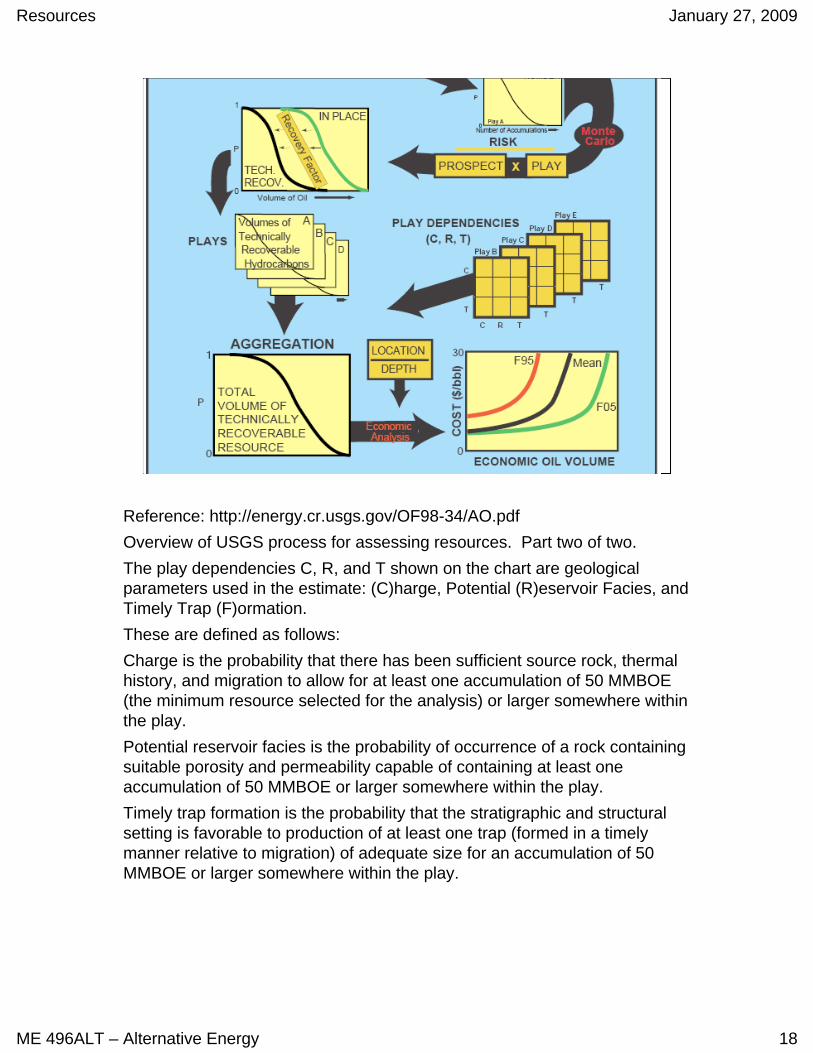
Reference: http://energy.cr.usgs.gov/OF98-34/AO.pdfOverview of USGS process for assessing resources. Part two of two.The play dependencies C, R, and T shown on the chart are geological parameters used in the estimate: (C)harge, Potential (R)eservoir Facies, and Timely Trap (F)ormation. These are defined as follows: Charge is the probability that there has been sufficient source rock, thermal history, and migration to allow for at least one accumulation of 50 MMBOE (the minimum resource selected for the analysis) or larger somewhere within the play. Potential reservoir facies is the probability of occurrence of a rock containing suitable porosity and permeability capable of containing at least one accumulation of 50 MMBOE or larger somewhere within the play. Timely trap formation is the probability that the stratigraphic and structural setting is favorable to production of at least one trap (formed in a timely manner relative to migration) of adequate size for an accumulation of 50 MMBOE or larger somewhere within the play.

Resources January 27, 2009
ME 496ALT – Alternative Energy 19
19
ANWR 1002 Assessment
6.2 billion barrels at $30/bbl (1996$)
Reference: http://energy.cr.usgs.gov/OF98-34/AO.pdfThis shows the estimates of economically recoverable oil in the Alaskan National Wildlife Refuge (ANWR) section 1002. (The 1002 section consists of only 8% of the ANWR area, but is considered to be the major significant potential source of oil and gas there.) At $30/bbl the mean amount of economically recoverable oil is 6.2 billion barrels. At 5.8 MMBtu/bbl, this has an energy content of 36 quads, slightly less than the 39.71 quads of oil the US used in 2005.Note the wide range of available volumes from zero (with each estimate at various oil prices) to over ten billion barrels for the fifth fractile at an oil price of $25/bbl.According to the consumer price index, one 1996 dollar is worth $1.298 in 2006. So $30 in 1996 is the same as $38.63 in 2006. Data taken from http://www.bls.gov/cpi/#data on January 28, 2007.

Resources January 27, 2009
ME 496ALT – Alternative Energy 20
20
Oil and Gas Resources
Reference: http://energy.cr.usgs.gov/WEcont/chaps/ES.pdfThis chart shows the mean estimate of world oil resources (excluding the US) from a 2000 survey of the USGS. The 2000 survey assesses both undiscovered oil and gas that has yet to be found, and reserve growth, which is an estimate of the expected growth in the production from known oil and gas fields due to improvements in technology and changing economics.This chart shows the mean quantities of the estimates. The actual publications also estimated the amounts that could be found with various probabilities.The US data were not included in these charts because they were part of a previous assessment. The USGS assessed resources as 46.62x10⁹ bbl of oil, 627.48x1012 ft3 of natural gas, and 11.61x10⁹ barrels of natural gas liquids. The USGS used a conversion factor of 6000 ft3 of natural gas to 1 barrel of oil. Thus the resource of natural gas would be (627.48x10¹²
ft3)/(6000 ft3/bbl) = 104.56x10⁹ barrels of oil equivalent. From EIA data, the cumulative production of oil is the US is 192 billion barrels. (See http://tonto.eia.doe.gov/dnav/pet/hist/mcrfpus1a.htm, accessed January 28, 2007.) Finally the same data source used for slide 10 shows the reserves as 22 billion barrels. continued at bottom of next notes page

Resources January 27, 2009
ME 496ALT – Alternative Energy 21
21
Estimate Comparisons
Reference: http://energy.cr.usgs.gov/WEcont/chaps/ES.pdfThis chart shows the estimate of world oil resources (excluding the US) from a 2000 survey of the USGS. The chart compares the estimates made in 2000 with previous USGS estimates made in 1994.The 2000 survey assesses both undiscovered oil and gas that has yet to be found, and reserve growth, which is an estimate of the expected growth in the production from known oil and gas fields due to improvements in technology and changing economics.One billion barrels of oil. At an energy content of 5.8 MMBtu/bbl, one billion barrels of oil is 5.8x10¹⁵ Btu or 5.8 quads.This chart shows the mean quantities of the estimates.Continued from previous notes page:Thus the US cumulative production plus reserves plus resources would add 192 + 22 + 42 = 256 billion barrels to the total of 2659 billion barrels of oil shown in the figure. This gives a total estimate of recoverable oil originally in place as 2659 + 256 = 2914 billion barrels of which 539 + 192 = 731 billion barrels has been already consumed leaving an estimated 2914 – 731 = 2183 billion barrels.Using the value of 5.8x10⁶ Btu/bbl gives an energy content of 109 bbl as 5.8x10¹⁵ Btu = 5.8 quad. Thus the resource in place of 2183 billion barrels corresponds to 12,661 quads.

Resources January 27, 2009
ME 496ALT – Alternative Energy 22
22
Coal Types• Coals are ranked by age of formation
with oldest (anthracite) being the best and youngest (lignite) the worst
• Wide range of values for carbon and moisture content, volatile matter content, and heat of combustion
• Bituminous and subbituminous are intermediate ranks
Anthracite coals:Group Fixed Carbon Volatile MatterMeta-anthracite ≥ 98% ≤ 2% Anthracite 92% ≤ FC < 92% 2% < VM ≤ 8% Semianthracite 86% ≤ FC < 92% 6% < VM ≤ 14% Bituminous coals:Group Fixed Carbon Moisture ContentLow volatile bituminous 78% ≤ FC < 86% 14% < VM ≤ 22% Medium volatile bituminous 69% ≤ FC < 78% 22% < VM ≤ 31% High volatile A bituminous coal FC < 69% VM > 31% and heat of combustion > 14,000 Btu/lbm
Group Heat of combustion (Btu/lbm)High volatile B bituminous coal 13,000 ≤ Qc < 14,000 High volatile C bituminous coal 11,500 ≤ Qc < 13,000Fixed carbon and volatile matter are measured on a dry, mineral-matter free basis; heat of combustion is on a moist, mineral matter free basis. (Moist means that there is no surface water.)Reference on next notes page.
Resources January 27, 2009
ME 496ALT – Alternative Energy 23
23
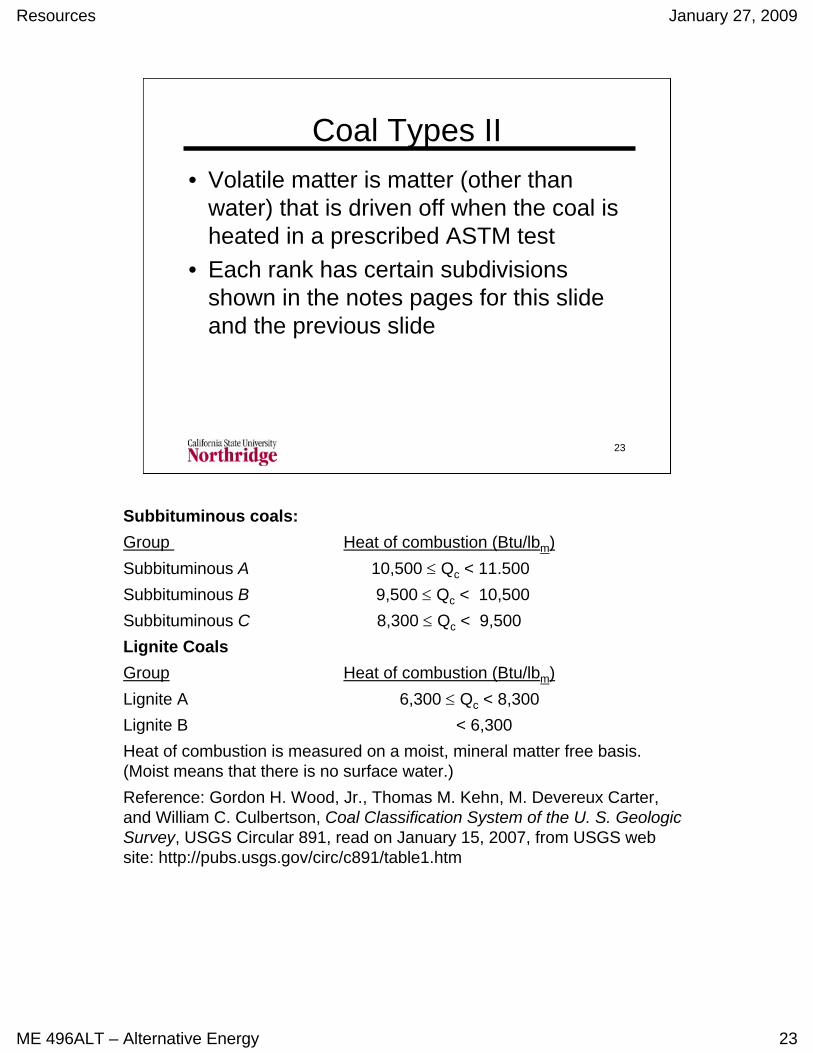
Coal Types II• Volatile matter is matter (other than
water) that is driven off when the coal is heated in a prescribed ASTM test
• Each rank has certain subdivisions shown in the notes pages for this slide and the previous slide
Subbituminous coals:Group Heat of combustion (Btu/lbm)Subbituminous A 10,500 ≤ Qc < 11.500Subbituminous B 9,500 ≤ Qc < 10,500Subbituminous C 8,300 ≤ Qc < 9,500Lignite CoalsGroup Heat of combustion (Btu/lbm)Lignite A 6,300 ≤ Qc < 8,300Lignite B < 6,300Heat of combustion is measured on a moist, mineral matter free basis. (Moist means that there is no surface water.)Reference: Gordon H. Wood, Jr., Thomas M. Kehn, M. Devereux Carter, and William C. Culbertson, Coal Classification System of the U. S. Geologic Survey, USGS Circular 891, read on January 15, 2007, from USGS web site: http://pubs.usgs.gov/circ/c891/table1.htm

Resources January 27, 2009
ME 496ALT – Alternative Energy 24
24
Coal Resource Classifications• Resources: current or potentially feasible
economic extraction• Measured resources: estimates of rank
and quality computed to high degree of geological assurance from measurements
• Indicated resources: rank and quality estimated from measurements and projections to moderate assurance
• Demonstrated resources: sum of the two
Reference: http://www.clean-energy.us/facts/coal/terms.htm accessed on January 11, 2008Resources coal in the Earth's crust, in such forms and amounts that economic extraction is currently or potentially feasible.Measured Resources estimates of the rank and quantity have been computed to a high degree of geologic assurance, from sample analyses and measurements from closely spaced and geologically well known sample sites.Indicated Resources refers to coal for which estimates of the rank, quality, and quantity have been computed to a moderate degree of geologicassurance, partly from sample analyses and measurements and partly from reasonable geologic projections.Demonstrated Resources are the sum of measured resources and indicated resources.Demonstrated Reserve Base is the in-place demonstrated resource from which reserves are estimated. The reserve base may encompass those parts of a resource that have a reasonable potential for becoming economically recoverable within planning horizons that extend beyond those which assume proven technology and current economics.USGS definitions have specific sampling intervals for definitions of measured versus indicated resources

Resources January 27, 2009
ME 496ALT – Alternative Energy 25
25
Coal Resource Classifications 2• Demonstrated Resource Base (DRB):
Part of resources used for planning with given economics and technology
• Inferred resources: low assurance, based only on geological projections
• Reserves: Portion of DRB than can be recovered with current technology and economics– Sometimes called minable or recoverable
Reference: http://www.clean-energy.us/facts/coal/terms.htm accessed on January 11, 2008Inferred Resources refers to coal of a low degree of geologic assurance in unexplored extensions of demonstrated resources for which estimates of the quality and size are based on geologic evidence and projection. Quantitative estimates are based on broad knowledge of the geologic character of the bed or region where few measurements or sampling points are available and on assumed continuation from demonstrated coal for which there is geologic evidence. Recoverable refers to coal that is, or can be, extracted from a coalbed during mining.Reserves relates to that portion of demonstrated resources that can be recovered economically with the application of extraction technology available currently or in the foreseeable future. Reserves include only recoverable coal; thus, terms such as "minable reserves," "recoverable reserves," and "economic reserves" are redundant. Even though "recoverable reserves" is redundant, implying recoverability in both words, EIA prefers this term specifically to distinguish recoverable coal from in-ground resources, such as the demonstrated reserve base, that are only partially recoverable.Minable refers to coal that can be mined using present-day mining technology under current restrictions, rules, and regulations.

Resources January 27, 2009
ME 496ALT – Alternative Energy 26
26
World Estimated Recoverable Coal
0
50
100
150
200
250
300
350
NorthAmerica
Central &South
America
Europe Eurasia MiddleEast
Africa Asia &Oceania
Rec
over
able
Coa
l (bi
llion
tons
)
RecoverableLignite andSubbituminousRecoverableAnthracite andBituminous
Plot of data from International Energy Annual 2005 by EIA.Plot created from spreadsheet for coal reserves downloaded from EIA web site, http://www.eia.doe.gov/emeu/international/contents.html, on January 11, 2008. Data from International Energy Annual 2005.Assuming that the average energy content of lignite and subbituminous is 9000 Btu/lbm, and the average energy content of anthracite and bituminous is 13,000 Btu/lbm gives a total energy contest of 22,000 quads for these reserves.The US (267,554 tons) has 96% of the coal in North America. Russia (173,074 tons) has 69% of the coal in Eurasia.Australia (86,531 tons), China (126,215 tons), and India (101,903 tons) account for 96% of the total for Asia and Oceania.

Resources January 27, 2009
ME 496ALT – Alternative Energy 27
27
Hubbert Peak Oil• Analysis due to M. King Hubbert• Looks at basic production curve• Main publications in 1949 and 1956• Correctly predicted peak in US oil
production in early 1970s• Not so accurate in other predictions• Some recent applications show world oil
production peak in next ten years
Copies of original references:M. King Hubbert, “Energy from Fossil Fuels,” Science 109:103-109, February 4, 1949. Copy found at http://www.hubbertpeak.com/hubbert/science1949/ on January 27, 2007.M. King Hubbert, “Nuclear Energy and the Fossil Fuels”, paper presented at spring meeting of Southern District Division of Petroleum, American Petroleum Institute, March 7-8-9, 1956. Copy found at http://www.hubbertpeak.com/hubbert/1956/1956.pdf on January 27, 2007.The analysis has been used in recent years providing predictions of an imminent peak in world oil production. A Google search for “peak oil” on January 11, 2008, yielded about 4,410,000 hits.

Resources January 27, 2009
ME 496ALT – Alternative Energy 28
28
Variables in Hubbert Curve• Define Q as total resource quantity ever
produced or ever discovered• Q∞ is ultimate amount of resource• Reserves = Discovered – Produced • Discovery rate = D = dQdisc/dt• Production rate = P = dQProd/dt• Time gap between discovery and
production = Δt
Definition of terms:Qd(t) or Qdisc(t) = cumulative amount (e.g. tonnes of oil or coal) that has everbeen discovered by of time tQp(t) or QProd(t) = cumulative amount (e.g. tonnes of oil or coal) that has everbeen discovered by of time tQ∞ = total amount (e.g. tonnes of oil or coal) that exists to be discovered and producedQr(t) or Qres(t) = Qd(t) – Qp(t) or Qdisc(t) – Qprod(t) = reserves at time t, which equals the difference between the cumulative discoveries and the cumulative productionResources are undiscovered quantity which equals Q∞a– Qprod
Resources January 27, 2009
ME 496ALT – Alternative Energy 29
29
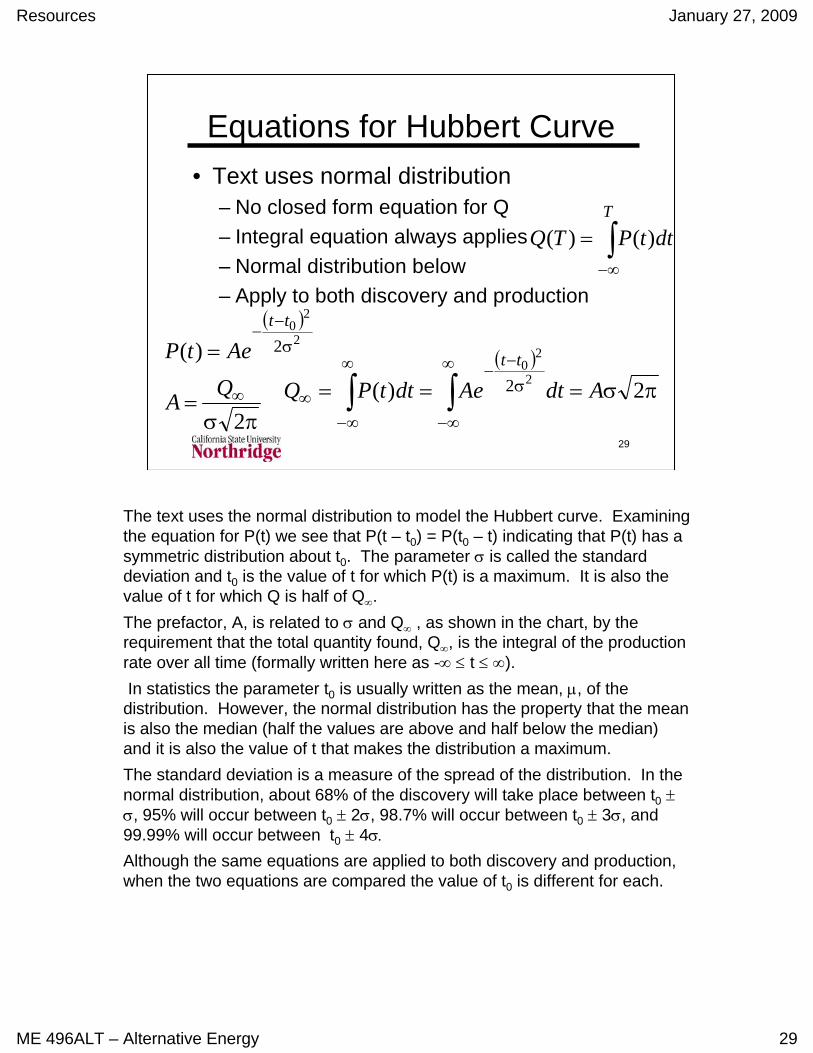
Equations for Hubbert Curve• Text uses normal distribution
– No closed form equation for Q– Integral equation always applies– Normal distribution below– Apply to both discovery and production
∫∞−
=T
dttPTQ )()(
( )2
20
2)( σ−
−=
tt
AetP ( )πσ=== ∫∫
∞
∞−
σ−
−∞
∞−∞ 2)( 2
20
2 AdtAedttPQtt
πσ= ∞
2QA
The text uses the normal distribution to model the Hubbert curve. Examining the equation for P(t) we see that P(t – t0) = P(t0 – t) indicating that P(t) has a symmetric distribution about t0. The parameter σ is called the standard deviation and t0 is the value of t for which P(t) is a maximum. It is also the value of t for which Q is half of Q∞.The prefactor, A, is related to σ and Q∞ , as shown in the chart, by the requirement that the total quantity found, Q∞, is the integral of the production rate over all time (formally written here as -∞ ≤ t ≤ ∞).In statistics the parameter t0 is usually written as the mean, μ, of the
distribution. However, the normal distribution has the property that the mean is also the median (half the values are above and half below the median) and it is also the value of t that makes the distribution a maximum. The standard deviation is a measure of the spread of the distribution. In the normal distribution, about 68% of the discovery will take place between t0 ±σ, 95% will occur between t0 ± 2σ, 98.7% will occur between t0 ± 3σ, and 99.99% will occur between t0 ± 4σ.
Although the same equations are applied to both discovery and production, when the two equations are compared the value of t0 is different for each.

Resources January 27, 2009
ME 496ALT – Alternative Energy 30
30
Equations for Hubbert Curve• Alternative equation is logistics curve
– Basic closed form equation for Q
τ−
−∞+
=0
1
1)(tt
eQ
tQ
20
0
1
)(
⎟⎟
⎠
⎞
⎜⎜
⎝
⎛+
τ==
τ−
−
τ−
−∞
tt
tt
e
eQdtdQtP
The logistic curve shown on this chart is an alternative equation that can be used to model the Hubbert curve. We can also show that the equation for P(t) has a symmetric distribution about t = t0 by multiplying the numerator and denominator of the P(t) equation by e(t-t0)/τ and expanding the result in the denominator.The parameter τ is a measure of the time spread about t0; it’s meaning is similar to that of the standard deviation, σ, in the normal distribution: it is the value of t for which P(t) is a maximum. It is also the value of t for which Q is half of Q∞.As noted above, τ a measure of the spread of the distribution. About 46% of the discovery will take place between t0 ± τ, 76% will occur between t0 ± 2τ, 90.5% will occur between t0 ± 3τ, 96.4% will occur between t0 ± 4τ, 98.7% will occur between t0 ± 5τ, and 99.5% will occur between t0 ± 5τ. The τ parameter has a less inclusive amount of production for the same numerical value, compared to the standard deviation in the normal distribution. However, the normal distribution and the logistics curve can be made to match reasonably well by adjusting the τ or σ parameters.

Resources January 27, 2009
ME 496ALT – Alternative Energy 31
31
Logistic Curve
0
0.1
0.2
0.3
0.4
0.5
0.6
0.7
0.8
0.9
1
-8 -6 -4 -2 0 2 4 6 8
(t - t0)/τ
Cumulative, QProduction
∞
∞
τQPorQQ
τ−
−∞+
=0
1
1)(tt
eQ
tQ
20
0
1
)(
⎟⎟
⎠
⎞
⎜⎜
⎝
⎛+
τ==
τ−
−
τ−
−∞
tt
tt
e
eQdtdQtP
The logistic curve equations shown on the previous chart are plotted here. The curves may be either discovery or production where the curve with the “Production” legend represents a rate. This may be the rate of production or use of the resource or the rate of discovery of the resource. Note that the usual units of the P curve are Q units divided by time units in τ. The curves shown here have been normalized so that they are dimensionless.We see that the peak of the rate or “production” curve occurs when exactly half of the cumulative amount has been used (or discovered).The logistic curve may also be written by the following equation relating the production, P, and the cumulative production, Q.
P = Q(1 – Q/Q∞)/τSetting P = dQ/dt and integrating the resulting first-order differential equation for Q gives the results shown previously. (The boundary condition for the differential equation is that the production is a maximum at a specified time, t0.)The equation given above may be rewritten as follows:
P/Q = 1/τ – (1/Q∞τ)QThis says that a plot of P/Q versus Q should be a straight line with a slope of (–1/Q∞τ) and an intercept of 1/τ. This is used by peak-oil analysts to determine Q∞.
(continued on next notes page)

Resources January 27, 2009
ME 496ALT – Alternative Energy 32
32
Logistic Curves
0
0.1
0.2
0.3
0.4
0.5
0.6
0.7
0.8
0.9
1
-8 -6 -4 -2 0 2 4 6 8
(t - t0)/τ
Cumulative Prodcution, QAnnual Production, PCumulative DiscoveryAnnual DiscoveryDiscovery - Production
∞
∞
τQPorQQ
This plot shows both the cumulative discovery and cumulative production. The discovery is seen to precede the production by a certain time arbitrarily assumed to be τ/2 in this figure. Here the t0 point refers to the time when half the resource has been discovered.The rate curves for production and discovery are also shown here. The same lag between production and discovery that is present in the cumulative curves exists in these rate curves as well. Both rate curves are seen to peak when their corresponding cumulative curves are at a value of 0.5 indicating that half the cumulative resource has been produced or discovered, depending on the curve.The final curve, the cumulative discovery minus the cumulative resources represents the reserves at any time.Continued from previous notes page:Data on P and Q are plotted with P/Q on the vertical axis and Q on the horizontal axis. As P/Q decreases data tend to fall in a straight line whose slope and intercept can be determined. The intercept where the line crosses the Q = 0 axis gives the value of 1/τ = (p/Q)cross. The point where the line crosses the P/Q = 0 axis (P/Q = 0, Q = Qcross) can be used with the previous point to determine the slope, s = Δ(P/Q) / ΔQ = (1/τ – 0) / (0 – Qcross) = (–1/Qcrossτ). But we have shown that this slope is (–1/Q∞τ). Thus the point where the line crosses the P/Q = 0 axis gives the value of Q∞
Resources January 27, 2009
ME 496ALT – Alternative Energy 33
33
US Oil Production
0
500
1000
1500
2000
2500
3000
3500
4000
1850 1900 1950 2000 2050
Year
Prod
uctio
n (1
06 bbl
)
DataFit
Logistic Curve FitPeak year, t0 = 1976
Q∞ = 240 billion barrelsτ = 17 years
20
0
1 ⎟⎟
⎠
⎞
⎜⎜
⎝
⎛+
τ=
τ−
−
τ−
−∞
tt
tt
e
eQP
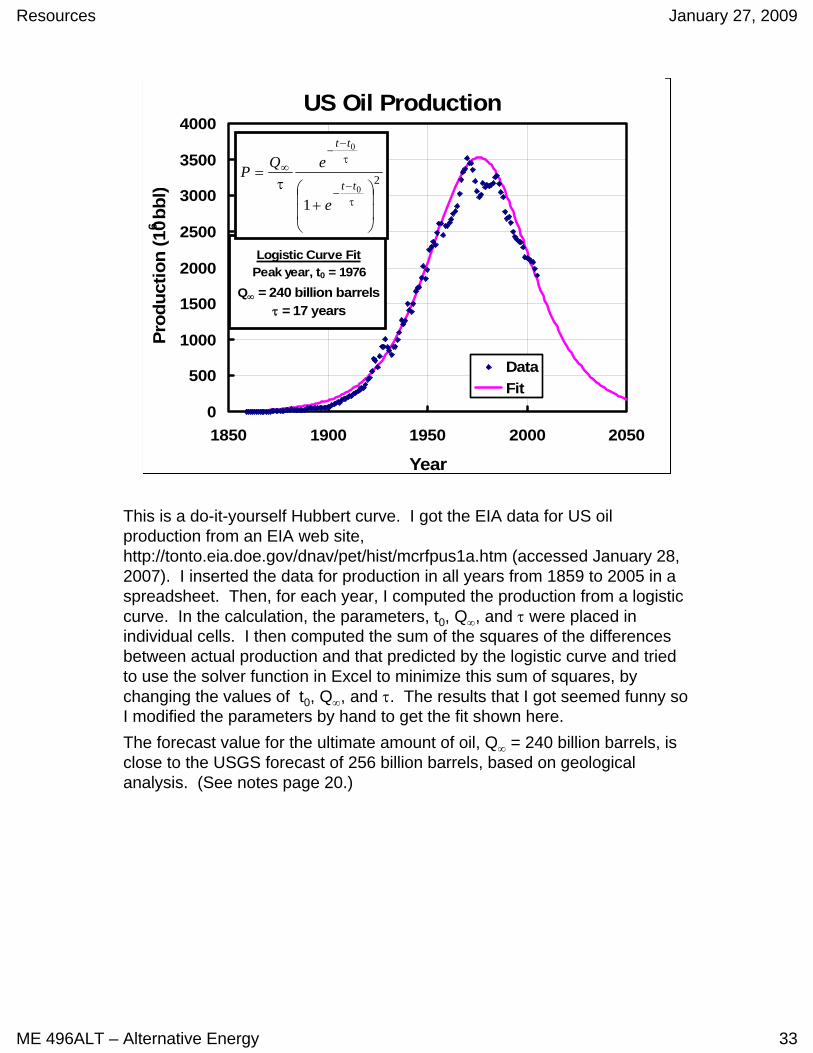
This is a do-it-yourself Hubbert curve. I got the EIA data for US oil production from an EIA web site, http://tonto.eia.doe.gov/dnav/pet/hist/mcrfpus1a.htm (accessed January 28, 2007). I inserted the data for production in all years from 1859 to 2005 in a spreadsheet. Then, for each year, I computed the production from a logistic curve. In the calculation, the parameters, t0, Q∞, and τ were placed in individual cells. I then computed the sum of the squares of the differences between actual production and that predicted by the logistic curve and tried to use the solver function in Excel to minimize this sum of squares, by changing the values of t0, Q∞, and τ. The results that I got seemed funny so I modified the parameters by hand to get the fit shown here.The forecast value for the ultimate amount of oil, Q∞ = 240 billion barrels, is close to the USGS forecast of 256 billion barrels, based on geological analysis. (See notes page 20.)

Resources January 27, 2009
ME 496ALT – Alternative Energy 34
34
World Oil Production
0
5
10
15
20
25
30
35
40
1900 1950 2000 2050 2100
Year
Prod
uctio
n (b
illio
n ba
rrel
s/ye
a
DataLogistic 1Logistic 2
Here is another do-it-yourself Hubbert curve, in fact there are two of them. I downloaded a spreadsheet with EIA data for world oil production from an EIA web site, http://www.eia.doe.gov/emeu/international/oilconsumption.html(accessed January 28, 2007). These data were augmented by data from 1950 to 1959 and 2006-2007 (2007 estimated using ten months of data) at inhttp://www.earth-policy.org/Updates/2007/Update67_data2.htm#table1.I inserted the data for production in all years from 1960 to 2005 in a spreadsheet. Then, for each year, I computed the production from a logistic curve with the parameters, t0, Q∞, and τ in individual cells, and computed the sum of the squares of the differences between actual production and that predicted by the logistic curve. I then used the solver function in Excel to minimize this sum of squares. This gave the lower curve with t0 = 2001.2, Q∞ = 2091x109 bbl, and τ = 18.29 years. The larger curve was fitted by trial-and-error using the following values: t0 = 2020, Q∞ = 3000x109 bbl, and τ = 20 years. The value of Q∞ = 3000x109 bbl for the larger curve, is close to the the USGS forecast of 2914 billion barrels, based on geological analysis. (See notes page 20 for this figure.)Note that this analysis is not really correct as it applies a single curve to all oil producing regions in the world instead of applying the analysis on a region by region basis.

Resources January 27, 2009
ME 496ALT – Alternative Energy 35
35
Is Analysis Valid?• How well can one estimate the
ultimately available resource, Q∞?• Symmetric curve approach ignores
many factors: economic, political, technological
• Suggested approach is use of separate curves for each production area and aggregation of such curves
• National Academies Conference
References (all web sites accessed January 28, 2007)http://www.gasresources.net/Lynch(Hubbert-Deffeyes).htm#_ftn1 points out flaws in main proponents of Hubbert analysishttp://dieoff.org/page191.htm: The article by J.H. Laherrère discusses details of approaches to Hubbert analysis and restrictions in the assumptions that should be applied. The article endorses the use of multiple curves in consistent regions to model world productionhttp://www.princeton.edu/hubbert/: The web site of Kenneth S. Deffeyes, author of the book Beyond Oil, who forecasts a peak in world oil production in 2005.In 2005 the National Academies had a conference to discuss various different opinions on t he oil peak. The proceedings of that conference were published as Trends in Oil Supply and Demand, Potential for Peaking of Conventional Oil Production, and Possible Mitigation Options: A Summary Report of the Workshop, James Zucchetto, Editor, Planning Group for the Workshop on Trends in Oil Supply and Demand and the Potential for Peaking of Conventional Oil Production, National Research Council of the National Academies, 2006. The report may be downloaded at: http://www.nap.edu/catalog/11585.html.The conference summary presents all the divergent views, but does not try to reconcile them

Resources January 27, 2009
ME 496ALT – Alternative Energy 36
36
CERA (formerly Cambridge Energy Research Associates) prepares reports for industrial clients. They have a report entitled “Why the Peak Oil Theory Falls Down – Myths, Legends, and the Future of Oil Resources,” available $1000 (http://cera.ecnext.com/coms2/summary_0236-821_ITM). The summary of the report on the web site states that “Based on a detailed bottom-up approach, CERA sees no evidence of a peak before 2030. Moreover, global production will eventually follow an undulating plateau for one or more decades before declining slowly.”The figure on this slide is taken from the press release on the report, accessed January 28, 2007: http://www.cera.com/aspx/cda/public1/news/pressReleases/pressReleaseDetails.aspx?CID=8444. That release states that the remaining resource base is 3.74 trillion barrels. With the existing cumulative production of 1.08 trillion barrels, the value for worldwide Q∞ according to CERA is 4.82 trillion barrels. However this contains 0.68 trillion barrels of unconventional oil.

Resources January 27, 2009
ME 496ALT – Alternative Energy 37
37
World Energy Resource ~1999
2,600Uranium (235U)3,000Peat
11,000Oil Shale5,700Tar Sands5,400Natural Gas2,600Petroleum
290,000CoalExajoulesFuel • Total is
320,000 EJ• quad/EJ = .96• 2005 world
energy use is 443 quads– Forecast
growth rate is 1.775% per year
Taken from Table 7.2 on page 303 of the course text by Tester et al. There is no reference for these data, but the date for the data is given as “around 1999”.This shows that there is a tremendous energy resource in coal, but the smallest resource is in petroleum, conventional oil. Both coal and oil shale have significant environmental problems compared to other fuels.The uranium resource is the same as oil in this chart, but that assumes that none of the uranium is used in reactors that can create more nuclear fuel. Such reactors, known as breeder reactions, will be discussed later in the course. They are designed to operate at such conditions that the nuclear reactions, in addition to providing heat to generate electricity, will produce additional nuclear isotopes that can be used as reactor fuel.

Resources January 27, 2009
ME 496ALT – Alternative Energy 38
38
Gas Hydrates• Possible future energy source
– Compounds of methane and water– Occur in polar regions and in continental
shelf regions below 300 m– Worldwide estimate of carbon in gas
hydrates is “conservatively estimated” to be twice that of all known fossil fuels
– Will be difficult to use because of location and existence as solid
References (all web pages accessed on January 27, 2007):http://marine.usgs.gov/fact-sheets/gas-hydrates/title.htmlContains quote about “conservative estimate” date on web site is September 1992.http://emd.aapg.org/technical_areas/gas_hydrates/resource_toc.cfmPaper by Timothy S. Collett of USGS (undated; most recent reference cited is dated 1998) Notes that all estimates are “speculative” and suggests that development of this resource will be in 30 to 50 years, with some limited development in 10 years.http://walrus.wr.usgs.gov/globalhydrate/world.htmlUSGS web site with discussion of samples found and links to other sites on gas hydrates

Resources January 27, 2009
ME 496ALT – Alternative Energy 39
39
Solar Energy Map
Reference: http://www.nrel.gov/gis/images/us_pv_annual_may2004.jpg (accessed January 27, 2007)The large graphic is shown in two parts, with the eastern US being shown first because that is where the legend is.The data represent an annual average, based on measurements over a 30 year period. Daily data are available for evaluating solar collector performance. We will discuss this further when we consider solar energy later in the course.The unit of kWh/m2/day gives the total energy available during the day. The instantaneous radiation flux will obviously change during the day as well as during the year depending on the position of the sun and the length of the day, respectively. Note that this is the incoming solar radiation. Its use for photovoltaic energy conversion or solar thermal energy conversion has to be taken into account in considering the area required to fulfill a certain need.

Resources January 27, 2009
ME 496ALT – Alternative Energy 40
40
kWh/m2/day
Reference: http://www.nrel.gov/gis/images/us_pv_annual_may2004.jpg (accessed January 27, 2007)The large graphic is shown in two parts; see legend and notes on previous chart and notes page. Although the map title mentions photovoltaic (PV) collectors, the data would be the same for any flat plate collector regardless of its use of the solar energy.The annual US energy use is about 100 quads or 1017 Btu/year; this is an average of 1017/365 Btu/day = 2.74x10¹⁴ Btu/day. There are 317.0 Btu/ft2 in one kWh/m2; so an annual average solar radiation of 4 kWh/m2/day is equivalent to 1268 Btu/ft2/day. At this rate the annual average US energy use could be supplied by an area of (2.74x10¹⁴ Btu/day) / (1268 Btu/ft2/day) = 2.16x1011 ft2 = 7750 mi2. Assuming an overall efficiency of 20% for conversion of solar energy into the eventual energy use would require an area of about 40,000 mi2. or a square 200 miles on each side. Different assumptions for the annual average energy flux and the efficiency would yield different areas. This can be compared to the land area of Arizona, a good area for solar energy, which is 113, 642 mi2.

Resources January 27, 2009
ME 496ALT – Alternative Energy 41
41
NREL Wind Energy Map
Reference: http://rredc.nrel.gov/wind/pubs/atlas/maps/chap2/2-06m.htmlThis map shows the locations of potential wind energy. Analysis of wind energy is done in terms of wind power classes. A higher wind power class can obtain more wind energy per unit area of a wind turbine blade sweep. The definition of the wind energy classes and the wind power associated with each class are shown in the legend of the figure. Note that the data are based on wind speeds at a height of 50 m (164 ft).The conversion factor for speed is that 1 m/s = 2.237 mphAreas of Class 3 and greater are generally considered suitable for wind energy production; class 2 areas are marginal and class 1 areas and notconsidered suitable.The correction to sea level wind speeds noted in the legend is based on the fact that the wind power is proportional to the air density and the density decreases with elevation. Thus, the wind speeds shown in the figure would actually have to be higher at higher elevations to obtain the same wind power.We will have more discussion of wind energy later in the course.

Resources January 27, 2009
ME 496ALT – Alternative Energy 42
42
US Geothermal Energy Map
Reference: http://www1.eere.energy.gov/geothermal/geomap.html accessed January 14, 2009This map shows the estimated temperature at a depth of 6 km below the surface of the earth. The temperatures are estimated from data on thermal conductivity of the rocks, thickness of sedimentary rock, geothermal gradient, heat flow, and surface temperature. Hotter temperatures imply a greater geothermal resource.Geothermal energy is currently produced in areas where hot water or steam rises to the earth’s surface. Future plans call for the development of systems in which water can be pumped down to hot rock formations to extract geothermal energy in areas where water or steam do not come to the surface from hot locations beneath the earth’s surface.Much of the best geothermal resource is located in the western desert where there is a potential conflict between the need for water to produce the geothermal energy and the availability of the necessary water.