energy resources 2009 - bund
TRANSCRIPT

ENERGY RESOURCES 2009
Reserves, Resources, Availability
Crude OilNatural Gas
CoalNuclear Fuels
Geothermal Energy


Energy Resources 2009
Reserves, Resources, Availability
Crude Oil, Natural Gas, Coal, Nuclear Fuels, Geothermal Energy
Status 10.11.2009
Translation of the German Study:
ENERGIEROHSTOFFE 2009 - Reserven, Ressourcen, Verfügbarkeit - Erdöl, Erdgas, Kohle, Kernbrennstoffe, Geothermische Energie
Bundesanstalt für Geowissenschaften und Rohstoffe (BGR)
Federal Institute for Geosciences and Natural Resources
Stilleweg 2
30655 Hannover
Germany
Phone.: +49 (0)511 – 643-0
Fax: +49 (0)511 – 643-23 04
e-mail: [email protected]
web: http://www.bgr.bund.de
ISBN 978-3-9813373-9-6

With contributions from:
CoordinationBernhard Cramer, Harald Andruleit
The availability of energy resources - an overviewBernhard Cramer and coauthors
Crude OilHilmar Rempel (Conventional Oil)Hans-Georg Babies (Unconventional Oil)
Natural gasHilmar Rempel (Conventional Natural Gas)Stefan Schlömer (Tight and Shale Gas)Sandro Schmidt (Coalbed Methane)Harald Andruleit (Natural Gas in Aquifers, Gas Hydrate)
CoalSandro Schmidt
Nuclear FuelsUlrich Schwarz-Schampera
Geothermal EnergyNorbert Ochmann
Energy Resources in GermanyJürgen Meßner (LBEG) and coauthors
Availability of Energy ResourcesSönke Rehder, Bernhard Cramer and coauthors
LayoutGabriele Ebenhöch, Claudia Kirsch, Elke Westphale
GraphicsUwe Benitz
Source of photos on cover sheetWintershall Holding AG, BGR
With contribution fromUlrich Berner, Christian Bönnemann, Dieter Franke, Peter Gerling, Hans Keppler, Martin Krüger, Christian Ostertag-Henning, Britta Pfeiffer, Thomas Pletsch, Barbara Teichert, Torsten Tischner

PREFACE
Energy Resources 2009
Preface by the President
of the BGR
Germany is an energy dependant country. The in-dustrial revolution in Germany relied as early as in the middle of the 19th century on energy from hard coal. Also the fi rst oil discoveries in our country can be dated back to that time: When, in the year 1859, Prof. Georg Hunäus searched for coal in Wietze north of Hannover, one bore-hole struck oil at a depth of 36 m. Therefore, today, in the year 2009, we celebrate 150 years of oil in Germany! For a start, in this country the big oil boom failed to appear. Not before the end of World War II domestic crude oil and natural gas became important components of our energy supply and have remained so to this day.
Presently, Germany is world leader in the usage of soft brown coal, concerning the quantity of produced lignite as well as power plant technology. Germany holds a cutting-edge position in the development of the environmentally and climate friendly CCS technology (CCS, Carbon Cap-ture and Storage) which focuses on the minimizing of carbon dioxide emissions, especially in coal-based power generation.
By now, renewable energy sources are inseparable com-ponents of our energy mix and they will gain further im-portance. For the Federal Institute for Geosciences and Natural Resources (BGR) the use of geothermal energy is of special importance. Here, one-borehole concepts, like they are just being tested with the pilot project GeneSys in the Geozentrum Hannover could lead to a breakthrough for the broad use of deep geothermal energy.
Also in the future, energy will defi ne our economy and our lives altogether. During the past decades, growing energy demand and the increasing exhaustion of the domestic reserves of crude oil and natural gas have turned Ger-many more and more into an import country for energy resources. This development was accompanied, especially in recent years, by major fl uctuations in energy resource

PREFACE
Energy Resources 2009
prices and increasing technological effort for the devel-opment of new fi elds and the production of crude oil and natural gas.
In this situation, there is an urgent need for research and development: possible future reserves of energy re-sources have to be explored and innovative technologies for the exploration and development of the new deposits have to be worked out. Here, the BGR is acting prior to industrial activities, especially in the exploration of the energy resource potential of so far hardly noticed regions like the deep-water areas of the oceans.
Also in the coming years, fossil fuels will bear the major burden of the energy supply. Therefore, basic informa-tion on the worldwide situation of reserves, resources and availability is absolutely essential for the orientation of Germany’s future energy supply. With the present study, BGR presents on behalf of the Federal Ministry for Econ-omy and Technology an analysis of the status quo and of future developments in the fi eld of energy resources.
Prof. Dr. Hans-Joachim Kümpel
President of the BGR

Contents0 Preface by the President of the BGR ................. 3
1 The Availability of Energy Resources - An Overview 11
1.1 References on the Availability of Energy Resources - An Overview ... 16
2 Energy Resources - Defi nitions and Classifi cations 17
2.1 Energy Resources of the Earth ..................................................... 17
2.2 From the Occurrence of Energy Resources to Mineral Deposits ......... 18
2.3 Classifi cation of Energy Resources by Types ................................... 182.3.1 Conventional and Unconventional Oil ............................................ 192.3.2 Conventional and Unconventional Natural Gas ................................ 202.3.3 Classifi cation of Coal .................................................................. 202.3.4 Conventional and Unconventional Uranium .....................................22
2.4 Reserve Classifi cation of the Energy Resources .............................. 222.4.1 The Quantifi cation of Resources ................................................... 222.4.2 BGR-Defi nition of Reserves .......................................................... 232.4.3 Other Classifi cation Systems for Energy Resources ......................... 24
2.5. Resources Classifi cation for Geothermal Energy .............................. 28
2.6 Data Sources of the BGR-Statistics ............................................... 28
2.7 References on Energy Resources - Defi nitions and Classifi cations ...... 29
3 Crude Oil .................................................. 31
3.1 From Deposit to Consumer .......................................................... 31
3.2 Conventional Oil ........................................................................ 323.2.1 EUR of Crude Oil and its Regional Distribution ................................ 323.2.2 Crude Oil Reserves ..................................................................... 353.2.3 Crude Oil Resources ................................................................... 403.2.4 Crude Oil Production ................................................................... 423.2.5 Costs of Petroleum Extraction ...................................................... 443.2.6 Oil Consumption ........................................................................ 463.2.7 Crude Oil Transport and Trade ...................................................... 483.2.8 Crude Oil Prices ......................................................................... 49
3.3 Unconventional Oil ..................................................................... 543.3.1 Oil Sands - High-Viscosity Oil in Sandstone .................................... 543.3.2 Extra-Heavy Oil ......................................................................... 603.3.3 Oil Shale - Petroleum still to be Generated .................................... 633.4 References on Crude Oil .............................................................. 67

CONTENTS
4 Natural Gas ............................................... 69
4.1 From Natural Gas Deposit to Consumption .................................... 69
4.2 Conventional Natural Gas ............................................................ 704.2.1 Total EUR of Natural Gas and its Regional Distribution ..................... 704.2.2 Natural Gas Reserves ................................................................. 734.2.3 Natural Gas Resources ................................................................ 754.2.4 Natural Gas Production ............................................................... 774.2.5 Consumption of Natural Gas ........................................................ 804.2.6 Transport of Natural Gas ............................................................. 814.2.7 Trade of Natural Gas and Regional Markets .................................... 834.2.8 European Natural Gas Market ...................................................... 864.2.9 Natural Gas Prices ...................................................................... 88
4.3 Unconventional Natural Gas ......................................................... 904.3.1 Tight and Shale Gas ................................................................... 904.3.2 Coalbed Natural Gas ................................................................... 944.3.3 Natural Gas in Aquifers - Renaissance with Geothermal Energy? ....... 994.3.4 Gas Hydrate - the „Frozen Natural Gas“ ...................................... 103
4.4 References on Natural Gas ........................................................ 109
5 Coal ........................................................ 113
5.1 Fossil Plant Residue with High Energy Potential ............................ 1135.1.1 Coal Formation ........................................................................ 1135.1.2 Composition and Characteristics of Coal ...................................... 1145.1.3 Which Type of Coal for which Use? ............................................. 1155.1.4 Coal as Global Power Source ...................................................... 116
5.2 Hard Coal ............................................................................... 1165.2.1 Total Resources of Hard Coal and Regional Distribution .................. 1165.2.2 Hard Coal Reserves .................................................................. 1185.2.3 Hard Coal Resources ................................................................ 1185.2.4 Hard Coal Production ................................................................ 1195.2.5 Hard Coal Consumption ............................................................ 1295.2.6 Production and Consumption of Coke .......................................... 1315.2.7 Hard Coal Transportation ........................................................... 1325.2.8 World Market for Hard Coal ....................................................... 1345.2.9 Hard Coal Prices ...................................................................... 140
5.3 Lignite .................................................................................... 1425.3.1 Total Resources of Lignite, Regional Distribution ........................... 1425.3.2 Lignite Reserves ...................................................................... 1445.3.3 Lignite Resources ..................................................................... 1455.3.4 Lignite Production .................................................................... 1455.3.5 Lignite Consumption ................................................................. 1495.3.6 Lignite Trade ........................................................................... 150
5.4 References on Coal ................................................................... 151

CONTENTS
6 Nuclear Fuels ............................................ 153
6.1 Uranium ................................................................................. 1536.1.1 Uranium Occurances ................................................................. 1536.1.2 Total Potential of Uranium, Hostorical Development ...................... 1546.1.3 Uranium Reserves .................................................................... 1576.1.4 Uranium Resources .................................................................. 1586.1.5 Additional Uranium Stocks ......................................................... 1606.1.6 Uranium Production .................................................................. 1616.1.7 Uranium Consumption .............................................................. 1646.1.8 Nuclear Fuel Cycle and Trade ..................................................... 1666.1.9 Uranium Prices ........................................................................ 167
6.2 Thorium .................................................................................. 1686.2.1 Thorium as Nuclear Fuel ........................................................... 1686.2.2 Supply of Thorium .................................................................... 1686.2.3 Production and Consumption of Thorium ..................................... 168
6.3 References on Nuclear Fuel ....................................................... 169
7 Geothermal Energy .................................... 171
7.1 Heat from the Earth for Usage as Energy .................................... 171
7.2 Sources of Geothermal Energy ................................................... 1737.2.1 Near-surface Substratum .......................................................... 1737.2.2 Hdrothermal Occurrences of Low Temperatures ............................ 1737.2.3 Hydrothermal Occurrences of High Temperatures ......................... 1747.2.4 Hot-Dry-Rock Occurrences ........................................................ 175
7.3 Geothermal Resources .............................................................. 1757.3.1 Quantitative Analysis of Geothermal Resources ............................ 1757.3.2 Global Usage of the Geothermal Energy ...................................... 1777.3.3 Regional Distribution of Used Occurrences ................................... 179
7.4 References on Geoghermal Energy ............................................. 187
8 Energy Resources in Germany ..................... 189
8.1 Petroleum in Germany .............................................................. 1898.1.1 Petroleum Deposits and Production History .................................. 1898.1.2 Petroleum Production and Consumption in 2007 ........................... 1918.1.3 Petroleum Reserves and Resources ............................................. 1928.1.4 Germany´s Supply with Petroleum ............................................. 1938.1.5 Unconventional Oil ................................................................... 194
8.2 Natural Gas in Germany ............................................................ 1958.2.1 Natural Gas Deposits and Production History ............................... 1958.2.2 Natural Gas Production and Consumption in 2007 ......................... 1988.2.3 Natural Gas Reserves and Resources .......................................... 1988.2.4 Germany´s Supply with Natural Gas ........................................... 1998.2.5 Unconventional Natural Gas ....................................................... 200
8.3 Coal in Germany ...................................................................... 2028.3.1 Coal Deposits and Production History .......................................... 2028.3.2 Coal Production and Consumption in 2007 ................................... 2058.3.3 Coal Reserves and Resources ..................................................... 206

CONTENTS
8.3.4 Germany´s Supply with Coal ..................................................... 206
8.4 Cross-border Prices of Fossil Fuels .............................................. 207
8.5 Nuclear Fuels in Germany ......................................................... 2108.5.1 Uranium Deposits and Production History .................................... 2108.5.2 Uranium Production and Consumption in 2007 ............................. 2118.5.3 Uranium Reserves and Resources ............................................... 2128.5.4 Germany´s Supply with Nuclear Fuels ........................................ 2128.5.5 Remediation of Uranium Mines ................................................... 213
8.6 Geothermal Energy in Germany ................................................. 2138.6.1 Geothermal Energy Resources ................................................... 2138.6.2 Near-surface Geothermal Energy ............................................... 2148.6.3 Hydrothermal Resources ........................................................... 2158.6.4 Hot-Dry-Rock-Resources ........................................................... 2178.6.5 The Future of Geothermal Energy in Germany .............................. 2208.7 The Supply of Germany with Energy Commodities ........................ 2218.7.1 Petroleum Supplier Countries ..................................................... 2218.7.2 Natural Gas Supplier Countries .................................................. 2238.7.3 Coal Supplier Countries ............................................................. 224
8.8 References on Energy Resources in Germany ............................... 225
9 Availability of Energy Resources ................... 229
9.1 The Dynamics of Exhausting Finite Resources .............................. 2299.1.1 Static Reach ............................................................................ 2299.1.2 Peak Oil .................................................................................. 2309.1.3 Availability .............................................................................. 231
9.2 Availability of Geothermal Energy ............................................... 235
9.3 Availability of Uranium .............................................................. 237
9.4 Availability of Coal .................................................................... 240
9.5 Availability of Natural Gas ......................................................... 242
9.6 Availability of Oil ...................................................................... 2449.6.1 Geological Availability of Oil ....................................................... 2449.6.2 Future Potential of Oil ............................................................... 2469.6.3 The Future Development of Oil Production ................................... 250
9.7 Energy Resources 2030, 2050 ................................................... 253
9.8 References on the Availability of Energy Resources ....................... 255
10 Glossary ...................................................... 257
Regional Defi nitions and Country Groupings ................................. 267 Natural Gas Markets ................................................................. 270 Unit of Measurement ................................................................ 271 Conversion Factors ................................................................... 273 Stratigraphic Table .................................................................... 274

CONTENTS
Index of Info Boxes
i1 International vs. National State Oil and Gas Companies .................. 41
i2 EOR – How much Petroleum in a Reservoir can be Actually Produced? ..................................................................... 61
i3 Associated Gas – Unused Potential ............................................... 79
i4 Will There Be a Natural Gas Cartel Analog to OPEC? ........................ 84
i5 Shallow Gas - Danger or Potential Raw Material? ............................ 97
i6 Possible Environmental Effects on the Use of Gas Hydrate ............. 108
i7 CO2 from Burning Coal, Potential for Germany ............................. 122
i8 Coal Liquefaction - An Alternative to petroleum? .......................... 136
i9 Coal fi res - Destruction of Resources and Environmental Protection . 139
i10 GEOTHERM - Technical Cooperation in Geothermal Energy ............. 183
i11 GeneSys - Heat Generation Using Single Borehole Method ............. 218


INTRODUCTION
11Energy Resources 2009
The Availability of Energy Resources – 1 An Overview
In this study reserves, resources, output, and consumption of the energy resources oil, natural gas, coal, nuclear fuel as well as geothermal energy are globally analyzed and evaluated in a regional context by year end 2007. Thus, this is the fi rst time after the study based on the year 2002 (BGR, 2003, data status at the end of 2001) that the BGR gathers, collects and evaluates the global energy resource situation in detail. The period after the publication of the last study has been characterized in particular by signifi cant increases of the prices for raw materials, which has also resulted in an increased perception of the subject raw materials in politics and the general public.
The reserves of non-renewable energy resources corresponded to approximately 38 700 EJ in total (Tab. 1.1) at the end of 2007. The increase of 2220 EJ in comparison to 2001 was particularly due to increases of soft brown coal and the conventional hydrocarbons, crude oil and natural gas.
Coal is still the dominant energy resource as measured by its recoverable energy content. Its proportion of the reserves of all non-renewable energy resources is approximately 55 % (Fig. 1.1). Crude oil with nearly 23 % (conventional and unconventional with 17 % and 6 %, respectively) ranks second. Natural gas follows at nearly 19 %, the nuclear fuels add up to app. 4 %.
Figure 1.1: Annual production, reserves and resources of the individual non-renewable fuels in 2007.
The resources of the non-renewable energy resources were estimated at approximately 571 700 EJ (Tab. 1.1) by the end of 2007. There is a signifi cant increase by approximately one-and-a half times in comparison to 2001. This is due to a different assessment of coal, to the hitherto not considered resources and unconventional natural gas deposits in tight reservoirs and coalbed methane.

INTRODUCTION
12 Energy Resources 2009
In relation to the energy content, the dominant position of coal amongst the resources at a proportion of about 76 % is even more signifi cant than for the reserves. At nearly 20 % the aggregated resources of conventional and unconventional natural gas range second, at 1.6 % and 18.1 % respectively. Crude oil follows at 3 % ahead of nuclear fuel at a little more than 1 %.
Table 1.1: Reserves and resources of non-renewable fuels at the end of 2007 in the common unit for the individual fuels (left column each) and in EJ (right column each).
FuelsUnit of
measure-ment
Reserves Resources
(dimension see left column) EJ (dimension see
left column) EJ
Crude oil Gt 157 6 575 92 3 829
Natural gas Tcm 183 6 947 239 9 098
Conventional hydrocarbons
Gtoe 323 13 522 309 12 927
Oil sand / extra heavy oil Gt 52 2 183 190 7 918Oil shale Gt - - 119 4 970
Unconventional oil Gtoe 52 2 183 309 12 919
Tight reservoir Tcm 3 103 6666) 25 312
Coal bed methane Tcm 2 82 2546) 9 652
Aquifer gas Tcm - - 800 30 400
Gas hydrates Tcm - - 1 000 38 000
Unconventional natural gas Tcm 5 184 2 720 103 364
Unconventional hydrocarbons Gtoe 57 2 369 2 779 116 210
Hydrocarbonstotal Gtoe 280 15 889 3 088 129 210
Hard coal Gtce 616 18 060 13 195 386 718
Soft brown coal Gtce 106 3 113 1 671 48 977Coal total Gtce 722 21 173 14 866 435 695Fossil fuels total 37 062 564 905
Uranium1) Mt U 22)
7252) 63) 2 6543)
84) 3 1884)
Thorium5) Mt Th 2 908 2 964
Nuclear fuel total 1 633 6 806
Non-renewablefuels total* 38 695 571 711
Totals can differ due to rounding
1) 1 t U = 14 000 – 23 000 tce, lower value used or 1 t U = 0,5 x 10¹⁵ J2) RAR recoverable up to USD 40/kg U3) Sum of RAR producible from USD 40-130/kg U and IR4) Speculative resources5) 1 t Thorium used the same tce-value as for 1 t U6) in-situ amount

INTRODUCTION
13Energy Resources 2009
For the production of non-renewable energy resources a signifi cant increase was ob-served, from 335 EJ in the year 2001 to 439 EJ in 2007. This increase was reported for all energy resources, but especially for hard coal, the production of which increased from 82 to 124 EJ/a. With the exception of Europe, all regions showed increases in production. In Austral-Asia these were particularly high, because of hard coal, with an increase from 71 to 124 EJ/a. Major increases also occurred in the CIS and in the Middle East.
The consumption of non-renewable fuels also underwent a signifi cant increase from 346 to 451 EJ/a. With the exception of uranium, the consumption increased for all resources, in particular for coal from 94 to 145 EJ/a. Increases were noted in all regions. The consumption in Austral-Asia increased from 98 to 191 EJ/a. The proportion of the OECD was signifi cantly lowered from 63 to 50 %.
If the global annual production of all energy resources in total for 2007 at 439 EJ, the re-serves at 38 700 EJ and the resources at 571 700 EJ are compared, a ratio of approximately 1 : 90 : 1300 results. The global reserves of energy resources with the exception of con-ventional oil can thus ensure a suffi cient cover of the energy demand.
Based on the analysis of the data, the following key statements result for the individual energy resources:
The use of geothermal energy has developed rapidly over the past years. Globally, the power generation rates for geothermal energy have increased nearly linearly by 200 to 250 MWe annually since 1980. The direct use of heat increased simultaneously even out of proportion due to the massive growth of local heating systems with heat pumps. In 2005 the worldwide existing geothermal systems had an installed capacity of 27 825 MWth of thermal energy and 8933 MWe of electrical energy. At an installed capacity of 2504 MWe
for power generation and 7817 MWth for the direct use of heat, the US stand out from the other countries as largest user of geothermal energy world-wide.
The exploitation of geothermal energy by development schemes for regenerative energies and for the reduction of CO2 emissions will continue to increase considerably, not only in Germany but also in other countries such as the USA, Australia and Kenya.
Regarding the supply with nuclear fuel, from a geological point of view no shortage is to be expected in the foreseeable future. All over the world increasing reserves and resources are noted. The concentration of the global output as well as the known reserves and resources in a few countries continue unabatedly. In 2007, only seven mining companies produced 85 % of the global production. Here, the production occurs in politically stable countries with inexpensive deposits. The upturn of the market resulted in a signifi cantly increased growth of the exploration activity in the past few years, even in countries without prior production. Thus, in future a higher degree of diversifi cation of the producing countries is to be expected.
The gap between the annual production and the consumption continues to exist. As before, the additional demand for uranium is being satisfi ed from civil stock previously amassed, and from strategic stock. After massive increases in prices in the past years, ever since 2007 an adaptation of the markets concerning the spot market prices has started with a

INTRODUCTION
14 Energy Resources 2009
simultaneous increase of the prices for long-term supply contracts. In spite of the current crisis affecting the fi nancial markets all over the world, the market prices are above those before 2006. All over the world, a number of countries has announced the construction of new power plants for the coming decade. These projects are frequently coupled with the development of alternative and more effi cient technologies, also using Thorium.
Coal is the energy resource with the greatest geological availability. Soft brown and hard coal together have the greatest potential of all non-renewable energy resources at a per-centage of about 55 % (722 trillion tce) of the reserves and about 76 % (14 866 trillion tce) of the resources. This is suffi cient to satisfy the foreseeable demand for many decades. Coal ranks second after crude oil amongst the non-renewable energy resources with a global PEV-percentage of about 30 % (hard coal 28 %, soft brown coal about 2 %) as far as consumption is concerned. For the global power generation (gross), coal was the most important energy resource at a percentage of 40 % (7620 TWh) in 2006 (IEA, 2008a). Due to its widespread and plentiful occurrences it is regarded as a most important element of security of supply in the energy resource sector.
Just like its predecessors, the Annual Reports of the BGR of the preceding years, this study also documents an increase in resources. In future, further changes in reserves as well as in resources have to be taken into account, as the high price of coal in the past years has caused a noticeable extension of the exploration and also developing activities.
The results of the currently conducted pilot project for the reduction of CO2-emissions such as carbon capture and storage (CCS), in particular for the power generation from coal, will infl uence decision which role the immense supply of coal will play in future in the global energy supply. In addition, coal could moderate possible future bottlenecks in oil supply by means of coal liquefaction.
Natural gas has suffi cient potential to take over the part of a bridging energy carrier to-wards renewable energies for the next decades. Traditional reserves of natural gas show a strong regional concentration. Thus, the three leading countries possessing most of the natural gas, Russia, Iran and Qatar harbor more than half of the reserves. The high spe-cifi c transportation costs of natural gas are disadvantageous in comparison to crude oil and coal.
The proportion of liquefi ed natural gas (LNG) in transportation will continue to rise. Owing to long-term obligations of delivery and regional markets for natural gas, no dominant world market comparable to crude oil will develop.
Unconventional natural gas, in particular natural gas from tight reservoirs gas, shale gas and coal bed natural gas will assume greater importance in satisfying the demand for tight gas. The production of natural gas from gas hydrate is still in the testing stage.
Crude Oil is the most important energy resource and will remain so in future. Based on the current degree of depletion of the reserves, conventional oil will not be available in the foreseeable future at the previous amounts.

INTRODUCTION
15Energy Resources 2009
Based on the existing general requirements of the oil market for an optimum use of the reserves and resources, the global maximum of the production of conventional crude oil will be reached around 2020. If, in addition, increases in reserves from producing depos-its and the possible production of oil from oil sands are taken into account, based on the mentioned prerequisites, an increase of the production until 2035 is possible (Fig. 1.2). According to the projections conducted in the course of this study, the future production of oil will not exceed 4.7 Gt per year. Just as for natural gas, the remaining reserves are increasingly concentrated in the strategic ellipse. National state-owned oil companies are increasingly forcing international trusts into the background, where access to the reserves and production are concerned.
Figure 1.2: Historic development of oil production and projected course of production for conven-tional oil including condensate (NGL) and additionally taking into account the oil sand production and increases in reserves (Field Growth).
Unconventional oil, in particular from oil sands, shall play an increasingly important part in the future. The expected maximum in production for oil, however, cannot be delayed for long. Signifi cant additional oil - but also potential for natural gas is expected in the frontier areas of the Arctic and the deep-water areas of the edges of the continents. In particular, due to the more effective oil recovery of producing fi elds, additional increases in reserves will occur.
The particular situation of oil is also demonstrated by the synopsis of reserves and resources of the non-renewable energy resources (Fig. 1.3). This impression is even further intensi-fi ed in comparison with the cumulative consumption in the period from 2008 to 2030 in accordance with the reference scenario of the IEA (2008b). Whereas coal has the greatest potential by far, a still relaxed image emerges for natural gas and uranium. Crude oil is the energy resource, whose deposits have been depleted most on a global scale.

INTRODUCTION
16 Energy Resources 2009
Figure 1.3: Supply situation (reserves and resources) of non-renewable energy resources in com-parison with a demand scenario by the IEA (2008) to 2030.
References on the Availability of Energy resources - 1.1 An Overview
BGR (Bundesanstalt für Geowissenschaften und Rohstoffe) (2003): Rohstoffwirtschaftliche Länderstudien XXVII: Reserven, Ressourcen und Verfügbarkeit von Energierohstoffen 2002. – 426 p; Hannover.
IEA (International Energy Agency) (2008a): Electricity Information 2008. – 760 p; Paris.
— (2008b): World Energy Outlook 2008. – 569 p; Paris.

DEFINITIONS, CLASSIFICATIONS
17Energy Resources 2009
Energy Resources — Defi nitions and 2 Classifi cations
Energy Resources of the Earth2.1
Non-renewable energy resources include the fossil energy resources oil, natural gas and coal as well as the nuclear fuels uranium and thorium. The total sum of these energy resources constitutes the backbone of the global energy supply at a percentage of 87 % of the total primary energy supply in 2006 (Fig. 2.1).
Figure 2.1: Proportion of the individual energy resources on the total primary energy supply in 2006 worldwide (IEA, 2008).
The energy resources are widespread as natural resources and occur in great amounts and in varied form in the earth crust.
Crude oil, natural gas and coal are remains of organic life forms, differing according to their origins: During certain geological conditions in the course of the Earth’s history, large amounts of dead organic material were incorporated into sediments. These rocks enriched in organic material sunk into deeper and hotter zones of the earth crust due to geological proc-esses. During these processes, the dead organic material continuously kept changing due to the high temperatures. The different stages of the so-called coalifi cation are representative of this change: Anthracite coal as fossil organic material has been submerged deeper in its geological history and was thus exposed to higher temperatures than lignite. In the course of this conversion of organic material, hydrocarbon molecules have also developed, which migrate into the cavities and pores of the rock. Depending on the kind of the hydrocarbon molecule and on the pressure and temperature of the individual rock, these mixtures of hydrocarbon occur either as a liquid – crude oil - or as a gas - natural gas.
The nuclear fuels uranium and thorium are also natural components of the rock of the earth crust. Due to natural radioactive decay, they continuously generate energy in form of heat in the rock. The fact that the earth’s temperature rises with increasing depth can about half be attributed to the radioactive decay of these substances.

DEFINITIONS, CLASSIFICATIONS
18 Energy Resources 2009
There are considerable amounts of thermal energy present inside the earth. This geothermal energy exceeds the usable energy from non-renewable energy resources many times over. Even if its proportion in the global energy extraction is still minimal, this study will treat geothermal energy as geogenic source of energy. Geothermal energy is generally considered as a renewable energy and differs from oil, natural gas, coal and the nuclear fuels in that no primary production of raw materials in the sense of mining precedes. Thus, there is no material aspect in geothermal energy in the original sense of the word. This involves specifi c technical features of production and technical use of geothermal energy (Chapter 7). In this respect, geothermal energy maintains a special status in the following explanations, which also becomes apparent in a deviating classifi cation of deposits (Chapter 2.5).
From the Occurrence of Energy Resources to 2.2 Mineral Deposits
Only few occurrences of energy resources are economically exploitable. If the resource is present in suffi cient concentration, the recoverability of a known occurrence is possible, if it is technically feasible to develop the occurrence, if the production is economically profi t-able and if there are no other higher-level reasons, e.g. social or economic considerations, which argue against the usage. Occurrences which can be exploited under these conditions are called deposits.
In view of the types of the energy resource occurrences, of the economically usable amounts of resources, of the technical feasibility of production and also of the security of supply of energy resources, a number of terms such as availability, reserves and resources, reach, conventional and non-conventional resources have been formed. These terms can be used to designate different aspects of the availability of the energy resources. They are omnipres-ent in professional circles as well as in the general language use. There is not, however, a defi nition that has been recognized either globally or even only for a branch of an industry. The terms shall be defi ned below to make this study more easily comprehensible. Individual energy resources are also classifi ed this way.
Classifi cation of Energy Resources by Types2.3
For crude oil, natural gas and uranium a subdivision into conventional and unconven-tional occurrences is standard. For oil and natural gas, conventional occurrences are the ones for which a production based on classic exploration, production and transport methods is possible. In view of these classic methods, fl owing oil and freely fl owing natural gas can be used. According to this soft defi nition, the development and use of unconventional oc-currences requires alternative technologies. Aspects of economic effi ciency and the fact, whether the individual deposit is already used for production, are not considered for this defi nition. A classifi cation of the energy resources in this sense has been depicted in Figure 2.2. For coal, a subdivision into conventional and unconventional occurrences is not cus-tomary (Chapter 2.3.3).

DEFINITIONS, CLASSIFICATIONS
19Energy Resources 2009
Figure 2.2: Classifi cation of the non-renewable energy resources.
Conventional and Unconventional Oil2.3.1
Oil is subdivided into conventional occurrences together with liquid hydrocarbons, the so-called natural gas liquids (NGL), which are extracted in the course of the production of natural gas such as condensate or liquefi ed gas, as well as heavy oil. Among unconventional oil, extra heavy oil is numbered, which is barely capable of fl owing due to its high viscosity as well as bonded oil in oil sands and oil shale. This way, conventional oil can also be defi ned physically, based on density: Oil with a density of less than 1.0 g/cm³ (or greater 10°API) belongs to conventional oil (Fig. 2.3).
Figure 2.3: Classifi cation of crude oil according to its density.
Different classifi cations for oil include aspects of the conditions of the incidence of the oc-currences. Some authors designate offshore-occurrences, occurrences below a certain depth of water or in certain regions as unconventional. Campbell (1997, 2002, 2006) includes offshore-oil in water depth greater than 500 m (deep water) and oil in arctic regions as well as condensate in spite of the above-mentioned conventional technologies for production among unconventional oil. This procedure excludes occurrences of crude oil, for which the assessment of resources is still rather diffi cult, from scenarios of future availability of oil. As a consequence the global reserves and resources (Chapter 2.4) of conventional oil are considerably underestimated.

DEFINITIONS, CLASSIFICATIONS
20 Energy Resources 2009
Other authors, such as Schollnberger (1998) include all crude oils amongst conventional oil, which can be economically produced, independently of their physical properties, the type of the occurrences and the technology necessary for production. This defi nition is based on the perception that consumer are mainly interested in the price of the energy resource. This subdivision between conventional and unconventional is, however, very close to the one described in Chapter 2.4.2 into reserves and resources and is thus not recommended. Oil statistics are also inconsistent where the terms conventional and unconventional are con-cerned. Some countries report amounts of reserves including unconventional occurrences, for most countries the production data contain unconventional oil.
Conventional and Unconventional Natural Gas2.3.2
Just as for oil, occurrences of natural gas are usually called conventional if exploitation us-ing classic production technologies is possible. According to Figure 2.2, this includes free gas in natural gas deposits or gas condensate deposits as well as associated gas, which is dissolved in oil accumulations.
Unconventional natural gas does not fl ow in suffi cient amounts towards a production well without further technical measures, as it either does not occur in free gas-phase in the rock or as the reservoir rock is not suffi ciently permeable. These unconventional occurrences of natural gas comprise shale gas, tight gas, coalbed methane, aquifer gas and gas hydrate.
For shale gas and tight gas, the permeability of the reservoir rock is very small. For the production of natural gas from tight rocks, technical measures have to create pathways in the reservoir rock. Therefore, the rock is broken up (fractured) via drill holes applying high hydraulic pressure.
Coalbed methane, CBM, is natural gas which occurs in coal bearing basins in coal seams in absorbed form or in micro-fi ssures and micropores. It is also extracted through drill holes and the infl ux is stimulated by cracking open the coal seams using artifi cial fractures.
Aquifer gas is the term for natural gas that is dissolved and dispersed in the groundwater and can be released by pressure relief, when the water is brought to the earth’s surface.
Gas hydrate is an ice-like, solid bonding of methane and water, which can develop at low temperature and high-pressure conditions (stability zone). Gas hydrate occurs in polar per-mafrost areas and in certain water depths at the continental margins of the oceans.
Classifi cation of Coal2.3.3
A subdivision of coal deposits into conventional and unconventional occurrences is not cus-tomary. Several of the coal producing countries also have their own classifi cation of coal. This complicates the comparability of the different types of coal and the associated differ-ent classifi cations into classes of resources (BGR, 2003). Important distinctive features of coal deposits used for classifi cation refer to physical properties of coal such as the energy content (calorifi c value) and the vitrinite refl ectance as well as to the chemical composition using parameters such as the moisture content (bed moisture) or the proportion of volatile matters (Fig. 2.4).

DEFINITIONS, CLASSIFICATIONS
21Energy Resources 2009
Figure 2.4: Comparison of the BGR-coal-classifi cation with the systems of the UN-ECE (in-seam coals) and the USA.
In the German-speaking area, the types of lignite are generally distinguished according to their moisture content and the associated strength and color. In contrast, the types of hard coal as well as anthracite have been classifi ed according to their proportion of volatile matters and energy content as well as in accordance with the composition of the so-called coking residues (Pohl, 1992).
The BGR lists the coal reserves and coal resources divided into lignite and hard coals in their studies of energy resources (Fig. 2.4). All coals with an energy content of less than 16 500 kJ/kg are allocated to lignite; all coals with an energy content above 16 500 kJ/kg are considered hard coals. As internationally no delimitation between hard coal and lignite has been established, the combination of resource data from different countries can cause allocation problems. The World Energy Council (WEC) subdivided in its coal classifi cation bituminous coal including anthracite, sub-bituminous coal and lignite. Exact limit values for the classifi cation of coals have not been specifi ed by the WEC. The WEC reasons that there is no universally accepted system for the classifi cation of coals. Thus, the allocations to these three coal groups may differ from one country to another and in particular the data relating to the sub-bituminous coals cover bituminous coals and also lignite in a number of countries (WEC, 2004).
DEFINITIONS, CLASSIFICATIONS
22 Energy Resources 2009
Conventional and Unconventional Uranium2.3.4
Uranium deposits are called conventional, if they have a traceable production history, for which uranium is the main product or a major by-product. Uranium enrichments in rocks can be based on very different geological processes. This results in numerous types of con-ventional uranium deposits (Chapter 6.1.1). Occurrences with low contents, where uranium is only recoverable as a minor by-product or only in very low concentration are considered unconventional deposits accordingly (Fig. 2.2). These unconventional occurrences consist of seawater, granite, phosphorite and black shale.
Reserve Classifi cation of the Energy Resources 2.4
The Quantifi cation of Resources2.4.1
Occurrences of oil, natural gas, coal, uranium and thorium as components of the earth crust elude, in general, the direct observation. Large areas of the earth, such as great parts of the Arctic or the deep-water areas of the continental margins have been little explored, thus statements concerning possible deposits of resources are based on arbitrary observations or assumptions. The actual amounts of energy resources in the earth’s crust are hence presently not known.
It is also impossible to specify, with satisfactory accuracy, the extent of the usable amounts of energy resources of the earth. Information about enrichments of these resources can be gathered for known occurrences from conclusions from observations at the surface of the earth, from spot-wise information of drill holes, by mining or by indirect exploration, such as the seismic sound transmission through the underground. In the course of the development and during production of a deposit, geological data and production data are collected continuously. This information has to be interpreted geo-scientifi cally to obtain an assessment of the actually recoverable amount of the reserves in the deposit. But usually it is not possible to estimate the exact volume of the deposit and the quality of the energy resource.
Even at the time the production at a deposit is terminated, it is often not known, how much of the resource remains in the ground, because only in very rare cases a deposit is completely depleted when the production is ceased. Thus, production is ceased, when the operating company or the consortium decides to stop further investments in the expansion and the continued production of this deposit and the remaining production is no longer suffi ciently profi table. Reasons for such decisions are frequently of a geological or technical kind, but can also be due to the changing political and economic conditions. In the global average, for instance, the production of oil deposits is stopped after about a third of the originally existing oil in-place has been extracted; two thirds remain in the reservoir. With increasing production of oil reservoirs, the proportion of produced water increases and the pressure gererally decreases. Even if large amounts of oil remain in the reservoir, production will become uneconomical at a certain point.
Information concerning the amount of the producible and usable resources thus always depends on the geological conditions of the deposits, the state of the scientifi c and techni-cal knowledge, the technological potential of the development and production as well as on

DEFINITIONS, CLASSIFICATIONS
23Energy Resources 2009
the economic and political requirements. Correspondingly, the intentions and methods to assess the amounts of energy resources vary.
Companies producing resources are interested in data that are as accurate as possible concerning the contents of their individual deposits and conduct the evaluation of the de-posit contents with high accuracy. These data constitute the base of the business for these companies and signifi cantly infl uence their investment decisions. Ultimately, the resource volumes are estimated in accordance with the individual data status for every individual reservoir. To what extent the information shall be made available to the public depends on the legislation and the habits of the company and of the corresponding country.
Economic and energy policy also need numbers relating to supplies of energy resources as planning basis. A direct relation to individual petroleum deposits is frequently not neces-sary; statistics are prepared for producing areas, countries or continents. These statistics, for instance, are gathered by national geological services or by international organizations, such as the IEA. There is one general distinction that applies to all resource statistics, the one between those resource amounts, whose exploitation is regarded as proven (reserves) and those resources, whose existence is only assumed or whose production is currently not assumed possible (resources).
BGR-Defi nition of Reserves2.4.2
Reserves are those amounts of energy resources, which have been accurately recorded and which can be economically extracted using the current technical possibilities.
Synonymously used expressions are recoverable (coal) as well as proved recoverable amounts/resources. The defi nition mentioned above means that the amount of reserves depends on the level of knowledge about the deposit, on the commodity prices and the present state of the technology. This dependence on the price is particularly pronounced for uranium, the only energy resource whose reserves and resources have been for a long time subdivided in accordance with the production costs. For uranium the BGR equals reserves in the sense of the above-mentioned defi nition with production costs for secure reserves of less than USD 40/kg in accordance with the defi nition of NEA and IAEA.
Resources are those amounts of an energy resource, which have been geologically proven, but which cannot be extracted economically at that time and the amounts, which have not been proven, but which can be expected for geological reasons in the area concerned.
Only the expected and potentially economically extractable amounts of the resources of oil, natural gas and uranium have been taken into account. For coal these are, generally, in-situ amounts, i.e. the total amounts independent of their recoverability.
The estimated ultimate recovery (EUR) is the total extractable amount for hydrocarbons, i.e. the sum of the amounts extracted up to now, plus the reserves and the resources.
The remaining potential is the still extractable amount of energy resources, i.e. the sum of the reserves and resources. For coal and uranium the term “total resources” has been used as a synonym. It has to be noted that reserves are not part of the resources.

DEFINITIONS, CLASSIFICATIONS
24 Energy Resources 2009
Figure 2.5: Reserve classifi cation of the energy resources
The initial reserves are the total hitherto proven reserves of energy resources, i.e. the sum of the hitherto produced total amounts and the reserves known today. Figure 2.5 provides an overview over the delimitation of the reserve/resource terms for the energy resources. Besides this BGR-defi nition, there is a great number of different classifi cations, depending on the resource and the country, the most important of these shall be dealt with below.
Other Classifi cation Systems for Energy Resources2.4.3
Crude oil and natural gas The Oil and Gas Reserves Committee of the Society of Petroleum Engineers (SPE) com-pared a number of different common national and international classifi cation systems for oil and natural gas in 2005 (SPE, 2005). These comprise three different views: The rules issued by stock exchange supervision such as the United States Securities and Exchange Commission (SEC) contained defi nitions for secure reserves up to now. In 2009 the SEC started to include probable and possible reserves as well. Government institutions such as the Norwegian Petroleum Directorate (NPD) cover the complete spectrum of the reserves and resources referring to the specifi cations of their own countries. The United Nations Framework Classifi cation (UNFC) and the classifi cation of the SPE/WPC/AAPG/SEEC (World Petroleum Congress, American Association of Petroleum Geologists, Society of Petroleum Evaluation Engineers) can be regarded as the only worldwide standards with universal ap-plicability.
For the purposes of the BGR, i.e. a worldwide registration of the reserves/resouces, the third category is of particular importance. The SPE/WPC/AAPG/SEEC-classifi cation devel-oped historically from different classifi cations, which have been created amongst others by the WPC and in parallel by the SPE and which have successively been combined to a joint classifi cation, the Petroleum Resource Management System (PRMS), starting in 1990. The latest version of this system was published in 2007 by the two organizations together with the AAPG and the SEEC as joint classifi cation system (SPE, 2007). The PRMS is the most common system in the oil industry. It comprises the complete spectrum, from reserves to resources. Important parameters for the subdivision of reserves and resources are the economic effi ciency of the exploitation of a deposit and the degree of uncertainty of the estimated amount of the resource (Fig. 2.6). The latest version has already incorporated

DEFINITIONS, CLASSIFICATIONS
25Energy Resources 2009
current trends such as the increasing use of unconventional energy resources. Depending on how reliable the detection is considered, reserves are subdivided into proved (P1), prob-able (P2) and possible reserves (P3) (Fig. 2.6). The labels 1P for proved, 2P for the sum of proved and probable and 3P for the sum of proved, probable and possible reserves (Fig. 2.6) are also in use. For resources, the PRMS distinguishes contingent resources (discovered but subcommercial) and prospective resources (undiscovered).
Figure 2.6: Petroleum resource management system SPE/WPC/AAPG/SPEE (SPE, 2007).
The frame classifi cation UNFC has been developed by order of the UN-ECE in collaboration with BGR. Originally created for coal and other mineral resources, in 2003 an extension to include oil and natural gas was suggested (UN, 2003). Object of the classifi cation is to make reserves and resources comparable, which have been analyzed according to differ-ent national classifi cations and regulations. The system is based on a three-dimensional structuring of the deposits in accordance with the factors geological stage of investigation (G), feasibility/project status (F) and economy (E) (Tab. 2.1). A combination of three key numbers can thus be assigned to every deposit regarded.
In spite of a uniform classifi cation, the numbers referring to reserves are not very transpar-ent. For this reason, the IEA has requested more transparency in the assessment of reserves and the disclosure of the required data. From this perspective, the ongoing activities towards harmonization of these two classifi cations are considered promising. For the purposes of the BGR, both classifi cations, PRMS and UNFC, have turned out to be too detailed. Due to the very different data sources and data qualities, the globally researched reserve data by BGR cannot be integrated with suffi cient reliability into the complex structures of the UNFC and of the PRMS. For this reason, the simpler system mentioned above has been selected.

DEFINITIONS, CLASSIFICATIONS
26 Energy Resources 2009
Table 2.1: Classifi cation of Oil and Natural Gas Deposits According to the UNFC (UN, 2003).
Coding scheme EProfi tability
FFeasibility(Project status)
GGeological degree of exploration
10 Profi tability(commercial)
confi rmed(committed)
proved(proved)
20 conditionally profi table(contingent commercial)
possible(contingent project)
explorated and described(explored and delineated)
30 Not profi table(not commercial)
Exploration discovered(discovered)
40 expected(prospective)
Coal The WEC keeps, just like the BGR, a statistic of the worldwide inventories of coal, which is also based on a somewhat coarse classifi cation system due to insuffi cient data. The two sys-tems are similar, but differ slightly with regard to the details. For instance, the WEC (2004) does not subdivide coal inventories into reserves and resources, but in proved amounts in-place and estimated additional amounts in-place.
The proved amounts comprise the total remaining amounts in known deposits, which have been carefully investigated and which are recoverable under current as well as under ex-pected economic conditions with existing and available technology. These amounts are listed, if available, with data on the minimum seam thickness as well as the maximum depth of the recorded resources in the deposits. The proved recoverable reserves form a subset of the proved amounts, which can be extracted in future under current as well as expected local economic conditions using existing and available technology.
As estimated additional amounts, the WEC lists the indicated and inferred amounts, which will be of economic interest in the foreseeable future in addition to the proved amounts. This includes resources in unexplored parts of deposits or in undiscovered deposits in known coal bearing areas carbonaceous as well as assumed amounts in areas with favorable geological conditions. Speculative amounts are not included. The estimated additionally recoverable reserves are listed as sub-quantity of the estimated additional amounts (Estimated Addi-tional Reserves Recoverable), for which the geological and technical information suggests that there is suffi cient reason to believe that they could be produced in future.
There is no direct comparability of the data of WEC and BGR, as in addition to the differing subdivision of the inventories, both institutions use their own classifi cations of coal.
UraniumIn uranium producing countries, a multitude of individual classifi cations for the supply of conventional uranium has evolved (Fig. 2.7). These subdivisions are, in general, based on the degree of knowledge about the recoverability of uranium amounts in deposits. Every two years, the OECD Nuclear Energy Agency (NEA) together with the International Atomic Energy Agency (IAEA) reports on the uranium resources of the world in their ‘Red Book’. This statistic is considered the standard work on the reserves estimates of uranium and is thus also the base of this BGR-study. Though, NEA and IAEA have introduced a classifi cation system, which, in addition to the standard parameters, specifi es the expected production

DEFINITIONS, CLASSIFICATIONS
27Energy Resources 2009
costs in four categories based on USD/kg uranium (<USD 40/kg, <USD 80/kg, <USD 130/kg and costs unknown).
In accordance with NEA and IAEA, identifi ed resources are separated from undiscovered resources (Fig. 2.7). The identifi ed resources comprise the Reasonably Assured Resources (RAR), and the Inferred Resources (IR), which can be produced at costs of less than USD 130/kg. The proven reserves refer to uranium in explored deposits with known ton-nage, contents and confi guration. These RAR have a high probability of existence and are accordingly considered proven reserves. The inferred reserves comprise uranium deposits derived from direct geological knowledge, but for which there are no specifi c data concerning the supply situation and contents as well as knowledge about the deposit characteristics.
Figure 2.7: Comparison of common resource classifi cations for uranium deposits (NEA, 2005).
The undiscovered resources consist of the Prognosticated Resources and the Speculative Resources (SR). The existence of prognosticated resources is derived indirectly from the knowledge of geological prospectivity in well-defi ned geological formations and areas with known deposits. Assessments of the tonnage, the contents as well as the exploration and total production costs are based on the comparison with known deposits in the same or even in comparable geological areas. SR refer to uranium occurrences whose existence can be assumed based on geological conditions and extrapolation.
For the resource classifi cation of the BGR (Chapter 2.4.2), the assured reserves of the NEA and IAEA at production costs of less than USD 40/kg are called reserves. Assured reserves with higher production costs, inferred reserves and undiscovered resources in accordance with NEA and IAEA are thus listed as BGR-resources. This takes into account the aspect of the BGR-defi nition of reserves of the economic extractability. An adaptation of the BGR-defi nition of reserves to a higher cost category of NEA and IAEA in the past high-price phase was not conducted, in particular for reasons of comparability with earlier studies.

DEFINITIONS, CLASSIFICATIONS
28 Energy Resources 2009
Resource Classifi cation for Geothermal Energy2.5
The amounts of geothermal heat quantities, which have been recorded quantitatively and which are economically producible at the current economic conditions and current techni-cal possibilities are called geothermal reserves (Haenel & Staroste, 1988; Kaltschmidt & Wiese, 1997).
Geothermal resources comprise the geothermal reserves and in addition those thermal amounts of energy, which have been proved, but which are currently not economically pro-ducible, taking into account the economic conditions and technical facilities.
This defi nition of resources used for geothermal energy differs from the defi nition of re-sources for the non-renewable energy resources (Chapter 2.4.2). Data about geothermal resources also contain the reserves and thus largely correspond to the remaining potential for oil and natural gas and the total resources for coal and uranium. For geothermal energy, the term may refer to occurrences of resources as well as to occurrences of reserves.
For geothermal energy, a number of other terms besides resources is used, such as theo-retical potential, generation potential, producible amount of heat, maximum producible amount of energy, which are based on different defi nitions and which result in very differ-ent numbers for the same area. When comparing quantitative data about resources, the individual defi nition of the term and the parameters they are based on have to be taken into account (Chapter 7.3).
Data Sources of the BGR-Statistics2.6
The BGR does not produce their own data on reserves of energy resources. Rather, the BGR-resource statistic has been based on an extensive acquisition of the accessible data concerning reserves, resources, production as well as economic and technical trends. The data sources used range from supra-national bodies, such as the IEA or the IAEA, over published statistics of individual companies, reports of offi cial geological services or re-source authorities, non-public political papers, reports in the daily press up to publications in international journals on resources or the scientifi c press. A detailed list of the quotable sources used can be found in the bibliography of the data in the table appendix.
After their acquisition, the data will be evaluated regarding plausibility and adapted to the defi nition of resources, if required (Chapter 2.4.2). Then, they will be combined in the resource database of the energy resources. Information for further evaluation has been listed below.

DEFINITIONS, CLASSIFICATIONS
29Energy Resources 2009
References on Energy Resources – 2.7 Defi nitions and Classifi cations
BGR (Bundesanstalt für Geowissenschaften und Rohstoffe) (2003): Reserven, Ressourcen und Verfügbarkeit von Energierohstoffen 2002, Rohstoffwirtschaftliche Länderstudien, Band XXVIII: 426 p; Hannover.
Campbell, C. (1997): Depletion patterns show change due for production of conventional oil. - OGJ 95, no. 53: 33-37.
— (2002): Conventional Oil Endowment. ASPO Newsletter No. 13: 8.— (2006): Regular conventional oil production. In: ASPO Newsletter No. 64 –April 2006:
11. (www.peakoil.ie) Haenel, R. & Staroste, E. (Hrsg.) (1988): Atlas of Geothermal Ressources in the European
Community, Austria and Switzerland, Hannover (Th. Schäfer).IEA (International Energy Agency) (2008): World Energy Outlook 2008. 570 p – Interna-
tional Energy Agency, Paris.Kaltschmitt, M. & Wiese, A. (Hrsg.) (1997): Erneuerbare Energien – Systemtechnik, Wirt-
schaftlichkeit, Umweltaspekte, 2. Aufl ., Berlin usw. (Springer).NEA (Nuclear Energy Agency) (2005): URANIUM 2005: Resources, Production and Demand,
OECD 2005.Pohl, W. (1992): W. & W. E. Petrascheck´s Lagerstättenlehre. Eine Einführung in die Wissen-
schaft von den mineralischen Bodenschätzen. – 504 p; Stuttgart (E. Schweitzerbart´sche Verlagsbuchhandlung).
Schollnberger, W. E. (1998): Gedanken über die Kohlenwasserstoffreserven der Erde - Wie lange können sie vorhalten? - In: Zemann, J. (Hrsg.): Energievorräte und mineralische Rohstoffe: Wie lange noch. - Österreichische Akademie der Wissenschaften, Schrift-enreihe der Erdwissenschaftlichen Kommissionen, 12: 75-126.
SPE (Society of Petroleum Engineers) (2005): SPE Oil and Gas Reserves Committee Map-ping Subcommittee Final Report – December 2005 APPENDIX A Detailed Description of Agencies’ Classifi cation/Defi nitions, 87 p.
— (2007): Petroleum resource management System 2007.- http://www.spe.org/spe-site/spe/spe/industry/reserves/Petroleum_Resources_Management_System_2007.pdf , 49 p.
UN (2003): United Nations Framework Classifi cation (UNFC) applied to Petroleum Resourc-es.- Distr. General: ENERGY/GE.3/2003/1, 17 March 2003, 25 p.
UN-ECE (United Nations Economic Commission for Europe) (2004): United Nations Frame-work Classi fi cation for Energy and Mineral Resources. – (http://www.unece.org/ie/se/reserves.html)
WEC (World Energy Council) (2004): 2004 Survey of Energy Resources. Elsevier Ltd. (CD-ROM)


CRUDE OIL
31Energy Resources 2009
Crude Oil3
From 3.1 Deposit to Consumer
Oil is a collective term for a liquid, natural mixture of hydrocarbons, whose chemical com-position and physical characteristics can vary signifi cantly. Crude oil may have low to high viscosity; it may be straw-colored to black-brown and mostly has a density between 0.78 and 1.0 g/cm3 (Fig. 2.3). Important physical characteristics for oil are, besides density, viscosities and the pour point.
Crude oil has different geochemical compositions, depending on its origin. It contains liquid, but also dissolved gaseous and solid hydrocarbons, amongst them alkanes, cycloalkanes and aromatics, but rarely alkenes. In addition, oil contains 0.1 % up to 7 % sulfur bonded to molecule types such as thiols, thiophenes and heterocyclic compounds, moreover nitro-gen compounds, naphthenic acids as well as high-molecular colloidal substances, in which also traces of metals such as nickel and vanadium can be bonded. Oil can be differentiated into paraffi n-based and naphthene-based, depending on whether it consists mainly of al-kanes (paraffi nes) or cycloalkanes (naphthenes). Asphaltenic oil contains more than 60 % asphaltenes. Paraffi n-based types of oil mostly have a lower sulfur content. They are more suitable for production of diesel fuels with improved ignitability and lubricating oils with a higher viscosity index. Naphthene-based types of oil have a better performance at low temperatures and yield gasoline with a higher octane number.
Crude oil occurs in the subsurface rocks in different depths from a few meters down to 4000 m, in some cases even deeper. Economic deposits, so-called oil fi elds, are located in porous or fractured-cavernous reservoir rock, which is sealed at the top by impermeable seals and shows a trap position. Sandstones and carbonates can act as reservoir rocks. Deposits consist either of one or several oil-bearing layers. When the deposit’s develop-ment begins, the crude oil is usually pressurized, making it fl ow quasi eruptively towards the earth’s surface. In the course of production, the pressure inside the deposit decreases and it becomes necessary to employ borehole pumps or rotary borehole pumps for oil pro-duction purposes. Besides these methods of production, processes for increasing the oil recovery out of the deposits, the so-called Enhanced Oil Recovery (EOR), are being used (Info box 2).
Crude oil from natural points of emergence was already known in the ancient world and was initially used for medical purposes, in civil engineering but also for warfare. Later, usage as an illuminant was added. For nearly 150 years, oil has been exytracted industrially. The economic production of oil started in the middle of the 19th century nearly simultaneously in Azerbaijan, Poland, Romania, the US but also in Germany. In Germany, the cradle of the petroleum industry is located in Wietze (Chapter 8.1.1). The invention of the combustion engine at the end of the 19th century was the basis for the success of petroleum as most important energy source of the emerging economy. Today, petroleum is of major importance for transportation, heat generation and the chemical industry. In the second half of the 20th century, petroleum was the most important energy source and ensured growth and prosperity. The access to oil occurrences also caused confl icts and wars, however.

CRUDE OIL
32 Energy Resources 2009
Oil is subdivided into conventional and unconventional oil, dependent on whether an eco-nomic production using classic production technologies is possible, or whether new and expansive technologies have to be developed and applied (Chapter 2.3.1). As production technologies and energy price levels are subject to constant change, the distinction between unconventional and conventional hydrocarbons in accordance with technical aspects and marketability is not clear. There is no standard of terminology, however, thus unconventional petroleum is included in the reserves of some countries, for nearly all countries it is part of the production data.
Oil is, just like natural gas, a fi nite natural resource. The consumption of these resources has reached a considerable dimension by now. To form the amount of oil and natural gas consumed annually nature took about one million years. At a percentage of nearly 36 % of the total primary energy supply (without biomass), oil is the most important energy source globally (BP, 2008) and simultaneously a natural resource in petrochemistry. Nearly 10 % of the global oil production is used for petrochemical purposes. The percentage of oil of the total primary energy supply increased from about 30 % in 1950 to nearly 50 % in 1973. In the course of the fi rst oil price crisis, a slight reduction to about 48 % occurred. After the second oil price crisis in 1980, the percentage decreased until 1985 to about 40 %. Ever since, this level has been nearly constant, with a slightly decreasing tendency. Prognoses of the IEA (IEA, 2008a) assume that up to 2030 no serious changes of the relevance of petroleum as energy resource will occur.
Conventional Oil3.2
EUR of Crude Oil and its Regional Distribution 3.2.1
The subsequent assessment of the Estimated Ultimate Recovery (EUR) of conventional oil primarily takes into account the results of the US Geological Survey’s world assessment (USGS, 2000) and their updates. The evaluations of other authors and data of national in-stitutions concerning the resources have been included as well as published results of the petroleum exploration of the past years.
At the end of 2007 BGR estimate the EUR of conventional oil at 400 Gt. Changes in com-parison to the short study of 2007 (BGR, 2008) resulted from revisions of the reserves of Venezuela by eliminating the extra heavy oil reserves (Chapter 3.2.2) just like newer evaluations of resources (Chapter 3.2.3). This BGR-value for the total potential of petroleum surpasses the assessment of the 2002 energy study (BGR, 2003) with 359 Gt, but is lower than the last assessment of the USGS, which has assumed 450 Gt including NGL (Chapter 2.3.1) and taking into account an expected growth of reserves (“reserve growth”). In gen-eral, the current assessment by the BGR follows the trend of the resource assessments of the past years (Fig. 3.1, Tab. A 3-1). Since the end of the 1980s, the published assessments of the total potential vary between 300 and 500 Gt with a mean value of 400 Gt.
Extreme deviations downwards show in particular Campbell (2008) at 255 Gt (1875 Gb), who discounts the reserves of the OPEC countries and who also excludes from his assess-ments the deep-water areas and the Arctic regions as well as NGL. These reasons explain his extremely low assessment only in part, however. The totals of his published values (No.

CRUDE OIL
33Energy Resources 2009
61, 68, 75, 80 in Fig. 3.1) are all within the range of the original reserves, which indicates that his evaluations have been somewhat pessimistic.
Figure 3.1: Development of the estimates concerning the Estimated Ultimate Recovery (EUR) of conventional oil, the cumulative production and reserves from 1940 to 2007 (sources for numbered references cf. Tab. A 3-1).
The stabilization of the assessments of the EUR of conventional oil, within the depicted limits that can be observed over the course of the past few years, indicates an upper threshold for the globally available conventional petroleum. An increase of the potential seems possible from today’s perspective due to improved production technologies, resulting in a higher recovery and thus in an increase of the economically recoverable part of the oil in place of the deposit. In theory, an increase of the recovery factor by 1 % referring to the global petroleum potential would correspond to an amount of about 10 Gt, i.e. app. 2.5 times the annual production of 2007. It has to be noted, however, that this applies primarily to new, as yet not developed fi elds and only to a limited extent to fi elds already in production, thus the expected potential is lowered. The future development of the oil price is important, as extensive and costly research and development works will only be conducted and imple-mented if the price level is suffi ciently high.
The EUR, subdivided in cumulative production, reserves and resources, varies strongly de-pending on the region (Fig. 3.2). The Middle East has the greatest EUR, followed by the CIS and North America. In North America, nearly two thirds of the expected EUR have already been recovered. In the CIS countries, only about one third has been recovered and in the Middle East only about a quarter.
In relation to the economic policy groups, the OPEC at about 210 Gt holds more than 52 % of the EUR, while only one fourth of the oil there has been recovered. The signifi cant increase in comparison to previous statistics is due to the new members Angola and Ecuador. The OECD countries achieve only 79 Gt, of these nearly 63 % have already been produced. In comparison with the BGR-energy study of 2003, great increments have occurred for the Middle East with an additional 12.2 Gt, the CIS with an additional 8.0 Gt, Africa an additional

CRUDE OIL
34 Energy Resources 2009
6.9 Gt, Latin America at plus 5.2 Gt and North America at plus 5.0 Gt as well as to a lower extent for Austral-Asia and Europe with additional 1.9 and 1.2 Gt, respectively.
Figure 3.2: Regional distribution of the EUR of conventional crude oil in 2007 (total 400 Gt).
Overlooking the EUR of the most important countries, itemized according to cumulative production, reserves and resources, ten countries remain in focus, which hold over 70 % of the EUR and about 73 % of the remaining potential (Fig. 3.3). Such a high concentra-tion in few countries will have consequences for the future exploration and production. The OPEC countries (indicated by blue characters) are dominating. The US only take rank 7 for remaining potential in spite of having the third-largest total potential. This is caused by its very long production history combined with the globally highest cumulative production. Only a comparatively little recoverable potential remains.
For the OPEC countries of the Persian Gulf region, the ratio of resources to reserves is very small in comparison to the other countries. Thus, even in case of politically motivated ex-aggeration of the reserves for these countries, the total amount or the remaining potential is still depicted quite realistically. An overview over the total and the remaining potential of the individual countries, regions and economic groups is given in Tables A 3-2 to A 3-4.

CRUDE OIL
35Energy Resources 2009
Figure 3.3: EUR of conventional crude oil in 2007: The top twenty countries sorted according to remaining potential (OPEC countries in blue bold-face type).
Crude Oil Reserves3.2.2
The evaluation of the oil reserves is based on the Petroleum Resource Management Sys-tem (Chapter 2.4.3) jointly prepared by SPE/WPC/AAPG/SPEE. This does not, however, preclude deviations in the reserve information in different sources for the same country. Corresponding tendencies for exaggerating or lowering the actual reserve numbers have been discussed in the 2002 Energy Study (BGR, 2003) in detail. In addition, different ap-proaches by companies and governments play a role, thus an absolute confi rmed compa-rability of the globally existing reserves cannot be achieved. All reserve data have thus to be regarded with caution and with reservations. The objective of the assessment of global reserves cannot be an exact number, but an order of magnitude close to reality.
This evaluation has included the reserves of conventional crude oil, condensate and other liquid components of the natural gas production. It is based on different published sources (cf. list of references of the data in the annex of tables), in addition, data by national au-thorities have been taken into account and BGR-evaluations have been conducted. In part, departures from other sources result, as can be seen from a comparison of the values relating to individual regions in Table 3.1. The statistics mentioned as a rule only report proven reserves. Probable and possible reserves are considered only rarely, thus in all an undervaluation of the reserves cannot be precluded.
As demonstrated in the comparison of the evaluations of the petroleum reserves by different publications (Tab. 3.1), the Energy Watch Group (EWG, 2008) at 116.3 Gt shows the lowest and OGJ (2007), taking into account the oil sands of Canada, at 181.2 Gt gives the highest value. If the Canadian oil sands are deducted from the reserves, a rather good concurrence of the depicted assessments results, with exception of the evaluation of the EWG. The sig-nifi cantly lower values of the EWG mainly result from lower evaluations of reserves for the Middle East. The reserve fi gure is only about half of the values stated by other sources. This deviation has been justifi ed by the opinion that the other reported reserves have been
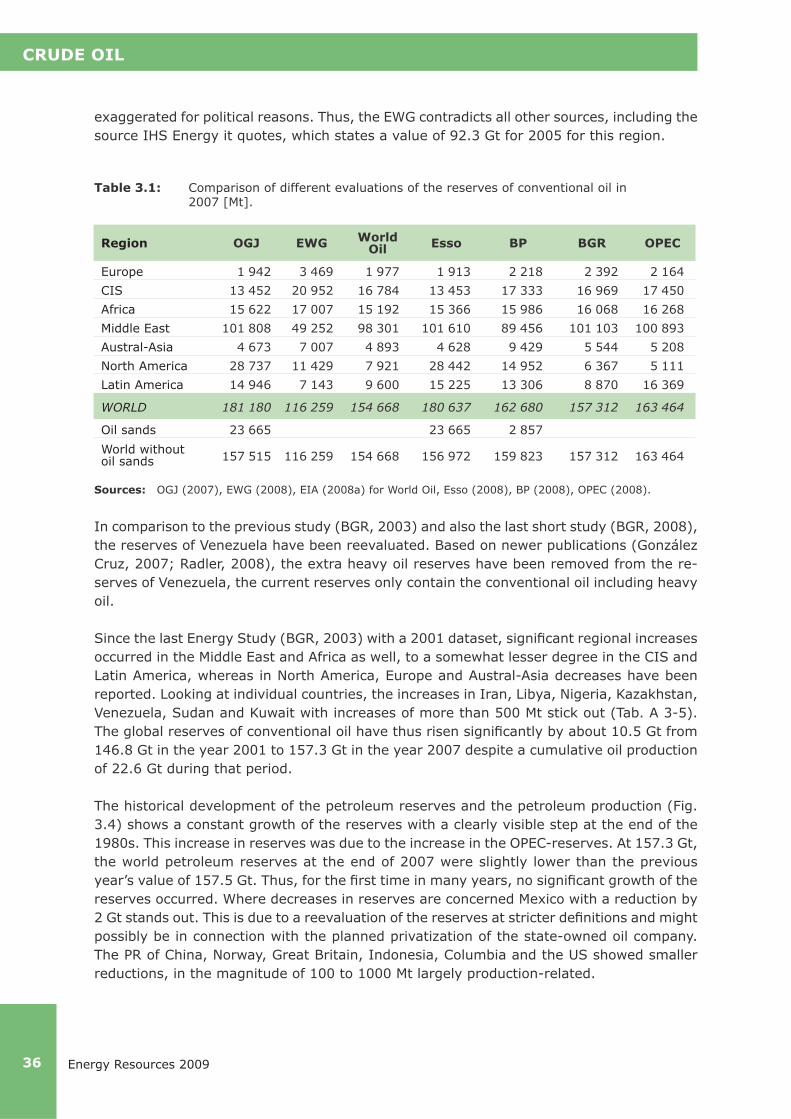
CRUDE OIL
36 Energy Resources 2009
exaggerated for political reasons. Thus, the EWG contradicts all other sources, including the source IHS Energy it quotes, which states a value of 92.3 Gt for 2005 for this region.
Sources: OGJ (2007), EWG (2008), EIA (2008a) for World Oil, Esso (2008), BP (2008), OPEC (2008).
In comparison to the previous study (BGR, 2003) and also the last short study (BGR, 2008), the reserves of Venezuela have been reevaluated. Based on newer publications (González Cruz, 2007; Radler, 2008), the extra heavy oil reserves have been removed from the re-serves of Venezuela, the current reserves only contain the conventional oil including heavy oil.
Since the last Energy Study (BGR, 2003) with a 2001 dataset, signifi cant regional increases occurred in the Middle East and Africa as well, to a somewhat lesser degree in the CIS and Latin America, whereas in North America, Europe and Austral-Asia decreases have been reported. Looking at individual countries, the increases in Iran, Libya, Nigeria, Kazakhstan, Venezuela, Sudan and Kuwait with increases of more than 500 Mt stick out (Tab. A 3-5). The global reserves of conventional oil have thus risen signifi cantly by about 10.5 Gt from 146.8 Gt in the year 2001 to 157.3 Gt in the year 2007 despite a cumulative oil production of 22.6 Gt during that period.
The historical development of the petroleum reserves and the petroleum production (Fig. 3.4) shows a constant growth of the reserves with a clearly visible step at the end of the 1980s. This increase in reserves was due to the increase in the OPEC-reserves. At 157.3 Gt, the world petroleum reserves at the end of 2007 were slightly lower than the previous year’s value of 157.5 Gt. Thus, for the fi rst time in many years, no signifi cant growth of the reserves occurred. Where decreases in reserves are concerned Mexico with a reduction by 2 Gt stands out. This is due to a reevaluation of the reserves at stricter defi nitions and might possibly be in connection with the planned privatization of the state-owned oil company. The PR of China, Norway, Great Britain, Indonesia, Columbia and the US showed smaller reductions, in the magnitude of 100 to 1000 Mt largely production-related.
Region OGJ EWG World Oil Esso BP BGR OPEC
Europe 1 942 3 469 1 977 1 913 2 218 2 392 2 164
CIS 13 452 20 952 16 784 13 453 17 333 16 969 17 450
Africa 15 622 17 007 15 192 15 366 15 986 16 068 16 268
Middle East 101 808 49 252 98 301 101 610 89 456 101 103 100 893
Austral-Asia 4 673 7 007 4 893 4 628 9 429 5 544 5 208
North America 28 737 11 429 7 921 28 442 14 952 6 367 5 111
Latin America 14 946 7 143 9 600 15 225 13 306 8 870 16 369
WORLD 181 180 116 259 154 668 180 637 162 680 157 312 163 464
Oil sands 23 665 23 665 2 857
World without oil sands 157 515 116 259 154 668 156 972 159 823 157 312 163 464
Table 3.1: Comparison of different evaluations of the reserves of conventional oil in 2007 [Mt].

CRUDE OIL
37Energy Resources 2009
Figure 3.4: Development of the reserves and production of conventional oil from 1900 to 2007.
Comparing the reserves based on countries (Tab. A 3-6, Fig. 3.5), it is noticeable that Saudi Arabia holds a unique position. It alone possesses 22 % of the global petroleum reserves. The six countries with reserves above 10 Gt are, with the exception of Russia, all OPEC members. They have more than two thirds of the global petroleum reserves.
Figure 3.5: Reserves of conventional oil (Total 157.3 Gt) in 2007 of the top ten countries and Germany as well as their distribution by region.
In a regional context, the countries of the Middle East possess 64 % of the global reserves; nearly 11 % can be attributed to the CIS and about 10 % to Africa. In spite of the rich oc-currences in the North Sea, Europe possesses only a little more than 2 % of the global re-serves (Fig. 3.5). According to economic groups, the distribution of the petroleum reserves is even more irregular. The OPEC possesses slightly more than 76 % of the reserves, of these 63 % are located in the Gulf region, the OECD has only slightly more than 6 %. (Fig. 3.6, Tab. A 3-6). These numbers emphasize the special position of the OPEC for the future

CRUDE OIL
38 Energy Resources 2009
petroleum supply. For comparison purposes, the fi gures also includes the distribution of the natural gas reserves, where the concentration on OPEC is not as pronounced as for petroleum.
Figure 3.6: Distribution of the reserves of conventional oil and natural gas in 2007 according to economic groupings.
Approximately 41 Gt (26 %) of the petroleum reserves are located in offshore areas (Fig. 3.7). Of these offshore-reserves, 11 Gt are located in deep-water areas in depths deeper than 500 m. The offshore-reserves predominate in Europe and Austral-Asia, the largest are located in the Middle East. Due to increasing exploration in offshore-areas, in particular in the Gulf of Mexico, in the Atlantic Ocean off the coast of Brazil and at the west coast of Africa as well as in the Caspian Sea, a further increase of the offshore-reserves and their proportion of the total reserves is to be expected in future.
Figure 3.7: Distribution of the reserves of conventional oil in 2007, onshore and offshore, by region.

CRUDE OIL
39Energy Resources 2009
The oil reserves are owned by private (IOC) and state oil companies (NOC) (Info box 1). Referring to the individual oil companies, a signifi cant predominance of the state companies prevails for the petroleum reserves (Tab. A 3-7). The only private oil company amongst the top ten holders of reserves is the Russian company Lukoil. The fi rst eight ranks are oc-cupied by national oil companies (NOC) from OPEC countries, fi ve of these from the Middle East. The six largest companies with reserves >10 Gt possess 67 % of the global petroleum reserves, about 100 Gt. There are only fi ve private companies amongst the top twenties.
There are indications of a possible future oil reserves increase. On the one hand, the cur-rently ongoing exploration in frontier areas such as the Caspian Sea, in deep water areas in the Gulf of Mexico, off the Brazilian coast, off the west coast of Africa, in Southeast Asia as well as in Arctic regions of Russia and North America might add reserves. In addition, in known fi elds an increase of reserves (fi eld growth) can take place due to improved produc-tion technologies and thus a higher recovery of the initial oil as well as through improved knowledge of the geological structure and of the behavior of the deposits. Technological innovations in the exploration, drilling and production technology play an important role. Thus, 3D and 4D-Seismics contribute to an improved prediction of the structural and in-ternal construction of prospects and fi elds and thus reduce the risk of exploration and fi eld development. In drilling technology, horizontal drilling opens up the possibility of develop-ing hitherto not accessible prospects or those accessible only with great diffi culties, and to increase fl ow rates. The use of mobile units in production technology, so-called Floating Production, Storage and Offl oading (FPSO) units, and subsea installations moves the ex-ploitation of offshore deposits to greater and greater depths. Today, the record for offshore production is in a water depth of 2740 m in the Cheyenne gas fi eld in the Gulf of Mexico.
Due to these technological innovations and further efforts for cost reduction, fi elds become economically useable, which had been considered marginal or uneconomical years ago. These developments have contributed to a continued increase of the reserves over the past years in spite of increased output and stagnant total potential.
Klett et al. (2005) have conducted an analysis of the conversion of the resources shown by the USGS (2000) into reserves and of the reserve growth. Accordingly, increases in reserves of 69 Gb have been realized for oil in the period between 1996 and 2003. Increases from the reevaluation of fi elds under production added up to 171 Gb. Thus, in a period encom-passing 27 % of the period covered by the study of 2000 (25 years), 11 % of the resources have been converted and 28 % of the forecast “reserve growth” has been realized. The amount of oil of 206.7 Gb (28.1 Gt) produced during that time has largely been replaced by the reevaluation of known fi elds. Stark & Chew (2005) indicate an increase in reserves of 603 Gb for the period from 1995 to 2003, of which 138 Gb or 23 % are due to recent discoveries. These numbers probably also contain increases of unconventional oil.

CRUDE OIL
40 Energy Resources 2009
Crude Oil Resources3.2.3
Data on the oil resources are associated with greater degrees of uncertainty than reserve data. In comparison to the reserves, which are reported annually, assessments of resources are conducted irregularly and at longer intervals. The last global assessment was conducted by the USGS in 2000 (USGS, 2000) referring to the end of 1995 and with a projection of 25 years. The mean values for the global resources of conventional oil have been specifi ed at 124.4 Gt for oil and NGL, of these app. 27 Gt NGL. In determining the values for this study (Tab. A 3-8), the previous values of the BGR, the new results of regional USGS-Studies (USGS, 2006, 2008) as well as new results of subsalt exploration off Brazil (Smith, 2008) have been taken into account. As a result, a value for the global petroleum resources of 91.5 Gt has been indicated. This value surpasses the assessment of 2001 (84.3 Gt). The higher evaluation is due to the inclusion of hitherto unconsidered basins in the Arctic and a higher rating of the resources in Brazil. The global amount of resources thus corresponds to little more than half of the oil produced up to now and the reserves. In comparison with the other energy resources, it can be inferred that the production and thus the development of the total potential has progressed furthest for oil.
For the resources, similar to the reserves, a concentration in certain countries has been found. The top ten countries possess nearly two thirds of the resources (Fig. 3.8, Tab. A 3-9). Russia and the US followed by Saudi Arabia and Kazakhstan currently possess the largest crude oil resources. Unlike the reserves, the dominance of the OPEC countries is not refl ected in the crude oil resources. Saudi Arabia, Iran, Iraq and Venezuela are the only OPEC countries amongst the ten most important resource-owning countries (Fig. 3.8). Taken together they possess about 22 % of the crude oil resources.
Figure 3.8: Resources of conventional oil (total 91.1 Gt) in 2007 of the top ten countries and Germany as well as their distribution by region.

CRUDE OIL
41Energy Resources 2009
International vs. National State Oil and Gas Companies
The production of oil is conducted by private international petroleum companies (IOC) as well as national oil companies (NOC). In the 1960s, private oil companies still covered 85 % of the global reserves of petroleum. This ratio has been reversed to this day because of the mass nationalization in the oil-producing countries in the 1970s. The proportion of the global petro-leum reserves of the state petroleum companies is more than 80 % by now. Amongst the ten companies with access to the largest petroleum reserves of the world, the Russian Lukoil is the only private company. For the global oil resources, the infl uence of the private oil companies is even less. There they have access to only 7 % of the resources. For natural gas, state com-panies currently dominate, too. The ten companies holding the largest reserves of natural gas worldwide are state-owned. For international oil companies it becomes increasingly diffi cult to gain access to easily and cheaply exyploitable oil and natural gas occurrences.
Half of the 50 largest oil and gas companies are state-owned at more than 50 % up to 100 %. They can pursue different strategies. The activities can be limited to the development and utilization of the domestic petroleum and natural gas potential. Others seek additional shares in petroleum and natural gas consessions abroad, to safeguard their own energy sup-ply. Today, national state oil/gas companies possess in many cases a comparable capital and knowledge about business management and do not have to rely on technology partnerships with private companies. This applies in particular to state petroleum companies from emerging markets, such as Petrobras (Brazil), PetroChina and Gazprom (Russia), which today possess budgets for research and development just like their competitors. The capital expenditure of state petroleum companies was increased by about 24 % in 2008. In the same period, the international oil companies raised their capital spending only by about 16 %.

CRUDE OIL
42 Energy Resources 2009
Crude Oil Production3.2.4
The statistics on oil production as a rule comprise conventional oil including NGL and in many cases also unconventional oil. A defi nite differentiation is not possible globally, thus the numbers of this statistic contain the whole spectrum of liquid hydrocarbons. The values by BP (2008) and IEA (2008b) have been preferably used as source data for table A 3-10. Statistics from the OGJ, the EIA, data of national institutions, of Arab Oil & Gas, of Inter-fax Russia & CIS Oil & Gas Weekly (for the CIS) as well as of numerous other professional journals (cf. bibliography of the data in the annex of tables) have been taken into account as well.
Since the last Energy Study 2003 by BGR, the global oil production has increased only moderately from 3.52 Gt in 2001 to 3.88 Gt in 2007 (Tab. A 3-10). The greatest increases were found in 2003 and 2004, whereas in 2007 the production decreased slightly. The ab-solute production maximum at 3917 Mt was reached in 2006. At the end of 2007 151 Gt of petroleum had been produced in all since the start of the industrial oil production (Tab. A 3-2). Half of these have been produced within the past 20 years. Thus, the amount pro-duced up to now nearly reaches that of the reserves. If the resources of app. 92 Gt are taken into account, 38 % of the currently expected EUR of conventional oil has already been recovered.
The most important producing regions in 2007 were the Middle East, North America and the CIS (Tab. A 3-11, Fig. 3.9). In comparison to 2001, the CIS, the Middle East and Africa showed production increases of more than 100 Mt. Decreases in the petroleum production concerned in particular Europe at 90 Mt. Referring to individual countries, Russia, Saudi Arabia and Angola reached signifi cant increases (>50 Mt). A greater decrease of more than 40 Mt occurred in Great Britain, Norway and the US. The top ten countries covered nearly 62 % of the oil production (Tab. A 3-11, Fig. 3-9).
Figure 3.9: Production of conventional oil (Total 3.9 Gt) in 2007 of the top ten countries and Germany as well as their distribution by region.

CRUDE OIL
43Energy Resources 2009
Changes in comparison to 2001 also occurred in the ranking of the top ten producing coun-tries. Russia replaced the US on rank two and nearly caught up with Saudi Arabia (Fig. 3.9). Norway and Great Britain disappeared from the top ten and were replaced by the United Arab Emirates and Kuwait. The ten largest producing countries encompass fi ve OPEC coun-tries. According to economic groups, the OPEC accounts for 44 % of the world production, of these 28 % of the Gulf States of the OPEC, the OECD accounts for 28 % with only 4 % in the EU. The proportion of the OPEC at the global petroleum production increased from approximately 20 % in the early 1940s to nearly 50 % in the mid 1970s (Fig. 3.10). Due to the oil price crisis, the proportion of the OPEC decreased in the mid 1980s to about 30 %, kept increasing steadily ever since and reached 44 % in 2007. In the long run, the propor-tion of the OPEC in the petroleum production should keep on increasing. The IEA (2008a) expects for 2030 that 51 % of the petroleum will be produced in the OPEC countries.
The production of petroleum based on regions is more evenly distributed than that of the reserves. The relatively high production rates of the OECD result in a fast extraction of the comparably small reserves, which in turn will result in an increasing dependency on the OPEC. The Gulf States of the OPEC with their huge potential of reserves and production are particularly important. Especially Saudi Arabia is in a position to compensate production failures in other regions at short term as so-called Swing Producer or to drastically restrict the petroleum supply. The reserve capacity in times of high demand for petroleum was decreased for Saudi Arabia at about 1 Mb/d between 2006 and 2008. Due to the fi nancial crisis and declining demand for petroleum, the other OPEC countries have some reserve capacities again.
Figure 3.10: Share of the OPEC countries (orange) in the global petroleum production from 1960 to 2007.
The proportion of the production from offshore fi elds was 37 %, i.e. 1.4 Gt, in 2007. The dominant offshore production areas were the North Sea and the Gulf of Mexico at 210 Mt, each. Other important production regions offshore were the Atlantic Ocean off Brazil, West

CRUDE OIL
44 Energy Resources 2009
Africa (Nigeria, Angola), the Arabic Gulf and South East Asia (China, Vietnam, Malaysia and Indonesia), increasingly also the Caspian Sea. In relation to deep water in depths below 500 m, 157 fi elds were producing in 2007; this signalizes an increase by 113 fi elds since 2000. 91 % of these fi elds are located in the so-called Golden Triangle, encompassing the Gulf of Mexico, Brazil and Western Africa (Petroleum Economist, 2007).
For production as well as for reserves, a preponderance of the state oil companies (Info box 1, Tab. A 3-13) results, but somewhat reduced. This also applies to the Gulf States. In the phalanx of the state oil companies, ExxonMobil and Shell were able to enter the list of the top ten companies and ranked fi fth and sixth, respectively. The top ten producing companies generate at 1.65 Gt oil about 42 % of the global production.
According to Guntis (2002) in 2001, EOR was used to produce 108 Mt or about 3.9 % of the global oil production (Info box 2). Newer detailed data for global EOR-production are not available. With rising prices for petroleum, the number of projects increased over the past few years. The most important countries with EOR-projects are the US, Venezuela as well as Indonesia, Canada and China. Pusch (2007) estimates the potential of petroleum based on EOR available for Europe to be 1.4 Gt, of these 1 Gt in the offshore-areas; for the US it reaches 13.6 Gt.
Globally, the oil production of 2007 was performed by approximately 873 000 production wells. Thus, in 2007 in the global average one borehole produced 4447 t of crude oil. In comparison to 2001 this means a decrease by approximately 39 000 production wells and an increase in productivity by 223 t/a per well. Regionally, the performance of the production wells shows signifi cant differences (Tab. A 3-14). The highest production rates occurred for wells in the Middle East with an average of 107.5 kt/a and Africa with 44 kt/a. The region with the lowest production rates is North America with 1.1 kt/a on average. The majority of the production wells is concentrated in a few countries. The US has a special position in this context. In spite of a reduction by more than 40 000, the USA still has approximately 500 000 wells, thus approximately 57 % of all oil wells worldwide, which taken together produce only 8 % of the global oil production. Together with the US, Russia at 11.4 %, China at 8.2 % and Canada with 7.0 % possesses nearly 84 % of the wells. In comparison, the countries of the Middle East with only a little over 1 % of the wells produce nearly 31 % of the global oil.
Costs of Petroleum Extraction3.2.5
In the upstream-area of the petroleum industry, comprising exploration, fi eld development, production and processing, four types of cost can be differentiated (IFP, 2004):
Exploration costs incurred mainly before the discovery of a hydrocarbon deposit;•
Investment costs for the investigation of the fi eld for decisions concerning the devel-• opment of the fi eld;
Development costs with costs for drilling the production wells, construction of the • surface installations as well as transport facilities and loading terminals at the fi elds and
Operating costs including transportation costs.•

CRUDE OIL
45Energy Resources 2009
The sum of these costs makes up the total costs for a project. The specifi c costs constitute an important indicator, i.e. the costs for the production of a barrel or a ton of oil. In this context, different terms such as technical costs, production costs and extraction costs occur, for which the cost categories contained are not identifi able. The supply costs of oil (in USD/b crude oil) contain the fi nding and development costs as well as the production/operating or direct lifting costs including a 15-% discounting, but without taxes.
As an example, the EIA (EIA, 2008b) lists different cost categories for 30 US oil companies operating internationally, who deliver data as so-called FSR (Financial Reporting System) companies for their global operations. Finding costs and lifting costs are differentiated; the latter contain the direct lifting costs and the production taxes. The sum of both cost cat-egories makes up the total upstream costs. The development of the specifi c total upstream costs from the start of the 1980s (Fig. 3.11) shows two tendencies. During the 1980s and 1990s a trend towards lower costs in the wake of the implementation of technological ad-vances has been observed, at the start of the 21st century a signifi cant upswing occurred, which is mainly due to higher fi nding and development costs. Besides reduced increases in reserves, the costs for energy, materials, equipment and personnel, which rose steeply to-gether with the oil price, are at the root of that. In the course of the current fi nancial crises and decreasing prices for oil and commodities, a fall in the specifi c costs should become noticeable in future years as well.
Figure 3.11: Finding and development costs, lifting costs and specifi c upstream costs for FRS companies, 1981-1983 to 2005-2007 (EIA, 2008b).
There are strong regional differences for specifi c costs. This concerns in particular the fi nding and development costs (Tab. 3.2). Here, the Middle East comes off best, even though the most important producing countries (Saudi Arabia, Iran and Iraq) have not been considered because of the dominance of national oil companies (Info box 1). These costs are highest in the offshore areas of the US, due to the high daily rates for drill ships and offshore plat-forms and the high material intensity of the producing systems. For the producing costs, the differences between the regions are signifi cantly lower (EIA, 2008b).
Data concerning the expected upstream costs for conventional oil by the IEA (2008a) and by Petrobras (2008) envision for conventional oil a variance of less than USD 2/b to USD 100/b (Tab. 3.3). The extraction costs for petroleum from the Middle East, in particular from the

CRUDE OIL
46 Energy Resources 2009
states of the OPEC, are the lowest. The extraction of petroleum from the deep sea and in the Arctic using EOR-processes is considerably more expensive than the average of the other regions. As here in particular options for additional petroleum potential in future are envisioned, it can be derived from the numbers that the price of petroleum will rise.
Oil Consumption3.2.6
The oil consumption (petroleum products) rose in 2007 by app. 460 Mt in comparison to 2001 and reached a historic high at app. 3.9 Gt. The consumption is distributed very unevenly when groups of countries and regions are regarded. While the OECD countries consume a little more than 56 % of the mineral oil at 2.2 Gt, the OPEC states consume only little more than 9 %. The regions showing the highest consumption are Austral-Asia, North America and Europe (Tab. A 3-15, A 3-16). Since 1978, Austral-Asia and North America showed the greatest increases, whereas consumption in Europe stagnated and even slightly decreased in the course of the previous years. When production and consumption of individual regions are compared (Fig. 3.12), a defi nite dominance of consumption over production results for
Region Finding andDevelopment Costs Upstream Costs
2004-2006 2005-2007 2004-2006 2005-2007
US Total 15.95 17.01 23.71 26.48
Onshore 11.54 13.38 19.90 23.45
Offshore 65.49 49.54 71.69 57.20
Outside US total 20.06 20.70 26.91 28.58
Canada 19.89 12.20 27.31 21.12
Europe 23.41 31.58 30.61 40.29
CIS n.a. n.a. n.a. n.a.
Africa 26.36 38.24 33.01 45.98
Middle East 5.41 4.77 14.70 14.85
Other Eastern Hemisphere 13.03 20.56 19.36 27.52
Other Western Hemisphere 43.87 20.30 49.05 36.14
Worldwide Total 17.65 18.48 24.92 27.10
Table 3.2: Specifi c fi nding and development costs as well as upstream costs by region for FSR companies 2004-2006 and 2005-2007 in 2007 USD/boe (EIA, 2008b).
IEA (2008)(USD/b)
Petrobras (2008)(USD/b)
Middle East 3 – 14 7 – 19
CIS n.a. 15 – 35
Deep water 32 – 65 23 – 45
EOR 30 – 82 25 – 63
Arctic 32 – 100 25 – 50
Other regions 10 – 40 12 – 30
Table 3.3: Mean total upstream costs of conventional oil according to type and region of the occurrences (IEA, 2008a, Petrobras, 2008).

CRUDE OIL
47Energy Resources 2009
North America, Austral-Asia and Europe. For the Middle East, Africa, Latin America and the CIS production surpasses consumption.
Figure 3.12: Comparison of oil production and consumption in 2007 by region
The top ten countries by oil consumption in 2007 used approximately 58 % of the global consumption. The US are still the largest consumer at 943 Mt, corresponding to nearly a quarter of the global oil consumption (Fig. 3.13, Tab. A 3-16). The subsequent fi ve largest consumer-countries together consume this amount again. Saudi Arabia is the only OPEC country amongst the top ten consumer countries. Germany took eighth place in the con-sumption, raking in 2007 at about 102 Mt, corresponding to 2.6 % of the global consump-tion.
Figure 3.13: Consumption of oil in 2007 (total 3.8 Gt) of the top ten countries as well as distribu-tion by region.

CRUDE OIL
48 Energy Resources 2009
When regarding the per-capita oil consumption (Tab. A 3-17), Singapore has the highest value at 9.9 t/capita. High values of more than 3 t/capita are also shown by countries from the Middle East such as Kuwait, UAE, Qatar and Saudi Arabia but also the US and Canada. In the EU countries, the values vary between 0.5 t/capita in Romania and 5.8 t/capita in Luxemburg. The majority of the countries in the EU show consumptions between 2.0 and 3.0 t/capita and thus signifi cantly above the global average of 0.6 t/capita.
Crude Oil Transport and Trade 3.2.7
Crude oil is traded globally as the main producing regions of petroleum are not identical to the most important consumer regions. Thus, of the oil produced in 2007, approximately two thirds, i.e. 2.2 Gt, have been transported across boundaries and in some cases over long distances, mainly by tanker or pipeline. Smaller amounts have also been transported by rail (Fig. 3.14).
Figure 3.14: Global oil trade movements (crude oil and petroleum products) in 2007 in Mt (according to BP, 2008) without consideration of intraregional trade
When determining the import and export values for the individual countries, the data of the IEA (2008a), of BP (2008) and of the OPEC Annual Statistical Bulletin 2007 as well as national data have been taken into account. The most important export regions in 2007 were the Middle East with 38 % of the exports, Africa with 17 % and the CIS with 16 %. The top six exporting countries with amounts above 100 Mt – Saudi Arabia, Russia, Iran, Nigeria, Venezuela and the United Arab Emirates - covered in 2007 nearly half of the global exports (Tab. A 3-18). The top four importing countries - the US, Japan, PR China and South Korea - received half of all global imports (Tab. A 3-19).
Oil is largely transported through pipelines on the continents. Between the continents, such as from the Middle East to Europe, Asia and America, from Africa to Europe and America as well as from Latin America to North America, oil is transported by tanker or in a combina-

CRUDE OIL
49Energy Resources 2009
tion of tanker and pipeline transport. The transport by tanker predominated in 2007 at a proportion of approximately 75 to 80 %.
Specifi c transportation costs in relation to the energy content are considerably lower for oil than for natural gas, in particular because of the signifi cantly higher energy density of oil (Fig. 3.15). This is also a reason for the fact that no global trade of natural gas has ever been established (Chapter 4.2.7). For petroleum, transport by tanker is cheaper than transport via pipeline. The trends listed in Figure 3.15 can only be regarded as average values, as the costs of transportation depend on several conditions as the size of the vessel and the capacity of the pipeline. Additional infl uencing factors are the prices for the raw materials and the general situation of the market. Thus, at times of high prices and limited transportation capacities the freight costs rise signifi cantly.
Figure 3.15: Comparison of the transportation costs for oil, natural gas and coal (according to Hatamian, 1998 and VDKI, 1999).
During the past years, a number of large pipeline projects were realized, which are important in particular for supplying Europe. The pipelines Caspian Pipeline Consortium Project (CPC) and Baku-Tbilissi-Ceyhan (BTC) were commissioned, which transport oil from the Caspian region to ports of the Black and the Mediterranean Seas.
Crude Oil Prices3.2.8
The oil prices constitute today, 150 years after the start of the age of petroleum, a key factor for the world economy. Because life in our modern industrial society is linked to a high degree to the availability and affordability of the required energy, the price for oil as the still most important energy source has a leading function, also for other energy and mineral resources.

CRUDE OIL
50 Energy Resources 2009
The historical development shows that, before the foundation of the OPEC in 1960, the oil price had been largely controlled by the multinational, private oil companies. Its fi xed nominal value was USD 2/b to USD 3/b (Tab. A 3-20), which corresponds to – taking in-fl ation into account - USD 10/b to USD 15/b today. During this period, the high profi ts of the oil companies were faced with comparatively low shares of the profi ts of the producing countries. This changed drastically when the OPEC actively infl uenced the petroleum market for the fi rst time in 1973 with a delivery boycott against the USA and the Netherlands. The proportion of the global petroleum production of the OPEC had increased continuously until then and reached more than 50 % of the total production (Fig. 3.10). Such a strong position enabled the OPEC to establish the price for crude oil independently in 1973 and to nationalize the oil companies active in their member states altogether or in part. The nominal oil prices then increased to more than USD 11/b (Fig. 3.16). Even though the prices recovered in the 1980s, the worldwide petroleum market was changed signifi cantly by these events.
Figure 3.16: Development of the prices for crude oil between 1970 and 2008 real (2008USD) and nominally (current rate of the currency) for the oil type Arabian Light in mean annual values.
Triggered by the Iranian revolution in 1979 and the Iran-Iraq war, the second oil price crisis entailed a price increase to more than USD 35/b nominally. These events had been preceded by a further increase in the oil consumption and a disadvantageous global development of the reserves-to-production ratio. The industrial countries reacted on these developments by reducing their energy consumption and developing their own new oil sources. The resulting surplus of petroleum was countered by the OPEC with the establishment of production levels. This artifi cial shortage was intended to stabilize the price at a higher level. This strategy was undermined by a lack of production discipline within the OPEC and had negative conse-quences in particular for Saudi Arabia, which had the role of swing producer. Saudi Arabia countered this development in 1986 with guaranteed profi t agreements with refi neries, the so-called netback pricing and increased production. The other OPEC countries followed suit and in consequence the oil price decreased from the mid-80s to a level below USD 20/b nominally. Even though the OPEC returned to fi xed prices, the oil price remained at about USD 20/b nominally until 1997 without signifi cant fl uctuations.

CRUDE OIL
51Energy Resources 2009
In the wake of a fi nancial crisis in Asia and a signifi cantly reduced oil consumption as well as lacking production discipline of the OPEC countries, in 1998 a considerable decline of oil prices down to below USD 10/b nominally occurred. This very low price induced many pe-troleum companies to limit their exploration activities signifi cantly. In addition, the economy of the producing countries was severely strained. For the OPEC countries alone, this cor-responded to shortfalls in the oil business in 1998 of about USD 50 billion, corresponding approximately to one third of the intended total revenue. As a consequence, the OPEC countries agreed on production restrictions, which were largely adhered too. The aim was to keep to a price range between USD 22/b and USD 28/b. Thus, the oil price skyrocketed to more than USD 30/b nominally at the end of 2000. In the fi rst three quarters of 2001, it was within the price range named, but after September 11th, 2001, it fell beneath USD 18/b nominally. Only massive production cutbacks of the OPEC countries by 1.5 million b/d and of other producing countries (Mexico, Norway, Russia, Angola) were able to stop the price drop at the beginning of 2002.
During the past fi ve years, the petroleum price as a whole increased signifi cantly (Fig. 3.17). An interim downswing from September 2006 to January 2007 showed a lowest daily price for the type Brent of about USD 52/b. Due to the subsequent reduction of production by OPEC, the oil price rose continually up to a price of more than USD 90/b until the end of 2007. This trend lasted until the middle of July 2008 with a record price of more than USD 145/b. Ever since, the oil price has shown a clear downward trend to USD 40/b at the end of 2008. Because of the weak Dollar exchange rate in recent years, the price increases for imports of oil to the Euro area were attenuated (Fig. 3.17).
The causes for the high and volatile oil prices of the past years have been the subject of controversy by specialists. Some see an indication of an approaching shortage of reserves, others blame a mixture of different factors, such as the globally increasing demand, the artifi cial limitation of the supply of oil by the OPEC, lack of capacity reserves, cost infl ation of equipment, material and personnel, supply interruptions due to strikes, political instabil-ity in producing regions and fear of terrorist attacks, the weak US-Dollar and speculations in the capital markets.
As crude oil is traded globally at relatively uniform prices, which are largely independent of an individual deposit and its supply costs, on the side of the producers three investment risks play an important role. They only take these risks if the expectations of profi ts are appro-priately high. For one, the exploration can remain unsuccessful due to erroneous geological or technical assessments. Secondly, changing political conditions can negatively infl uence the economy of deposits. Thirdly, it cannot be assessed accurately how prices and demand will develop in the face of unsecured forecasts for renewable and unconventional energy resources as well as future market conditions and political framework over the years. On top of that, as a rule a period of several years up to 20 years passes from the fi rst invest-ments for the exploration of a deposit until the start of production. During this phase, the highest costs accrue. In comparison, the pure production costs are comparatively low. The costs for exploration and development will be much higher in particular in the new frontier areas, the Arctic and on the continental edges as well as for unconventional oil than in the traditional oil provinces, where still cheap petroleum can be produced.

CRUDE OIL
52 Energy Resources 2009
Figure 3.17: Development of the oil prices for OPEC basket in USD and Euro per barrel (monthly mean) as well as the OPEC-10/OPEC-11 (from 9/2008) production quota.
The extraction of petroleum as a fi nite resource, which can only be produced with high technical expenditure and effort is limited in its speed. Deposits, on which production has started, show as a rule a characteristic course of production, which is largely independent of demand. It is mainly dependent on the geological conditions and the installed produc-tion systems. There is very little possibility of reacting to increased demand in individual deposits and if any, the reaction is very slow. Correspondingly a decreased demand means a surplus-production or the necessity of throttling production.
Just like the supply, the demand can only react very sluggishly to shortages of the sup-ply in the face of many various dependencies and a lack of alternatives in the energy mix. Small changes of the supply-demand equilibrium can thus result in quick and severe price fl uctuations. An important instrument for infl uencing such situations is a suffi cient reserve capacity for the production of oil. The reserve capacity has been defi ned as additionally produced amount, which can be supplied within 30 days for at least 90 days. If this is low, it can be interpreted as indication of a lack of competition or insuffi cient investment activities in the development and production of oil. For a low reserve capacity, there is also a risk of rising prices and increased volatility due to supply bottlenecks in the case of short-term, unforeseen production downtimes due to storms in producing regions or terrorist activities and for unexpected increases in demand.
Oil price fl uctuations are also at the root of the effort to safeguard the bilateral physical oil trade via commodities futures trading. This gives expectations concerning the oil price and the reaction to the expectations the rank of signifi cant market factors. The real physical trade between petroleum producer and buyers is conducted on the basis of bilateral supply contracts. There are great risks for purchasers and vendors of oil due to the severe price fl uctuations; in order to reduce these risks, long-term contracts are concluded. For this rea-son, legally binding obligations are entered into, to buy or sell pre-determined amounts of oil of a certain quality at a certain point in time and for an exactly negotiated price (futures). This trade in futures is conducted at commodity futures exchanges such as the New York Mercantile Exchange (NYMEX) and is subject to supervision by regulatory authorities such

CRUDE OIL
53Energy Resources 2009
as the Commodity futures Trading Commission (CFTC). For futures, every sales contract always corresponds to an identical supply contract. During their terms, the contracts can be dissolved, if two corresponding purchasing and sales agreements can be found. At the time of this equalization, the amount of money one contract party has to pay to the other is calculated. Such a procedure of premature equalization is the rule. In practice, there is usually no physical delivery of oil in such a case. Futures thus serve primarily as protection (hedging) against price fl uctuations.
Different protagonists are involved in this business, who frequently are not involved in the real oil business at all or only indirectly. Besides the hedgers for the protection of the oil transactions, there are speculators, who bank on revenue due to assuming risks. Their involvement infuses a greater liquidity into the market. This group of speculators has been blamed in conjunction with the high oil prices of the past years in public of being the true profi teers and thus the driving force of an oil price bubble, as they might profi t from price fl uctuations. In principle, it is quite possible that the complete process of trading futures infl uences the oil price (Fattouh, 2007). If the defi nition of a bubble (asset bubble) as a situation, in which the asset value surpasses the fundamental value of the traded good oil, is used, a bubble cannot be used when speaking of the oil price. The individual contract price is based on the spot price and thus corresponds to the fundamental value of the oil. Extensive analyses about the role the speculators have played have been prepared for in-stance by an expert commission by invitation of the US stock exchange supervision authority Commodity Futures Trading Commission (CFTC) (Interagency Task Force on Commodity Markets, 2008) and (Büyüksahin et. al., 2008).
Figure 3.18: Comparison of different oil price forecasts of the IEA (IEA, 2004, 2006, 2008a)
The problem of preparing a forecast of the petroleum price including the numerous incalcu-lable parameters can be gleaned from many published oil price scenarios. Thus, for instance, the IEA repeatedly published price scenarios in their World Energy Outlook (WEO) during

CRUDE OIL
54 Energy Resources 2009
the past years, which differ fundamentally from each other; no scenario refl ected the true development (Fig. 3.18). Whereas the WEO 2004 (IEA, 2004) had assumed a real oil price of USD 29/b for 2030, this value was increased to USD 55/b in the WEO 2006 (IEA, 2006) and is USD 122/b for the current WEO 2008 (IEA, 2008). Even if the differing price bases are taken into account (2000, 2004 and 2007), the deviations are considerable and demonstrate the diffi culty of forecasting oil prices. In contrast, Merrill Lynch warns in its Global Outlook Report for 2009 that the oil price in the year 2009 might fall beneath USD 25/b, in case China is also struck by the recession (Financial Times, 4.12.2008). Thus, in future a great fl uctuation range and unforeseen defl ections of the oil price shall have to be dealt with.
Unconventional Oil3.3
A uniform defi nition of the term unconventional oil is currently not accepted. In accordance with Chapter 2.3.1, the pragmatic reason for the differentiation between conventional and unconventional oil is the greater technical effort and expenditure for extracting unconven-tional oil. Unconventional oil comprise bitumen or crude oil from oil sands, extra-heavy oil and crude oil from oil shale (Chapter 2.3.1). Thus the denomination unconventional refers to geological aspects of the formation and properties of the deposits as well as technical necessities for an ecologically acceptable, economical exploitation.
Oil Sands – High-Viscosity Oil in Sandstone3.3.1
Oil sands are naturally occurring mixes of bitumen, water, sand and clay. On average, oil sands contain approximately 12 wt. % bitumen, a high-viscosity petroleum. The individual grains of sand are coated by a thin fi lm of water of some μm and this in turn is surrounded by the high-viscosity oil. Oil produced from oil sands is also called natural bitumen or syn-thetic crude oil (SCO). It is a sticky, high-viscosity form of petroleum, which behaves like cold syrup at room temperature. Up to 50 % or 60 % it consists of substances comparable to conventional oil, 25 % to 35 % are resins and 15 % up to 25 % are asphaltenes. The components of the oil itself vary with the region of occurrence just as do traces of heavy metals, such as iron, molybdenum, nickel or vanadium. On average, the percentage of car-bon is little more than 80 %, that of hydrogen is around 10 %, sulfur ranges from 3 % to 5 %, dissolved oxygen is 0.9 % and nitrogen ranges from 0.36 % to 0.7 %. Bitumen has a density of more than 1 g/cm³ (≤10° API) and a viscosity of more than 10 000 mPa∙s. In the reservoir, bitumen is not capable of fl owing.
In general, heavy oils and all transitions up to bitumen are the results of secondarily al-tered, previously conventional petroleum occurrences. Reservoir rock is generally highly porous and permeable fl uviatile sandstone of deltaic or very near-shore sedimentary envi-ronments. In the case of the gigantic Canadian oil sand occurrences, the oil migrated from the deeper source rocks of the western Canadian sedimentary basin over a lateral distance of up to 360 km into the more shallow sandstones of the Aptian and Albian (upper Lower Cretaceous). Here, organic mudstones of the Devonian or Carboniferous are considered petroleum source rocks. In the course of its migration the petroleum was biodegraded by microorganisms in the rock: The light hydrocarbon molecules were degraded in the course of the microbial activity, the heavy, complex molecule chains were left behind and today make up the bitumen rich in sulfur in the deposits.

CRUDE OIL
55Energy Resources 2009
Oil sand occurrences are known in more than 20 countries (Fig. 3.19), in nearly 600 indi-vidual occurrences (WEC, 2007). The total potential of petroleum in oil sands all over the world is extraordinary large and has been assessed at about 462 Gt in-place. Of these, Canada and the CIS together possess 98 %. The best-known and most important oil sand occurrences are located in Canada. The Energy Resources Conservation Board (ERCB) of Canada estimates that approximately 27.5 Gt of crude oil in oil sands in the state Alberta have to be regarded as reserves. This corresponds to about 17 % of the reserves of con-ventional petroleum. The reserves and resources shown in table A 3-21 of the countries with the greatest oil sand occurrences should largely be regarded as assessments, as the data basis for many countries is still rather inadequate.
Figure 3.19: Distribution of the known worldwide occurrences of oil sand and extra heavy oils with information on reserves, resources and production.
Even if the oil sand occurrences are distributed over many countries (Fig. 3.19), the great-est part of the resources is concentrated in Canada, Russia and Kazakhstan. Of these, the Canadian occurrences have been investigated most thoroughly. Thus, the data on the amount of resources are still unreliable, last but not least because the distinction between heavy oil, extra-heavy oil and oil sands is not clear. Thus, of the estimated 200 Gt of un-conventional oil in the CIS about half are oil sands. A major portion of these occurrences is bound to carbonatic reservoir rocks, whose treatment is technically even more diffi cult than for oil sands. The largest occurrences in Russia are supposed to be in the Tunguska Basin on the East Siberian Shelf, in the Timan-Pechora Basin and in the Volga-Ural Basin. In principle, it can be assumed that the reserves and resource data for oil sands in Russia are underestimated.
Even though for Kazakhstan large bitumen occurrences in the North Caspian Basin are known, their possible exploitation will not be started in the foreseeable future because of the still abundant conventional hydrocarbons. The oil sand occurrences in the US are distrib-

CRUDE OIL
56 Energy Resources 2009
uted over several states, with the largest in Utah and Alaska, further smaller occurrences in California, Alabama, Kentucky and Texas. Large-scale mining is not intended here either, as either the geological setting is too complicated, the oil sands are located too deeply or are too thin. The bitumen occurrences in the Dahomey-Basin in southwestern Nigeria will only be considered, when the reserve situation of the conventional oil of the country de-creases. In Indonesia, bitumen occurrences on the island Buton are known, but up to now they have only been mined for manufacturing road asphalt. For nearly 200 years, asphalt from an asphalt lake on Trinidad has been mined, which is also used as tarmac. The annual production here is 10 000 to 15 000 t.
Considerably smaller oil sand occurrences are known in Angola, Gabon, the Republic of Congo and the DR Congo. They are bonded to cretaceous sandstones. In Europe, marginal occurrences in Germany (cf. Chapter 8.1.5), France, the Netherlands, Poland, Romania, Spain, Switzerland and Hungary are known. The most interesting occurrences from an eco-nomic point of view of combined heavy oil/extra-heavy oil/asphalt in Europe occur in Sicily/Italy. Here, heavy and extra-heavy oil have been produced since the 1950s.
The greatest and best-known oil sand occurrences are the oil sands of Canada in the northern part of the Province Alberta. They cover a surface of more than 140 000 km2, which is mainly located in the three regions Athabasca, Peace River and Cold Lake. Currently, Canada is the only producer of importance of bitumen from oil sands. Already in 1967, then still with public subsidies, the bitumen production from oil sands was started. Only approximately 16 Gt, corresponding to 6 % of the in-place oil sand volume will presumably be available for surface mining. The remaining amounts are located too deeply and can only be produced using drill holes and in-situ processes. Canada quantifi es its in-place volume of bitumen currently at 272 Gt, of which 27.5 Gt are listed as reserves (ERCB, 2008). Taking into account the proportion accessible for surface mining and the in-situ areas as well as the different degrees of oil recovery, oil sand resources of 81.9 Gt remain. Between 2000 and 2007, the crude oil production from oil sands in Canada has nearly doubled from 39 to 77 Mt per year. For 2007, this corresponds to not quite 2 % of the global production of petroleum. Until 2007, 940 Mt of natural bitumen were cumulatively produced in Canada.
Oil sands are produced by surface mining (ex-situ) as well as using the so-called in-situ-process. Both processes are aimed at extracting the petroleum or bitumen, respectively, and they are technically and energetically complex.
Oil sand mining via surface mining (ex-situ) is only possible for shallow deposits, if the oil sand layers are located at the surface or beneath a thin overburden. After the overburden has been removed, the oil sand layers, which are up to several meters thick, are mined using excavators. At a capacity of nearly 40 t per scoop, modern backhoes are more fl exible and thus more economic than the bucket-wheel excavators used previously. Here, the largest trucks in the world are used with a capacity of up to 400 tons. The extracted oil sand is dumped in a stone crusher and hot water is added. This so-called slurry is transported to the treatment system via pipeline. During this hydro transport, the separation of bitumen and sand already starts. This process is continued in the separating container of the extrac-tion system. During the subsequent fl otation process, small air bubbles attach themselves to the released bitumen, it buoys and forms a foam layer in the upper part of the mixture, which can be siphoned off easily. By adding leaches as solvents, water and dissolved salts

CRUDE OIL
57Energy Resources 2009
are separated from the oil. Sand and water accumulate in the lower part of the container. For recultivation purposes, the sand is returned via pipeline to the exhausted areas of the open pits. Water still containing sand, clay particles and residual oil is pumped into a set-tling tank. Still rising oil is skimmed, whereas the residual oil will be degraded by bacteria in the settling sand. The water treated this way can be re-used in the separation process. The recovery factor in the surface mining technique exceeds 90 %.
The production of petroleum from Canadian oil sands in open-pit mining operation is largely dominated by the three company syndicates Albian Sands Energy Inc., Syncrude Canada Ltd. and Suncor Energy. Additional companies have joined in the past few years. The total area allocated to surface mining here has increased from 470 km2 in 2001 to 1320 km2 in 2007. Simultaneously, the production of bitumen from surface mining has nearly doubled to almost 46 Mt (Fig. 3.20).
Figure 3.20: Proportions of surface mining - and in-situ processes of the oil production from oil sands in Alberta from 2000 to 2007.
The production of petroleum from oil sands via the in-situ technique is conducted for an overburden of more than 40 metres. In contrast to surface mining, the rock remains on site for this method. Hot water vapor is pressed through drill holes into the oil sand layer; it reduces the viscosity of the bitumen and renders the oil capable of fl owing. Two different processes are in use:
For the Cyclic Steam Simulation (CSS) water vapor is injected at high pressure into a verti-cal bore hole. The heat reduces the viscosity of the bitumen and the capacity for migration is supported by the steam. The pressure produces micro-cracks in the rock, which addi-tionally improve the infl ux of bitumen to the borehole. After an inclusion period of several weeks, the production phase is started through the same borehole. If the production rate decreases, a new injection phase is started. The disadvantage of this method is the limited radius of the oil removal. To attain a suffi cient degree of oil removal, a close borehole pat-tern is required.

CRUDE OIL
58 Energy Resources 2009
For the Steam-Assisted Gravity Drainage process (SAGD) two horizontal boreholes are drilled in vertical distances from 5 m to 10 m in the oil sand layer. Hot water vapor is in-jected into the upper borehole and the liquefying bitumen can be extracted through the borehole below.
Other in-situ methods, such as the injection of solvents into the reservoir rock, electrical and electromagnetic processes, the use of microwaves or the combustion while supplying oxygen have been tested repeatedly. All these measures are aimed at increasing the fl owability of the highly viscous bitumen and at attaining a greater oil output. The SAGD-production seems to be the most economical method. For this purpose, about 2.5 m³ to 3 m³ water, of which 80 % to 90 % can be re-used via recycling processes, are needed for producing 1 m³ bitumen. For the in-situ extraction, the recovery factor varies from 25 % to 75 %, depending on the geological conditions and the in-situ technology used.
Many companies operate on more than 63 000 km² of concession area awarded for the in-situ production of bitumen. Production could be increased from 18 Mt bitumen in 2001 to about 31 Mt in 2007 (Fig. 3.20).
For the future, a further expansion of the oil sand production in the open-pit mining opera-tion as well as for the in-situ-production is intended. The ERCB 2008 estimated for 2017 a total production of 187 Mt of bitumen. Of these, 102 Mt are to derive from open-pit mining operations and 85 Mt from in-situ degradation. For this development, investments of at least USD 93 billion will have to be raised.
The processing of petroleum from oil sands in traditional refi neries is uneconomical or tech-nically impossible due to the high percentage of long-chain hydrocarbon molecules and the inherent high C/H-ratio. Thus, bitumen has to be processed in special treatment plants or converted into light oil beforehand. The bitumen from separation facilities is transported to the treatment system, the upgrader, using pipelines. To maintain the necessary fl ow-ability in the pipeline, the density and viscosity of the bitumen is reduced by diluting it using light oil or condensate from other sources. For this purpose, the addition of 17 % to 32 % diluting agent is necessary depending on the initial quality of the bitumen. 2007, in Canada 20 300 m³/day high-value light oil were required per day for the treatment of bitu-men. The domestic production of such light oil in Canada was only slightly above that value at approximately 23 500 m³/day, with decreasing tendency. In order to satisfy the rising demand, light oil is to be increasingly imported from the US.
In the upgrader, the natural bitumen is then converted into SCO, which corresponds to com-mercially available light oil. To this end, the long molecule chains of the bitumen are split into short chains. This is either done in a coking process by removing carbon or by hydro cracking, i.e. the addition of hydrogen at high pressure. In a second step, hydro treating, the resulting products naphtha, kerosene and gas oil are chemically stabilized and impurities, such as sulfur are removed. About 1.5 Mt of elementary sulfur resulted in 2007 in Canada from the oil sand production alone, which has been used in the chemical fertilizer industry or to manufacture gypsum.
The whole process of the oil sand extraction and treatment uses a lot of power and water. For generating steam for the in-situ-liquefaction and for upgrading to hydrocarbons of

CRUDE OIL
59Energy Resources 2009
higher value, large amounts of natural gas are used. In 2007, the consumption of natural gas for the oil sand production in Canada was 9.9 billion m³ and will rise to more than 26 billion m³/a until 2017 (ERCB, 2008). In addition, large amounts of gas are emitted. In comparison to the light oil production, the oil production from oil sand releases approxi-mately three times as much CO2 per m3 crude oil (Flint, 2005). Due to the use of improved technology, it was possible to reduce the specifi c CO2-emissions over the past years in spite of increased bitumen production. The total emissions could, however, increase in accord-ance with the intended increase from currently about 50 Mt CO2 to up to 140 Mt CO2 until 2020. Current analyses suggest that the internalization of external costs, for instance by CO2-sequestration, do not jeopardize the competitiveness of the oil sand extraction, if the oil price is suffi ciently high (Meyer-Renschhausen, 2007). While the sulfur-dioxide emis-sions were signifi cantly reduced by the installation of exhaust desulfurization plants in the 1990s, they have increased ever since together with nitrogen oxides in the course of the growth of the oil sand production.
Surface water or groundwater is needed in open-pit mining operations for hydro transport, the extraction of the bitumen and for the generation of steam in the refi ning plants. In the in-situ operation, hot water or steam is used primarily for injecting it into the deposits. As meanwhile large parts of the water are recycled, the net demand in open-pit mining opera-tions is 2.2 to 4.4 m³ water per m³ bitumen, for in-situ operations it is 0.2 to 0.3 m³ water per m³ bitumen.
In particular, surface mining of oil sand causes a considerable consumption of land. Even if the companies are obligated to conduct reclamation measures, the large-scale interfer-ences in nature will remain visible for a long time. In the long run, however, it is to be expected that the in-situ production will cause greater disturbance of the environment (Meyer-Renschhausen, 2007). Ultimately only about 20 % of the oil sands can be extracted using open-pit mining operations. The major proportion of the oil sands would be produced using in-situ production, for which the land requirement consists of a close-meshed network of infrastructure systems, such as drill holes, access roads, pump stations and pipeline routes. In comparison with surface mining lower costs for recultivation measures occur. This advantage of the in-situ process is offset from a scientifi c point of view by the higher degree of oil removal in surface mining.
In particular, the increasing oil price of the past years has stimulated a few current devel-opment projects besides the production of petroleum from oil sands in the Canadian Prov-ince Alberta. For a number of years, in the neighboring province Saskatchewan, reinforced exploration of oil sands is conducted increasingly. The projects planned and the associated optimistic increases in production in Canada until 2020 and beyond, however, will have to be corrected considerably downwards because of the decline in oil prices since the middle of 2008. A number of companies have already delayed their projects or canceled them completely. In parallel, the Canadian oil sand industry has to deal with numerous different problems, such as the constantly high costs for personnel and material, reduced revenue because of lower oil prices, the credit crisis and growing resistance in the population. The Canadian Association of Petroleum Producers (CAPP) (Hyun, 2008 and CAPP, 2008) revised its production forecast for 2015, specifying a probable annual production of only 138 Mt per year, instead of 163 Mt as still forecast last year because of these developments. Other countries such as Russia or the US have not progressed beyond the stage of pilot projects.

CRUDE OIL
60 Energy Resources 2009
Because of the high prices for energy in 2008, the Italian company ENI has assured explora-tion rights for oil sands in the Congo Republic, up to now neither the working commitments nor the current activities are known.
Extra-Heavy Oil 3.3.2
Extra-heavy oil with a density of ≥1.0 g/cm³ is similar to the bitumen of the oil sands, but its viscosity is less than 10 000 mPa·s. Thus, extra heavy oil in the reservoir is more capa-ble of fl owing than the bitumen of the oil sands. The sulfur content is on average around 5 %, nickel and vanadium contents are 130 ppm or up to more than 700 ppm. Deposits of extra-heavy oil are regionally widespread and are known in at least 18 countries in the world in more than 160 fi elds (Fig. 3.19). The total potential of the extra-heavy oil in-place is, in accordance with WEC (2007), about 246 Gt, of which approximately 47.9 Gt are listed as resources and 6.6 Gt as reserves (Tab. A 3-22). About 0.58 Gt of extra-heavy oil have been produced up to now. In both cases, Venezuela is the leader at about 97 % each, for the resources as well as for the reserves. Venezuela contributes 35 % of the global produc-tion, followed by Great Britain at 28 % and Azerbaijan at 21 %.
The increase of the crude oil prices since 2000 has triggered increased investments in the area of extra-heavy oil and resulted in a considerable increase in production. Even though the high-viscosity oil is more diffi cult to produce, to transport and to process than conventional oil, the production level has risen from approximately 20 Mt in 2001 to 93 Mt in 2005. This corresponds to a proportion of about 2 % of the global petroleum production. One problem with the assessment of extra-heavy oil is the diffi culty of delineating it from other heavy oil. The information concerning extra-heavy oil in table A 3-22 can also contain proportions of heavy oil of unknown amounts.
In Israel’s Dead Sea area, in Iran, Iraq, Egypt, Mexico and Poland relatively small and economically insignifi cant occurrences of extra-heavy oil exist. The occurrences in Italy, however, in particular those in the Caltanissetta Basin of Sicily, are the most important occurrences in Europe besides those in the British North Sea. The deposits of extra-heavy oil in China located in the Bohai Basin, the Huabei Basin and the Tarim Basin take second place with reserves of approximately 119 Mt. The occurrence in Azerbaijan with reserves of 20 Mt, already discovered in 1904, ranks third.
The worldwide largest occurrences of extra-heavy oil are located in the so-called Orinoco Belt in Venezuela with 46.8 Gt of petroleum resources and 6.4 Gt remaining reserves (Fig. 3.21). In 2005, the annual production of conditioned extra-heavy oil was approximately 33 Mt and thus 20 % of the total oil production of Venezuela, the third largest crude oil exporter in the world. The Orinoco Belt constitutes the southern edge of the East Venezuela Basin or Maturin Basin and extends at a width of 50 km to 100 km and about 700 km in east-west direction (Fig. 3.21). The deposits are largely related to Miocene sandstones in depths of 500 m to 1000 m, which rest on Cretaceous, Paleozoic and Precambrian crystalline of the Guyana Shield. Towards the north, where the basin is deeper, the extra-heavy oil succes-sively turn into light oil. The petroleum mainly dates back to the Cretaceous and Oligocene up to Miocene source rocks. The oil has migrated between 100 km and 150 km from the petroleum source until it reached toady’s reservoirs. During migration, the originally lighter petroleum was biodegraded to heavy and extra-heavy oil (Chapter 3.3.1).

CRUDE OIL
61Energy Resources 2009
EOR – How much Petroleum in a Reservoir can be Actually Produced?
In the global average, from a petroleum reservoir only approximately 35 % of the petroleum contained therein is being produced. This so-called recovery factor (RF) differs considerably, depending on the region. The average RF in Venezuela is currently only about 23 % and thus reaches the standard of US deposits of the year 1979. The US, in contrast, have increased to this day the recovery factor to 39 % on average. Deposits in the North Sea region currently rank leading in the world at approximately 46 %. The oil fi eld Statfjord in the North Sea has attained the globally highest recovery factor at 66 %.
During production, part of the petroleum reaches the surface through the production well due to the natural pressure within the deposit. This process is called primary production. If addi-tional measures are taken, these are called either secondary or tertiary production techniques (Enhanced Oil Recovery, EOR). The most important secondary processes in particular is the injection of formation or sea water and/or gas directly beneath or into the deposit, to maintain formation pressure.
Tertiary production techniques render the petroleum remaining in the deposit more capable of fl owing by physical, chemical or biological measures and thus making it producible. Standard processes are thermal measures such as the injection of water vapor or of hot water and in-situ-combustion, gas injections, microbiological changes of the composition of the petroleum in the reservoir and chemical additives, such as polymers and tensides. Amongst the EOR-processes, currently the thermal methods dominate, they account for 69 % of the petroleum produced using EOR-methods. Processes using gas injection follow at a proportion of approximately 30 %. Which tertiary process is used depends mainly on the composition of the petroleum and the conditions of the deposits. A combination of different methods is also quite standard. As EOR-processes are expensive, their application is only profi table, if the additional production costs can be compensated by a higher production rate, higher RF or a correspondingly high petroleum price. Globally between 3 % and 4 % of the whole petroleum production are realized by tertiary production processes.

CRUDE OIL
62 Energy Resources 2009
The production of extra-heavy oil is generally conducted using the same in-situ production processes as for the oil sand production. The injection of water vapor in vertical wells, but also the SAGD-process (Chapter 3.3.1) have become established because of the relatively good recovery rates. For the production of extra-heavy oil, new processes, which are even more effi cient, are permanently looked for. For example, the so-called cold production is being tested, where horizontal wells are used to open a large section of the oil reservoir. It is attempted to extract sand and oil simultaneously from the deposit by adding solvents. Pilot tests using this method yielded production rates of 130 to 400 t/day with recovery factors of up to 20 %.
Currently, four major projects are active in the Orinoco Belt (Tab. 3.4). The treatment of the extra-heavy oil to produce SCO is only conducted right before it is exported, as Venezuela has a limited availability of light oil for diluting the heavy oil. For this reason, the processing plants are located at the north-east coast of Venezuela (Fig. 3.21). The conversion effi ciency from extra-heavy oil to synthetic oil varies from 87 % to 95 %.
Figure 3.21: Major projects in the Orinoco Belt (hatched), source: PDVSA.
In the Orinoco Belt, approximately 42 Mt of extra-heavy oil have been produced in 2005 and processed to 34 Mt synthetic crude oil and 5 Mt Orimulsion®. In order to adhere to the specifi ed production levels of the OPEC, the production of extra-heavy oil has been reduced by about 17 500 t/day (6.3 Mt/a) since the beginning of 2007. Orimulsion® is a special prod-uct of the Venezuelan petroleum industry protected by trademark, made from about 70 % extra-heavy oil, 30 % water and 1 % chemical additives. It has a low viscosity, is easy to transport and can be burned in power plants. Main customer countries for Orimulsion® were up to now Japan, Italy, Denmark and Canada. In order to ensure the Orimulsion® supply of two power plants in China, the Chinese National Petroleum Company (CNPC) formed a Joint Venture with the PDVSA. An investment of USD 330 million was used to push the Sinovensa project in 2006. At the end of 2006, PDVSA stopped the production of Orimulsion® as the direct marketing of the extra-heavy oil as SCO was more profi table. Venezuela considers Orimulsion® as a reserve for the future, thus the patent rights for manufacturing the fuel have not been sold.

CRUDE OIL
63Energy Resources 2009
Oil Shale – Petroleum still to be Generated3.3.3
Oil shale is actually an immature petroleum source rock with a high proportion of organic material, which has not yet passed the geological conditions to turn into petroleum under natural conditions. The origin of oil shale can be a widely varied spectrum of depositional areas, consisting of ponds, lakes and swamps with fresh and salt water as well as the fl at marine environment in the subtidal shelf area. Lithologically, oil shale originates frequently from calcareous mudstone and can have geological ages ranging from Cambrian to Tertiary. The organic material in oil shale, so-called kerogen, consists mainly of carbon, hydrogen and oxygen with small amounts of sulfur and nitrogen. Thermal treatment of the oil shale allows to extract shale oil. This oil derived from oil shale differs from natural petroleum by its higher percentage oxygen compounds.
The extraction of oil shale can be done by surface mining for shallow overburden from 30 m to 40 m. For this purpose a minimum thickness of the oil shale layer of 3 m and an overburden-oil shale ratio of less than 5:1 is advisable. In areas with thicker overburden, such as the deposits in Estonia, the oil shale is produced using underground mining. The rock containing oil shale is blasted and crushed in a stone crusher (Vaher, 1998). The mate-rial can then be processed differently. Either it will be burned directly for power generation purposes, like in Estonia, or by coking or carbonization higher-order hydrocarbons can be extracted, for instance in carbonization reactors, so-called retorts, with downstream distil-lation plants (e. g. Lurgi-Ruhrgas Process). For the in-situ method, oil shale is pyrolysed in the deposit without extracting it. Oxygen is added through drill holes to the ignited oil shale and the resulting gases are processed further. In particular deep oil shale occurrences, such as the Devonian Black Shales in the East of the US can only be exploited using the in-situ process. In the US there are currently experiments being run concerning the in-situ pyrolysis based on heating the rock electrically.
In order to extract crude oil from oil shale, the process of oil generation, which takes sev-eral millions of years under natural conditions and requires an increase of the temperature conditions, has to be accelerated by an artifi cial process. To this end, the oil shale is heated
Project name Junin(Petrozuata)
Boyaca (Sincor)
Ayacucho (Hamaca)
Carabobo (Cerro Negro)
Region Zuata Zuata Hamaca Cerro Negro
Company ConocoPhillips, PDVSA
Total,StatoilHydro,
PDVSA
ConocoPhillips, ChevronTexaco,
PDVSAExxon Mobil, BP,
PDVSA
Commissioning 1998 2000 2001 1999
Commissioningtreatment plant
2001 2002 2004 2001
Production of extra-heavy oil (Mt/a)
7 11.6 11.6 7
Density of extra-heavy oil (°API)
9.3 8.0 - 8.5 8.7 8.5
SCO-production (Mt/a) 6 10.5 11 6.1
Densitiy of SCO (°API) 19 - 25 32 26 16
Sulfur (Wt. %) 2.5 0.2 1.2 3.3
Table 3.4: Extra-heavy oil projects in the Orinoco Belt, Venezuela (US DOE, 2006).

CRUDE OIL
64 Energy Resources 2009
to 300°C up to 500 °C for pyrolysis purposes and subsequently cooled down to below 50 °C. The kerogen is converted to a gas mixture, out of which the so-called shale oil condenses during cooling. For an effi cient use of oil shale, a minimum content of about 4 % oil is re-quired. This corresponds to a gross calorifi c value of approximately 3300 kJ/kg in relation to the waterless oil shale. The oil content of oil shale is defi ned on the laboratory scale in accordance with the standardized pyrolysis process by Fischer–Schrader (Fischer Assay), which supplies reliable data about the technological quality.
Besides the use as energy fuel, shale oil is also used as raw material for the manufacture of different products of the chemical industry. Other by-products are coke, pitch, asphalt, ammonia, sulfur and in some cases metals such as gold, vanadium and uranium.
Figure 3.22: Regional distribution of the oil shale occurrences worlwide with data concerning reserves, resources and production.
The global total potential of oil shale oil in-place is currently estimated to be 413 Gt of shale oil. Oil shale occurrences are known in nearly 40 countries of the world (Fig. 3.22). The majority of the amounts of shale oil in-place are possessed by the US at 73 %, followed by Russia at nearly 10 % as well as the Congo Republic, Brazil and Italy at together 9 % (Fig. 3.23). The largest oil shale deposits are located in the US, Russia, Australia, Brazil, Israel, Jordan, Morocco and Thailand. Currently, many important parameters for the assessment of the contained crude oil potential are missing for many oil shale occurrences, thus global data concerning extractible amounts of shale oil are very uncertain.
As the oil production from oil shale is currently not economical, the theoretically extract-able amounts of oil in the hitherto known oil shale occurrences are shown as extractable resources. Countries with the largest known extractable resources are besides the US, Aus-tralia, Brazil, China, Estonia, Israel, Jordan, Morocco and Thailand (Tab. A 3-22). In spite of the large amounts of oil shale in-place in the CIS-countries, data concerning the producible

CRUDE OIL
65Energy Resources 2009
amounts of oil are not known. In the US alone, more than 100 000 Mt of shale oil might be distillable. Even though these data are also very uncertain, the globally extractable re-sources of oil shale oil of about 120 000 Mt are regarded as conservative estimate, as for many countries there are no data available up to now (Altun, 2006).
Figure 3.23: In-place shale oil resources (total 413 Gt) according to countries (%).
Amongst the unconventional types of petroleum, oil shale is the energy resource with the highest energy demand for turning it into a liquid energy fuel. A cost and energy-effi cient production method of exploiting oil shale oil is not in sight for the near future. Up to now, the easy availability and the cheap price of conventional petroleum prevented the expansion of the oil shale industry. With increasing world market prices for petroleum, however, for a few geologically and logistically well-placed oil shale occurrences an economic production might become reality in the not too distant future. But even countries with few occurrences of conventional petroleum and natural gas, which have considerable oil shale deposits, are interested in producing oil from oil shale, to decrease their energy imports in the long run. In all, this development in the past years resulted in re-assessments of oil shale resources, the development of improved conditioning technologies and new pilot projects. Only few deposits have been used to produce oil shale. These are located in Estonia, China, Brazil, Germany and Israel. Only in the three fi rst-mentioned countries, oil has been extracted from oil shale in the past years. In all, in 2005 approximately 684 000 t of crude oil were manufactured worldwide, of which Estonia with 345 000 t has produced slightly more than half, followed by China with 180 000 t and Brazil with 159 000 t.
Concerning the development of the last years in selected countries, the following is sum-marized:
Estonia’s energy-infrastructure has been geared at the use of oil shale for a long time. More than 90 % of the electrical power generated in Estonia is based on oil shale and render the country a net exporter of electrical power. The production of oil shale alone was 14.6 Mt in total in 2005. Until 2007, it was increased to 16.3 Mt, about 75 % of the oil shale is burned directly without further processing for generating energy, the remainder is used for manu-facturing shale oil. It is disadvantageous that this form of energy generation can contribute signifi cantly to the pollution of the air and water.

CRUDE OIL
66 Energy Resources 2009
In Russia the Leningradslanets Oil Shale Mining Company produced approximately 1.12 Mt oil shale per year until 2005. The shale was transported to the Baltic Power Station in Estonia and the power thus generated was fed into the power supply system of Russia. Production was stopped in 2005 for cost reasons.
In China the Fushun Oil Shale Retorting plant of the Fushun Mining Group Company oper-ated approximately 120 retorts with a capacity of 100 t oil shale per day/retort in 2005 and produced 180 000 t shale oil in the same period. The production in China was expanded to 240 000 t of shale oil in 2006 and to 300 000 t in 2007.
Brazil was able to expand the production of shale oil to 246 000 t in 2007. The largest part of the oil shale of Brazil is part of the Permian Iratí formation, which occurs in the provinces São Paulo, Paraná, Santa Catarina, Rio Grande do Sul, Mato Grosso do Sul and Goiás.
In Jordan Petrobras has been testing the economic feasibility of producing oil from the oil shale of the Attarat-Umm-Ghudran occurrence in cooperation with the Energy Ministry of Jordan since 2007. The Royal Dutch Shell Oil Company is very interested in the exploration and exploitation of the oil shale in Jordan and was meanwhile awarded large acreage for feasibility studies using the in-situ technique.
Efforts in Australia to install an oil shale pilot plant with a capacity of 400 000 t/a in the Whitsunday region, north-east Australia near the McFarlane oil shale fi eld, have been stopped by the government. Intended production has been interrupted until the middle of 2010, until it can be ensured that the production and processing of the oil shale does not have harmful effects on the environment, in particular on the Great Barrier Reef, which is only 15 km away to the offshore. The Australian government will then check the extent to which it will invest in the extraction of shale oil in future.
The Stuart-Oil-Shale project in Gladstone, Australia, produced approximately 220 000 t shale oil between 2000 and 2004. The pilot project was used to test the output of shale oil using the so-called Alberta–Taciuk Process retorting technolo gy (ATP). In the middle of 2004, the plant was shut down because of economic reasons and due to strong emissions of greenhouse gases and possible toxic substances.
In the US a number of testing facilities for improving the production and treatment technol-ogy of the production of oil from oil shale have been set up. They have an output of shale oil between 30 000 and 80 000 t/a. In 2007, Shell postulated an economic output using its new in-situ technology from a crude oil price of USD 25/b to USD 30/b with a degree of oil removal of approximately 70 %. According to the U.S. Department of Energy (U.S. DOE, 2004), the US might be able to produce approximately 120 Mt of shale oil annually as from 2020 and 175 Mt of shale oil annually as from 2030.

CRUDE OIL
67Energy Resources 2009
References on Oil 3.4
Altun, N.E. et al. (2006): Oil Shales in the World and Turkey; Reserves, Current Situation and Future Prospects: A Review. Oil Shale, 23, no. 3, ISSN 0208-189X, Estonian Academy Publishers.
BGR (Bundesanstalt für Geowissenschaften und Rohstoffe) (2003): Reserven, Ressourcen und Verfügbarkeit von Energierohstoffen 2002.-Rohstoffwirtschaftliche Länderstudien XXVIII – 426 S., E. Schweizerbart`sche Verlagsbuchhandlung (Nägele und Ober-miller).
— (2008): Annual Report: Reserves, Resources and Availability of Energy Resources 2007. Hannover.
BP (2008): BP statistical review of world energy, June 2008.- 43 p. BP; London. Büyüksahin, B.; Haigh, M.S.; Harris, J.H.; Ovendahl, J.A. & Robe, M.A. (2008): Fundamen-
tals, Trader Activity and Derivative Pricing, http://papers.ssrn.com/sol3/papers.cfm?abstract_id=966692.Campbell, C.J. (2005): The End of the First Half of the Oil Age. VI International Workshop
on Oil and gas Depletion. Lisbon.Campbell, C.J. (2008) The general depletion picture. ASPO Newsletter No. 90: 2.CAPP (Canadian Association of Petroleum Producers) (2008): Crude Oil Forecast, Markets
& Pipeline Expansions. Calgary, Alberta.EIA (Energy Information Administration) (2008a): International Energy Statistics,
Department of Energy: http://tonto.eia.doe.gov/cfapps/ipdbproject/IEDIndex3.cfm?tid=3&pid=3&aid=6
— (2008b): Performance Profi les of Major Energy Producers 2007. DOE/EIA-0206(07) http://www.eia.doe.gov/emeu/perfpro/020607.pdf (10.02.2009)
ERCB (Energy Resources Conversation Board) (2008): Alberta’s Energy Reserves 2007 and Supply/Demand Outlook 2008-2017; ISSN 11910-4235.
Esso (2008): Oeldorado 2008. Jubiläum 50 Jahre. 12 p., ExxonMobil, Hamburg.EWG (Energy Watch Group) (2008): Zukunft der weltweiten Erdölversorgung. 104 p.
Berlin.Fattouh, B. (2007c): OPEC Pricing Power. The Need for a New Perspective. Oxford Institute
for Energy Studies, WPM 31.Flint, L. (2005): Bitumen Recovery Technology. A Review of Long-Term Opportunities. http://
www.ptac.org/links/dl/BitumenRecoveryTechnology.pdfGonzález Cruz, D.J. (2007): Hydrocarbon Reserves in Venezuela. 20th World Energy
Congress Papers. 20 p.Guntis, M. (2002): California steam EOR produces less; other EOR continues.- Oil & Gas
Journal 100, 15: p. 43-47, 71-83. Hatamian, H. (1998): Natural-gas supply-and-demand problems.- Journ. Petrol. Techn.,
Jan. 1998: 58-63.
Hyun Young Lee (2008): Canada Oil Sands Output Forecast Cut on Project Delays.http://www.rigzone.com/news/article.asp?a_id=70633.
IEA (International Energy Agency) (2004): World Energy Outlook 2004. 570 p. – Interna-tional Energy Agency, Paris.
— (2006): World Energy Outlook 2006. 596 p. – International Energy Agency, Paris.— (2007): Renewable in Global Energy Supply. An IEA Fact Sheet.— (2008a): World Energy Outlook 2008. 570 p. – International Energy Agency, Paris.

CRUDE OIL
68 Energy Resources 2009
— (2008b): Oil Information 2008. OECD Paris.IFP (Institut Francaise du Pétrole) (2004): Oil and Gas Exploration and Production: Reserves,
costs, contracts. 306 p. Edition Technip, ParisInteragency Task Force on Commodity Markets (2008): Interim Report on Crude Oil, Wash-
ington D.C.Klett, T.R., Gautier, D.L. & Ahlbrandt, T.S. (2005): An evaluation of the U.S. Geological
Survey World Petroleum Assessment 2000. AAPG Bull. 89: 1033-1042.Meyer-Renschhausen, M. (2007): Ölsandgewinnung und –verarbeitung, Technik, Ökonomie,
Umweltaspekte. 186 p., Metropolis Verlag; Hamburg. OGJ (Oil & Gas Journal) (2007): Worldwide look at reserves and production. 105, 48: 24-
25.OPEC (Organisation of Petroleum Exporting Countries) (2008): Annual Statistical Bulletin
2007. 138 p. Vienna.Petrobras (2008): Accessing reserves and investing in infrastructure (Vortrag von Mr. Sergio
Gabrielli, CEO von Petrobras, auf dem 19. Welterdölkongress in Madrid). Proceedings of the 19th World Petroleum Congress, Energy Institute, London.
Petroleum Economist (2007): World Deepwater Developments Map. 2007 edition. LondonPusch, G. (2007): Perspectives of European Improved Oil Recovery. OIL GAS European
Magazine 4/2007: 179-186.Radler, M. (2008): New estimate boost worldwide oil, gas reserves. Oil & Gas Journal. 106,
48: 20/21.Smith, T. (2008): Monster of the Deep. Geo ExPro, 5, no. 5: 22-28.Stark, P. & Chew, K. (2005): Global Oil Resources: Issues and Implications. The Journal of
Energy Development, 30, 2: 159-170.US DOE (2004): Strategic Signifi cance of America‘s Oil Shale Resource. Assessment of
Strategic Issues, vol. I, March 2004.USGS (U. S. Geological Survey) (2000): World Petroleum Assessment 2000 - Description
and Results.- USGS Digital Data Series DDS-60. — (2006): Assessment of Undiscovered Petroleum Resources of Northern Afghanistan,
2006. USGS Fact Sheet 2006-331— (2008): Circum-Arctic Resource Appraisal: Estimates of Undiscovered Oil and Gas
North of the Arctic Circle. USGS Fact Sheet 2008-3049Vaher, E. (1998): Sprengarbeiten beim Ölschieferabbau in Estland: In: Glückauf 6/1998,
p. 284-289.VDKI (Verein Deutscher Kohleimporteure) (1999): Jahresbericht 1999, Hamburg.WEC (World Energy Council) (2004): Survey of Energy Resources, London. — (2007): 2007 Survey of Energy Resources, London. 586 p.

NATURAL GAS
69Energy Resources 2009
Natural Gas 4
From Natural Gas Deposit to Consumption4.1
Natural gas is a mix of different gases occurring in the earth’s crust. Besides methane as main component of natural gas, further components such as ethane and propane as well as not fl ammable gases like nitrogen, carbon dioxide, hydrogen sulfi de and helium can be contained. To a large extent, natural gas is accumulated in natural subsurface deposits. These deposits can be developed by drilling and the natural gas can be extracted. From gas fi elds, gas will be transported to the end consumer over land via a pipeline system or it is transported by sea using special tankers.
Natural gas can be generated jointly with oil as so-called associated gas or separately from coal. The formation of methane by microbes in the rock is also an important process. Just like oil, natural gas migrates in the earth crust and can thus reach trap structures of porous rock, which are covered by impermeable layers. In most sedimentary basins of the world there are, besides such dry natural gas deposits, also associated natural gas deposits, where oil and natural gas occur together.
Depending on the percentage of hydrogen sulfi de (H2S), sour gas (more than 1 vol.-% H2S), lean gas (less than 1 vol.-% H2S) and sweet gas (no H2S and less that 2 vol.-% carbon di-oxide) are differentiated. So-called “wet” natural gas, also called rich gas, occurs in many deposits together with oil. As it contains proportions of larger hydrocarbon molecules than methane, during cool-down liquid hydrocarbon mixtures condense, resulting in so-called liquefi ed gas, condensate or natural gasoline. Natural gas is called “dry”, if it can be cooled down without the precipitation of so-called condensate.
The natural gas produced from the deposit is processed right away at the location of the natural gas fi eld. Sweet gas accounts for most of the global gas production. Formation water and in some cases also higher hydrocarbons are separated at the location. The sulfur content of sour gas is removed in a special cleaning process, the so-called gas washing process. Some types of raw gas also require the separation of carbon dioxide and nitrogen.
As a rule, natural gas is transported on the continents via pipelines with diameters up to 1.4 m. To achieve a higher effi ciency of the piping, the natural gas is transported at a pressure of up to 84 bar. This way, the gas volume is reduced. To counteract a decrease in pressure along a long pipeline, a compression of the natural gas is required at intervals between 100 and 400 km. The transport distances for natural gas can be considerable in some instances. During its journey from western Siberia to Western Europe, the natural gas covers approximately 6000 km in pipelines.
Natural gas can also be transported in liquefi ed form. So-called Liquefi ed Natural Gas (LNG) consists largely of methane and ethane and is liquefi ed for transportation purposes by cooling-down to -164 °C at atmospheric pressure. This reduces the original volume of the natural gas to one six-hundredth. To the so-called LNG-chain belong systems for the precipitation of higher hydrocarbons as well as for air-cooling and liquefaction of the gas. As liquefi ed natural gas is transported using special LNG-tankers at atmospheric pressure, in the further course of the LNG-chain loading and landing terminals are required. At the

NATURAL GAS
70 Energy Resources 2009
end of the LNG-chain, there are systems for evaporating of the liquefi ed natural gas to feed it into a pipeline system. As the production, treatment and long-distance transport have to take place largely continuously, consumption, however, varies with the seasons due to varying heating requirements, natural gas is stored temporarily in underground storage facilities during the summer and removed in winter when needed.
Natural gas seeps have been known for millennia; burning natural gas was used as “eter-nal fl ame” for cultic purposes. The earliest economic use was described in China in the 3rd century AD. A more intensive economic use only started at the beginning of the last century in North America. In the 1930s, Poland, Romania and the southwest of the Soviet Union joined in, but consumption in these countries remained low in comparison to the US until the 1950s. After the installation of the long-distance pipelines and LNG-chains in the 1960s and 1970s, the consumption of natural gas rose signifi cantly, in particular in Western Europe. Until the 1970s, natural gas was in many countries a by-product of the oil exploration. The transportation costs of natural gas exceeding those of petroleum many times and the rich global supply of other fossil energy resources initially rendered a systematic exploration of natural gas economically advisable only in areas, which are located close to the consumer, which are already connected to markets or which do not possess other energy resources of their own. Over the last decades, environmental and energy effi ciency aspects also became increasingly important for exploration decisions in favor of natural gas.
Natural gas is mainly used as high-energy fuel for household, businesses, power plants and industry. To a lesser extent, natural gas is also used as basic material in the chemical industry as well as in combustion engines. At the end of 2008, in Germany about 80 000 natural-gas vehicles were on the road. Due to its chemical composition, natural gas has the lowest proportion of carbon in comparison to other fossil energy carriers in relation to the energy content. Thus, the combustion of natural gas in modern plants releases 20 to 30 % less carbon dioxide (CO2) than oil and even 40 to 50 % less than coal for the same energy gain.
Conventional Natural Gas4.2
Total EUR of Natural Gas and its Regional Distribution 4.2.1
Various assessments of the past ten years specify the EUR for natural gas between 300 and 600 trillion m³ (Tcm). Unlike for oil, these assessments seem to keep increasing continu-ously (Fig. 4.1). Since 2001, only few re-assessments of the EUR (Tab. A 4-1) have been conducted, all of which are above 400 Tcm. The differences between these evaluations result mainly from differences in the evaluation of natural gas resources.
The total global potential of conventional natural gas determined by the BGR is approximately 509 Tcm. This corresponds to approximately 460 Gtoe and thus exceeds the total potential of conventional oil by 13 %. Based on the current studies of the USGS (USGS, 2006, 2008) concerning the natural gas resources in the Arctic, the assessments by the BGR have been raised signifi cantly in comparison to previous studies.

NATURAL GAS
71Energy Resources 2009
Figure 4.1: Development of the estimates of the Estimated Ultimate Recovery (EUR) of conventi-onal natural gas, the cumulative production and reserves from 1955 to 2007 (sources for numbered references cf. Tab. A 4-1).
At the end of 2007, the cumulative global commercial production of conventional natural gas was nearly 87 Tcm. The reserves amounted to approximately 183 Tcm and the resources to approximately 239 Tcm, i.e. up to now, slightly more than 32 % of the proved reserves and slightly more than 17 % of the total global EUR of conventional natural gas to be expected according to our estimates, have already been consumed. Flared natural gas has not been taken into account.
In the regional view, the CIS (in particular Russia) possesses the most important potential of natural gas worldwide, followed by the Middle East (Fig. 4.2). Even though North America has a large total potential, the remaining potential there is probably lower, as in the US, up to today, already approximately half of the total natural gas has been produced. The proportion of Europe’s global potential of natural gas is at not quite 5 % rather low. If the natural gas markets are considered, however, the European market in particular because of the Russian supply, has more than 47 % of the total global potential available. If the Mid-dle East is included as potential supply region for Europe, even an accessible proportion of more than 77 % of the total global potential of conventional natural gas results. Thus, the European market for natural gas in general has a better supply at its disposal than other markets.

NATURAL GAS
72 Energy Resources 2009
Figure 4.2: EUR of conventional natural gas in 2007 (total 509 Tcm): regional distribution.
Tables A 4-2 to A 4-4 in the appendix contain data concerning the EUR of the countries, regions and economic groups. An overview over the total potential of the most important countries lists the three leading countries Russia, Iran and Qatar at a proportion of together more than 52 % (Fig. 4.3). The top ten countries thus possess more than 73 % of the EUR. In comparison to the BGR-Energy Study 2003 (data status year-end 2001), the EUR of natural gas has increased signifi cantly. This is particularly true for the CIS (29.8 Tcm), North America (13.1 Tcm), the Middle East (6.2 Tcm), for Austral-Asia (4.8 Tcm) and Africa (3.6 Tcm).
Figure 4.3: EUR of conventional natural gas in 2007: The top twenty countries sorted according to remaining potential (OPEC countries in blue bold-face type).

NATURAL GAS
73Energy Resources 2009
The remaining global potential is around 422 Tcm. Thus, in relation to the energy content it surpasses the remaining energy potential of conventional oil by slightly more than 50 %. According to countries, a similar concentration as for the EUR results for the remaining potential (Tab. A 4-5). The seven leading countries account for more than two thirds of the globally remaining potential. These countries will play a decisive role in the future supply of natural gas.
Natural Gas Reserves4.2.2
According to Ivanhoe and Leckie (1993), approximately 26 600 natural gas fi elds are known globally. Especially large natural gas fi elds, the giants with reserves of more than 80 Bcm (billion m³) and super giants with reserves of more than 800 Bcm are of particular importance for ensuring the supply of natural gas. Only little more than 100 fi elds fall into the category giant and super giants. There, about 75 % of the known global reserves are concentrated. Unlike petroleum, the currently published assessments of the global reserves of natural gas vary little, between 170.1 and 183.2 Tcm (Tab. 4.1).
Table 4.1: Reserves of conventional natural gas in 2007: Comparison of different evaluations in Tcm. (OGJ, 2007, EIA, 2008 for World Oil and Cedigaz, BP, 2008, OPEC, 2008).
Region OGJ World Oil Cedigaz BP BGR OPEC
Europe 4 872 4 976 6 100 6 136 5 792 6 232
CIS 57 059 60 510 53 809 53 274 58 303 58 112
Africa 13 866 14 181 14 581 13 370 14 437 14 542
Middle East 72 191 72 361 73 209 67 127 73 374 73 559
Austral-Asia 11 764 14 101 15 218 14 462 15 096 15 166
North America 8 018 8 124 8 003 7 976 7 995 8 018
Latin America 7 414 6 858 7 720 7 727 7 834 7 542
WORLD 175 185 181 111 178 640 170 070 182 830 183 171
The development of the natural gas reserves and the natural gas production since 1900 shows a continuous increase, with the reserves having grown faster in comparison (Figure 4.4). Table A 4-6 contains a general review concerning the development of the reserve situ-ation since 1980. The natural gas reserves of the world rose from 160.8 Tcm by the end of 2001 to 182.8 Tcm by the end of 2007 according to our evaluations, i.e. by approximately 22 Tcm with a cumulative production of natural gas during that period of about 16.9 Tcm in all (Tab. A 4-6). Thus, in 2007 the highest level of reserves was achieved.
Since the BGR-Energy Study 2003, regionally signifi cant increases in reserves occurred in the Middle East and to a lesser extent in Africa and Latin America. In contrast, in Austral-Asia, Europe and North America slight decreases of reserves were noted. Increases of reserves of more than 2 Tcm were found in Qatar due to the upward revision of the North Field reserves and in Iran. In addition, increases of more than 500 Bcm were recorded by Azerbaijan, Egypt, Algeria, Nigeria, Bolivia, Mexico, Indonesia, Russia and China. Due to the large South Yolatan discovery, the Turkmen natural gas reserves will increase signifi cantly in the near future. The decrease in reserves of individual states was less than 1 Tcm.

NATURAL GAS
74 Energy Resources 2009
Figure 4.4: Development of the reserves and production of conventional natural gas from 1900 to 2007.
The natural gas reserves are distributed, just like the petroleum reserves, very differently by individual countries and regions (Tab. A 4-7). The Middle East and the CIS possess nearly three-fourths of the global natural gas reserves. Historically, North America is also part of regions with large reserves. Due to the long production history with production at a high level for approximately 100 years more than half of the original reserves have already been recovered here. When comparing the individual reserve countries (Tab. A 4-7), it is obvious that the three top countries have a unique position. Russia possesses slightly more than 26 % of the global natural gas reserves and holds, together with Iran and Qatar, more than 55 % of the global reserves. The eight countries with reserves of more than 5 Tcm possess more than two thirds of the global reserves. Seven OPEC countries number among the ten countries with the largest reserves (Fig. 4.5).
Figure 4.5: Reserves of conventional natural gas (total 183 Tcm) of the top ten countries and Germany as well as their distribution by regions in 2007.

NATURAL GAS
75Energy Resources 2009
The offshore area at approximately 65 Tcm provides approximately one third of the global natural gas reserves. Figure 4.6 provides an overview over the regional distribution of the offshore reserves. In Europe and Austral-Asia, offshore reserves dominate over the natural gas reserves onshore. The Middle East possesses the largest offshore reserves; the largest natural gas fi eld of the world, South Pars/North Field (Iran/Qatar) in the Persian Gulf, takes up about 38 Tcm.
Figure 4.6: Reserves of conventional natural gas in 2007: Regional distribution onshore and offshore.
The natural gas reserves of the most important countries are - similar to petroleum - at more than 72 % predominantly owned by state companies (Tab. A 4-8). BP has, as the fi rst private company, rank 18, directly followed by Shell and the Russian Itera. However, currently several OPEC countries are opening their natural gas markets increasingly also for private companies. Private companies are involved in the development of the South Pars Field in Iran; Saudi Arabia has also awarded natural gas concessions to private companies. In contrast, for instance in Bolivia, nationalizations have been conducted.
Natural Gas Resources4.2.3
In comparison to reserve information with annual reporting duties, assessments concerning natural gas resources are conducted at irregular and in larger intervals. The last global as-sessment has been conducted by the USGS in 2000 (USGS, 2000). It referred to the state at the end of 1995 and contained a forecast for 25 years. As a mean average, the global resources of conventional natural gas have been assumed at about 147 Tcm with a range of 76 to 251 Tcm without taking into account the increases in reserves from the producing fi elds (reserve growth). For this global reserve growth, the USGS indicates a mean value of 104 Tcm.
Since 2000, the USGS has been conducting new evaluations of Afghanistan and the Arctic (USGS, 2006, 2008), with positive evaluation of the Arctic. The results of these studies have been considered in this assessment, i.e. the resources of conventional natural gas reach slightly more than 239 Tcm and thus exceed the value of 2001 by about 22 Tcm (Tab.

NATURAL GAS
76 Energy Resources 2009
A 4-9). For the Middle East, the resources have been reduced; part of the resources has been transferred into reserves by the upward revision of the North Field reserves. The glo-bally reported natural gas resources correspond to approximately three times the amount of the cumulative natural gas production and exceed the known natural gas reserves by about 31 %. These numbers indicate the good situation of resources for natural gas, which is quite advantageous in comparison to petroleum.
In a regional comparison, the CIS possesses nearly 50 % of the global resources of natural gas, followed by North America at nearly 15 %. The Middle East possesses approximately 13 % and Austral-Asia nearly 10 % (Tab. A 4-10). The ranking of the resource countries shows, similar to the reserves, a strong concentration on a few countries (Tab. A 4-10, Fig. 4.7). Russia has a predominant position at 44 % of the natural gas resources. The top three countries account for more than 57 %, the top eleven countries account for nearly 80 % of the resources. Five OPEC countries number among the top eleven countries (Fig. 4.7).
Figure 4.7: Resources of conventional natural gas (total 239 Tcm) of the top ten countries and Germany as well as their distribution by region in 2007.
The analysis of the transfer of the resources to reserves and of the reserve growth reported by the USGS (2000) showed that for natural gas in the period from 1996 to 2003 added reserves from new discoveries of approximately 13 Tcm have been realized (Klett et al., 2005). Increases from the reevaluation of fi elds under production added up to 48 Tcm. Thus, 10 % of the resources have been transferred and 51 % of the reserve growth forecasted by the USGS were realized. During that period, nearly 20 Tcm of natural gas have been produced. This amount has been largely replaced by new discoveries; the reevaluation of known fi elds supplied an additional signifi cant growth.

NATURAL GAS
77Energy Resources 2009
Natural Gas Production4.2.4
The production numbers of natural gas contain both conventional and unconventional natu-ral gas (Chapter 2.3). Unconventional natural gas has a very low proportion of the total production except for the US. In the US, in 2006 unconventional natural gas contributed 43 % of the total production (Chapter 4.3.1). The data concerning production pertain as a rule to raw gas, i.e. natural gas of the quality occurring in the fi elds. In some cases, these amounts have been converted to a uniform energy content (e.g. clean gas in Germany), which may result in differences between different statistics.
The global natural gas production has increased steadily over the past years (Fig. 4.4) and reached its historical maximum at 3012 Bcm in 2007. At 0.5 Tcm this means an increase by approximately 19 % in comparison to 2001. Main production areas were the CIS and North America, a quarter each of the global production. Austral-Asia, the Middle East and Europe trail behind at a tenth each of the global production. The cumulative global produc-tion of natural gas up to the end of 2007 reached nearly 87 Tcm or slightly more than 32 % of the total reserves discovered up to now. Half of that has been produced in the course of the past 17 years. Some countries increased their production considerably in 2007 in comparison to 2001. Russia at 60 Bcm as well as the PR China, Norway and Iran at more than 45 Bcm each, as well as Trinidad & Tobago, Malaysia, Nigeria, Qatar, Saudi Arabia and Mexico at more than 25 Bcm attained high increases. In future years, signifi cant increases in particular in Qatar, in Turkmenistan and, depending on the politic development, in Iran with the development of the largest natural gas fi eld in the world, South Pars/North Field, are to be expected. Decreases in production were suffered in particular by Great Britain due to increasing depletion of the fi elds in the North Sea (Tab. A 4-11). Amongst the top ten countries (Tab. A 4-12, Fig. 4.8) Russia and the US were dominant. The top four countries account for nearly half the global production of natural gas, the top ten countries accounted for nearly two thirds. There are only four OPEC countries amongst the top ten (Fig. 4.8). During the last decade, there were no changes in the order of the top three countries (Tab. A 4-13).
In statistics concerning natural gas production, only the marketed proportion of the total natural gas production (gross production) is customarily recorded, but not the fl ared or discharged proportion of associated gas (Info box 3) or the service consumption of the production companies. The amounts of natural gas, which have been re-injected in petro-leum deposits to increase the petroleum recovery, are not contained, either. The amounts of natural gas that have been fl ared or re-injected between 1960 and 2007 worldwide have been compared in Figure 4.9 to the global production of crude oil. The amounts of fl ared associated gas have barely increased during the last 25 years, even though petroleum pro-duction has increased. Natural gas in particular has increasingly been used since the middle of the 1970s to increase the recovery rate of oil fi elds.
The production of natural gas from offshore fi elds has increased by nearly 20 % to about 836 Bcm, from 2001 to 2007; a proportion of 27.7 % of the global production. Of this, one quarter each originates from the North Sea and Austral-Asia and approximately 15 % from the Gulf of Mexico as well as from the Middle East. This trend of an increasing offshore-production in comparison to the onshore production is recognizable for natural gas as well as for oil. In future, in particular the importance of the Middle East and Africa will increase.

NATURAL GAS
78 Energy Resources 2009
Figure 4.8: Production of natural gas (totall 3 Tcm) of the ten most important countries and Germany as well as their distribution according to region for 2007.
Figure 4.9: Development of the amounts of natural gas globally fl ared and re-injected and the world production of petroleum.

NATURAL GAS
79Energy Resources 2009
Associated Gas – Unused Potential
Associated gas is a by-product of the petroleum production. Until today, this gas is frequently fl ared or released into the atmosphere unburnt. It could be re-injected into the deposit for maintaining pressure, for manufacturing fuel like liquefi ed gas or used locally for generating electricity. The main reason for fl aring or venting the gas is the lack of economic incentive for using or processing the gas.
After the effect of the gas fl aring and of gas venting and the carbon dioxide and methane emis-sions was disregarded for a long time, today the possible infl uence of these emissions on the climate as well as the energy potential lost has been discussed increasingly. According to the World Bank, about 147 Bcm of associated gas were fl ared in 2007. This amount corresponds to approximately 30 % of the natural gas consumption of the European Union and would have had an economic value of nearly USD 40 billion based on the US-market value. In addition, the useless burning of this natural gas generates annually about 400 million t CO2. At approximately 50 Bcm, Russia alone contributes about one third of the globally fl ared associated gas. The OPEC also plays a signifi cant role in causing these emissions. There is little reliable data about the amount of unburned natural gas that is vented, as the measurements are technically dif-fi cult. The U.S. Environmental Protection Agency estimates the amount of vented natural gas including some diffuse emissions at currently approximately 100 Bcm annually.
Curtailing the current established practice seems only possible by introducing corresponding guidelines and economic incentives. Algeria for instance plans to impose taxes on fl aring gas in order to achieve a reversal of this procedure.

NATURAL GAS
80 Energy Resources 2009
The production of natural gas is largely controlled by national companies (Tab. A 4-14). There are also three private companies amongst the most important ten gas-producing companies. The top ten natural gas companies together produce about 41 % of the global production, of these Gazprom at a percentage of 18 % has a dominant position. In future, the newly founded Gas Exporting Countries Forum (GECF) might play a similar role to that of the OPEC for petroleum (Info box 4).
Consumption of Natural Gas4.2.5
The global consumption of natural gas reached a historic maximum in 2007 at slightly more than 3 Tcm and increased by approximately 520 Bcm since 2001 (Tab. A 4-15). The US, fol-lowed by Russia, Iran, Japan, Germany, Canada and Great Britain used most of the natural gas (Tab. A 4-16). Whereas the OECD countries at more than 1.5 Tcm consumed slightly more than 50 % of the natural gas produced globally, the OPEC accounted for only 12 %. The consumption of natural gas was largely concentrated in three regions: North America, the CIS and Europe. When comparing the consumption and the production of natural gas (Fig. 4.10), differences result. They are less signifi cant, however, than those for petroleum (Chapter 3.2.6). Europe shows signifi cant differences between the production and the con-sumption of natural gas. The consumption in Europe has to be covered by massive imports of natural gas. The situation for countries of the CIS is just the opposite. These are the main suppliers of the European countries.
Figure 4.10: Production and consumption of natural gas 2007: Regional distribution.
Since 2001, the consumption of natural gas has increased in all regions, particularly in Africa, Austral-Asia and the Middle East (Tab. A 4-15). Out of the top ten consumers of natural gas in the world, the US alone used more than one fourth of the total global natural gas (Tab. A 4-16; Fig. 4.11). Russian consumption of more than 400 Bcm is also high. In this country the share of natural gas in the total primary energy supply is more than 50 %. Most other natural gas consumers have a signifi cantly lower share. On a global scale, Germany is the fi fth largest natural gas consumer and in 2007 it used almost 4 % of the total volume in the world. Among the top ten gas consuming countries is only one OPEC country, Iran (Fig. 4.11).
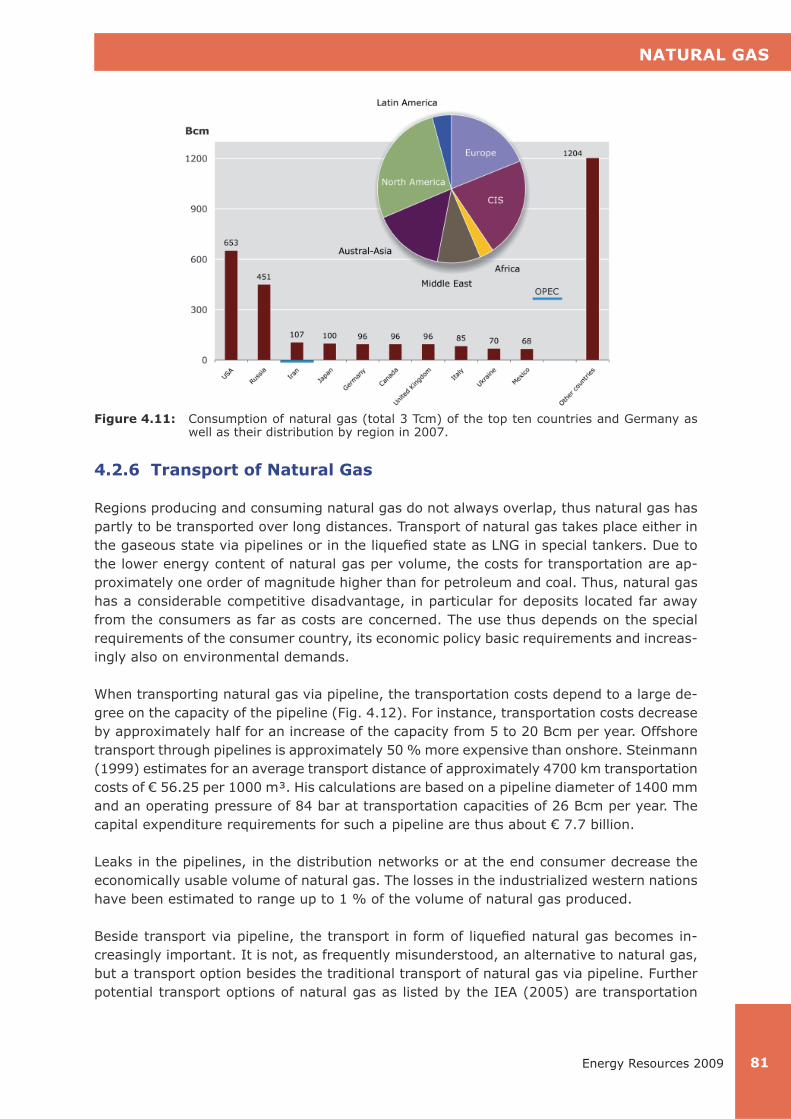
NATURAL GAS
81Energy Resources 2009
Figure 4.11: Consumption of natural gas (total 3 Tcm) of the top ten countries and Germany as well as their distribution by region in 2007.
Transport of Natural Gas4.2.6
Regions producing and consuming natural gas do not always overlap, thus natural gas has partly to be transported over long distances. Transport of natural gas takes place either in the gaseous state via pipelines or in the liquefi ed state as LNG in special tankers. Due to the lower energy content of natural gas per volume, the costs for transportation are ap-proximately one order of magnitude higher than for petroleum and coal. Thus, natural gas has a considerable competitive disadvantage, in particular for deposits located far away from the consumers as far as costs are concerned. The use thus depends on the special requirements of the consumer country, its economic policy basic requirements and increas-ingly also on environmental demands.
When transporting natural gas via pipeline, the transportation costs depend to a large de-gree on the capacity of the pipeline (Fig. 4.12). For instance, transportation costs decrease by approximately half for an increase of the capacity from 5 to 20 Bcm per year. Offshore transport through pipelines is approximately 50 % more expensive than onshore. Steinmann (1999) estimates for an average transport distance of approximately 4700 km transportation costs of € 56.25 per 1000 m³. His calculations are based on a pipeline diameter of 1400 mm and an operating pressure of 84 bar at transportation capacities of 26 Bcm per year. The capital expenditure requirements for such a pipeline are thus about € 7.7 billion.
Leaks in the pipelines, in the distribution networks or at the end consumer decrease the economically usable volume of natural gas. The losses in the industrialized western nations have been estimated to range up to 1 % of the volume of natural gas produced.
Beside transport via pipeline, the transport in form of liquefi ed natural gas becomes in-creasingly important. It is not, as frequently misunderstood, an alternative to natural gas, but a transport option besides the traditional transport of natural gas via pipeline. Further potential transport options of natural gas as listed by the IEA (2005) are transportation

NATURAL GAS
82 Energy Resources 2009
as compressed natural gas (CNG), as Micro-LNG and in form of technically generated gas hydrate. To what extent these additional options will prevail, remains to be seen.
Figure 4.12: Transportation costs for natural gas via pipeline and as LNG as a function of the capacity (according to Schwimmbeck, 2008).
For LNG-transportation, the liquefaction of natural gas requires already considerable amounts of energy. For this reason, the specifi c transportation costs for short distances are signifi -cantly higher than for transportation via pipeline (Fig. 4.12). Transportation of LNG only becomes economically favorable in comparison to pipeline transportation for distances of more than approximately 3000 km. Transport as LNG has the advantage of greater fl ex-ibility, as it is not bound to a rigid piping system with fi xed starting and end points as for pipeline transport. If no direction clauses have been contractually stipulated, LNG-tankers can operate between any loading facility and landing terminal. This also provides the pos-sibility of establishing a larger spot market for natural gas. On the other hand, the LNG-trade is tied to the oceans, which results in two large markets in the Atlantic and Pacifi c area. For delivering the LNG market, fi elds close to the coast or offshore-fi elds are prefer-able. Darley (2004) has specifi ed the erection costs for a complete LNG-chain at USD 3 to 10 billion. The specifi c energy consumption within the LNG-chain is approximately 15 % for instance for the transport from Qatar to the east coast of the US in relation to the total amount transported.
In 1964, liquefi ed natural gas was delivered for the fi rst time from Algeria to Great Britain. The LNG trade has skyrocketed since. Based on the existing trends, a strong increase of the LNG trade is expected in the medium term. It is assumed that the liquefaction capaci-ties will be doubled in the course of the next fi ve years. A similar development is also to be expected for the expansion of the landing terminals. The IEA (2006a) expects investments of nearly USD 100 billion for this period. Capital expenditure for new LNG-tankers has been specifi ed at USD 32 billion, for regasifi cation plants at USD 31 billion. For the year 2030 the IEA (2004a) estimates an LNG-proportion of the trade in natural gas of more than 50 %.

NATURAL GAS
83Energy Resources 2009
A trend of the past years is the construction of larger units referring to liquefaction plants and tankers. This way the LNG-trade was expanded and the costs were reduced. In addition, there are technical developments in particular in the offshore-area, which may positively infl uence an expansion of the LNG-trade (Cox 2006). The following are to be mentioned:
FPSO (• Floating Production, Storage and Offl oading Units) for LNG (FLNG) for greater water depths, which are used offshore for production, liquefaction, storage and load-ing,
LNG-platforms for water depths of 20 to 50 m, where natural gas is taken over from • producing platforms and liquefi ed,
FSRU (• Floating Storage and Regasifi cation Units), which restores the liquefi ed natural gas on board to the gas phase and
GBS (• Gravity Based Structures) for storage and regasifi cation in water depths less than 30 m.
These developments are accompanied by the emergence of new suppliers on the LNG mar-ket, such as Russia, Iran, Norway, Angola, Cote d‘Ivoire (Ivory Coast), Yemen and Peru. Pakistan, Chile, Brazil, Jamaica, but also European countries such as Croatia, Poland and Germany as well as Israel might become new LNG customers. The largest increases in de-mand for LNG are to be expected in India and China, but also in Great Britain and in the US. For covering its increasing demand for energy, the US will have to depend increasingly on LNG, as the domestic production of natural gas and imports from Canada will either stagnate or possibly even regress. Thus, in the long run the proportion of LNG in the supply of natural gas of the European and North American markets for natural gas will increase. In principle however it can be assumed that the supply of pipeline gas from Russia, Norway, and North Africa and possibly from Iran will remain dominant for Europe. LNG will however have its share in the diversifi cation of the supply of natural gas.
Trade of Natural Gas and Regional Markets4.2.7
The still existing dominance of pipeline transportation has limited the distances between place of production and consumption of natural gas. For this reason, there is no global mar-ket for natural gas as for oil and coal; but only regionally limited markets exist (Fig. 4.13). Within these markets, producers and consumers are linked by long-term supply contracts, to safeguard the high capital expenditure for setting up the infrastructure. There are four regional markets for natural gas in the world: the North American and the South American market, where natural gas is generally traded only pipeline-bound, the Asian market, which is nearly completely a purely LNG market and where the liquefi ed natural gas has to be transported long distances by tanker as well as the mixed European market (Abb. 4.13). The countries of the Middle East and the Central Asian countries of the CIS hold a special position, as they can supply the European as well as the Asian market. The eastern parts of Russia with the regions to the east of the Yenissey River are assigned to the Asian market. The countries belonging to the individual markets have been listed in the glossary.
In 2007, slightly more than 30 % (approximately 920 Bcm) of the global production of natural gas were traded cross-border (not considering transit trade) (Fig. 4.14), of these approximately one quarter as liquefi ed natural gas (LNG). The six most important exporting countries Russia, Canada, Norway, Algeria, the Netherlands and Turkmenistan accounted

NATURAL GAS
84 Energy Resources 2009
Will There Be a Natural Gas Cartel Analog to OPEC?
The Gas Exporting Countries Forum (GECF) was offi cially founded on December 23rd, 2008 in Moscow, when the articles of association and an agreement were signed. Currently there are 15 member states: Egypt, Equatorial Guinea, Algeria, Bolivia, Brunei, Indonesia, Iran, Qatar, Libya, Malaysia, Nigeria, Russia, Trinidad & Tobago, the United Arab Emirates and Venezuela. Norway and Kazakhstan have observer status. The organization is based in Doha, Qatar. It is the declared goal of the GECF to strengthen the cooperation between the member states. The core of the organization is the triple alliance (Troika) Russia, Iran and Qatar, who together pos-sess 55 % of the global reserves of natural gas. This triple alliance develops, amongst others, the agenda for the GECF.
The Gas Exporting Countries Forum founded in May 2001 in Teheran was the predecessor of the new GECF, then a loose amalgamation of producers and exporters of natural gas without articles of association, whose economic and strategic-political interests diverged strongly. Even today, important producing countries such as Australia, Canada, the Netherlands or Norway are not members of the GECF. Venezuela and Equatorial Guinea as non-exporters are members, however. The member states of the GECF today possess together nearly 73 % of the global reserves of natural gas and slightly more than 57 % of the global resources of natural gas and jointly cover 42 % of the global production as well as slightly more than 51 % (in relation to LNG even 85 %) of the global exports of natural gas.
Many people view the GECF as an equivalent of the Organization of Petroleum Exporting Coun-tries (OPEC) for the gas sector. This is based on fears that collusion will contribute to manipula-tions of the gas price and a monopoly could be created that way. The manner in which natural gas is traded constitutes a signifi cant difference to OPEC, however. For natural gas there is no global market as for petroleum and long-term contracts of 25 years and more bind producers and consumers. The gas price has been linked to the oil price. These conditions do not render a price fi xing in the style of the OPEC currently possible.

NATURAL GAS
85Energy Resources 2009
for slightly more than 61 % of the global natural gas exports in 2007 (Tab. A 4-17), with a volume of more than 50 Bcm each. The ten top exporting countries possessed an export volume of natural gas of nearly 75 % of the total exports. This shows that in the natural gas market only few suppliers can deliver large amounts of natural gas.
Figure 4.14: Global trade in natural gas in 2007 in Bcm (data according to BP, 2008).
Altogether 15 countries were involved in the LNG trade in 2007. The largest LNG exporter was Qatar, followed by Malaysia and Indonesia (Tab A 4-18). Nearly 40 % of the exports originated in Austral-Asia, but were traded in their regional market (Fig. 4.14). Africa follows at 27 %, just ahead of the Middle East at 26 %. OPEC has, at a 53 % proportion of the LNG export, a leading position similar to the export of petroleum (56 %). With the increase of
Figure 4.13: The four regional markets for natural gas in the world. Dashed: Transition area between European and Asian market.

NATURAL GAS
86 Energy Resources 2009
the global LNG trade, a spot market for natural gas developed little by little. Its proportion of the total LNG market is still small and most of the contracts are still long-termed. In the following years, the proportion of the trade volume through spot markets should increase up to 20 %. This might result in a certain decoupling of the natural gas price from the oil price, which would then probably result in the spot market prices for natural gas being just as volatile as currently the prices for petroleum. Thus, there might also be an increased fl exibility of the contracts for LNG deliveries, increasingly deviating from the current practice of the destination fi xing and enabling the liberalization requested by the EU.
The US, Japan, Germany, Italy and the Ukraine were in 2007 the top fi ve importing coun-tries with natural gas volumes of more than 50 Bcm, corresponding to 46.9 % of the global import volume (Tab. A 4-19). The top ten importing countries for natural gas received ap-proximately two thirds of the traded volumes. In 2007, 17 countries imported LNG. Japan dominates in this respect with a proportion of slightly more than 39 % (Tab. A 4-21). From a regional point of view, the Asian market for natural gas is dominant as a nearly purely LNG-market, as it takes up 65 % of the LNG imports. Europe follows with an LNG proportion of nearly 24 %. In the regional Asian market for natural gas, the proportion of LNG of the natural gas trade will decline in future in spite of an absolute rise of consumption. This de-velopment results from the inclusion of deliveries via pipeline from Russia and Turkmenistan to China and possibly to other East Asian countries. Deliveries via pipeline from Indonesia, Malaysia and Myanmar to Singapore and Thailand as well as from Iran to Pakistan and India are also conceivable.
European Natural Gas Market4.2.8
The European gas market ranges eastwards to Kazakhstan as well as to the Russian western Siberia, in the south down to northern Africa. The Middle East has not been included (Fig. 4.13). The annual consumption of natural gas in the European market has risen to 1300 Bcm over the past years. The demand for natural gas in this market is met at approxi-mately 70 % by the production from Russia, Norway, Algeria and Great Britain, while Russia alone satisfi es approximately half of the demand. Approximately 550 Bcm, corresponding to slightly more than 42 %, were cross-border traded in the European market for natural gas in 2007. The transportation was conducted largely pipeline-bound; only approximately 53 Bcm were imported as LNG, mainly from Algeria and Nigeria.
The reserves base of Europe (Tab. A 4-7) is comparatively small at about 7420 Bcm. Nor-way, the Netherlands and Great Britain together account for more than three quarters of these reserves (Bittkow & Rempel, 2008, 2009). The dominant position of Russia concern-ing the reserves (47.7 Tcm) is obvious. The largest part of these is stored in west-Siberian deposits. In addition to the immense reserves, in Russia gigantic additional resources of about 106 Tcm are expected. The potential of eastern Siberia and of the Russian Far East as well as the adjacent shelf area cannot be considered in the foreseeable future for the supply of the European market due to the long distances. The reserves for supplying the European gas market are based on the great potential of the Caspian region (Turkmenistan, Kazakhstan, Azerbaijan and Uzbekistan), on the natural gas potential of the North Sea as well as of North Africa besides the massive Russian natural gas potential. Taking into con-sideration the signifi cant natural gas potential of the Middle East as an additional source

NATURAL GAS
87Energy Resources 2009
for deliveries to the European market by sea using LNG transportation or via pipeline from Iran, this market is in a comfortable supply situation potentially.
The European gas market possesses a very extensive pipeline network, which connects the great production regions in West Siberia, in the Volga-Ural region, in the North Sea and in North Africa to the main consumer regions in Western Europe and the western part of the CIS (Fig. 4.15). The pipeline network for natural gas of Western and Central Europe comprises approximately 50 000 km, to which a distribution network of more than 1.5 mil-lion km can be added. The Russian natural gas pipeline system, which is mainly operated by Gazprom, has a length of nearly 155 000 km with a capacity of 600 Bcm/a. The major part of these pipelines has been in operation for more than ten years, in part even longer than 30 years. In the coming years, extensive reconstruction of the system, in particular the compressor stations will be required.
For safeguarding the increasing demand for natural gas, new fi elds have to be developed and new pipelines have to be built. Such measures require extensive fi nancial support, which can only be provided by international capital markets or governments. As these funds are tied up for a long time, a long-term and sustainable price perspective for natural gas is required. Currently and in the coming years, a number of large pipeline projects for safeguarding the increasing import demand of Europe are in the planning and construction stages, respectively (Fig. 4.15). Relating to deliveries from Russia, they are the Nord Stream Pipeline through the Baltic Sea and die South Stream Pipeline through the Black Sea and across the Balkan. For deliveries from Central Asia and Iran, the projects Nabucco and the
Figure 4.15: European natural gas network and pipeline projects (From Ruhrgas, 1999, updated).

NATURAL GAS
88 Energy Resources 2009
Trans-Adria-Pipeline are important. Deliveries from Northern Africa are to be enabled via the Medgas and Gasli projects (Algeria) as well as via the Green Stream Pipeline (Libya). Turkey could play a key role in the trade with natural gas and the supply of Southern Europe because of its planned link to several areas of supply (Russia via the Balkan and the Black Sea, Iran, Turkmenistan, Egypt).
More than 50 % of the LNG landed in Europe in 2007, or 27.1 Bcm, originated from Algeria, Egypt and Libya. In the European market, only eight countries participate in the trade of LNG. All other European countries are supplied exclusively by pipelines. The Atlantic states Spain, Portugal and France show a high LNG-proportion of their natural gas supply of more than 30 %. The LNG-proportion in the Mediterranean states Greece and Turkey as well as in Belgium is approximately 20 %. In Italy and Great Britain, the proportion of LNG is below 3 %. The general trend for Europe indicates an increase of the LNG-proportion of imported natural gas. An expansion and new construction of landing capacities for LNG is proposed for the Atlantic and Mediterranean area as well as in the North Sea and the Baltic Sea. In the Norwegian town of Hammerfest in September 2007, a liquefaction plant with loading terminal went on stream. It is supplied with natural gas from the Snøhvit fi eld in the Barents Sea. There is no LNG terminal in Germany.
The energy package of the EU commission published in January 2007 and national regula-tions are aimed at the creation of a true EU single market for energy, the development of liquid commercial markets and the simplifi cation of the access to the pipeline network. The complete liberalization of the EU single market for natural gas applies since July 1st, 2007, also to the European end consumers. New legal requirements for the power and the gas markets apply in Germany since the amendment of the Energy Industry Act (Energiewirt-schaftsgesetz, EnWG) as well as the corresponding statutory ordinances since July 2005, which transpose the so-called EU Energy Directives passed in mid 2003 for the power and natural gas single markets into national law. In Germany, this resulted in the termination of the negotiated network access on the basis of the voluntary association agreements. It is the objective of the new Energy Industry Act to provide a safe, cheap, consumer-friendly, effi cient and ecologically sustainable supply of power and natural gas. An improvement of the transparency of the market and a better cost effi ciency of the network areas are aimed at. Important new components of the German Energy Law are, amongst others, the establishment of a regulation authority (Bundesnetzagentur – Federal Network Agency), the legal and organizational demerger of the power supply companies, the regulation of network access via an entry-exit-model for the gas sector and the regulation of the network connection. Since July 2007, natural gas is also traded at the European Energy Exchange (EEX) in Leipzig in the spot market as well as in the futures market.
Natural Gas Prices4.2.9
The price for natural gas consists of several components. Extraction, processing and trans-portation costs contribute the lion’s share. The extraction costs of natural gas contain analog to oil (Chapter 3.2.5) the exploration, development and production costs for a natural gas fi eld. They are infl uenced, amongst others, by the type and depth of the reservoir horizons, the composition of the natural gas and also the climatic conditions on site. There are no concrete data about the extraction costs in the references. According to the assessment of the BGR, these are between USD 0.40 and USD 2.50 per MMBtu for the most important

NATURAL GAS
89Energy Resources 2009
gas providers. Due to the use of modern technologies in exploration, drilling and production these extraction costs have been reduced signifi cantly towards the end of the 1990s. They have, however, risen signifi cantly, in particular since 2003, due to higher costs for energy, equipment, material and personnel.
In addition to the extraction costs, there are costs for processing the natural gas, the of-fi cial producing taxes, duties and the profi ts of the company. Costs for the processing of the natural gas depend on the composition of the gas. Lean gases consisting mainly of methane require only drying. Greater expenditure results for rich gases, which contain higher homologues of methane and gas condensate, as their separation from natural gas is required before it can be transported. These products are also marketed as liquefi ed pe-troleum gas (LPG) in addition to natural gas and thus contribute to a reduction of the costs. For the production of sour gas, the production equipment has to be corrosion resistant and thus requires additional expenditure for increased technical input. In addition, hydrogen sulfi de and possibly carbon dioxide have to be removed from the natural gas. In the course of this process, sulfur is generated, which can be sold as marketable product, but currently profi table marketing is diffi cult, as the world market for sulfur is saturated. From the cost categories described above the prices for natural gas at the border of the individual produc-ing country can be derived.
As natural gas is not traded on a uniform world market with only slightly regionally differing prices, unique price structures have developed in the regional markets (Tab. A 4-20). Until 2006, a harmonization of the prices of different markets in the course of time was observed (Fig. 4.16). Since 2006, this trend seems regressive, however; the prices of the regional markets diverge once again. The prices for natural gas follow the price for petroleum with a delay of approximately half a year. Accordingly, the prices for natural gas in the second half of the 1980s decreased, fell slightly in 1999, in order to increase again ever since 2000 (Fig. 4.16).
Figure 4.16: Development of the prices for natural gas from 1980 to 2007 (1 MMBtu – Million British Thermal Units – corresponds to approximately 28 m³ natural gas or approximately 0.023 toe).

NATURAL GAS
90 Energy Resources 2009
Worldwide, the major part of the traded natural gas is bought and sold on the basis of me-dium to long-term contracts, whereas at spot markets only smaller surplus and additional amounts are traded. In addition, the development of the prices in the spot markets is very much affected by the seasonal variations of demand. In particular during the winter months, there are frequently price peaks due to high demand and only limited supply. The spot prices are also indirectly infl uenced by the development of the oil prices. The comparison of the price development of the spot markets with the gas prices agreed on in long-term delivery contracts linked to oil shows that the development of the oil-linked gas prices is signifi cantly more reliable and less volatile.
The producers of natural gas have repeatedly tried, especially in times of low oil prices, to decouple the natural gas price and the oil price. Because of the considerably decreased oil prices since the fall of 2008, there have already been fi rst requests for decoupling oil and natural gas prices. In doing so, in particular the high capital commitment for natural gas projects has been brought forward as an argument, which can in extreme cases result in projects necessary for a smooth supply not being undertaken in times of low prices. To which extent a decoupling can happen is questionable, as natural gas is in direct competi-tion with other fuels and can be replaced by them. The infl uence of the GECF on the future pricing remains to be seen (Info box 4).
Unconventional Natural Gas4.3 Until the mid 1980s, unconventional natural gas was widely regarded as a negligible factor in the natural gas sector. From an emerging resource a decade ago, and a mostly overlooked resource two decades ago, unconventional gas has now developed into a core business of many large independent producers and of a growing number of major oil and gas companies (Kuuskraa, 2007a). According to the classifi cation in Chapter 2.3.2, unconventional natu-ral gas is separated into natural gas from dense rocks (tight gas and shale gas), coalbed methane, natural gas from aquifers and gas hydrates.
Tight and Shale Gas4.3.1
These types of natural gas are occurring in rocks with very low permaeability as compared to classical reservoirs. They comprise occurrences in sandstone or carbonate reservoirs (tight gas) as well as gas enrichments in mudstone (shale gas). The delimitation from conventional gas deposits is based on the permeability of the rock (Fig. 4.17). Internationally, an aver-
Figure 4.17: Comparison of a sandstone (grain size about 0.5 mm) with high porosity and per-meability as conventional natural gas reservoir rock (left photo) to a low permeable sandstone as tight reservoir (right photo). For both specimens the pore spaces have been dyed blue (photos: Naik).

NATURAL GAS
91Energy Resources 2009
age permeability below 0.1 milliDarcy (mD), in Germany below 0.6 mD, is used to classify natural gas occurrences as tight or shale gas. The source of the hydrocarbons, whether they are of microbial or thermal origin, is not important for this type of differentiation.
Natural gas in tight reservoirs typically occur in the central areas of deep (> 4500 m) sedi-mentary basins as so-called deep gas or basin-centered gas. Shale gas can occur in shal-lower depths as long as temperature is suffi ciently high to generate hydrocarbons from the organic matter in the mudstones. The generated gas never dismigrated from the shales, hence these rocks are both source and reservoir rock. Every now and then shallow gases (Info box 5) in low-permeable rocks are classifi ed as shale gas deposits. Typical character-istics of natural gas in tight and/or shale reservoirs are their large regional (i.e. basin wide) extension in usually overpressured reservoir rocks and the very large amount of resources. However, amount and quality of these types of hydrocarbon accumulations are very variable, thus production is currently limited to those areas with the most advantageous reservoir properties, so-called sweet spots.
The production of hydrocarbons from tight and shale gas reservoirs is technically very dif-fi cult. The low porosity, reduced permeability and the high water saturation in the reservoir result in a complex multiphase fl ow. Additionally the in-situ stress conditions greatly infl u-ence the producibility. Due to the low permeability the infl ux of the gases into the borehole is impeded and the production rates are low. An increase of the permeability is thus an essential measure for increasing production rates or to enable an economic production at all. The technical development of new production strategies is thus of particular importance for occurrences of natural gas in tight reservoirs. State funded research programs in the US targeting unconventional gas accumulations, in accordance with the Energy Policy Act 2005 (Reeves et al., 2007a), have already resulted in signifi cantly higher production rates from tight reservoirs. Amongst the most important measures to increase production rates are the generation of artifi cial hydraulic fracs to enhance permeability (Abb. 4.18) and the optimization of the production wells, i.e. development and implementation of horizontal and multilateral drilling.
Figure 4.18: Development of a gas in a tight reservoir using artifi cial fracture systems, so-called fracs (changed in accordance with Mobil Erdgas-Erdöl GmbH).

NATURAL GAS
92 Energy Resources 2009
Development of gas fi elds and production of natural gas from tight deposits requires sig-nifi cantly more capital and technical development than for conventional deposits (Moritis, 2008). Only suffi ciently high production rates render the exceptional capital expenditure economical (Kuuskraa et al., 2007). Currently each successfull well targeting natural gas from tight sandstone reservoirs makes approximately 28.8 million m³ reserves accessible for production.
Unconventional gas in tight deposits have been proven worldwide, important accumulations exist in North America, South and Central America (Mexico, Venezuela, Argentine), Africa (Egypt, Nigeria), Saudi Arabia, Australia, Europe (Germany, France, Netherlands, Great Britain), the CIS, China and India (Wylie et al., 2007; Holditch et al. 2007). Due to lack of suffi cient geological information as well as great technical and economic challenges natural gas from tight reservoirs is produced only in a few countries. Unconventional deposits are explored and produced systematically mainly in the US. The dynamic development as well as the great uncertainties in terms of these natural gas resources has be demonstrated in the US.
In the US, the annual production of natural gas from unconventional deposits increased from 140 Bcm in 1996 to 244 Bcm in 2006. This is a share of 43 % on the total US natural gas production (Kuuskraa, 2007a). The production from tight sandstones contributed most to these added production; it increased from 102 Bcm in 1996 to 161 Bcm in 2006. About 13 000 wells were drilled per year. The production of gas from tight mudstone (e.g. shallow and shale gas) is at a lower level, but has more than tripled during the same period from 8.5 Bcm to 31 Bcm (Kuuskraa, 2007a). A further increase of the annual production from unconventional gas reservoirs to 250 Bcm per year until 2015 and 288 Bcm until 2030 has been forecasted (EIA, 2007) for the US. These numbers are considered conservative, as previous forecasts concerning the production of gas from unconventional gas fi elds have been too low in the past (Reeves et al., 2007b). The proportion of the US gas production from unconventional deposits will thus rise in all likelihood from 60 to 70 % of the total production until 2020 (Moritis, 2008).
The assessment of recoverable reserves from tight reservoirs contains large uncertainties due to the particular characteristics of these occurrences, which can be demonstrated at the deep gas deposit Williams Fork, Mesaverde, USA (Kuuskraa, 2007b). Even small differ-ences in the assumptions the analyses were based on, e.g. distance between boreholes, success rate and total potential of the gas fi eld, resulted in large differences regarding the amount of recoverable gas, which varied by more than one order of magnitude. For in-stance the US Geological Survey (2003, in Kuuskraa, 2007b) estimated the reserves to be 87.8 Bcm, whereas the consulting company Advanced Resources International (Airlington, USA) estimated 1203 Bcm economically recoverable reserves. Similar uncertainties apply to shale gas. Improvements in hydrocarbon exploration and production technology such as horizontal drilling, production stimulation and tighter drill networks resulted in an increase of the estimated extractable reserves of the Barnett Shales in Texas, USA, from 85 Bcm in 1996 to 736 up to 1388 Bcm in 2006 (Kuuskraa, 2007b).
The proven reserves of shale gas in the US have been assessed to be about 99 Bcm in 1998 and are estimated to be 425 Bcm today. Comparably, the proven tight gas reserves have also been re-evaluated from 1036 Bcm to 2265 Bcm (Snow, 2008).

NATURAL GAS
93Energy Resources 2009
The CIS, North America and Central Asia/China certainly have the largest potential for un-conventional gas resources, but except for the US there are few authoritative assessments of resources. Thus, for instance, the resources in Canada are estimated to about 10 000 Bcm gas in-place by Reeves et al. (2007b) whereas Russum (2005) predicts up to 41 000 Bcm. Even Germany has a comparatively high potential of resources (chapter 8.2.5). According to Holditch & Chandelle (2008) the global natural gas in-place resources in dense deposits are approximately 666 Tcm. The currently largely uninvestigated shale gas accumulations account for approximately two thirds of the estimated amounts (Table 4.2).
Table 4.2: Distribution of worldwide shale gas and tight sand gas in-place resources in Tcm (Holditch & Chianelli, 2008; Kawata & Fujita, 2001; Rogner, 1997).
Region /Reservoir rock Shale Gas Tight-Sand Gas
North America 108.8 39Latin America 60.0 37Western Europe 14.4 10Central & Eastern Europe 1.1 2Former Soviet Union 17.8 26Middle East and North Africa 72.2 23Sub-Saharan Africa 7.8 22Central Asia & China 99.9 10Pacifi c (OECD) 65.5 20Other Asia Pacifi c 8.9 16Southern Asia 0 6
WORLD 456 210
Even though natural gas, in all likelihood, occurs in dense formations of all sedimentary basins, the actual resources still have to be proven by exploration. Furthermore the actual recoverability depends to a high degree on the future technological development and the economic conditions. The increasing importance of the unconventional tight gas and shale gas accumulations, in particular in countries with limited gas reserves, is refl ected in a recent European research initiative. A consortium of European research institutions, universities and the industry proposes a multi-year project for a detailed investigation of the occurrence of shale gas in Europe (Leblond, 2008). Because of the very limited knowledge concerning the incidence of recoverable natural gas from tight lithologies, the regional distribution depicted in Figure 4.19 refl ects to a high degree the state of the hydrocarbon exploration.
Figure 4.19: Regional distribution of tight sand and shale gas resources.

NATURAL GAS
94 Energy Resources 2009
Coalbed Natural Gas4.3.2
Coalbed natural gas is a superordinate term for all natural gas mixtures, which occur in conjunction with coal. This mainly refers to coalbed methane (CBM) and coalmine methane (CMM) (Tab. 4.3). CBM is the gas released from virgin coalseams, for example, by drilling. The CBM escaping due to mining from the mine immediately or later is called coalmine methane. CMM can be further subdivided in methane, which is removed from operating underground coal mines via degassing systems and mine ventilation, and in methane, which can leak from the coalseams in closed mines even after many years. Generally, the three types of gas, CBM, CMM from active mines and CMM from abandoned mines, differ in the chemical composition (Tab. 4.3).
Table 4.3: Structure of coalbed natural gas and average contents of different components of the different types of coalbed natural gas.
Coalbed Methane (CBM) Coalmine Methane (CMM)
(Methane from virgin coal-seams)
(Methane from active mines) (Methane from abandoned mines)
[Vol.-%]
CH4 90 – 95 25 – 60 60 – 80
CO2 2 – 4 1 – 6 8 – 15
CO 0 0.1 – 0.4 0
O2 0 7 – 17 0
N2 1 - 8 4 – 40 5 - 32
C2+ traces
For centuries, coalbed natural gas has been known and feared in underground coal mines as safety risk and thus as a productivity limiting factor due to its explosive nature in connection with oxygen. Still several hundred miners annually die due to coalmine methane explosions, so-called fi redamps; in particular the PR China and the Ukraine head the statistics of the fi redamp victims. As counter-measures, the mines are supplied with fresh air (aerated) and coal seams are degassed in advance (pre-mine drainage) via drillholes.
In the past decades, the coalbed natural gas from the degassing system has been increas-ingly used for energy purposes. After 1908, CMM from active mines was used in the Saarland for generating steam. In 1948, in the Hirschbach mine the fi rst degassing system was put into operation. In 1935, in Japan the fi rst power plant was supplied with 700 000 m³/a of CBM. In the US, coalbed natural gas has been used for energy purposes since 1975. Today the US account for nearly four fi fth of the global CBM production.
Coalbed natural gas can be generally expected in all coal deposits where the coal has reached or surpassed the maturity of the bituminous coal of 0.7 % vitrinite refl ectance (Chapter 2.3.3). From this phase onwards, large amounts of methane are being generated in the coal due to thermal processes. The subsidence history of the deposit and the current geologi-cal situation have to permit the storage of methane. The highest methane contents are to be expected in fat coal to semi-anthracite (Fig. 2.4), whereas the high coalifi cation of the anthracite may have negative effects on the gas content. Lignite deposits are not suitable for CBM production, or only in rare cases, due to the low maturity of the coal.

NATURAL GAS
95Energy Resources 2009
In principle, all countries, in which there are deposits of hard coal, possess coalbed natural gas. As production technologies progress all over the world and as energy prices fl uctuate strongly, coalbed natural gas can also become regionally economical, even if currently still in conjunction with tax incentives. In some countries, coalbed natural gas is considered part of the gas reserves and included in the production of conventional natural gas. This inhibits a clear demarcation of conventional and unconventional gas.
Information concerning coalbed methane resources exist currently only in reference to 23 countries and thus only to about one quarter of all countries possessing hard coal. The global resources of CBM in these countries amount to at least 135.5 Tcm and at most to 372.5 Tcm. The large range refl ects the still great uncertainties and different approaches in the assessment of CBM. In some cases, only extractible amounts of CBM have been consid-ered, in other cases the in-situ gas content has been used as the basis of the assessment. In addition, the included depth horizons in the resource assessments differ.
The data concerning global reserves of coalbed methane of 1.7 up to 2.6 Tcm are based on information from only eight countries. Thus, remaining potential of coalbed meth-ane from 137.2 to 375.1 Tcm result. The small proportion of the reserves of only about 1 % referring to the total resources is based on the fact that many deposits have been in-suffi ciently investigated concerning their gas content. In addition, detailed data frequently refer only to actual mining districts. From the investigated virgin coal seams, only a frag-ment of the in-situ gas content can be extracted and even the coalmine methane released by coal mines largely leak into the atmosphere without having been used.
For a rough check of the global remaining in-place potential of coalbed natural gas (par-ticularly CBM), the total resources of hard coal specifi ed in this study of 16.4 trillion tonnes with differing typical gas contents of the coal of 3.5 and 15 m³/t were multiplied. The global remaining potential of CBM derived via this calculation are 49.2 Tcm for a gas content of 3 m³/t, in-place 82 Tcm for 5 m³/t and 246.1 Tcm for 15 m³/t. Only for a given gas content of 15 m³/t of hard coal, the calculated remaining potential of CBM are within the range re-sulting from summing up the individual specifi cations of the countries concerning remaining potential of CBM. This leads to the conclusion that the CBM reservoir data of many countries are based on assessments of the in-situ gas contents. In some hard coal basins, in-situ gas contents of more than 20 m³/t can actually occur. Resource calculations are, however, frequently based on only 10 to 20 % of the in-situ gas being producible.
The CIS has the greatest CBM resources of 53,8 to 157 Tcm, of which Russia and the Ukraine have a great share. For North America, at 23 to 133 Tcm, only marginally fewer resources are reported, which are nearly exclusively located in Canada and the US (Fig. 4.20). In Austral-Asia, with the third largest CBM resources (52 to 68 Tcm), the PR China and Australia have to be stated. At 7 to 13 Tcm, Europe possesses comparatively small CBM resources, which are located in particular in Germany, Poland, Turkey and Great Britain. Whereas for Africa only for South Africa at 0.1 to 0.9 Tcm of CBM resources are reported, the Middle East has no known resources.

NATURAL GAS
96 Energy Resources 2009
Figure 4.20: CBM resources in 2007: Minimum and maximum values for the top ten countries.
According to current knowledge, CBM reserves are attributed at about 74 %, correspond-ing to 1.6 Tcm, to North America, followed by Austral-Asia at about 0.4 Tcm and Europe at 0.4 Tcm. Amongst the countries with the greatest CBM reserves number Canada with 0.5 to 1.4 Tcm, the USA with 0.6 Tcm, Australia with 0.3 Tcm as well as the PR China and Poland with 0.1 Tcm each (Fig. 4.21).
Figure 4.21: CBM reserves by countries in 2007. The percentages refer to CBM reserves of 2.15 Tcm. This value results from the inclusion of the mean value of the Canadian CBM reserves of 963 Tcm.
Drillholes can be driven in the virgin coal seams for development and production of coalbed methane (Fig. 4.22). In these drillholes, the individual target horizons are hy-draulically stimulated through fracturing using highly pressurized drilling liquid. The cracks developing in the target horizons considerably improve the infl ux rates of the CBM. After drying of the produced CBM it is either routed directly into a gas engine for combustion or fed into a gas pipeline. The USA have the globally highest CBM-production, where up to now more than 60 000 CBM-wells have been drilled (IEA, 2009).

NATURAL GAS
97Energy Resources 2009
Shallow Gas - Hazard or Potential Resource?
The term Shallow Gas denotes natural gas occurrences in a depth of down to approximately 1000 m. Methane is usually the main component; its origin may be microbial as well as ther-mogenic (Chapter 2.1). Shallow gas occurs worldwide, onshore as well as offshore. The poten-tial of its use is limited, in particular because many of these occurrences occur only in young, slightly compacted rocks. Together with the natural gas and formation water also signifi cant amounts of fi ne-grained sediment are produced. Up to now, the distribution of shallow gas was of interest, less because of its commercial value but mainly because of its hazard factor for deep-sea projects, construction projects and drilling projects. In addition, shallow gas can be used as an indicator when prospecting deeper deposits.
Occurrences of shallow gas are known in particular from seismic survey investigations (seismic refl ection) of the underground in course of the petroleum and natural gas exploration. Seismic refl ection data can provide direct indication about hydrocarbon enrichment in two ways: 1) If the gas is distributed randomly in the sediment, because it rises chimney-like from deeper layers, for instance, this results in characteristic, diffuse seismic images of the subsurface. 2) If the gas collects under a seal, the upper or lower contact surface of the occurrence has anomalous refl ection properties. These anomalies are frequently exactly defi ned laterally and form an acoustically noticeable area, called bright spot. Such fi ndings can have causes other than natural gas occurrences and high gas contents do not necessarily show in seismic data. Bright spots thus do not constitute clear evidence of gaseous components of the pore fi ll. Their further evaluation requires drillhole measurements, chemical analyses of drill samples or the in-depth investigation of the refl ection behavior. Still, the detection and classifi cation of bright spots is an important method for the improved evaluation of the incidence of natural gas in a region, in particular for shallow occurrences.
In Germany, shallow gas occurrences are known from the North Sea. These are currently being investigated by the BGR using seismic refl ection and geochemical methods. The seismic profi le depicted by the BGR from the area of the German North Sea shows an identifi ed bright spot, which presumably constitutes an enrichment of shallow natural gas.

NATURAL GAS
98 Energy Resources 2009
Figure 4.22: Production steps for CBM production.
The development of coalmine methane (CMM) from abandoned coal mines is different from CBM. As CMM from abandoned coal mines is only slightly pressurized, it is extracted through a drillhole or an existing shaft. Countries with many abandoned hard coal mines, such as Germany and Great Britain, are predestined for CMM production.
The CMM production from active mines is frequently done primarily for safety reasons for the prevention of fi redamp. The pre-mine drainage of the coal seams and the correspond-ing mining areas is conducted in most cases through underground drillholes. These largely horizontal drillholes are either drilled directly in the coal seams or in horizons located either immediately above or below.
The total global coalbed natural gas production amounted to 63.3 Bcm in 2007. This already corresponds to a proportion of 2.1 % of the global natural gas production. This way, the global coalbed natural gas production was increased by about 50 % in comparison to 2001 at 42.3 Bcm (BGR, 2003) and nearly tripled as compared to 1997 at then 23 Bcm (Bibler et al., 1998). This trend demonstrates the rapid development of the production of coalbed natural gas (primarily CBM) in the past years, in particular in some industrial countries. The production of large amounts of coalbed natural gas takes place in countries where in par-ticular CBM is produced. Currently these are the USA, Canada, Australia and the PR China, which together produced 96.3 % of the global coalbed natural gas production in 2007. The USA dominate the global coalbed gas production with a production proportion of 78.5 % (Fig. 4.23), followed by Canada at 11.6 %, Australia at 3.9 % and the PR China at 2.2 %. All other countries, such as the Ukraine, Germany, Great Britain, Poland, Russia, the Czech Republic and Kazakhstan, possess with an annual production of less than 1 Bcm of coalbed natural gas a production share of less than 1 % (Fig. 4.23).
In future, the CBM production will increase signifi cantly, primarily in the PR China, Canada and Australia. In the US, where about half of the production originates in the San-Juan Basin, the relative growth between 2002 and 2007 was about 9 % at an already high production level (EIA, 2009). The Canadian CBM production, showing signifi cant increases only since 2002 (ERCB, 2008), is in comparison to its neighbor, the US, still in its infancy (EPA, 2009). More than 90 % of Canadian CBM production originate in the Province Alberta, where in 2007 altogether 9339 CBM wells were being operated. The Energy Resources Conservation Board (ERCB) estimated that the CBM production in Alberta will approximately triple by 2017 in comparison to 2007 (ERCB, 2008). The Chinese CBM production will also expand

NATURAL GAS
99Energy Resources 2009
considerably in the coming years. In 1995, the China United CBM Corporation was founded for this particular purpose. Thus, the plans for the Chinese CBM extraction envisage a production of 10 Bcm for the year 2010, which is to be expanded to 40 Bcm by 2020. For transporting CBM, the construction of dedicated pipelines and CBM liquefaction plants are being planned (Qiu, 2009).
In Australia, the CBM production quadrupled between 2002 and 2007 and by now has a proportion of 7 % of the Australian natural gas production. 95 % of the Australian CBM production originates in the state Queensland. The remaining 5 % are produced in the state New South Wales. In view of eight further current CBM projects and fi ve planned liquefaction plants in Queensland, it can be assumed that the Australian CBM production will increase further (ABARE, 2009). With exception of the Ukraine, the exploration and the use of CBM has only a secondary priority in the countries of the CIS, as there are large conventional deposits of conventional natural gas. In Germany, CMM is used for power/combined heat and power generation in regionally important small power plants (Chapter 8.2.5).
Natural Gas in Aquifers – Renaissance with Geothermal 4.3.3 Energy?
Gas dissolved in ground water is called natural gas in aquifers or aquifer gas. Nearly all porous rocks underneath the groundwater level contain small amounts of methane gas (Marsden, 1993). Due to the limited solubility of methane in water, concentrations in the ground water are generally low. The solubility of methane as the main component of natural gas increases with increasing depth and thus with rising pressure, i.e. considerable amounts of dissolved gas can occur in deeper groundwater horizons. At normal pressure of the ground water (hydrostatic pressure), the solubility of methane can increase to more than 5 m³/m³ (Fig. 4.24). In areas with high pressure (maximum lithostatic pressure), more than 10 m³/m³ can be dissolved. From zones of high tectonic tensions even gas contents of up to 90 m³/m³ are known.
Figure 4.23: CBM production (total 63.3 Bcm) in 2007: top ten countries.

NATURAL GAS
100 Energy Resources 2009
Figure 4.24: Solubility of methane in ground water as a function of the depth calculated in accordance with Battino (1984) and Haas (1978).
In comparison with other unconventional gas resources, aquifer gas is currently of very low economic interest. The hydrocarbon industry presently does not explore on aquifer gas. To be able to use even a part of the potential, currently processes are being discussed, that have been developed years ago, but were not pursued because of the low-cost and readily available conventional natural gas. Gas occurrences in hot, highly overpressured aquifers are considered economically producible. However, it is only the combination of different energy systems which may allow the start of an economic usage of natural gas from aquifers.
In contrast to the gas production of all conventional and unconventional natural gas deposits, the ground water has to be extracted as well, to be able to extract the natural gas dissolved in the water. The expenditure required for this purpose is generally disproportionate to the attainable energy gain from the natural gas. Even in areas with existing infrastructure and for globally high gas prices, this approach will remain uneconomical. Only when the hydraulic and the geothermal energy of the ground water can be used suffi ciently besides the chemical energy of the natural gas, an economic use in a hybrid power plant can be imagined (Fig. 4.25). Suitable prerequisites are present in geothermal aquifers at high pressure, so-called geopressured-geothermal aquifers. In exceptional cases, also other substances dissolved in the ground water such as iodine can render the economical use of natural gas.

NATURAL GAS
101Energy Resources 2009
Figure 4.25: Schematic chart of a hybrid power plant for the use of three energies extractible from geopressured-geothermal aquifers: hydraulic energy, geothermal energy and chemical energy (Aquifer Gas).
Hot ground water occurrences, which are highly overpressured in comparison to their depth, are called geopressured-geothermal aquifers. Typically, such occurrences can be found in the earth’s crust in depths between 3000 and 7000 m (Dickson & Fanelli, 2004). Due to the high pressure, the water behaves artesian and fl ows to the earth’s surface solely because of the pressure difference.
Up to approximately 60 areas with prospective geopressured-geothermal aquifers are known in the world. Their total gas content has been estimated to be 2500 Tcm (Perrodon et al., 1998). The potential of the region at the northern Gulf of Mexico has been investigated exceptionally well. There the subsurface conditions are known very well because of the thousands of existing wells and the intensive geophysical exploration of conventional de-posits. As early as in the 1970s, the amount of gas contained in aquifers there had been estimated to be 650 to 1700 Tcm (Papadopulos et al., 1975; Wallace et al., 1979). According to current estimates, this potential would remain to be uneconomical without the simulta-neous usage of the geothermal energy, which is twice as large (Massachusetts Institute of Technology, 2006).
The development of technologies for the exploitation of the geopressured-geothermal aq-uifers was promoted in the frame of research programs of the U.S. Department of Energy between 1979 and 1990. After extensive long-term studies, a 1 MW hybrid test power plant at the well Pleasant Bayou (Texas) was put in operation in 1989. Half its energy was derived from hot water and the other half from dissolved natural gas (Campbell and Hatter, 1991). Even though the power plant was operated less than a year and it was impossible to use the hydraulic energy of the water, the technical feasibility was successfully proved

NATURAL GAS
102 Energy Resources 2009
(ARCORE, 2007). Because of the comparatively low prices for petroleum and natural gas at that time the project remained uneconomical, however.
Conventional methods for the production of hydrocarbons from petroleum and natural gas wells are aimed at producing as little water as possible using suitable regulation as it is an unwanted by-product. If the water content is too high, this usually signifi es the end of pro-duction. In contrast, for geopressured-geothermal aquifers maximal fl ow rates of water are required to attain profi tability. Additional factors, such as the total volume of the occurrence and the amounts of gas contained, porosity and permeability or the depth infl uence profi t-ability in the same way as for conventional occurrences of natural gas. The salinity of the water is of special importance, as for increasing salt contents the solubility of the methane decreases. This and further parameters were modeled in a study based on an example of selected occurrences in the northern Gulf of Mexico in view of an economic exploitation of geopressured-geothermal aquifers (Griggs, 2005). According to this study, several loca-tions had already been identifi ed at the time of the publication of the study, which could be considered promising deposits, provided power and gas prices are suitable. Suffi ciently high gas contents are decisive for the economic success, as their potential of added value cannot be balanced by a greater geothermal potential (Griggs, 2005).
In particular, the US occurrences in the region of the Gulf of Mexico could be the most promising places for starting the commercial production of aquifer gas. Other countries, such as Russia, do not pursue strategies for producing aquifer gas. In Italy, the production of natural gas from shallow aquifers was stopped in 1962 (Bonham, 1979) because of mas-sive land subsidences. In Japan, there has been a successful production of aquifer gas for many years. The annual production of 500 million m³ is only economical as by-product of the iodine extraction from the produced brine. In Germany, the exploitation of the energy potential of geopressured-geothermal aquifers has been tested exemplarily in the summer of 1982 at the thermal water deposit in Bad Endorf. The calculated power for an estimated operating period of fi ve years was nearly 1 MW, with natural gas and thermal water con-tributing half each (von Hantelmann et al., 1983). Until today, this thermal water deposit has been exclusively used for balneological purposes.
The gas volumes dissolved globally in the ground water are immense and exceed the known conventional natural gas occurrences several times over. The total amount of aquifer gas dissolved in the ground water of the Earth has been estimated as the enormous amount of 10 000 000 Tcm (Kortsenshtejn, 1979) and would take up approximately twice the vol-ume of the Earth’s atmosphere at normal pressure. Similar to the natural gas contained in gas hydrate, only a very small amount will be technically producible and an even smaller proportion will be economically extractible. Still aquifer gas has a potential that should not be underestimated, in particular if improved technologies facilitate the extraction of the dissolved natural gas.
Future innovations for developing the use of aquifer gas are to be expected from the pe-troleum and natural gas industries as well as from the geothermal sector. The motivation of the hydrocarbon industry is mainly aimed at using their already existing infrastructure for producing oleaginous and gaseous thermal waters beyond the end of the conventional production. From the perspective of the geothermal energy, the additional usage of the

NATURAL GAS
103Energy Resources 2009
methane constitutes a possibly decisive economic incentive. In case of a continuing increase of the prices for conventional natural gas, the use of aquifer gas as a component in a hybrid energy system might be experiencing a comeback.
Gas Hydrate – the “Frozen Natural Gas”4.3.4
Natural gas hydrate is natural gas bonded in ice and was fi rst discovered at the end of the 1960s. Water and gas can form a crystalline substance similar to ice at high pressures and low temperatures, which is called gas hydrate. The water molecules form a cage-like crys-tal structure (Clathrate), which might incorporate gas molecules, such as methane, but as minor components also other hydrocarbons (ethane, propane, butane) as well as carbon dioxide and hydrogen sulfi de. Due to this special structure, one cubic meter of gas hydrate can contain 164 cubic meters of methane. As natural gas hydrate contains mainly methane, it is also called methane hydrate.
By now, occurrences of gas hydrates are known all over the world, they are, however, generally hard to reach due to their special bonding conditions at low temperatures and high pressure. The stability fi eld of gas hydrate according to pressure and temperature conditions can be reached in marine sediments in deep water or in permafrost areas of the Arctic (continental gas hydrate) (Fig. 4.26). Marine occurrences of gas hydrate are limited to conditions defi ned by water depths deeper than approximately 400 m and low water temperatures at the sea bottom (Fig. 4.26). Because of the natural increase in temperature with increasing sediment depth, the gas hydrate stability zone can only exist in depths of down to approximately 1000 m under the seabed. Continental gas hydrate is bound to the incidence of permafrost and can occur in depths between approximately 200 m and 2000 m due to the low temperatures (Fig. 4.26).
Figure 4.26: Occurrences of gas hydrate: offshore (on the left) and in permafrost areas (on the right). Small diagram: gas hydrate is stable at low temperatures and high pressure.

NATURAL GAS
104 Energy Resources 2009
The formation of gas hydrate depends on four basic factors: high pressure, low tempera-tures, suffi cient availability of methane and the existence of water. If only one of these requirements is not fulfi lled, gas hydrate cannot form. Whereas water is usually present in suffi cient amounts, the supply of methane is frequently a limiting factor.
In contrast to conventional deposits of natural gas with an area of free natural gas called gas cap, gas hydrate occurrences are not well defi ned; the gas hydrate is distributed erratically. In principle, an assessment of a reservoir is thus more diffi cult and entails data on possibly producible amounts of natural gas from gas hydrate being rather uncertain.
Important criteria for the classifi cation of a deposit are, besides the total potential, in par-ticular the reservoir properties, such as the distribution of the gas hydrate, the permeability of the reservoir rock and whether the gas hydrate is underlain by free natural gas.
The total amount of gas bound in gas hydrate is immense in spite of great uncertainties of the assessments and exceeds the conventional amounts of natural gas many times over. Up to today, gas hydrate has been reported from approximately 100 locations based on geophysical, geochemical or geological indicators and tested at 20 locations (Fig. 4.27). In spite of the continuously improving basis of information on the incidence of gas hydrate oc-currences, the data on the amounts of natural gas stored as gas hydrate vary considerably. Current estimates range between 1000 and 120 000 Tcm of natural gas in gas hydrate. In the marine area, occurrences are assumed that surpass those in permafrost areas by two orders of magnitude (Council of Canadian Academies, 2008). In comparison to conventional natural gas, thus approximately 2 to 10 times the amount of natural gas is bound in gas hydrate (Fig. 4.28).
Figure 4.27: Proof of gas hydrate globally naming occurrences mentioned in the text.
The estimated total amounts are unimportant for an assessment of the technically and economically producible amounts of gas from occurrences of natural gas. The identifi cation and classifi cation of occurrences that are really suitable for industrial use are important for the start of production (Fig. 4.28). The chances are best for easily accessible occurrences

NATURAL GAS
105Energy Resources 2009
close to existing infrastructure such as in Northern Alaska. Also occurrences located in rock with a high permeability (Max et al., 2006) are of particular economic interest. In contrast to the rough assessment of the existing amounts in principle, the USGS published an as-sessment of the technically extractible volumes of natural gas in gas hydrate for a defi ned territory in a current study. Accordingly, for Northern Alaska an amount of natural gas of more than 2.4 Tcm has been assumed, which might be produced using today’s methods (Col-lett et al., 2008). Once commercial production has started, it can be assumed that, similar to other previously unconventional occurrences of natural gas, such as CBM, the potential will increase. It will, however, be impossible to develop a large part of the gas hydrate, in particular in marine sediments, in the long run and maybe for all times.
Figure 4.28: Resource pyramid: total natural gas potential in gas hydrate and conventional natural gas (modifi ed in accordance to Boswell & Collett, 2006).
If potential production options are discussed in connection with gas hydrate, all approaches seeming realistic are based on a scenario where the gas hydrate is ‘melted’ within the rock. The natural gas mobilized that way can be conventionally produced using production wells employing technologies already being used. Mining processes or open-cast pits seem unre-alistic, as the expected benefi t would not justify expenditure and environmental risk, and in addition the released natural gas from gas hydrate can only be collected at a great loss.
For occurrences, which are developed through wells, the technical challenge consists of establishing a continuous mobilization of the natural gas. In the course of international research and test programs in the North American Arctic, this process based on pressure drop and/or increase in temperature in the rock has been successfully tested. The chemical inhibitors used for a long time in transporting natural gas through pipelines can contribute to the reduction of the freezing point quasi in accordance with the de-icing principle for mobilizing the natural gas out of gas hydrate. As another possibility not yet tried in practice, the injection of carbon dioxide (CO2) is being discussed, to replace the methane in the gas hydrate already in the rock by CO2-gas hydrate (Moridis & Collet, 2003).
The conditions for the production of natural gas from gas hydrate are particularly attractive, if free gas exists underneath the occurrence of gas hydrate (Moridis & Collet, 2004). In all likelihood, deposits of this type can be produced using technology already known from the conventional production of natural gas. The necessary pressure reduction would be attained

NATURAL GAS
106 Energy Resources 2009
relatively easily by the production of the free natural gas. Gas from the destabilization of gas hydrate would subsequently enter the reservoir of the free gas fi eld, so that depending on the composition of the reservoir rock, the reservoir pressure might be regulated by gas extraction from the deposit. This process was probably already applied for the production of natural gas from gas hydrate in the Siberian Messoyakha Field. In the 1970s, conventional natural gas was produced there without knowledge of the existence of gas hydrate in the area of the fi eld, and the pressure in the deposit decreased accordingly. During a pause in production an unexpected increase of the pressure was observed, which was subsequently linked to the destabilization of gas hydrate.
For a specifi c production of natural gas from gas hydrate, the selection and selective ad-aptation of the production technology has to take place beyond the diffi cult determination of extent and capacity of the fi eld. In comparison to a deposit of conventional natural gas, higher expenditure is necessary for the development of gas hydrate deposits. A breakthrough at the gas hydrate production will thus in all likelihood happen where the risks of a failed attempt can be minimized. The joint project “Mount Elbert” (Northern Alaska) between the U.S. Department of Energy, BP Exploration and the U.S. Geological Survey seems to be exemplary. Based on an already existing infrastructure of the oil and gas industry, on research programs that have been ongoing for years with state support and on geologically particularly suitable gas hydrate occurrences, currently preparations for the fi rst long-term production test are under way.
The commercial production of natural gas from gas hydrate has not started yet. Countries with few occurrences of conventional energy resources or with occurrences approaching exhaustion are currently intensifying their efforts to attain a use of gas hydrate soon (Fig. 4.29). Based on positions and activities of countries and international programs selected as examples, the current state can be determined:
In the US, the Department of Energy evaluated the national gas hydrate occurrences, in particular in the permafrost regions of Alaska (Fig. 4.27) and in the Gulf of Mexico as largest hydrocarbon resource of the country. According to US estimates, the future gas consump-tion of the country could be supplied in full from these occurrences of gas hydrate. Even conservative estimates of a use of only one percent of the gas hydrate resources result in a doubling of the useable occurrences of natural gas in the US. For researching these occur-rences, which seem promising from a geological point of view, the US government issued an Interagency Roadmap for Methane Hydrate Research and Development (Department of Energy, 2006). In their approach, the U.S. government places emphasis on international and industrial research cooperation and considers itself to be the global leader in gas hydrate research (Collett, 2004; Sloan & Koh, 2008).
Japan is pursuing a very determined course in the utilization of gas hydrate. In the past fi ve years, the subsidies for gas hydrate research granted involving the Japanese govern-ment were higher than those of all other nations. The Japanese motivation for an intensive involvement in gas hydrate research can be derived being largely dependent on importing fossil energy resources. In the course of Japan’s Methane Hydrate Exploitation Program, technical developments for the exploration and extraction of marine gas hydrate occurrences in the Nankai subduction zone off the Japanese Pacifi c coast are to be promoted until 2016. The development of the Japanese gas hydrate occurrences would cover the national demand

NATURAL GAS
107Energy Resources 2009
for natural gas for a period of approximately one hundred years (Research Consortium for Methane Hydrate Resources in Japan, 2001; Takahashi and Tsuji, 2005).
Besides other industrial nations with highly developed research infrastructure, such as South Korea, there are quite a number of emerging nations and developing countries, which sup-port this kind of research aimed at exploration (Fig. 4.29). Among these also China and India target their efforts in particular at marine gas hydrate occurrences in their own exclusive economic zones as a potential domestic source of energy.
Figure 4.29: Terms of important national programs aimed at an economic extraction of natural gas from gas hydrate.
The situation is different for countries possessing suffi cient natural resources. Russia, for instance, recognized the energy supply potential of gas hydrate in the permafrost areas of Siberia early on. The fi rst offshore gas hydrate occurrences were proved by Russian scientists in the Black Sea in 1972. As Russia possesses large conventional occurrences of natural gas, there are currently, in spite of existing know-how and experience in the area of gas hydrate research, no nationally coordinated research programs aimed at their utilization. Still, even there, plans exist to develop the potential of gas hydrate, which is regarded as being im-mense, in the medium term. This idea is based on the continuous use of the infrastructure already existing for the production of gas, in particular in Siberia, once the conventional gas deposits have been exhausted.
Germany does not possess own gas hydrate occurrences, but belongs to the leading nations where offshore engineering and gas hydrate research are concerned. Thus, Germany has the potential of participating in the development of an economically sensible and ecologi-cally justifi able recovery (Info box 6) of gas hydrate (Andruleit et al., 2008).

NATURAL GAS
108 Energy Resources 2009
Possible Environmental Effects on the Use of Gas Hydrate
Gas hydrate is a natural component of the global carbon cycle. Besides the energy potential, the infl uence of the use of gas hydrate on the environment and the climate are being discussed in public most of all. Gas hydrate, as metastable occurrence of methane, can store large amounts of this natural gas for a long time in the sediment and return it to the environment. The extrac-tion of natural gas from gas hydrate affects this cycle and thus the environment.
From exploration via production up to transportation, every phase of the process of the con-ventional production of natural gas potentially affects the environment. This concerns the construction and operation of infrastructure devices (production systems, etc.), the disposal of refuse material as well as accidental escaping of natural gas (blow out) in the course of acci-dents. These potential effects on the environment are known and can be minimized by applying suitable environmental management and safety standards. When using gas hydrate the same effects as for conventional natural gas can be assumed. In addition two further hazards are being discussed: The infl uence on the special living environment in the surroundings of marine gas hydrate occurrences and the destabilization of the seabed.
Rocks bearing gas hydrate are being used by specifi cally adapted microorganisms as living en-vironment at which they meet their metabolic needs by ingesting methane from gas hydrate. The extraction of natural gas from gas hydrate would infl uence this area of the so-called deep biosphere, but the effects would remain limited to a locally limited to a small area. The special biocenoses, which are known in connection with escaping methane and gas hydrate occurrences at the seabed, are signifi cantly more susceptible than the microorganisms. A continuous supply of methane constitutes the prerequisite for the development of a special ecological system, inde-pendent of sunlight and photosynthesis. The metabolism of a consortium of protozoae provides the basis for chemoautotroph macro organisms like shells and beard worms (siboglinidae). The submarine removal of gas hydrate near the surface would have the most considerable effects on this living environment. This production technology is currently not being seriously considered for ecological and economic reasons.
A disturbance of the stability of the sea fl oor in the vicinity of production plants could result in subsidences and submarine land slides. On the one hand gas hydrate in marine deposits strengthens the loose rock and thus contributes to stabilization. On the other hand gas hydrate hampers processes of compaction and cementation that would proceed otherwise, because it takes up room in the pore space. Thus marine sediments can be stabilized nearly exclusively by gas hydrate. If the gas hydrate is broken down by technical measures for producing natural gas, the stability of the rock can be reduced to such an extent that submarine landslides can be triggered and natural gas can ac-cidentally escape at the sea-bed. Such a mechanism is also known as a natural process, initiated by variations in the sea level during ice ages, and is being discussed as a cause for known, widespread slid-ing events in later history of the earth. In comparison the hazard potential of slides due to the technical destabilization and the release of methane would remain limited to the limited location of the produc-tion area (Archer, 2006).

NATURAL GAS
109Energy Resources 2009
References on Natural Gas4.4
ABARE (Australian Bureau of Agricultural and Resource Economics) (2009): Energy in Aus-tralia 2009. – 93 p.; Canberra. http://www.abare.gov.au/publications_html/energy/energy_09/auEnergy09.pdf.
ACORE (American Council On Renewable Energy) (2007): The Outlook on Renewable Energy In America. http://www.acore.org.
Andruleit, H., Bönnemann, C., Cramer, B., Müller, C. (2008): Gashydrat: das “gefrorene Erdgas” – ein fossiler Energieträger am Beginn seiner Nutzung. Commodity Top News, 28: 8 p., BGR Hannover.
Archer, D. (2006): Destabilization of methane hydrates: a risk analysis. Report on behalf of: Wissenschaftlicher Beirat der Bundesregierung Globale Umweltveränderungen, http://wbgu.de/wbgu_sn2006_ex01.pdf.
Battino, R. (1984): The solubility of methane in water between 298 and 627 K at a total pressure between 0.5 and 200 MPa. Methane. Clever, H.L. and Young, C.L. Pergamon Press. 27/28: 24-44.
BGR (Bundesanstalt für Geowissenschaften und Rohstoffe) (2003): Reserven, Ressourcen und Verfügbarkeit von Energierohstoffen 2002. Rohstoffwirtschaftliche Länderstudien XXVII – 426 p.; Hannover.
Bibler, C.J., Marshall, J.S. & Pilcher, R.C. (1998): Status of worldwide coal mine methane emissions and use.-International Journal of Coal Geology,35: 283-310; Amsterdam.
Bittkow, P. & Rempel, H. (2008): Edelenergie Erdgas- Der Europäische Markt und die zukünftige Rolle Russlands (1). Erdöl Erdgas Kohle 124, 11: 444-452.
– (2009): Edelenergie Erdgas- Der Europäische Markt und die zukünftige Rolle Russlands (2). Erdöl Erdgas Kohle 125, 1: 11-19.
Bonham, L. C. (1979). Gas in subsurface waters. UNITAR Conference on long-term energy resources, Montreal, Canada.
Boswell, R., & Collett, T. (2006): The gas hydrates resource pyramid. DOE-NETL Newslet-ter “Fire in the Ice”, Fall 2006, p.5. http://www.netl.doe.gov/technologies/oil-gas/publications/Hydrates/Newsletter/HMNewsFall06.pdf#page=5.
BP (2008): BP statistical review of world energy, June 2008: 43 p., London. Campbell, R.G., and Hatter, M.M. (1991): Design and operation of a geopressured-geo-
thermal hybrid cycle power plant: Final report vol. I, 180 p. and vol. II, 172; Eaton Operating Company, Inc. and United States Department of Energy, The Ben Holt Co., DOE contract DE-ACO7-85ID12578.
Collett, T.S. (2004): Gas Hydrates as a Future Energy Resource. http://www.geotimes.org/nov04/feature_futurehydrates.html.
Collett, T.S., Agena, W.F., Lee, M.W., Zyrianova, M.V., Bird, K.J., Charpentier, T.C., House-knect, D.W., Klett, T.R., Pollastro, R.M., and Schenk, C.J. (2008): Assessment of gas hydrate resources on the North Slope, Alaska, 2008: U.S. Geological Survey Fact Sheet 2008-3073, 4 p.
Council of Canadian Academies (2008): Energy From Gas Hydrates: Assessing the Op-portunities & Challenges for Canada. http://www.scienceadvice.ca/documents/(2008_07_07)_GH_Report_in_Focus.pdf.
Cox, P. (2006): The rise of offshore LNG tech nology. Offshore Engineer. H. 9, p. 83-90.Darley, J. (2006): High noon for natural gas: the new energy crisia. 266 p.; Chelsea Green
Publishing Company, Vermont.

NATURAL GAS
110 Energy Resources 2009
Department of Energy (2006): An Interagency Roadmap for Methane Hydrate Research and Development. http://www.netl.doe.gov/technologies/oil-gas/FutureSupply/Methane-Hydrates/maincontent.htm.
Dickson, M.H. and Fanelli, M. (2004): What is Geothermal Energy? International Geothermal Association, http://iga.igg.cnr.it/documenti/geo/Geothermal%20Energy.en.pdf.
EIA (Energy Information Administration) (2007): Annual Energy Outlook 2007. Department of Energy, http://www.eia.doe.gov/oiaf/aeo/.
(2008): International Energy Statistics, Department of Energy: (http://tonto.eia.doe.gov/cfapps/ipdbproject/IEDIndex3.cfm?tid=3&pid=3&aid=6).
(2009): Coalbed Methane Proved Reserves and Production. http://tonto.eia.doe.gov/dnav/ng/ng_enr_cbm_a_EPG0_r52_Bcf_a.htm.
EPA (U. S. Environmental Protection Agency) (2009): Global Overview of CMM Opportunities. -260 S.; http://www.methanetomarkets.org/resources/coalmines/docs/overviewfull.pdf.
ERCB (Energy Resources Conservation Board) (2008): Alberta´s Energy Reserves 2007 and Supply/Demand Outlook 2008-2017. – 226 p; http://www.ercb.ca/docs/products/STs/st98-2008.pdf.
Griggs, J. (2005): A Reevaluation of Geopressured-Geothermal Aquifers as an Energy Source. Proceedings, Thirtieth Workshop on Geothermal Reservoir Engineering Stan-ford University, Stanford, California, January 31-February 2, 2005.
Haas, J.L.J. (1978). An empirical equation with tables of smoothed solubilities of methane in water and aqueous sodium chloride solutions up to 25 weight percent, 360 °C, and 138 MPa. Reston, Virginia, U.S. Geological Survey.
Hantelmann, von, G., Pavlik, N., Mueller, A. (1983): Geopressured Aquifers. Nutzung des Energiepotentials der Thermalwasserlagerstaette Endorf. Forschungsbericht - Bun-desministerium für Forschung und Technologie, T, Technologische Forschung und Ent-wicklung; 83-245.
Holditch, R. R. & Chianelli, R. R. (2008): Factors That Will Infl uence Oil and Gas Supply and Demand in the 21st Century. – MRS Bulletin, 33, 317-323.
Holditch, S. A., Ayers, W. B., Bickley, J. A., Blasingame, T.A., Hoefner, M., Jochen, V. A., Lee, W. J., McVay, D. A., Peryy, K. F., Sharma, M. M. & Torres-Verdin, C. (2007): Unconven-tional Gas. – Working Document of the National Petroleum Council Global Oil & Gas Study http://www.npc.org/Study_Topic_Papers/29-TTG-Unconventional-Gas.pdf.
IEA (2004): World Energy Outlook 2004. 570 p; Paris.– (2005): Resources to Reserves: Oil & Gas Technologies for the Energy Markets of the
Future. – 124 p, Paris.– (2006): World Energy Outlook 2006. 596 p; Paris.– (2009): Cleaner Coal in China. – 360 p; Paris.Ivanhoe, L. F. & Leckie, G. G. (1993): Global Oil, Gas Fields, Sizes Tallied, Analyzed.- Oil
and Gas Journal: p. 87-91, Febr. 15th.Kawata,Y. & Fujita, K. (2001): Some Predictions of Possible Unconventional Hydrocarbon
Availability Until 2100. - SPE 68755 presented at the SPE Asia Pacifi c Oil and Gas Conference, Jakarta, Indonesia, (April 17–19, 2001).
Klett, T.R., Gautier, D.L. & Ahlbrandt, T.S. (2005): An evaluation of the U.S. Geological Sur-vey World Petroleum Assessment 2000. AAPG Bull. 89: 1033-1042.
Kortsenshtejn, V. N. (1979): “An estimate of global reserves of gas in the subsurface hydro-sphere.” Doklady Akademii Nauk SSSR 235: 223-224.

NATURAL GAS
111Energy Resources 2009
Kuuskraa, V. A. (2007a): Unconventional Gas-1: Reserves, production grew greatly during last decade. – Oil and Gas Journal 105/33, September 03, 2007, 33-36, 38-39.
– (2007b): Unconventional Gas-2: Resource potential estimates likely to change. – Oil and Gas Journal 105/35, September 17, 2007, 64, 66-71.
Kuuskraa, V. A., Riestenberg, D. & Ferguson, R. (2007): Unconventional GAS-3: New plays, prospects, resources continue to emerge. – Oil and Gas Journal 105/36, September 24, 2007, 48-55.
Leblond, D. (2008): Institutes to map European gas shale sites. – Oil and Gas Journal, September 09, 2008, http://orc.pennnet.com/news/news_display.cfm?Section=NEWS&ArticleID=348244.
Marsden, S. (1993): A survey of natural gas dissolved in brine. The future of energy gases. D. G. Howell. 1570: 471-492.
Massachusetts Institute of Technology (2006): The Future of Geothermal Energy: Impact of Enhanced Geothermal Systems (EGS) on the United States in the 21st Century http://www1.eere.energy.gov/geothermal/future_geothermal.html.
Max, M.D., Johnson, A.H. & Dillon, W.P. (2006): Economic Geology of Natural Gas Hydrate. Springer-Verlag, 374 p.
Moridis, G.J. & Collet, T. (2003): Strategies for gas production from hydrate accumulations under various geological and reservoir conditions. Report LBNL-52568, Lawrence Ber-keley National Lab., Berkeley, 1-49.
Moridis, G.J. & Collet, T. (2004): Gas Production from Class 1 Hydrate Accumulations. In: Recent Advances in the Study of Gas Hydrates, Taylor, C. & Qwan, J., (Hrsg.), Kluwer Academic/Plenum Publishers (Section I, Chapter 6), 75-88.
Moritis, G. (2008): SPE: Industry continues tapping unconventional resource potential. – Oil and Gas Journal September 22 (104/8), 2008, http://www.ogj.com/articles/save_screen.cfm?ARTICLE_ID=340310.
OGJ (Oil & Gas Journal) (2007): Worldwide look at reserves and production. 105, 48: 24-25.
OPEC (Organization of the Petroleum Exporting Countries) (2008): Annual Statistical Bul-letin 2007. Vienna. 136 p.
Papadopulos, S.S., Wallace, R.H., Jr., Wesselman, J.B., and Taylor, R.E. (1975): Assessment of onshore geopressured-geothermal resources in the northern Gulf of Mexico basin. In: White, D .E. and Williams, D.L., (Eds.) Assessment of geothermal resources of the United States - 1975 : U.S . Geological Survey Circular 726. Reston, VA: 125-146.
Perrodon, A., Laherrere, J. H. & C.J. Campbell (1998). “The world’s non-conventional oil and gas.” Petroleum Economist 3: 24-110.
Qiu, H. (2009): Coalbed Methane Exploration in China. Search and Discovery Article #80038 (2009). http://www.searchanddiscovery.net/documents/2009/80038qiu/ndx_qiu.pdf.
Reeves, S., Koperna, G. & Kuuskraa, V. A. (2007a): Unconventional Gas-4: Technology, effi ciencies keys to resource expansion. – Oil and Gas Journal 105/37, October 1, 2007, 46-51.
Reeves, S., Godec, M. & Kuuskraa, V. A. (2007b): Unconventional Gas-Conclusion: Outlook sees resource growth during next decade. – Oil and Gas Journal 105/43, November 19, 2007, 47-57.
Research Consortium for Methane Hydrate Resources in Japan (2001): Japan’s Methane Hy-drate Exploitation Program. http://www.mh21japan.gr.jp/english/mh21/02keii.html.

NATURAL GAS
112 Energy Resources 2009
Rogner, H.-H. (1997): An Assessment of World Hydrocarbon Resources. – Annual Review of Energy and Environment, 22, 217-262.
Russum, D. (2005): Status of Unconventional Gas in North America. – Canadian Society for Unconventional Gas / Petroleum Technology Alliance Canada 7th Annual Unconventional Gas Symposium.
Sahling, H., Rickert, D., Lee, R. W., Linke, P. & Suess, E. (2002): Macrofaunal community structure and sulfi de fl ux at gas hydrate deposits from the Cascadia convergent mar-gin, NE Pacifi c. Marine Ecology Progress Series 231, 121-138.
Schwimmbeck, R.G. (2008): LNG and Pipeline. Vortrag auf der 3rd Pipeline Technology Con-ference – 2008, Hannover.
Sloan, E.D. & Koh, C.A. (2008): Clathrate Hydrates of Natural Gases – Third Edition. CRC Press, Taylor & Francis Group, 721 p.
Snow, N. (2008): Study: US unconventional gas resources underestimated. – Oil and Gas Journal 106/29, August 04, 2008, 30.
Steinmann, K. (1999): Erdgas Transport und Verteilung - Gegenwart und Zukunft. Erdöl Erdgas Kohle 115: 517-520.
Takahashi, H. & Tsuji, Y. (2005): Japan explores for hydrates in the Nankai Trough. Oil & Gas Journal 103, 48-53.
USGS (U. S. Geological Survey) (2000): World Petroleum Assessment 2000 - Description and Results. USGS Digital Data series DDS-60.
– (2006): USGS Fact Sheet 2006-331.– (2008): Circum-Arctic Resource Appraisal: Estimates of Undiscovered Oil and gas
North of the Arctic Circle. USGS Fact Sheet, 2008-3049.Wallace, R.H. Jr., Kraemer, T.F., Taylor, R.E., and Wesselman, J.B. (1979): Assessment of
geopressured-geothermal resources in the northern Gulf of Mexico basin. In: Muffl er, L.J. P., (Ed.) Assessment of geothermal resources of the United States - 1978: U.S. Geological Survey Circular 790. Reston, VA: 132-155.
Wylie, G., Eberhard, M. & Mullen, M. (2007): Special Report: Unconventional Gas Technology – 1: Advances in fracs and fl uid improve tight-gas production. - Oil and Gas Journal 105/47, December 17, 2007: 39-45.