energy renovation: the trump card for the new start for...
TRANSCRIPT

1
Europe today!! Europe by 2050??
Yamina SAHEB Katalin BÓDIS Sándor SZABÓ Heinz OSSENBRINK Strahil PANEV
Energy Renovation: The Trump Card for the New Start for Europe
2 0 1 5
Report EUR 26888 EN

European Commission
Joint Research Centre Institute for Energy and Transport Contact information
Yamina SAHEB Address: Joint Research Centre, Via E. Fermi 2749. Ispra 21027. Italy Email: [email protected] Tel.: +39 0332 78 5731 https://ec.europa.eu/jrc Legal Notice
This publication is a Science and Policy Report by the Joint Research Centre, the European Commission’s in-house science service. It aims to provide evidence-based scientific support to the European policy-making process. The scientific output expressed does not imply a policy position of the European Commission. Neither the European Commission nor any person acting on behalf of the Commission is responsible for the use which might be made of this publication. All images © European Union 2015, except those on the front page, which are taken from the following websites: http://en.wikipedia.org/wiki/Thermography and http://campbellthermography.com/ EUR 26888 EN ISBN 978-92-79-43603-1 (PDF) ISBN 978-92-79-43604-8 (print) ISSN 1831-9424 (online) ISSN 1018-5593 (print) doi 10.2790/39989 (online) Luxembourg: Publications Office of the European Union, 2015 © European Union, 2015 Reproduction is authorised provided the source is acknowledged.
Abstract
Energy renovation is instrumental for reaching the EU 2020 goals. It has implications for growth and jobs, energy and
climate and cohesion policies. Renovating existing buildings is a 'win-win' option for the EU economy.
In 2011, specialised construction activities that include renovation work and energy retrofits employed three times as many
people as energy supply to meet the needs of buildings for the same value added.
The phasing-out of inefficient buildings from the European building stock requires an EU renovation plan. To be successful,
this plan should incorporate the existing EU policy frameworks for growth and jobs, energy and climate and those related
to cohesion policies into one single framework targeting the modernisation of the overall value chain of the building
sector.
Converting Europe’s building stock from being an energy waster to being an energy producer would require a clear,
coherent and decentralised governance structure including an Energy Renovation Facilitator and a Risk Sharing Pool
cascaded at different levels of governance. Mechanisms to develop projects at scale by bundling smaller projects and to
create cluster of accredited companies specialised in energy renovation would also be needed. Utility data must be
unlocked and the cost of energy renovation made more transparent so that investment needs could be better assessed.
A regional approach prioritising less developed regions, especially those in Member States with per capita GDPs below the
EU average, is fundamental to ensuring that all EU citizens can live in comfortable homes and limiting the impact of
inefficient houses on public finances and health.

3
'I would also like to significantly enhance energy efficiency beyond the 2020 objective, notably
when it comes to buildings, and I am in favour of an ambitious, binding target to this end.
I want the European Union to lead the fight against global warming ahead of the United Nations
Paris meeting in 2015 and beyond. We owe this to future generations.'
Jean-Claude Juncker
A New Start for Europe: My Agenda for Jobs, Growth, Fairness and Democratic Change.
Political Guidelines for the next European Commission, (July 2014).

4
Table of Contents
LIST OF FIGURES, TABLES AND BOXES .............................................................................................................. 5
LIST OF ACRONYMS ......................................................................................................................................... 7
FOREWORD ..................................................................................................................................................... 8
EXECUTIVE SUMMARY ..................................................................................................................................... 9
ACKNOWLEDGEMENTS .................................................................................................................................. 12
INTRODUCTION ............................................................................................................................................. 13
CHAPTER 1: QUAND LE BATIMENT VA, TOUT VA! .......................................................................................... 14
IMPACT OF THE FINANCIAL AND ECONOMIC CRISIS ON THE BUILDING SECTOR ..................................................................... 16 ECONOMIC VALUE OF THE BUILDING SECTOR............................................................................................................... 17
Value added ................................................................................................................................................ 17 Employment ................................................................................................................................................ 21
ENERGY RENOVATION: A 'WIN-WIN' OPTION FOR THE EU ECONOMY ............................................................................... 25
CHAPTER 2: DISPARITY OF ENERGY CONSUMPTION OF THE EU BUILDING STOCK ......................................... 27
ENERGY CONSUMPTION OF THE BUILDING STOCK ......................................................................................................... 28 Energy consumption by energy carrier ........................................................................................................ 28 Energy consumption by end-use ................................................................................................................. 32
BUILDING STOCK’S DEPENDENCY ON GAS IMPORTS ....................................................................................................... 34 CONTRIBUTION OF THE BUILDING STOCK TO CLIMATE CHANGE........................................................................................ 36
CHAPTER 3: THE CHALLENGE OF COMFORTABLE HOMES ............................................................................... 38
HOUSEHOLD EXPENDITURE ON ENERGY USED FOR HOMES ............................................................................................. 41 Impact of degree of urbanisation ................................................................................................................ 41 Impact of energy prices ............................................................................................................................... 43
AFFORDABILITY OF ENERGY RENOVATION FOR EU CITIZENS ............................................................................................ 45
CHAPTER 4: THE BUMPY ROAD TO PHASING OUT INEFFICIENT BUILDINGS ................................................... 48
ENERGY RENOVATION STRATEGIES ............................................................................................................................ 50 Age profile of the building ........................................................................................................................... 53 Blueprint for phasing-out inefficient buildings ............................................................................................ 55
FINANCING ENERGY RENOVATION ............................................................................................................................. 59 TECHNOLOGICAL INNOVATION NEEDS ........................................................................................................................ 61
CONCLUSIONS ............................................................................................................................................... 63
ANNEX I: ANALYTICAL FRAMEWORK ............................................................................................................. 64
ANNEX II: MAP CATALOGUE .......................................................................................................................... 66
ANNEX III: GLOSSARY ..................................................................................................................................... 97
REFERENCES ................................................................................................................................................... 99

5
List of figures, tables and boxes List of tables Executive summary Figure ES1 Energy renovation involves combining different policy frameworks Figure ES2 Proposed governance structure for the EU energy renovation plan Chapter 1 Figure 1.1 Value chain in the building sector Figure 1.2 Contribution of other sectors to building output Figure 1.3 Building permits indices Figure 1.4 The building sector in the EU economic statistics Figure 1.5 Proportion of value added of the building sector by enterprise size Figure 1.6 Employment trend in the building sector in selected Member States Figure 1.7 Contribution of the building sector to regional employment Figure 1.8 Employment in the building sector by gender and age Figure 1.9 Value added of the building sector by sub-sectors Chapter 2 Figure 2.1 Final energy consumption per sector Figure 2.2 Buildings’ final energy consumption by energy carrier Figure 2.3 Electricity, gas and heat consumption per capita in residential buildings Figure 2.4 Residential buildings' final energy consumption by end-use Figure 2.5 Energy carrier used for heating in residential buildings Figure 2.6 Final gas consumption in buildings as a percentage of total gas consumption Figure 2.7 Origin of gas imports, by Member State Figure 2.8 The path to a decarbonised building stock Figure 2.9 Contribution of the building sector to climate change Chapter 3 Figure 3.1 Proportion of the population unable to keep their homes adequately warm in winter Figure 3.2 Proportion of the population living in a dwelling not comfortably cool in summer Figure 3.3 Impact of degree of urbanisation on households’ energy expenditures Figure 3.4 Proportion of the population with arrears on utility bills Figure 3.5 Gas prices for medium size households Figure 3.6 Electricity prices for medium size households Figure 3.7 Proportion of the population with incomes above 60 % of median equalised income,
by building type, degree of urbanisation and tenure status Figure 3.8 Proportion of the population with incomes below 60 % of median equalised income,
by building type, degree of urbanisation and tenure status Chapter 4 Figure 4.1 European Commission's institutions involved in building related policies Figure 4.2 Impact of discount rate choices on the cost-effectiveness of energy renovation Figure 4.3 Tenure status of dwellings and their construction period Figure 4.4 Average home prices in selected Member States

6
Figure 4.5 Savings potential in residential buildings by construction period Figure 4.6 Comparative analyses for nZEB and market renovation scenarios Figure 4.7 EU and EIB funds to support investments in low-carbon economy
List of tables Chapter 1 Table 1.1 Added value in the building sector (EU, 2011) Table 1.2 Added value in the building sector: 2011 ranking of the top 10 Member States Table 1.3 Employment in the building sector (EU) Table 1.4 Employment in the building sector: 2011 ranking of the top 10 Member States Table 1.5 Economic value of specialised construction activities vs. energy supply activities (EU-
28, 2011) Chapter 4 Table 4.1 Technological innovation needs per economic activity of the value chain of the
building sector List of boxes Chapter 1 Box 1.1 Classification of economic activities in the European Nomenclature of Economic
Activities of the European Community (NACE) Chapter 3 Box 3.1 What is fuel poverty? Box 3.2 Degree of urbanisation classification Box 3.3 Development in gas and electricity prices for households Chapter 4 Box 4.1 Financial and economic parameters influencing the cost-effectiveness of energy
renovation

7
List of acronyms
B2B Business to business B2C Business to consumer BIM Building Information and Management CHP Cogeneration or combined heat and power CO2 Carbon dioxide DR Discount Rate EC European Commission EE Energy Efficiency EED Energy Efficiency Directive EEEF European Energy Efficiency Fund EEFIG Energy Efficiency Financial Institutions Group EIB European Investment Bank EPBD Energy Performance Buildings Directive EU European Union EU-28 The 28 member states of the European Union FDR Financial discount rate GCG Gas Coordination Group GDP Gross Domestic Product GIS Geographic Information System ICT Information and Communications Technology IEA International Energy Agency IET Institute for Energy and Transport IRR Internal rate of return JRC Joint Research Centre kgoe Kilograms of Oil Equivalent MAC Marginal Abatement Cost Curve MEC Marginal External Cost Curve MS Member States Mtoe Millions of tonnes of oil equivalent NACE Nomenclature of Economic Activities in the European Community NPV Net present value NUTS Nomenclature of Units for Territorial Statistics nZEB nearly Zero Energy Building PBI Project Bond Initiative PBT Payback time PF4EE Project Finance for Energy Efficiency SDR Social discount rate SMEs Small and Medium Sized enterprises TES Thermal Energy Storage

8
Foreword
Much of my research has been devoted to providing analysis how to use energy in the various end-use sectors more efficiently and how to develop the means to tackle climate change. In much of the Wuppertal Institute’s work, for which I am honoured to have led for many years, the buildings sector was of singular importance, because of the challenges to find the right policy package to foster more efficient new and existing buildings globally. Technically, especially in Europe we were learning how to build high energy-performing buildings but we have still great difficulties in addressing the existing building stock. We know well the market and technical barriers that hinder the potential savings from being achieved, but we seldom see a vision for an effective way forward. This report by the Joint Research Centre is important because it tackles existing buildings in a convincing holistic manner and because it shows the importance of the renovation activities within the entire European construction industry. The report provides an important analytical foundation that we can implement the huge potentials to reduce costs and emissions in the building stock and at the same time create new jobs. This report is essential reading for a wide audience within the energy sector. It also provides important information for the economic community to appreciate the role that the buildings sector plays for economic development and for achieving broader energy and climate objectives. Such an approach should be a welcome addition to the recently announced Energy Union.
Europe is starting to show strong leadership for energy efficiency. The European Parliament has repeatedly voted for ambitious, binding targets for improved energy efficiency for many years. Both the "near zero energy" standards for new buildings and the long-term roadmap to renovate the existing building stock result from European Parliament's amendments to EU legislation. This new report by the Joint Research Centre provides a way forward that is sensible and feasible. We know how important the buildings sector is and we also know the challenges ahead of us in achieving the full potential for energy efficiency improvements. This report puts the building sector in the context of our European economy and shows that there is a way forward with a realistic renovation strategy. What this report clarifies is how important our buildings sector is to the economy. This fuels the European Parliament's battle to make energy efficiency in general, and above all renovation of buildings, recognised a key priority of the upcoming European Fund for Strategic Investments (EFSI), also known as the Juncker Plan. At least 5 of the 16 billion euros foreseen as EU guarantees under the EFSI should go to energy efficiency to trigger the right investment signal. In addition, technical assistance is of utmost importance when dealing with energy efficiency, and the Advisory Hub of the Juncker Plan should help cities and local actors to bundle small renovation projects into larger bankable ones. This is a unique opportunity to boost European economy and achieve our energy efficiency objectives.
Prof. Dr. Peter Hennicke Emeritus Professor of Economics Senior advisor at Wuppertal Institute
Claude Turmes Member of the European Parliament Rapporteur of the Energy Efficiency Directive

9
Executive summary
Energy renovation of existing buildings is a 'win-win' option for the EU economy as a whole. In 2011, over 11 million people were directly employed in the building sector - five times more than in supplying of energy (gas, electricity and heat) to buildings for the same value added. The sector was responsible for 7 % of EU GDP. Because its structure differs significantly across Member States, the impact of the financial and economic crisis on the sector has varied. In Member States where the construction of new residential buildings makes a big contribution to its economic value, the sector has lost up to 60 % of its jobs since the start of the crisis. In those where activity is more balanced between the construction of new buildings and the renovation of existing ones, the impact has been more limited. This is particularly true in Member States whose recovery measures prioritised the building sector. Specialised construction activities that include renovation work and energy retrofits account for two thirds of overall employment in the building sector. Currently available economic data do not allow us to estimate how much of this is linked to energy renovation work specifically, but the nature of the value chain in the sector suggests that the manufacturing of chemicals, metals and equipment, and professional, technical and scientific activities benefit greatly from such work. These sectors contributed over 50 % to building output in 2011. Small and medium-sized enterprises (SMEs) form the backbone of specialised construction activities related to the renovation of buildings. Energy renovation of existing buildings should therefore significantly increase the contribution of SMEs to the EU economy, especially if workers' skills are upgraded. The building stock is the largest single energy consumer in Europe. Its share of total final energy consumption was 40 % in 2012, making buildings responsible for 38 % of the EU’s total CO2
emissions. Although energy efficiency policies have reduced the final energy consumption of the residential building stock by 2.5 % since 2007, per capita energy consumption has increased, with dwellings becoming larger and households smaller in most Member States. Space heating is the main end-use in residential buildings in most EU countries; 43 % of heating needs were met with gas in 2012. To reduce heating needs and their climate impact across Europe, buildings need to be insulated, heating systems replaced by best available technologies and renewable energy solutions deployed where feasible. Energy renovation of existing buildings is instrumental for reducing energy imports which were 2.5 times higher than the EU-28 trade balance in 2013-2014. The building stock plays a major role on gas imports with 35% of which are consumed by buildings. This was equivalent to 68 % of the EU-28 total gas consumption in 2012. Energy renovation of existing buildings would limit the reliance of buildings (particularly residential ones) on the distribution of imported gas and the attendant risk of disruption. This would free up financial resources currently used for gas imports for further investment targeting growth, innovation and jobs in Europe. This is particularly true for eastern and Baltic Member States which have per capita GDPs below the EU average and which are most exposed to disruptions to gas imports from Russia.

10
Vulnerable citizens in Europe are most severely impacted by the inefficiency of the building stock and rising energy prices. More and more EU citizens face fuel poverty and arrears in paying their utility bills. In 2012, 11% of the population were unable to keep their homes warm in the winter and 19% lived in dwellings they could not keep comfortably cool in the summer. This is particularly true in Member States with per capita GDPs below the EU average, where over 30% of the population faced fuel poverty. Regionally tailored energy renovation action is needed to improve citizens' quality of life throughout the EU territory. 20% of low-income families live in rural areas in Member States with per capita GDPs below the EU average. Also, it is these countries that have the highest proportions of owner-occupiers (e.g. 97% in Romania). In some, energy accounts for almost 20 % of total household expenditure. An EU renovation plan is therefore needed to phase out inefficient buildings from the European building stock while ensuring a sustainable economic recovery of the building sector. This plan should integrate the existing EU frameworks for growth and jobs, energy and climate as well as those related to cohesion policies (Figure ES1). However, the market uptake of energy renovation will happen only if the proposed solutions are technically feasible and economically viable for all market actors.
Figure ES1 Energy renovation involves combining different policy frameworks
Key point: Energy renovation involves combining existing EU policy frameworks for growth and jobs, energy and climate as well as those for cohesion policies. Source: Adapted by the authors from 'Modernising Building Energy Codes to secure our global energy future' http://www.iea.org/publications/freepublications/publication/PolicyPathwaysModernisingBuildingEnergyCodes.pdf
An EU energy renovation plan would require a clear, coherent and decentralised governance structure with well-defined responsibilities. An energy renovation facilitator would be needed to prioritise buildings to target first and monitor progress. The prioritisation should be based on the EU 2020 targets in the areas of climate change, energy, growth, jobs and cohesion policies. Utility data should be unlocked and data on energy renovation costs made more transparent through the

11
use of open-source portals accessible to all market actors. Mechanisms to bundle properties to renovate and to build clusters of accredited energy renovation companies need to be developed. As part of the EU renovation plan, a risk-sharing pool using EU cohesion policy funds and existing national funds would be needed to finance energy renovation where citizens cannot afford it themselves. The aim is to reduce the perceived risks for those investing in energy efficiency. It could be complemented, and its impact maximised, by a shift from grants to preferential loans blending public and private funds to support energy renovation by SMEs (Figure ES2). Together with the energy renovation facilitator, the risk-sharing pool would help creating a sustainable, unsubsidised energy renovation market in Europe.
Figure ES2 Proposed governance structure for the EU energy renovation plan
Key point: A clear, coherent and decentralised governance structure is needed to design, finance and monitor the EU energy renovation plan. Source: Adapted by the authors from 'innovative market framework to enable deep renovation of existing buildings in IEA countries' http://www.iepec.org/conf-docs/conf-by-year/2013-Chicago/061a.pdf#page=1
Energy renovation will stimulate a new wave of technological innovation. To reduce the cost of deep renovation, there is a need to develop energy renovation ‘kits’ tailored to each construction period, climatic zone and building type, ‘plug-and-play’ manufactured modular components and systems fully integrated with advanced 3D surveying techniques, and innovative insulation materials. If the EU’s building stock is to be converted from being an energy waster to being an energy producer, new technologies will be needed to enable building-to-building and building-to-grid energy interaction.

12
Acknowledgements This report was prepared under the supervision and the guidance of Heinz OSSENBRINK, the head of the Renewables and Energy Efficiency Unit at the Institute for Energy and Transport (IET) of the Joint Research Centre (JRC) of the European Commission. Yamina SAHEB was the project leader and had the overall responsibility for the design, the development and the drafting of the report. Katalin BÓDIS contributed geoprocessing, spatial data analyses and GIS mapping, Sándor SZABÓ contributed financial and economic analysis, Heinz OSSENBRINK provided strategic input and Strahil PANEV data gathering and analysis. Andrea DE LUCA adapted some of the illustrations included in the report. Special thanks go to Rod JANSSEN from Energy in Demand for his guidance in the drafting process and the review of the report. Additional input was provided by other colleagues from the JRC including, Elisa BOELMAN, Jean-François DALLEMAND, Thomas HULD, Marcelo MASERA, Fabio MONFORTI-FERRARIO, Paolo ZANGHERI and Jolanta ZUBRICKAITE. The report benefited from input from many colleagues from other DGs including:
• DG Internal Market, Industry, Entrepreneurship and SMEs (GROW) with a special contribution from Antonio PAPARELLA to the chapter on the economic analysis.
• DG Energy (ENER), with guidance on the energy and the finance chapters from Tudor CONSTANTINESCU, Pirjo-Liisa KOSKIMÄKI, Paul HODSON, Stefan VERGOTE, Bogdan ATANASIU, Laurent DELEERSNYDER, Bettina DORENDORF, Roman DOUBRAVA, Vasco FERREIRA, Timothee NOEL and Paula REY GARCIA; and
• DG Regional and Urban Policy (REGIO), with valuable input from Gergana MILADINOVA, Robert PERNETTA and Maud SKARINGER on the financing section.
Manuel DUENAS from the European Investment Bank (EIB) and Peter SWEATMAN from the Energy Efficiency Financial Institutions Group (EEFIG) have also contributed with guidance on the finance section. The authors are thankful to Marilyn SMITH from World Image Edit for initial edits and to Mark OSBORNE from DG Translation (DGT) for final editing.

13
Introduction The Framework strategy for a resilient energy union with a forward-looking climate change policy (EC, 2015) sees energy-efficient buildings as one of the pillars of energy union. This report seeks to provide the European Commission with a basis for the EU energy renovation plan needed for phasing out inefficient buildings from the building stock while ensuring that the EU building industry is sustainably competitive. The report focuses on residential buildings, as they consume the highest proportion of energy. The energy renovation of residential buildings also contributes to social and territorial cohesion by providing citizens with comfortable homes all year round. The structure of the report is as follows:
• Chapter 1 sets the scene by demonstrating that an EU energy renovation plan is a ‘win-win’ option for the EU economy. It outlines how circumstances in Member States differed before and after the economic and financial crisis. It details the structure of the building sector and highlights the value added by specialised construction activities that include renovation work and energy retrofits;
• Chapter 2 presents a snapshot of the energy consumption of the EU building stock and its
impact on energy imports and climate change. It looks at the vulnerability of the building sector in each Member State to gas supply disruptions and the impact of gas imports on the EU economy;
• Chapter 3 highlights the impact of inefficient building stock on the social and territorial
cohesion of the EU. It shows how more and more citizens are facing fuel poverty as a result of low-quality buildings, higher energy prices and limited incomes. It addresses the affordability of energy renovation for citizens;
• Chapter 4 proposes a blueprint for phasing out inefficient buildings. It highlights the need for
a combined framework based on the EU strategies for growth and jobs, energy and climate, and cohesion policies. It shows that a more integrated policy and financial instruments are needed if an EU renovation plan for phasing out inefficient buildings is to be considered. The chapter concludes by providing insights into the technological innovation needed to convert the EU’s building stock from being an energy waster to being an energy producer.

14
Chapter 1: Quand le bâtiment va, tout va!1
Highlights In 2011:
• the building sector accounted for 7% of the EU GDP and almost 9% of total industry employment;
• specialised construction activities that include renovation work and energy retrofits contributed 66 % of the value added of the building sector and 68 % of its employment;
• enterprises with less than 50 employees generated 72 % of the sector’s value added, while those with over 250 generated 14 %;
• enterprises with less than 50 employees contributed 79 % of jobs in the sector;
• specialised construction activities that include renovation work and energy retrofits employed three times more people than those supplying of energy to buildings for the same value added.
This chapter describes the economic role of the building sector, with a particular focus on its contribution to EU GDP and employment. It starts with some insights into the impact of the financial and economic crisis on the sector across the Member States. It then examines the economic value of the sector in selected Member States. It concludes by highlighting the prominent economic role of specialised construction activities that include renovation work and energy retrofits. This chapter sets the scene for the following chapters, which provide an up-to-date picture of Europe’s building stock, its energy consumption and its impact on social and territorial cohesion in the EU. The overall objective of the report is to identify the challenges in bringing about genuine energy union on the basis of an EU energy renovation plan. The graphs, maps and tables in this chapter show data from 2011, the most recent year for which Eurostat provides consolidated economic data for the building sector at EU level. Where data were not available for 2011, 2010 data were used; this is signalled in a footnote. The building sector plays a unique role in the EU economy. It directly contributes 7 % of value added in the non-financial business economy and about 88 % in the construction sector. It accounts for almost 9 % of total employment in the non-financial business economy.
The direct contribution of the building sector to the EU economy takes into account only the economic value of the actual building work (Figure 1.1). Its real importance becomes clearer when one considers the overall value chain in the sector, from the extraction of raw materials to their processing into building supplies and equipment, and use and maintenance. This includes activities such as architecture, design, the real-estate business and banking (Figure 1.1).
1 'The health of the economy is tied to the building sector's activity’ – this is taken from a speech to the French Parliament in 1850 by
Martin Nadaud, who was impressed with how building work in Paris was driving activity in all other sectors.

15
Figure 1.1 Value chain in the building sector
Key point: The value chain of the building sector goes beyond the building work itself. Source: Adapted by the authors from the report on Sustainable Competitiveness of the Construction Sector http://ec.europa.eu/enterprise/sectors/construction/studies/sustainable-competitiveness_en.htm Overall, the building sector has a significant impact on economic activity in other sectors. Building services, business activities and the supply of raw material and equipment are responsible for 70 % of overall building output (Figure 1.2). Also, the building sector has an impact beyond the internal market. Most EU companies operate internationally, so it also contributes to EU exports.
Figure 1.2 Contribution of other sectors to building output (EU, 2010)
Key point: The building sector fosters economic activity in many other sectors. Source: Eurostat, input-output table — current prices (NACE Rev. 2) [naio_cp17_r2] http://appsso.eurostat.ec.europa.eu/nui/show.do?dataset=naio_cp17_r2&lang=en

16
The importance of the building sector for the EU economy extends to its vulnerability to changing economic conditions, i.e. booms and crises, as described in the following sections.
Impact of the financial and economic crisis on the building sector Before the financial and economic crisis, the construction of new residential buildings was growing more, and more steadily, than that of non-residential buildings. This was particularly true in Member States where a speculative real-estate bubble combined with high levels of household debt took place. Other factors influencing economic activity in the building sector include the previous oversupply of buildings in many Member States, reduced consumer and business confidence (which delayed investment plans), constrained finance from lenders due to the crisis, and cuts in public spending (Eurostat, 2010-a & b). Combinations of some or all these factors explain the downturn of economic activity in the sector in individual Member States.
At EU level, building permit indices (expressed in new square metres of useful floor area) peaked in 2006 before a downturn in the second quarter of 2007, with the overall index reaching half its peak value in 2010 and still falling in 2012 and 2013 (Figure 1.3). Year-on-year change was greatest in 2008 for residential (-32 %) and in 2009 for non-residential buildings (-21 %).
Figure 1.3 Building permit indices (m2 of useful floor area)
Key point: The building sector has still not recovered from the economic and financial crisis. Source: Eurostat, building permits — annual data (2010 = 100) [sts_cobp_a] http://appsso.eurostat.ec.europa.eu/nui/show.do?dataset=sts_cobp_a&lang=en Indices did not peak in the same year in all EU countries. Due to national economic circumstances, drastic drops in demand for residential buildings in Spain, Ireland, the United Kingdom and Portugal (EC, 2012-a) severely restricted the activity for the overall building sector. Ireland and Greece reached their peak in 2007 and the building sector in both countries has still not recovered. The index peaked later (2008) in the Czech Republic, Romania and Slovakia, but a year earlier (2006) in Estonia and Bulgaria. Hungary was atypical, in that its index had already peaked in 2004. Bulgaria,

17
Estonia and Latvia recorded the biggest increases during the period of growth and the largest falls in the subsequent downturn (Eurostat, 2010-a & b).
Germany’s building permit index started to fall in 2004, earlier than the EU average, to reach its lowest level in 2009. This could be explained by the end of the construction programme following reunification. The German residential sector has experienced a new upswing in permits since 2011. Portugal is the only country in which the index fell continuously from 2004 onwards; in 2013, it was still among the lowest in Europe.
While still decreasing on average in the EU, building permit indices rose significantly in Germany, France, Latvia, Lithuania, Luxembourg and Austria in 2013, as forecasted by the construction industry (Euroconstruct, 2013). When interpreting the indices, however, one should avoid over-optimistic forecasts: an index rise is not always followed by actual output, as some permits remain unused or construction is delayed.
Economic value of the building sector
Value added • Value added at the EU level
In 2011, the value added of the building sector reached EUR 427 billion in the EU2, which was 7 % of that in the non-financial business economy. Within the construction sector, the building sector contributed 85 % of overall value added, generating 88 % of employment. Specialised construction activities that included renovation work and energy retrofits (Box 1.1) accounted for 66 % of total building output (Table 1.1).
Table 1.1 Value added of the building sector (EU/2011)
Value added (€ billions)
Total non-financial business economy 6,077 Total construction 501 Construction of buildings 144 Specialised construction activities 283 Total buildings 427
Key point: Specialised construction activities that include renovation work and energy retrofits add almost twice as much value as the construction of buildings. Source: Eurostat, annual enterprise statistics for special aggregates of activities (NACE Rev. 2) [sbs_na_sca_r2] http://appsso.eurostat.ec.europa.eu/nui/show.do?dataset=sbs_na_sca_r2&lang=en
2 EU-28 (data for Greece and Malta not available).
18
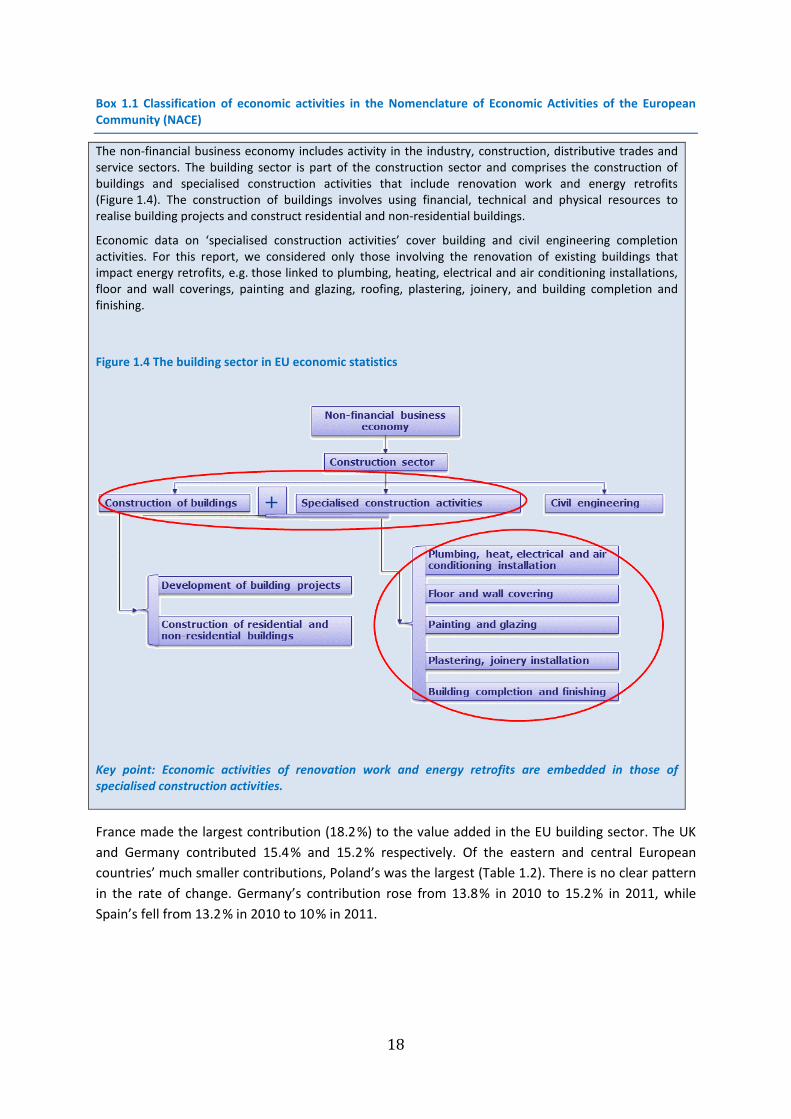
Box 1.1 Classification of economic activities in the Nomenclature of Economic Activities of the European Community (NACE)
The non-financial business economy includes activity in the industry, construction, distributive trades and service sectors. The building sector is part of the construction sector and comprises the construction of buildings and specialised construction activities that include renovation work and energy retrofits (Figure 1.4). The construction of buildings involves using financial, technical and physical resources to realise building projects and construct residential and non-residential buildings.
Economic data on ‘specialised construction activities’ cover building and civil engineering completion activities. For this report, we considered only those involving the renovation of existing buildings that impact energy retrofits, e.g. those linked to plumbing, heating, electrical and air conditioning installations, floor and wall coverings, painting and glazing, roofing, plastering, joinery, and building completion and finishing.
Figure 1.4 The building sector in EU economic statistics
Key point: Economic activities of renovation work and energy retrofits are embedded in those of specialised construction activities.
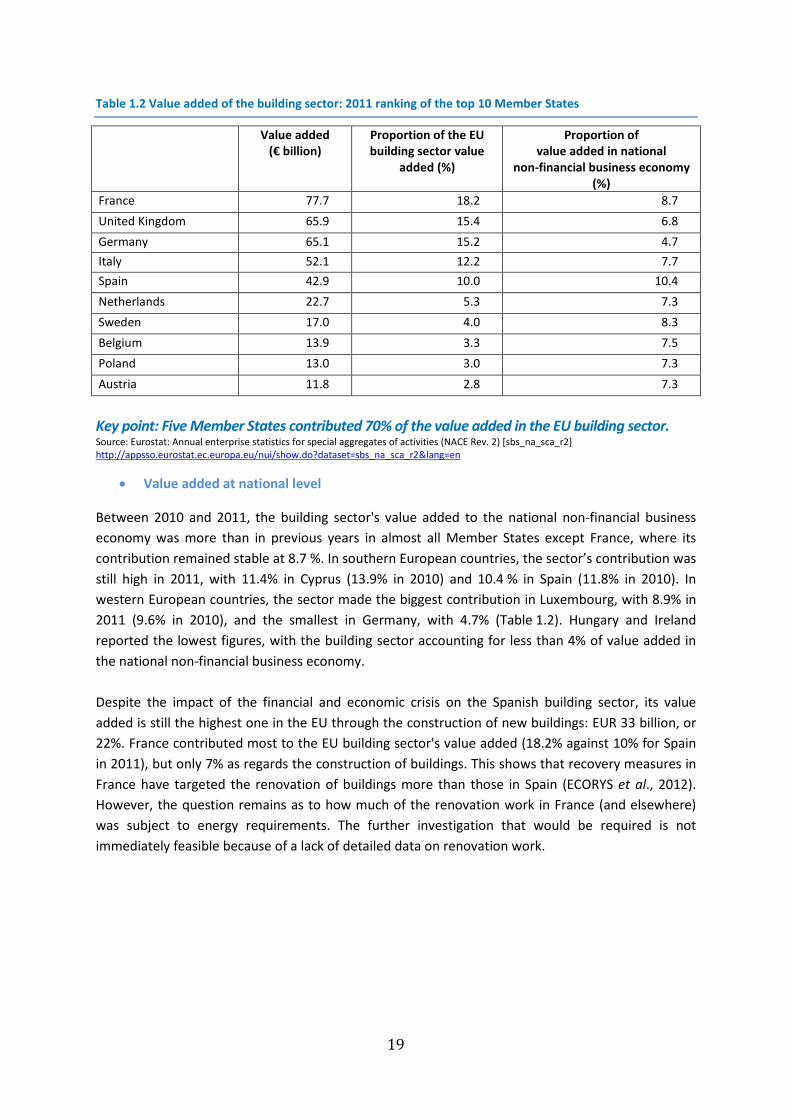
France made the largest contribution (18.2 %) to the value added in the EU building sector. The UK and Germany contributed 15.4 % and 15.2 % respectively. Of the eastern and central European countries’ much smaller contributions, Poland’s was the largest (Table 1.2). There is no clear pattern in the rate of change. Germany’s contribution rose from 13.8 % in 2010 to 15.2 % in 2011, while Spain’s fell from 13.2 % in 2010 to 10 % in 2011.
19
Table 1.2 Value added of the building sector: 2011 ranking of the top 10 Member States
Value added (€ billion)
Proportion of the EU building sector value
added (%)
Proportion of value added in national
non-financial business economy (%)
France 77.7 18.2 8.7 United Kingdom 65.9 15.4 6.8 Germany 65.1 15.2 4.7 Italy 52.1 12.2 7.7 Spain 42.9 10.0 10.4 Netherlands 22.7 5.3 7.3 Sweden 17.0 4.0 8.3 Belgium 13.9 3.3 7.5 Poland 13.0 3.0 7.3 Austria 11.8 2.8 7.3
Key point: Five Member States contributed 70% of the value added in the EU building sector. Source: Eurostat: Annual enterprise statistics for special aggregates of activities (NACE Rev. 2) [sbs_na_sca_r2] http://appsso.eurostat.ec.europa.eu/nui/show.do?dataset=sbs_na_sca_r2&lang=en
• Value added at national level
Between 2010 and 2011, the building sector's value added to the national non-financial business economy was more than in previous years in almost all Member States except France, where its contribution remained stable at 8.7 %. In southern European countries, the sector’s contribution was still high in 2011, with 11.4% in Cyprus (13.9% in 2010) and 10.4 % in Spain (11.8% in 2010). In western European countries, the sector made the biggest contribution in Luxembourg, with 8.9% in 2011 (9.6% in 2010), and the smallest in Germany, with 4.7% (Table 1.2). Hungary and Ireland reported the lowest figures, with the building sector accounting for less than 4% of value added in the national non-financial business economy. Despite the impact of the financial and economic crisis on the Spanish building sector, its value added is still the highest one in the EU through the construction of new buildings: EUR 33 billion, or 22%. France contributed most to the EU building sector's value added (18.2% against 10% for Spain in 2011), but only 7% as regards the construction of buildings. This shows that recovery measures in France have targeted the renovation of buildings more than those in Spain (ECORYS et al., 2012). However, the question remains as to how much of the renovation work in France (and elsewhere) was subject to energy requirements. The further investigation that would be required is not immediately feasible because of a lack of detailed data on renovation work.

20
• Value added by enterprise size
The EU building sector is characterised by a high number of micro enterprises. Enterprises with less than nine employees represent 94% of all enterprises active in the sector, while large enterprises represent less than 1%. Enterprises with less than 50 employees generated 72% of value added in the EU building sector, while those with more than 250 employees generated 14%. At national level, the largest contribution by enterprises with less than 50 employees was in Italy (85 %). The lowest contribution by enterprises with over 250 employees was in Greece (4.3%), followed by Italy (6.1%) (Figure 1.5)
Figure 1.5 Proportion of value added in the building sector by enterprise size (2011)
Key point: SMEs contributed more than 70% of the value added in the EU building sector. Source: Eurostat, construction by employment size class (NACE Rev. 2) [sbs_sc_con_r2] http://appsso.eurostat.ec.europa.eu/nui/show.do?dataset=sbs_sc_con_r2&lang=en

21
Employment • Employment at EU level
In 2011, the EU building sector employed 11.5 million people. This was equivalent to 8.8% of total employment in the non-financial business economy and makes the building sector the largest single contributor to EU employment. Within the sector, specialised construction activities that include renovation and energy retrofits provided the most jobs (7.84 million) (Table 1.3).
Table 1.3 Employment in the building sector (EU, 2011)
Employees (million) Total non-financial business economy 130.7 Total construction 13.1 Construction of building 3.66 Specialised construction activities 7.84 Total buildings 11.5
Key point: Specialised construction activities that include renovation work and energy retrofits made the largest contribution to EU employment. Source: Eurostat, annual enterprise statistics for special aggregates of activities (NACE Rev. 2) [sbs_na_sca_r2] http://appsso.eurostat.ec.europa.eu/nui/show.do?dataset=sbs_na_sca_r2&lang=en Germany made the biggest contribution to employment in the EU building sector: 14%, as compared with 12.3% in 2010. France’s contribution remained stable at 13.7% and Spain’s dropped to 10.5% from 13% in 2010 (Table 1.4). The Irish sector was one of the lowest contributors, with 0.5%.
Table 1.4 Employment in the building sector: 2011 ranking of the top 10 Member States
Proportion of EU building sector
employment (%)
Proportion of national non-financial business
economy employment (%)
Employees (million)
Germany 14.0% 6.1% 1.61 France 13.7% 10.3% 1.57 Italy 13.5% 10.5% 1.55 Spain 10.5% 11.9% 1.21 United Kingdom 10.3% 6.7% 1.18 Poland 6.4% 8.8% 0.74 Netherlands 3.7% 7.9% 0.42 Portugal 2.9% 10.6% 0.34 Czech Republic 2.9% 9.5% 0.34 Sweden 2.9% 10.9% 0.33
Key point: The structure of national economies impacts the building sector's contribution to national employment. Source: Eurostat, annual enterprise statistics for special aggregates of activities (NACE Rev. 2) [sbs_na_sca_r2] http://appsso.eurostat.ec.europa.eu/nui/show.do?dataset=sbs_na_sca_r2&lang=en

22
• Employment at national level
The building sector’s contribution to employment at national level varies. Among the 10 Member States employing the most people in the building sector, it ranged from 6.1% in Germany (5.8% in 2010) to 11.9% in Spain (12.8 % in 2010) (Table 1.4). Overall, the sector made the biggest relative contribution in Luxembourg (14.8%) and the smallest in Ireland. The importance of the building sector to national employment is highly dependent on the structure of the national economy. However, the economic and financial crisis led to losses of 30-40% of building sector employment in most Member States. The worst case was Spain, where almost two thirds of building sector jobs were lost between 2005 and 2012 (Figure 1.6). This is mainly due to the structure of the sector, with construction of new buildings accounting for a high proportion of total building output.
Figure 1.6 Employment trends in the building sector in selected Member States
Key point: Member States where the construction of new buildings made the biggest contribution to the value added were most affected by the financial and economic crisis. Source: Eurostat, annual enterprise statistics for special aggregates of activities (NACE Rev. 2) [sbs_na_sca_r2] http://appsso.eurostat.ec.europa.eu/nui/show.do?dataset=sbs_na_sca_r2&lang=en
• Employment at regional level
The building sector’s contribution to employment in the non-financial business economy was much greater in less developed regions in all Member States. The 10 regions with the highest contribution were in France, Italy, Spain, Finland and Luxembourg. Regions where the contribution was lowest were in Ireland, the UK, Germany, Bulgaria and most capital cities (Figure 1.7).

23
Figure 1.7 Contribution of the building sector to regional employment (2011)
Key point: The building sector employs more people in the less developed regions in all Member States. Source: Eurostat, SBS data by NUTS 2 regions and NACE Rev. 2 [sbs_r_nuts06_r2] http://appsso.eurostat.ec.europa.eu/nui/show.do?dataset=sbs_r_nuts06_r2&lang=en

24
The regional distribution of employment in the building sector calls for greater use of the EU cohesion policy funds3 for energy renovation investment (see Chapter 4). This would also contribute to the EU 2020 strategy for smart, sustainable and inclusive growth (EC, 2010-a), the EU’s 2020 and 2030 climate and energy targets (EC, 2014-c), and EU cohesion policy (EC, 2014-d). As pointed out by the Energy Efficiency Financial Institutions Group (EEFIG), however, implementation of Member States’ energy renovation strategies4 should involve streamlining, blending and optimising the use of existing EU and national funds (EEFIG, 2015). The objective is to create a fully functional energy renovation market that would increase employment, especially in less developed regions, while reducing energy demand in the building sector. This is of particular importance in Member States with per capita GDPs below the EU average and increasing proportion of the population facing fuel poverty (see Chapter 3).
• Employment by enterprise size
The pattern of employment by enterprise size is similar to that for value added. Enterprises with less than 50 employees contributed 79% of jobs in the EU building sector. Again, the biggest contribution from this category nationally is in Italy (92%). The contribution of enterprises with over 250 employees to total employment in the EU building sector is 8.4%, with the lowest national contribution in Italy (1.9%). Regarding the employment by enterprise size, a similar pattern to the value added is observed. Enterprises with less than 50 people employed contributed 79% to EU employment in the building sector. The highest contribution of this category of enterprises to the employment is seen in Italy being 92% of the total employment in the building sector. Similarly, the contribution of enterprises of more than 250 people employed as a proportion of the total employment in the EU building sector was 8.4% on average with the lowest contribution observed in Italy (1.9%).
• Employment by age category and gender
91 % of employees in the building sector are male (Figure 1.8). Efforts are needed in the sector to achieve the EU targets in terms of gender balance - and also in terms of age balance: 66 % are between 25 and 49 years old.
Modernisation of the building sector through the integration of ICT, automated solutions and e-work could create opportunities for women and older people, while also attracting young employees. As the sector is characterised by a high number of SMEs, policy intervention might be needed to train managers (who are usually self-employed) on the benefits of such forms of change.
3 European Regional Development Fund (ERDF), European Social Fund (ESF) and Cohesion Fund (CF). 4 The Member States have drawn up renovation strategies under the Energy Efficiency Directive (2012/27/EU) and the JRC is currently
analysing them.

25
Figure 1.8 Employment in the building sector by gender and age (EU, 2011)
Key point: There are significant gender and age imbalances in the building sector. Source: Eurostat, employment by sex, age and detailed economic activity (from 2008 onwards, NACE Rev. 2 two-digit level) — 1 000 [lfsa_egan22d] http://appsso.eurostat.ec.europa.eu/nui/show.do?dataset=lfsa_egan22d&lang=en
Energy renovation: a 'win-win' option for the EU economy The value added from specialised construction activities that include renovation work and energy retrofits was EUR 283 billion in 2011, the biggest contribution (66%) to value added in the EU building sector. Such activities contributed most in France (EUR 65 billion, or 24%), followed by Germany (EUR 44 billion) and the UK (EUR 32 billion). They contributed least in eastern and central European countries and the Baltic States. Specialised construction activities also made the biggest contribution to employment in the EU building sector, with 7.84 million jobs (Tables 1.1 and 1.3). Value added by activities linked to the envelope of a building (roofing, walls and floor covering, glazing, etc.) was EUR 166 billion the same year, or 60% of the value added in the EU building sector (Figure 1.9). In terms of employment, such activities represented 58% of total employment in the EU building sector, with 6.88 million jobs. These activities are very important for energy retrofits, as reducing heating demand is the main challenge the EU renovation plan will have to address (see Chapter 2). An energy upgrade of the envelope of the buildings and its equipment whenever a building is renovated is a ‘win-win’ solution for the EU 2020 strategy for smart, sustainable and inclusive growth (EC, 2010-a), the EU’s 2020 and 2030 climate and energy targets (EC, 2014-c), and the EU cohesion policy (EC, 2014-d). It will enhance the prominent role specialised construction activities already play in terms of value added and employment, while contributing to the EU’s sustainable growth, climate and energy strategies, and to social and territorial cohesion. From an industry perspective, more mature demand for the renovation of existing buildings would be a valuable stabiliser for the building sector (Euroconstruct, 2013).

26
Figure 1.9 Value added in the building sector by sub-sector (2011)
Key point: 60% of the value added is generated by activities linked to the envelope of a building. Source: Construction by employment size class (NACE Rev. 2, F) [sbs_sc_con_r2] http://appsso.eurostat.ec.europa.eu/nui/show.do?dataset=sbs_na_sca_r2&lang=en
• Trade-off between energy renovation and energy supply
The risk of job losses in the energy supply sector if buildings are made more energy-efficient is negligible. Existing power plants and energy infrastructures will not be taken offline if buildings are more efficient. The energy supply sector already creates far fewer jobs than specialised construction activities that include building renovation and energy retrofits. For the same value added, the latter employed almost three times more people than the former (Table 1.5). It is therefore expected that any jobs lost in that sector would easily be made up for by new jobs linked to implementing, monitoring and evaluating the plan for renovating existing buildings. Table 1.5 Economic value of specialised construction activities versus energy supply activities (EU, 2011)
Value added (€ billion)
Employees (million)
Specialised construction activities 283 7.84 Energy supply to meet the needs of buildings 215 2.13
Key point: Specialised construction activities that include building renovation and energy retrofits employed three times more people than the energy supply to meet the needs of buildings for the same value added. Source: Eurostat, annual enterprise statistics for special aggregates of activities (NACE Rev. 2) [sbs_na_sca_r2] http://appsso.eurostat.ec.europa.eu/nui/show.do?dataset=sbs_na_sca_r2&lang=en

27
Chapter 2: Disparity of energy consumption of the EU building stock
Highlights
• The building stock is the largest single consumer of energy in Europe. It accounted for 40% of final energy consumption in 2012 and 38% of the EU’s CO2 emissions.
• Final energy consumption of the building stock increased by 14% between 1990 and 2012. Gas and electricity were the main energy carriers.
• Electricity use increased by 60% between 1990 and 2012, largely as a result of the high penetration of consumer appliances and electronic devices.
• The building stock accounted for 68% of total gas consumption in the EU in 2012, which represented 35% of all gas imports.
• The building stock’s exposure to gas supply disruptions varies among Member States, depending on the proportion of gas consumed in buildings and the origin of gas imports.
Chapter 1 showed the prominent economic role of specialised construction activities that include renovation work and energy retrofits. In this chapter, we highlight the impact of buildings’ energy consumption on the EU's energy dependency and expenditure. The chapter starts by analysing energy consumption by energy carrier and end-use for residential and non-residential buildings. It examines disparities among Member States as regards energy consumption per capita for residential and per GDP for non-residential buildings. It points out the building sector’s vulnerability to gas supply disruptions. The last section presents the climate impact of buildings’ energy consumption. The chapter is illustrated with graphs and maps using data from 2012 provided by Eurostat and/or from ODYSSEE databases. Where consolidated EU data were not available for 2012, data from the most recent year were used; this is signalled in footnotes. Final energy consumption in Europe increased by 10 % in absolute terms between 1990 and 2006, when it peaked at 1 190 Mtoe. Over this period, the proportion accounted by residential and non-residential buildings rose from 35.4% to 37.7% (Figure 2.1), making buildings the largest single energy consumer in Europe. Since the start of the financial crisis, final energy consumption has fallen overall in the EU. In 2007-12, it decreased by 8%, but by only 2.5% when one looks at residential and non-residential buildings only. The decrease in buildings’ final energy consumption mainly affected residential buildings (4%), despite the increase in area (m2) as a result of construction activity prior to the crisis (see Chapter 1). This could be attributed to more stringent building energy codes in all Member States. Portugal experienced the biggest decrease (16%) in the final energy consumption of residential buildings in this period, while Bulgaria and Italy saw the biggest increases (15%).

28
In contrast, the final energy consumption of non-residential buildings remained quite stable. The biggest decreases were observed in Slovakia and Ireland (22%) and the biggest increase in Slovenia (24%). Efficiency improvements and the fall-back in activity were probably offset by the high penetration of consumer electronic devices.
Figure 2.1 Final energy consumption by sector (EU)
Key point: The building stock (residential and non-residential) is the largest single energy consumer in Europe. Source: Eurostat, supply, transformation, consumption — all products — annual data [nrg_100a] http://appsso.eurostat.ec.europa.eu/nui/show.do?dataset=nrg_100a&lang=en Buildings are complex systems in which energy consumption is influenced by a combination of factors, including the age of the building, population growth, the size of houses and households, the penetration of appliances and electronic devices, and location (energy demand is affected by climatic conditions). For non–residential buildings, the level of economic activity and the attendant fluctuations in floor area used are the main parameters that explain changes in energy consumption. The interactions between these factors determine a given building’s energy needs vis-à-vis specific end-uses (i.e. heating, cooling, lighting, etc.). Energy consumption in a Member State’s building stock is the result of its choices as to how the heat and electricity to satisfy those needs are produced and distributed. These supply-side decisions are affected by the availability of energy carriers (e.g. gas, oil) in the Member State and/or nearby and determine in turn how vulnerable its building stock is to energy supply disruption. The energy needs and energy consumption of buildings also determine how much the sector contributes to climate change (see below).
Energy consumption of the building stock
Energy consumption by energy carrier Gas and electricity are the two main energy carriers used in buildings. At EU level, gas consumption as a proportion of buildings’ total final energy consumption rose between 1990 and 2012 to 37% for

29
residential and 31% for non-residential buildings. Electricity consumption grew 59% over the same period, reaching 25% of the total final energy consumption of residential and almost twice that in non-residential buildings. The use of solid fuels and petroleum products decreased, derived heat remained stable as a proportion of buildings’ final energy consumption, while the proportion of renewable energies increased by around 9% in both residential and non-residential buildings (Figure 2.2). The increased use of renewable energies in buildings was due to new incentives introduced in all Member States as they seek to achieve mandatory renewable energy targets by 2020 and to reductions in the cost of installing some renewable energy products such as solar PV.
Figure 2.2 Buildings’ final energy consumption by energy carrier
Key point: Electricity consumption in buildings grew by 59% between 1990 and 2012. Source: Eurostat, supply, transformation, consumption — all products — annual data [nrg_100a] http://appsso.eurostat.ec.europa.eu/nui/show.do?dataset=nrg_100a&lang=en
Gas consumption patterns in residential buildings are changing slightly at national level. This could be explained by lower heating demand due to milder winters in recent years as a result of global warming. Gas consumption in residential buildings peaked in most Member States in 2005. There have also been changes in gas consumption as a proportion of buildings’ total final energy consumption. In France, this increased from 63% in 2010 to 66% in 2012, while in Germany it fell from 60% in 2010 to 58% in 2012.
• Energy carrier consumption per capita
Energy consumption of the building stock is influenced by various factors including population growth. Electricity, gas and heat consumption per capita is influenced by buildings’ heating needs, acceptable levels of comfort, what fuel is used for heating, the affordability of energy and (in the case of electricity) the penetration of new devices. Energy carrier consumption per capita allows for isolating building energy trends related to drivers other than population such as GDP and floor area.
30
Overall per capita consumption has changed little in recent years in the EU. Per capita consumption in residential buildings has increased in some countries, such as Denmark, Estonia and Finland, while remaining stable in others. This could be explained by the size of houses increasing (the average is 120 m2 in Denmark, as compared with 40 m2 in Romania, for example) and the size of households decreasing in these countries (an average of 2 persons in Denmark against 2.9 in Romania). Electricity consumption per capita varies among Member States depending on whether the volume of electricity produced encourages its use for heating and whether high prices lead consumers to use less. Countries with high electricity production, such as France and Sweden, have implemented fuel-shift policies for residential heating. Sweden has the highest electricity consumption per capita, with over 355 kgoe per person, followed by France, with over 200 kgoe. In contrast, per capita electricity consumption is below 75 kgoe in eastern countries and the Baltic States (Figure 2.3), where high electricity prices have meant that more people face arrears on utility bills and reduced levels of comfort (see Chapter 3). In 2000-12, gas consumption per capita fell by almost 8% in the EU as a whole, but there were wide variations between Member States. Gas-producing countries such as the UK and the Netherlands have the highest consumption, with more than 400 kgoe per person, followed by Italy, probably because of favourable contracts for importing gas from North Africa. Sweden and Finland have the lowest gas consumption per capita (5 to 50 kgoe), as electricity from hydro plants is used for heating. National data for heat consumption per capita are highly dependent on the penetration of district heating systems, as they do not include heat from building-level central heating systems. Countries with high penetration of district heating systems, such as Sweden and Finland, had the highest figures (200 to 310 kgoe of heat per person). In eastern European countries and the Baltic States, heat consumption per capita ranged from 25 to 200 kgoe. However, there is a question mark over the efficiency of heat distribution in these countries, as district heating systems were installed during the Soviet period and most have not been upgraded. People in southern countries and the UK consume the least heat per capita (less than 10 kgoe in the UK). Effective implementation of existing building energy efficiency policies such as building energy codes and minimum energy performance requirements for buildings' components and equipment allow for decoupling buildings' energy consumption from population growth. More stringent energy performance requirements have led in all Member States to decrease energy intensity. However, the energy consumption of the overall building stock increased over time as building energy efficiency policies do not include requirements on the size of homes. Furthermore, the decrease of households' size has transformed the use of buildings in Europe and consequently their energy consumption. Going beyond technical aspects of buildings' energy consumption and considering sociological trends when designing energy efficiency policies for buildings would be an asset.

31
Figure 2.3 Electricity, gas and heat consumption per capita in residential buildings (2012)
Key point: Energy consumption per capita for each fuel is highly dependent on Member States’ supply choices. Source: Eurostat, supply, transformation, consumption — all products — annual data [nrg_100a] http://appsso.eurostat.ec.europa.eu/nui/show.do?dataset=nrg_100a&lang=en Eurostat, population on 1st January by age and sex [ tps00001] http://appsso.eurostat.ec.europa.eu/nui/show.do?dataset=demo_pjan&lang=en

32
Energy consumption by end-use Within the building stock, residential buildings represented the largest consumer of energy (66 % of buildings’ total final energy consumption in the EU) in 2012 and accounted for 75 % of total floor area. Space heating is the main end-use in residential buildings in all EU countries except Malta and Portugal (Figure 2.4). Heating needs are determined by climatic conditions, but also by the level of comfort considered acceptable and the quality of the building envelope. In Portugal, less than 20 % of residential buildings’ final energy consumption was for heating, while the figures for Denmark and France were 80 % and almost 70 % respectively. More stringent energy requirements for new buildings reduced heating consumption per m2 in 1990-2012 in most EU countries except Greece and Hungary. However, the overall heating consumption of the residential building stock was not any less, because there were more dwellings and households (with the former growing and the latter contracting in size). Appliances and lighting represented the second end-use in terms of energy consumption in residential buildings. The increased penetration of white goods and consumer electronics is the main driver of energy consumption for appliances. The combined consumption of appliances and lighting represented less than 10 % of the final energy consumption of residential buildings in Latvia, almost 30 % in Cyprus and more than 40 % in Malta. Energy consumption for cooking is high in Portugal (over 40 %), Romania (almost 39 %) and Malta (over 20 %) (Figure 2.4).
Figure 2.4 Residential buildings’ final energy consumption by end-use (2012)
Key point: Space heating is the main end-use in residential buildings at EU level. Source: ODYSSEE, energy efficiency indicators http://www.enerdata.net/enerdatauk/knowledge/subscriptions/database/energy-efficiency-indicators.php It is not easy to analyse energy consumption by end-use in non-residential buildings, because of the lack of consistent data across Member States.

33
• Energy carrier used for heating
At EU level, gas was the main energy carrier used for heating in residential buildings. The Netherlands and the UK had the highest use of gas for heating (89 % and 78 % respectively), possibly because they both produce natural gas. Over 60 % of homes in Slovakia, Hungary and Italy were heated using gas. In Belgium, Croatia, Germany, Czech Republic and France, this applied to 40 % of homes. Sweden, Finland and Portugal had the lowest use of gas for heating (1 %). Electricity was used for space heating in almost 30 % of homes in Sweden, followed by Finland (23 %), Spain (21 %) and France (14 %). The lowest contribution of electricity to space heating was in Latvia and Romania (1 %). Oil made the biggest contribution in Cyprus (92 %) and Malta (85 %), followed by Greece (56 %), Belgium and Ireland (43 %), and the smallest in the Baltic States, Poland, Romania and the Czech Republic. Wood contributed over 70 % in Portugal and 60 % in Latvia and Romania. The lowest use of wood for heating was in Ireland (2 %) (Figure 2.5). Figure 2.5 Energy carrier used for heating in residential buildings (2012)
Key point: Gas is the main energy carrier used for heating in more than 10 Member States. Source: ODYSSEE, energy Efficiency Indicators5 http://www.enerdata.net/enerdatauk/knowledge/subscriptions/database/energy-efficiency-indicators.php
5 Data for Belgium are from 2011 and for Hungary and Estonia from 2010.

34
Building stock’s dependency on gas imports Gas consumption in buildings as a proportion of total gas consumption varies between Member States depending on climatic conditions and the national energy mix for heat production. In 2012, the building stock consumed 79 % of the gas used in Hungary, but less than 30 % in Sweden and Portugal, 7 % in Finland and 11 % in Bulgaria (Figure 2.6). The high dependency of several Member States on non-EU gas means that residential and non-residential buildings there are vulnerable to gas supply disruptions. Exposure varies according to the origin of gas imports. In 2012, buildings in the Baltic States, the Czech Republic, Bulgaria and Slovakia were 100 % dependent on Russian gas. Buildings were 98 % dependent on Russian gas in Hungary, 86 % in Romania and 80 % in Poland the same year. Further south, 100 % of the gas supplied to buildings in Portugal was imported from the Middle East and North Africa, as was 85 % of that in Spain. Of the gas used for buildings in Italy, 57 % was from the Middle East and North Africa and 27 % from Russia. Only the Swedish, Finnish, British and Dutch building stocks are immune to disruption to gas imports (Figure 2.7). The EU has strengthened its coordination capacities to prevent possible gas supply disruption. It has adopted rules to secure the supply of gas for heating. Member States are required to draw up emergency preparedness and emergency response plans. An EU-wide platform to exchange information and coordinate action in the event of disruption has been established through the Gas Coordination Group (GCG) and a solidarity mechanism is now in place whereby the most vulnerable Member States would receive assistance if necessary. The overall objective is a more secure gas supply, especially for eastern and Baltic Member States, which are most dependent on Russian gas and therefore most exposed to its disruption (EC, 2014-e). Reducing building stock's dependency on gas imports requires also fuel shift towards the use of renewable energy sources including generating electricity from renewable sources (solar, wind and bio-electricity). Whilst for heating, using more electricity allows also for a better integration of renewables and addresses the limited availability of biomass resources as a direct replacement of natural gas (biogas from agriculture residues and landfills), oil (bio liquids) and coal (pellets). Furthermore, the value of energy imports was 2.5 times higher than the EU trade balance in 2013-14. Given that buildings consumed 40 % of the EU’s total final energy consumption, the renovation of existing buildings would reduce the need for, and expenditure on, energy imports (especially gas). Thus, Europe’s energy security would be enhanced and part of the current energy expenditure could be re-allocated to national coffers and investment for growth and jobs in Europe. This is of particular relevance for Member States with per capita GDPs below the EU average.

35
Figure 2.6 Final gas consumed in buildings as a percentage of total gas consumption Figure 2.7 Origin of gas imports by Member State
Key point: Direct gas consumption in buildings varies among Member States. Source: Eurostat, supply, transformation, consumption — all products — annual data [nrg_100a]. http://appsso.eurostat.ec.europa.eu/nui/show.do?dataset=nrg_100a&lang=en
Key point: The heating of buildings in eastern and Baltic Member States is highly exposed to any disruption of Russian gas supplies. Source: Eurostat, imports (by country of origin) — gas — annual data [nrg_124a]. http://appsso.eurostat.ec.europa.eu/nui/show.do?dataset=nrg_124a&lang=en

36
Contribution of the building stock to climate change Buildings are responsible for 38 % of the EU’s total CO2 emissions. This means that reducing the energy demand of buildings and decarbonisation of the energy supply for residential and non-residential buildings are vital for the EU climate and energy strategy (EC, 2014-c). Given that more than two thirds of the existing building stock is expected to be still standing in 2050 (IEA, 2010) and that buildings in Europe are more likely to be refurbished than replaced, energy renovation based on energy-sufficiency and energy-efficiency measures combined with renewable energy sources for heating and electricity (Figure 2.8) is one of the priority areas of the energy union (EC, 2015).
Figure 2.8 The path to a decarbonised building stock
Key point: Decarbonisation of the EU building stock requires a three-pronged approach. Source: Modernisation of building energy codes to secure our global future (IEA-UNDP, 2013)
In 2012, the lowest building-sector CO2 emissions were observed in Sweden (6 kg/m2), while the highest were in Estonia, Poland and the Czech Republic (over 100 kg/m2). In Germany, the UK, Romania and Bulgaria, emissions ranged between 50 and 60 kg/m2. These differences are a function of electricity and heat production in each country. The lowest CO2 emissions per capita were observed in Sweden (less than 0.5 t) and the highest in Estonia (over 3 t) (Figure 2.9). The carbon intensity of non-residential buildings varied from 260 tCO2/€ million in Estonia, where electricity is mainly produced from fossil fuels, to 4 tCO2/€ million in Sweden, where it is produced from hydro plants. Polish non-residential buildings rank second in terms of CO2 emissions per unit of added value, with 155 tCO2/€ million, followed by those in Hungary and the Czech Republic, with 105 tCO2/€ million. Non-residential buildings emitted 20 tCO2/€ million in Denmark and France and 16 tCO2/€ million in Austria (Figure 2.9).

37
Figure 2.9 Contribution of the building stock to climate change (2012)
CO2 emissions per GDP in non-residential buildings CO2 emissions per capita in residential buildings CO2 emissions per m2 in residential buildings Key point: Buildings’ CO2 emissions depend on electricity and heat production. Source: ODYSSEE, CO2 emissions: http://www.enerdata.net/enerdatauk/knowledge/subscriptions/database/energy-efficiency-indicators.php Eurostat, population on 1st January [ tps00001] http://appsso.eurostat.ec.europa.eu/nui/show.do?dataset=demo_pjan&lang=en Eurostat, GDP and main components (output, expenditure and income) [nama_10_gdp] http://appsso.eurostat.ec.europa.eu/nui/show.do?dataset=nama_10_gdp&lang=en

38
Chapter 3: The challenge of comfortable homes
Highlights
• In 2012, 11 % of the EU population were unable to keep their homes warm in the winter and 19 % were living in dwellings not comfortably cool in the summer.
• Over 30 % of people in Member States with per capita GDPs below the EU average faced fuel poverty in 2012.
• The proportion of the EU population with arrears on their utility bills increased from 9 % in 2010 to 13 % in 2013.
• More than 70 % of the EU population were owner-occupiers in 2012. The highest proportion was in Romania (97 %) and the lowest in Germany (53 %).
• Almost 60 % of the EU population lived in houses in 2012. In Member States with per capita GDPs below the EU average, 20 % of low-income families lived in houses in 2012.
Before exploring an EU renovation plan in Chapter 4, here we highlight the societal impact of inefficient buildings, especially in Member States with per capita GDPs below the EU average. This chapter starts by introducing the concept of ‘fuel poverty’ and analysing people’s inability across Member States to maintain comfortable temperatures in their homes in winter and summer. This is followed by an analysis of households’ energy expenditure and discussion of rising energy prices and their impact on low-income families’ capacity to pay their energy bills. Finally, the chapter looks at occupants’ capacity to renovate their homes, especially where they own them and/or live in Member States with per capita GDPs below the EU average. The chapter is illustrated with maps and graphs using Eurostat data from 2012, the last year for which consolidated EU-28 data are available. Where data for 2012 were not provided, we used data from previous years; this is signalled in a footnote.
Buildings are structures designed to provide people with comfortable living and working conditions. Spending long periods in unheated buildings in winter or uncooled ones in summer has an impact on health. It increases the number of deaths, particularly among older and vulnerable people. The UK reckons that each 1 °C drop in average internal temperature in winter leads to 8 000 additional deaths (Age UK, 2013), while France reported 60 % more deaths due to the heat wave in summer 2003 (INVS, 2007). The EU has made progress in reducing from 16.1 % in 2010 to 15.1 % in 2012 the proportion of the population living in low-quality dwellings with leaking roofs, damp walls, floors or foundation, and rot in window frames. In 2012, Slovenia had the highest proportion of inhabitants (31.5 %) living in

39
low-quality dwellings, followed by Cyprus (30 %) and Latvia (28.2 %). Among western European countries, Belgium and Denmark had the highest proportions, with 18.4 % and 17.9 % respectively. Of the countries that have joined the EU since 2004, the Czech Republic and Poland had the lowest proportions (10.5 % of the population), while Sweden and Finland had the lowest figures in the EU as a whole (7.9 % and 6 % respectively). The quality of dwellings determines energy needs, which in turn affect energy consumption and bills. In order to reduce the expense of heating and/or cooling homes, low-income6 consumers usually compromise on comfort; this is ‘fuel poverty’ (Box 3.1). There is growing concern regarding the increasing number of EU citizens facing fuel poverty. In 2009, Member States were required to define the concept of ‘vulnerable consumer’ in the context of fuel poverty (EC, 2009-b). They were also asked to make it illegal to disconnect vulnerable consumers’ electricity supply. The aim is to limit the health impact of fuel poverty and its associated public expenditure (EC, 2009-a). Governments usually seek to alleviate fuel poverty through social tariffs for energy and/or grants for heating bills (EC, 2000-b), but such measures do not reduce energy consumption, which are driven mainly by the quality of buildings' envelopes and systems.
Box 3.1 What is fuel poverty?
Fuel poverty is recognised at EU level as a threat to social cohesion (EC, 2009-b). Member States use different criteria to define it, including income thresholds, the proportion of expenditure that goes on energy and the vulnerability of consumers, such as those with disabilities.
In the UK and Ireland, people who spend more than 10% of their income on energy bills to warm their homes are considered ‘fuel poor’. France, Greece, Malta and Romania assess fuel poverty on the basis of an income threshold. Some countries combine these types of criterion and some do not have well-defined criteria.
Despite the existence of social programmes, the proportion of the European population unable to keep their homes warm increased from 9.5 % in 2010 to 10.8 % in 2012. Bulgaria had the biggest proportion (46.5 %), while the Nordic countries had the smallest (less than 3 %) (Figure 3.1). The situation is worse for low-income families. The proportion of low-income families in the EU that were unable to keep their homes warm increased from 21.1 % in 2010 to 24.3 % in 2012. At national level, this ranged from 70 % in Bulgaria to 2.2 % in Luxembourg. 19.1 % of the EU population lived in homes not comfortably cool in summer. This included almost 50 % of the Bulgarian population, but less than 10 % in Sweden, Ireland and the UK (Figure 3.2). While climatic conditions play an important role in determining buildings’ energy needs, it is the quality of the building envelope that impacts energy consumption (see previous section). In spite of the warm climate in Cyprus, 30.7 % of the population were unable to keep their homes warm. A similar pattern was observed in Portugal (27 %), Greece (26.1 %), Malta (22.1 %) and Italy (21.2 %). The homes of almost 30 % of the population in Finland, Latvia and Lithuania were uncomfortably warm in summer. Overall, Member States with per capita GDPs below the EU average have the highest proportion of the population facing fuel poverty (Figures 3.1 and 3.2).
6 i.e. on less than 60 % of the median national equalised income
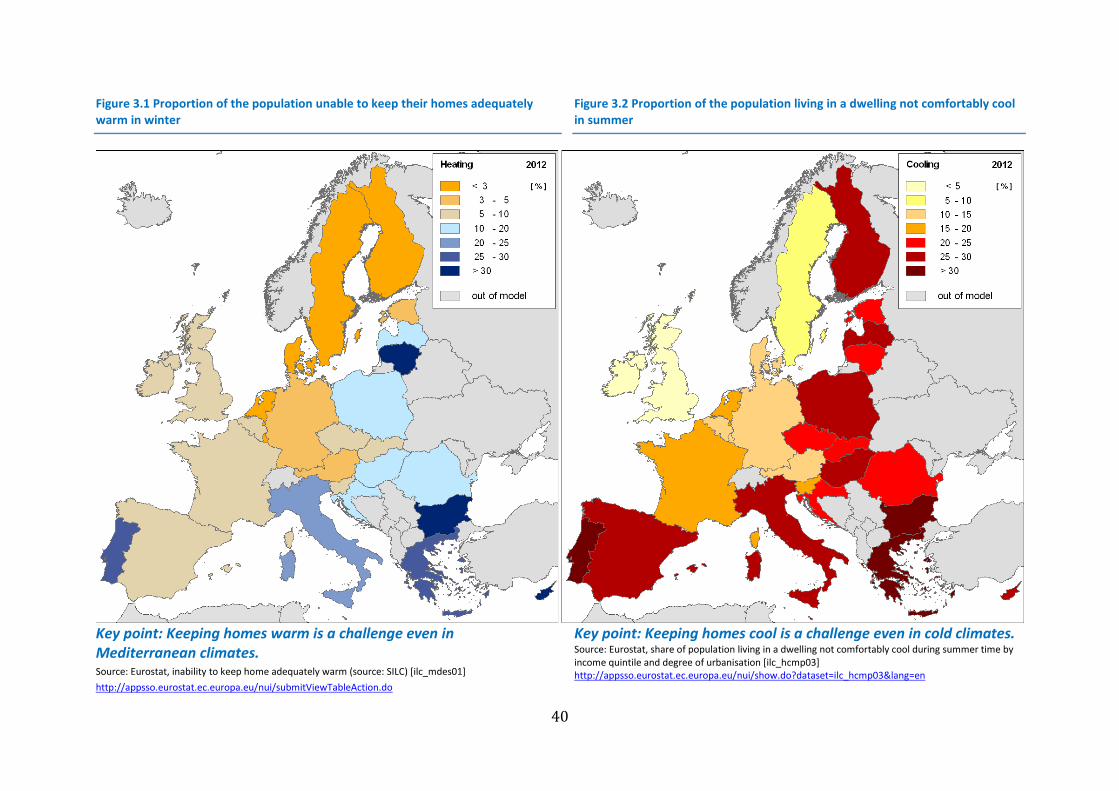
40
Figure 3.1 Proportion of the population unable to keep their homes adequately warm in winter
Figure 3.2 Proportion of the population living in a dwelling not comfortably cool in summer
Key point: Keeping homes warm is a challenge even in Mediterranean climates. Source: Eurostat, inability to keep home adequately warm (source: SILC) [ilc_mdes01] http://appsso.eurostat.ec.europa.eu/nui/submitViewTableAction.do
Key point: Keeping homes cool is a challenge even in cold climates. Source: Eurostat, share of population living in a dwelling not comfortably cool during summer time by income quintile and degree of urbanisation [ilc_hcmp03] http://appsso.eurostat.ec.europa.eu/nui/show.do?dataset=ilc_hcmp03&lang=en

41
Household expenditure on energy used for homes Household energy expenditure depends on the type of house, the quality of the building's envelope and the cost of energy. In recent years, energy has accounted for a growing proportion of households’ consumption expenditure across the EU. The Member States can be broken down into three regional groups on the basis of relative expenditure on energy (Figure 3.3):
− southern European countries (Spain, Cyprus, Greece, Portugal) with warm climates and low heating needs, where energy accounts for up to 10% of households’ consumption expenditure;
− eastern European countries and Baltic States (Czech Republic, Estonia, Croatia, Slovenia, Bulgaria, Romania), in some of which energy accounts for almost 18% of household consumption expenditure, possibly because of household income levels below the EU average and high heating needs due to the building quality and the climate; and
− northern and western European countries where high incomes and better building quality offset the cold climate.
Household energy expenditure therefore varies widely across the EU. Vulnerable citizens in Europe are most severely impacted by the inefficiency of the building stock and rising energy prices
Impact of degree of urbanisation In addition to variations across Member States in the proportion of households' consumption expenditure accounted for by energy, degrees of urbanisation vary within each country (Box 3.2). The degree of urbanisation determines the building type which in turn has an impact on energy needs. Single-family houses, located mainly in rural areas, lose more heat than multi-apartment dwellings mainly located in densely populated areas. Also, houses in rural areas tend to be larger than apartments in cities and urban areas. Consequently, in all Member States, for the same level of comfort, energy consumption expenditure was relatively lower for households in densely populated areas than for those in rural areas (Figure 3.2).
Box 3.2 Degree of urbanisation classification
Degree of urbanisation is defined in Europe on the basis of population density as follows: • cities and large urban areas (densely populated areas) where at least 50% of the population live in
high-density clusters. • towns and suburbs (intermediate density areas) where less than 50% of the population live in
rural grid cells and less than 50% live in high-density clusters; and • rural areas (thinly populated areas) where more than 50 % of the population live in rural grid cells.
Source: Eurostat: Degree of urbanisation classification http://ec.europa.eu/eurostat/statistics-explained/index.php/Degree_of_urbanisation_classification_-_2011_revision Energy accounted for the biggest proportion of overall consumption expenditure for Hungarian households in 2010: almost 19% in rural areas, 17% in towns and suburbs and 14% in cities and large urban areas. Hungary is followed by Slovakia and the Czech Republic, with 15% and 13% respectively in rural areas and 11% in cities and large urban areas. A similar pattern emerged in southern Europe, with proportions of almost 5% in rural areas in Greece and Cyprus, as compared with 3% in cities and large urban areas. The exception was Portugal, where energy accounted for 10% of total household expenditure in rural areas. In western and northern countries, less than 7% of total expenditure was on energy.

42
Figure 3.3 Impact of degree of urbanisation on households' energy expenditures
Key point: Energy expenditure is higher for households in less densely populated areas. Source: Eurostat, structure of consumption expenditure by degree of urbanisation (COICOP level 2) (1 000) [hbs_str_t226]7 http://appsso.eurostat.ec.europa.eu/nui/show.do?dataset=hbs_str_t226&lang=en
7 2010 data.

43
Impact of energy prices The rise in energy prices in Europe in recent years (Box 3.3) resulted in an increase from 9.1% in 2010 to 10.1% in 2013 in the proportion of the population with arrears on utility bills. However, the impact varies considerably across Member States. In 2012, the proportion reached 18.4% in Member States with per capita GDPs below the EU average, as compared with 7.8 % in the pre-2004 Member States. Bulgaria had the biggest proportion (34%), followed by Romania (28.8%) and Hungary (24.5 %). The exceptions in central and eastern Europe were Slovakia (4.6%) and the Czech Republic (4%) (Figure 3.4).
Figure 3.4 Proportion of the population with arrears on utility bills (2012)
Key point: Member States with per capita GDPs below the EU average had the highest proportions of the population with arrears on utility bills. Source: Eurostat, arrears on utility bills (source: SILC) [ilc_mdes07] http://appsso.eurostat.ec.europa.eu/nui/show.do?dataset=ilc_mdes07&lang=en

44
Box 3.1 Developments in gas and electricity prices for households
Household gas prices have risen by an average of 3% a year in the past five years in the EU and household electricity prices by 4% a year on average. In both cases, the increases were above the rate of inflation in most Member States.
Household energy prices vary considerably across Member States (Figures 3.5 and 3.6) and the range has widened over time. Consumers in some Member States are paying 2.5 to 4 times as much as those in others (EC, 2014-B).
Figure 3.5 Gas prices for medium sized households
Figure 3.6 Electricity prices for medium sized households
Key point: Member States with per capita GDPs below the EU average experienced the highest gas price increases. Source: Eurostat, gas prices per type of user [ten 00118]. http://ec.europa.eu/eurostat/tgm/table.do?tab=table&init=1&language=en&pcode=ten00118&plugin=1
Key point: Member States with per capita GDPs below the EU average experienced the highest electricity price increases. Source: Eurostat, electricity prices per type of user [ten 00117]. http://ec.europa.eu/eurostat/tgm/table.do?tab=table&init=1&language=en&pcode=ten00117&plugin=1

45
Affordability of energy renovation for EU citizens Improving the quality of buildings by insulating roofs, walls and floors and replacing windows and heating and/or cooling systems by the best available technologies is a key to reducing energy needs and consequently households’ energy bills. At the EU level, energy renovation is given high priority in the Strategy for a resilient energy union with a forward-looking climate change policy (EC, 2015). Previously, the Energy Efficiency Directive (EED) (2012/27/EU) had required Member States to draw up renovation strategies with intermediate steps and the relevant policies and measures to increase the energy efficiency of the EU's building stock. Whether many EU citizens can afford energy renovation themselves is doubtful, especially in the case of low-income families with homes in rural areas in Member States with per capita GDPs below the EU average. A household’s financial capacity to free up savings for energy renovation depends on its income. Tenure arrangements determine who is responsible for the renovation (the owner or the tenant). The ‘depth of energy renovation’, and consequently the cost, of the work needed depend on the degree of urbanisation which influences the building type and the age of the building. In countries such as Bulgaria, Croatia and Romania, where over 25% of low-income families live in their own houses in rural areas, it is difficult to expect citizens to undertake renovation work themselves. The same applies in Spain and Malta, where almost 8% of low-income families own flats in urban areas, and the UK, where almost 20% of low-income families own homes in such areas. The EU has a high proportion of owner-occupiers (over 70 % of the population). At national level, the proportion ranges from 97 % in Romania (it is also over 90 % in Hungary, Slovakia and Lithuania) to 53 % in Germany (Figures 7 and 8). Eastern European countries and the Baltic States have the highest proportions of owner-occupiers without an outstanding loan or mortgage; this accounts for between 96 % of homes in Romania to 64 % in Estonia. Western European countries had the highest proportions of homes with an outstanding loan or mortgage (between 62 % in Sweden and 28 % in Germany). 53 % of the low-income population are owner-occupiers and 13 % have mortgages or loans. These figures call for financing mechanisms such as on-bill financing that overcome the ‘up-front’ cost barrier by allowing repayment for energy renovation work through energy savings. 29 % of the EU population live in rented accommodation (in which they do not have a vested interest). 18 % pay market rents and 11 % pay reduced or no rent. Slovenia has the highest proportion (18.3 %) of the overall population paying reduced rents, followed by the UK (17.5 %). The lowest proportion is in Sweden (0.2 %). 18.4 % of EU citizens on low incomes pay reduced rents; the highest proportion is in Finland (36.3 %) and the lowest in Sweden (0.3 %). To ensure that energy renovation takes place in rented homes and to remove the ‘split incentives’ barrier, financing should be linked to properties and not individuals. The highest proportions of the population living in flats are in Estonia, Spain (both 65 %) and Latvia (64 %), while the lowest is in Ireland (4.7 %). Croatia (73 %), Slovenia (67 %), Romania (61 %) and Denmark (57 %) have the biggest proportions living in houses, while Malta has the smallest (4.5 %).(Figures 3.7 and 3.8). As almost 60 % of the EU population live in houses, mechanisms to ‘bundle’ properties so that larger-scale projects need to be developed.

46
Figure 3.7 Proportion of the population with incomes above 60% of median equalised income by building type, degree of urbanisation and tenure status (2012)
A - Building type and degree of urbanisation B - Tenure Status
Key point: Member States with per capita GDPs below the EU average had the highest proportions of the population living in flats. Source: Eurostat, distribution of population by degree of urbanisation, dwelling type and income group (source: SILC) [ilc_lvho01] http://appsso.eurostat.ec.europa.eu/nui/show.do?dataset=ilc_lvho01&lang=en
Key point: Member States with per capita GDPs below the EU average had the highest proportions of owners-occupiers. Source: Eurostat, distribution of population by tenure status, type of household and income group (source: SILC) [ilc_lvho02] http://appsso.eurostat.ec.europa.eu/nui/show.do?dataset=ilc_lvho02&lang=en

47
Figure 3.8 Proportion of the population with incomes below 60% of median equalised income by building type, degree of urbanisation and tenure status (2012)
A - Building type and degree of urbanisation B - Tenure Status
Key point: Member States with per capita GDPs below the EU average had the highest proportions of the population living in houses in rural areas. Source: Eurostat, distribution of population by degree of urbanisation, dwelling type and income group (source: SILC) [ilc_lvho01] http://appsso.eurostat.ec.europa.eu/nui/show.do?dataset=ilc_lvho01&lang=en
Key point: Member States with per capita below the EU average had the highest proportions of owners-occupiers with no mortgage. Source: Eurostat, distribution of population by tenure status, type of household and income group (source: SILC) [ilc_lvho02] http://appsso.eurostat.ec.europa.eu/nui/show.do?dataset=ilc_lvho02&lang=en

48
Chapter 4: The bumpy road to phasing out inefficient buildings
Highlights
• An energy renovation facilitator and a risk-sharing pool cascaded at different levels of governance are needed to design, implement, mobilise investments and monitor the EU energy renovation plan.
• Utility data must be unlocked and energy renovation costs made more transparent so that investment needs can be assessed and planning of the phase-out of inefficient buildings improved.
• Social discount rates to allow for preferential loans need to be used. Business-to-business (B2B) financing models need to be developed to create a self-sustained EU energy renovation market.
• A regional approach prioritising the less developed regions in Member States with per capita GDPs below the EU average is fundamental for the EU’s social and territorial cohesion strategy.
• Energy renovation ‘kits’ per construction period, climatic zone and building type need to be developed to speed up the phase-out of inefficient buildings and avoid the ‘lock-in-effect’.
The previous chapters have analysed the economic importance of the building sector and the impact of inefficient buildings on the EU 2020 climate, energy, and cohesion policies. This last chapter describes the challenges ahead for the Energy Union if an EU energy renovation plan is to be considered. It proposes a market-based blueprint for phasing out inefficient buildings. It is based on a literature review of best practice policies to boost investment for jobs and growth while addressing climate and energy challenges. Investment needs are estimated on the basis of available data from various EU-funded projects. The chapter concludes by reviewing the need for technological innovation so that the EU’s building stock can be renovated while preserving Europe’s exceptional architectural heritage.
The transformation of the EU building stock from being an energy waster to being an energy producer is one of the pillars of the energy union package aimed at achieving a resilient energy union with a forward-looking climate change policy (EC, 2015). Energy renovation is likely to be among the areas to benefit from the European Fund for Strategic Investments; this will support innovation and SMEs (EC, 2014-f), which make the biggest contribution to the economic value of the building sector (Chapter 1). Member States are required to take action at different levels of governance to foster investment in energy renovation. An EU energy renovation plan would involve integrating climate and energy, regional and cohesion, and investment policies into a single framework to ensure that the respective ‘policy communities’ (Figure 4.1) work together towards the common goal of a resilient and competitive energy union with a forward-looking climate change policy (OECD, 2012). Clear, coherent and decentralised governance of the building sector is a key for the design and implementation of the phase-out strategy. Horizontal and vertical coordination and monitoring will be needed (EC, 2012-a).

49
Figure 4.1 European Commission institutions involved in building-related policies
Key point: The multi-disciplinary approach needed to address various building-related issues has led to the involvement of different 'policy communities' at European Commission level.

50
A 2012 study commissioned by DG GROW on the competitiveness of the construction sector proposed that a dedicated task force be established to initiate, coordinate and monitor at different levels of governance the implementation of initiatives launched in the sector (EC, 2012-a). Also, in a report on jobs and growth (EC, 2014-d), DG REGIO identified a clear link between good governance and economic development. The report sees the governance issue as particularly relevant for cohesion policy. This would be particularly relevant for the EU energy renovation plan, as energy-efficiency improvements lack leadership (WBCSD, 2007) and the building sector suffers from fragmentation, with a plethora of uncoordinated private and public actors, often with conflicting interests and priorities (IEA-UNDP, 2013). An energy renovation facilitator would be needed if an EU renovation plan for phasing out inefficient buildings is to be considered as one means of implementing the energy union strategy.
Energy renovation strategies Phasing out inefficient buildings from the EU market will involve deep renovation of existing ones and the implementation of stringent energy requirements for new ones. To ensure the market uptake of the phase-out, solutions need to be technically feasible and economically viable (Box 4.1). The Energy Efficiency Directive defines cost-effective renovation as refurbishment that reduces both delivered and final energy consumption by a significant percentage as compared with pre-renovation levels, leading to a very high energy performance. Under the EED, Member States have been required to develop long-term strategies to mobilise investment in the renovation of their national building stocks. Furthermore, the Energy Performance of Buildings Directive EPBD — Directive 2010/31/EU) required Member States to set minimum energy performance requirements for buildings that undergo major renovation with a view to achieving optimum cost-efficiency. The EPBD defines ‘major renovation’ as renovation of which the total cost (for the building envelope and technical systems) is more than 25% of the value of the building (excluding the value of the land on which it stands) or affecting over 25% of its area. As regards new buildings, the EPBD provides a framework definition for ‘nearly zero energy buildings’ (nZEBs): buildings with very high energy performance where the very low amount of energy required is from renewable sources. The EPBD requested Member States to develop roadmaps to encourage the conversion of buildings into nZEBs. Analysis of the Member States’ energy renovation strategies and nZEB roadmaps (JRC, 2015-b) shows that most have made progress in:
i) gathering the data needed to draw up a renovation strategy; ii) designing and implementing a package of measures to renovate buildings; and iii) prioritising buildings to be renovated.
However, questions remain as to how ‘deeply’ we should renovate the EU’s building stock and how to finance energy renovation.

51
Box 4.1 Financial and economic parameters influencing the cost-effectiveness of energy renovation
The cost-effectiveness of energy-efficiency (EE) investment is highly dependent on the financial and economic parameters considered. Financial parameters influencing the cost-effectiveness of EE investment: The discount rate (DR) is the main financial parameter influencing investors’ choices; it takes two forms the financial discount rate (FDR) and the social discount rate (SDR). The financial discount rate is the opportunity cost of capital. We decide to use capital for one project and sacrifice another. The loss of income from the sacrificed project has an implicit cost. There are three main ways of determining the FDR:
• estimating the actual weighted average cost of capital; • establishing a maximum limit value for the FDR; and • considering the cut-off as a planning parameter.
The social discount rate (SDR) reflects society’s view as to how future benefits and costs should be evaluated as compared with the present. The SDR takes into account market failures in financial markets. There are various ways of determining the SDR:
• expecting marginal public investment to have the same return as private investment; • using estimates based on the predicted long-term growth of the economy; and • using variable rates over time.
Economic parameters influencing the cost-effectiveness of EE investment: The performance indicator used to assess the project is the main economic parameter that will influence the decision-maker. For EE investments, one of the following indicators is generally used
• internal rate of return (IRR); • pay-back time (PBT); • net present value (NPV); or • benefit/cost ratio (B/C).
Net present value (NPV) is the sum of the discounted net flows of a project; it represents the present net benefits flow generated by the investment. NPV is calculated using the following formula:
𝑁𝑁𝑁 = �𝑎𝑡𝑆𝑡
𝑛
𝑡=0
where:
St is the balance of cash flow at time t at is the discount rate chosen for discounting over time t
A positive NPV means that the project generates a net benefit, which is what investors look for. However, the balance of costs and benefits is usually negative in the first few years of the project. The choice of discount rate and time horizon are crucial for determining the NPV of a project. Internal rate of return (IRR) expresses the relative efficiency of an investment. It is the discount rate that zeroes out the NPV value of flows of costs and benefits of an investment, as given by the formula below:
𝑁𝑁𝑁 (𝑆) = �𝑆𝑡
1 + 𝐼𝐼𝐼𝑡= 0

52
IRR is independent of the size of the project, but is very sensitive to the economic conditions and the timing of benefits. IRR cannot be applied where time-varying discount rates are used, so the NPV is usually preferred. When details of the investors’ capital costs are not available, IRR can be used to give the threshold financial rate for the project. Payback time (PBT) is the period required to recover the cost of an investment. It is calculated as a ratio of the cost of the project to annualised cash flows. Typically, longer PBTs are not desirable for investors.
𝑁𝑎𝑃𝑃𝑎𝑃𝑃 𝑡𝑡𝑡𝑡 = 𝐶𝐶𝐶𝑡 𝐶𝑜 𝑡ℎ𝑡 𝑝𝑝𝐶𝑝𝑡𝑃𝑡
𝐴𝐴𝐴𝐴𝑎𝐴𝑡𝐶𝑡𝐴 𝑃𝑎𝐶ℎ 𝑜𝐴𝐶𝑓𝐶
PBT does not measure profitability, as it ignores the benefits that accrue after the payback period. It also ignores the time value of money. Benefit/cost ratio (B/C) is the present value of project benefits divided by the present value of project costs.
𝐵𝐶
= 𝑁𝑁 (𝐼)𝑁𝑁 (𝑂)�
where ' I' is the inflows and O the outflows. If B/C >1, the benefits measured by the present value of the total inflows are greater than the costs, measured by the present value of total outflows. The project is therefore suitable for investors. Like IRR, B/C is independent of the size of the investment. It rewards low-cost projects and is not appropriate for mutually exclusive projects, as it does not take account of the total amount of net benefits. Impact of discount rate choices on the cost-effectiveness of EE investment: To illustrate the impact of the discount rate on the attractiveness of energy renovation, we calculated the NPV for the renovation of 11 buildings using discount rates of 5%, 10%, 15% and 20%. The attractiveness of the projects for investors is very sensitive to the discount rate chosen (Figure 4.2). With a discount rate of 5%, the 11 projects would have a positive NPV, making them all attractive to investors. However, with a rate of 10%, five of the 11 projects would have a negative NPV and would not be attractive to investors. Figure 4.2 Impact of discount rate choices on the cost-effectiveness of energy renovation
Key point: The higher the discount rate, the less attractive energy renovation is to investors.

53
The higher the discount rate, the less attractive energy renovation would be for investors. When competing with alternative investment opportunities close to 20% (e.g. other energy investments), less than half of the projects would be attractive to investors. To make the 11 projects attractive, the capital cost should be 5%, which is close to the social discount rate. Source: (JRC, 2015-a).
Age profile of the building The beauty of Europe’s building stock comes at a cost. Much residential housing in the EU was built before energy performance requirements applied. The first energy codes for buildings were introduced in response to the oil crisis in the 1970s (IEA-UNDP, 2013), when 66 % of the current EU building stock had already been built. The UK, Denmark, Sweden, France, the Czech Republic and Bulgaria are among the Member States with the oldest residential buildings. The age profile of a building is a big factor in estimating the depth of energy renovation, as the baseline for calculating energy savings potential depends of the current energy performance of the building. Age profile is also important from an industrial perspective, as the technological solutions to be implemented will differ according to when a building was built. There is a need to develop and market energy renovation ‘kits’ tailored to construction periods, climatic zones and building types. For consistency of the analysis across Member States when assessing energy savings potential and investments needs, we considered three different construction periods (JRC, 2015-b):
• Before 1945: This period includes all dwellings built before the post-World War II building wave. These were built with materials and techniques reflecting local conditions. Their design often incorporated energy-sufficiency measures (e.g. bioclimatic design), so they waste less energy;
• 1945 to 1980: Homes built in this period are the least efficient. They were built with the first industrial techniques and prior to the introduction of energy-efficiency requirements in most Member States. Some Member States brought in building energy codes after the oil crisis, but the requirements were not very stringent and most countries did not check for compliance (IEA-UNDP; 2013); and
• After 1980: In this period, all Member States introduced building energy codes as the main policy instrument to reduce the energy consumption of new buildings. From 2002, the EPBD required Member States to apply energy code provisions to existing buildings that undergo major renovation. The EPBD recast harmonised methodologies for calculating buildings’ energy performance across Member States and introduced the calculation of energy requirements on the basis of a methodology for determining optimum cost-efficiency (EC, 2012-c).

54
The affordability of energy renovation for EU citizens (see Chapter 3) faces an additional challenge, especially in Member States with per capita GDPs below the EU average. Most dwellings constructed between 1945 and 1980, the worst period from an energy perspective, are owner-occupied (Figure 4.3). This is particularly true in eastern and Baltic Member States, where over 80% of the population own a home built in this period. On the other hand, the fact that a high proportion of buildings in these Member States was constructed in the same period should simplify the training of workforces, as the energy renovation ‘kits’ to be developed for these climates and construction period will not vary significantly.
Figure 4.3 Tenure status of dwellings and their construction period
Key point: Member States with per capita GDPs below the EU average have the highest proportions of the population owning buildings constructed between 1945 and 1980 (when energy requirements did not apply in most Member States). Source: Eurostat, owner-occupied dwellings by type and year of construction of the building [cens_01ndpercons] http://appsso.eurostat.ec.europa.eu/nui/show.do?dataset=cens_01ndpercons&lang=en

55
Blueprint for phasing-out inefficient buildings Inefficient buildings can be phased out essentially using either a cost-based (more market-oriented) or quota-based (control type) approach to regulation (Pearce & Pizer). The choice of approach will have a substantial effect on the welfare distribution of the benefits and on the social distribution of the burdens among the various stakeholders (owners of various building types, age groups and across the Member States) (see Annex1). In the case of energy renovation, the regulator faces, on one hand, the challenge of imperfect information on energy consumption of buildings and the cost of energy renovation, on the other hand, the need to comply with 'better regulation' and placing minimum burdens on the citizens, on the other. Deep renovation will be taken up by the market only if the technological solutions to be implemented are technically feasible and economically viable (Box 4.1) for the stakeholders involved in the renovation plan. In a preliminary attempt to assess the energy savings potential that could be realised and investment needs by construction period, we considered two different scenarios:
• the ‘market scenario’, which is based on solutions currently achievable in the course of renovation; and
• the ‘nZEB scenario’, which is based on maximising energy savings and minimising investment over the lifetime of the building.
A broad range of technological solutions for building energy renovation has been systematically collected in the course of various EU-funded projects (e.g. nZEB 8 , Entranze 9 …). The most comprehensive of these cover reference buildings in selected cities in all climate zones in Europe and set out various energy renovation options, with investment costs and resulting energy performance. However, they do not refer to the economic feasibility in the context of the building stock of the Member State in question. This will have to be taken into account in any move towards an EU-level approach, so that efforts at EU and Member State level can be harmonised further. In this report, we consider only those deep renovation options that make economic sense, are feasible and cost no more than 25 % of the value of the building(s). We assumed that, above this level, it might be more sensible to construct a completely new building than to renovate the existing one. Investment needs were calculated on the basis of an average 100 m2 for houses and 75 m2 for apartments and average of housing prices in individual Member States (Figure 4.4). Given these parameters, ‘economically feasible’ technological solutions are those costing no more than € 300/m2
in Member States dominated by well-established property markets and € 500/m2 in those with less mature property markets. From the broad range of options, only those costing less than € 300/m2 or € 500/m2 were considered.
8 http://ec.europa.eu/energy/sites/ener/files/documents/nzeb_full_report.pdf 9 http://www.entranze.eu/

56
Figure 4.4 Average home prices in selected Member States
Key point: Energy renovation costs should be lower than 25% of the value of the home. Source: Eurostat, Living conditions - cities and greater cities [urb_clivcon] http://appsso.eurostat.ec.europa.eu/nui/show.do?dataset=urb_clivcon&lang=en
In the economic projection of the saving potentials and their associated costs we used the above described economically feasible renovation options in the so called ‘market scenario’, and the range of renovation options with at least the same saving potential in the nZEB scenario. In the ‘market scenario’, repair/restoration is the cheapest renovation option up to 2020. It is therefore expected that a market-driven policy focusing on incremental costs would initially lead to only the cheapest work being carried out. The potential savings at the median of the renovation cost range (i.e. € 240/m2) reach half of total potential savings in the nZEB scenario and almost a third of

57
those in the market scenario. If the EU 2020 and 2030 climate and energy targets are to be achieved, there needs to be a focus on energy renovation measures not entailing excessive cost (in the steeply rising part of the marginal abatement cost (MAC) curve – see Annex I). These would cover three quarters of the pre-1945 building stock (Figure 4.5). However, buildings constructed before 1945 are not the biggest energy wasters (see previous section). At costs below € 200/m2, deep renovation of post-1945 buildings would be economically feasible only for the countries that have joined the EU since 2004, France, the Benelux states, the UK and Ireland. In Mediterranean countries, potential savings represent less than 5 % of the total for all three construction periods. Germany and Italy have the highest marginal costs, as unit costs of renovation are highest (€ 250-450/m2). The PRIMES model used for the impact assessment (EC, 2014-g) puts potential savings from building renovation at 21.8 % in 2020, 40.7 % in 2030 and 42.7 % in 2050. Achieving these savings using the cheapest renovation options would mean that post-1945 buildings in Germany, Italy and Spain would be the last to be renovated, as their renovation is at the top of the cost curves (Figure 4.5). Cost-effective energy renovation (at € 240/m2) will be very unevenly distributed across countries. Eastern European and oceanic climate countries (France, Benelux, UK and Ireland) would be able to renovate most of their building stock before 2020. However, energy renovation is not affordable for citizens in countries with per capita GDPs below the EU average (see Chapter 3), despite lower investment needs, particularly with the proportion of owner-occupiers in some eastern countries exceeding 90 %. An EU energy renovation fund acting as a risk sharing pool primarily targeting these countries is therefore needed to meet various EU 2020 targets. Additional support measures are needed in Germany, Italy and Spain to make energy renovation cost-effective across construction periods. Care needs to be taken in interpreting these findings, as several assumptions were made to compensate for the lack of data on energy consumption and renovation. In order to better assess investment needs, utilities should unlock energy consumption data and the construction industry should be more transparent about energy renovation costs. In the ‘market scenario’, energy renovation of buildings constructed before 1945 was limited to repair/restoration-type works (e.g. replacement of boilers). For buildings constructed after 1945, energy renovation work additionally included wall insulation (the thickness depends on the climate zone) and replacement of windows by more efficient ones. In the ‘nZEB scenario’, all buildings are renovated to the nZEB level as defined in the country in question. Potential savings are almost equal in both scenarios. However, marginal costs are almost two times higher in the ‘market scenario’, as compared with the ‘nZEB scenario’, especially at the higher end of the MAC. Investments needs are proportionally 50 % lower in the nZEB scenario at the higher end of the MAC (Figure 4.6).

58
Figure 4.5 Savings potential in residential buildings by construction period
Key point: The most cost-effective energy renovation is in buildings located in countries that have joined the EU since 2004.
Key point: Energy renovation is less cost-effective in Spain, Germany and Italy.
Key point: Energy renovation is less cost-effective in Germany and Italy.

59
Figure 4.6 Comparative analyses for nZEB and market renovation scenarios
Key point: nZEB renovation requires proportionally lower investments, but the costs increase incrementally for the overall EU building stock.
Financing energy renovation As policy-makers, market stakeholders and financial institutions (EEFIG, 2015) have pointed out, financing energy renovation is a core challenge for Europe. Numerous financing instruments exist at the EU level (Figure 4.7) and the exact amount to be allocated for energy renovation was difficult to quantify at the time of drafting this report. The available information shows that an important share of European funds is devoted to low carbon investments by the EU, EIB and various EU stakeholders. The common feature of these funds is that energy efficiency is amongst their priority objectives, however, it is difficult to quantity the part that is dedicated for building renovation. With the proposed building renovation market scenario the various finance segments directed to energy efficiency will be easier to track and monitor enabling to measure their effectiveness. This is a prerequisite for the long term functioning of a cost-effective EU and Member State level building renovation framework. Analyses of national energy renovation strategies show that most Member States are looking at policy packages that include regulatory measures, financial incentives, information tools and (in the most advanced) demonstration nZEB projects. There is also a shift from grants to preferential loans, risk-sharing facilities and business-to-business (B2B) financing schemes (JRC, 2015-b).

60
Figure 4.7 EU and EIB funds to support investments in low-carbon economy
Key point: Existing funding would need to be bundled into a well-tailored EU energy renovation fund to provide a better estimate of the funding available for energy renovation. Source: Compiled by the authors from various EU sources The fact that citizens cannot afford energy renovation, especially in Member States with per capita GDPs below the EU average (see Chapter 3), calls for existing funds to be merged into a well-tailored EU energy renovation fund acting as a risk-sharing pool to provide the initial financing package to support Member States’ renovation strategies. The aim is to make Member States’ strategies viable by reducing the perceived risk of energy efficiency, building the requisite technical capacity and enhancing technological innovation. Given the scale of the investment needs, a blend of public and private funds will be needed and consideration should be given to balancing the risks and benefits of energy renovation investment by means of the appropriate discount rate (Box 4.1) and a risk-sharing pool (EEFIG, 2015). Creating a self-sustaining energy renovation market that does not need public subsidies will also involve moving away from business-to-consumer (B2C) to business-to-business (B2B) models by using on-bill financing, whereby investment is paid back from the savings made over time by the user of the building. On-bill financing allows home-owners to pay for energy renovation investments via the savings made through attaching the repayments to the buildings’ bills. This removes the ‘split-incentive’ barrier in the case of rented homes. On-bill financing also removes the ‘up-front cost’

61
barrier by offering the possibility to lend to a cluster of companies delivering energy renovation projects, rather than providing loans and grants to consumers (B2C). Lending to SMEs (clusters of accredited energy renovation companies) will allow for B2B models to be established, thus eliciting the long-term investment needed for energy renovation. This should mean that the combined challenge of sub-optimal demand for energy-efficiency investment and a lack of supply in terms of appropriate financial instruments to attract decision-makers can be overcome (IEA, 2013).
Technological innovation needs The energy renovation of the EU’s building stock will require energy renovation ‘kits’ tailored to specific construction periods, building types and climatic zones. The need for technological innovation to ensure deep renovation was identified by the stakeholders involved in the integrated roadmap (JRC, 2014). The roadmap proposes the development of:
i) manufactured modular ‘plug-and-play’ components and systems fully integrated with advanced 3D surveying techniques;
ii) innovative insulation solutions to address cold-bridges and improve the airtightness of the building envelope;
iii) highly efficient thermal energy storage for use in buildings; and iv) energy systems and controls to better monitor the energy performance of the building.
Converting the EU’s building stock from being an energy waster to being an energy producer will also require new technologies to enable effective building-to-building and building-to-grid interaction. Over time, buildings need to become smart, as they will be connected to storage systems, smart grids and vehicles/transport systems. Some of the technologies needed for the transformation of the EU's building stock are already available in the market. However, their diffusion varies across Member States due to their high cost and a lack of market actors' awareness about the savings potential of the best available technologies. This is particularly true for the combined solutions built considering the system approach. Training workforces on the installation and the use of integrated solutions is a prerequisite to ensure a better a better diffusion of these technologies. Building on the integrated roadmap of the Strategic Energy Technology (SET) developed by the EC and various stakeholders (JRC, 2014), Horizon 2020 research programme for secure, clean and efficient energy gives a particular attention to the technology needs related to the building sector. These technological developments should be integrated to the EU energy renovation plan to ensure that cost-effective and highly efficient integrated technologies are made available on time. Overall, energy renovation will foster technological innovation across the value chain of the building sector (Table 4.1). This should increase its economic value and allow for better gender and age balances (Chapter 1).

62
Table 4.1 Technological innovation needs by economic activity in the building sector’s value chain
Economic activity Building component and or systems
Technology
Floor and wall covering Building envelope Advanced insulation material such as VIPs for nZEBs and space constrained applications Air sealing testing methodologies Reflective surfaces for roofing materials for southern Europe and dense urban areas.
Painting and glazing Windows Double low-e, low conductive frames Triple glazing for northern Europe with low-e and low conductive frames Energy plus windows with dynamic solar control and glass that optimise daylight Automatic solar controls and exterior solar shades and blinds with low e-film and high insulation
Plastering, joinery installation Joinery Air sealing Plumbing, heat, electrical and air conditioning installation
Heating systems Active solar thermal systems fully integrated to buildings Thermal Energy Storage (TES) materials and full systems with integrated ICT
Heating, cooling and hot water systems
Cost-efficient heat pumps
Heating, cooling and electricity production
Efficient and smart CHP
Cooling systems Sorption cooling systems driven by hot water
Building completion and finishing
Energy management Building Information and Management (BIM)
ICT for grid integration and consumers' information
Key point: Energy renovation will foster technological innovation. Source: Compiled by the authors from the integrated roadmap (JRC, 2014)

63
Conclusions Phasing-out inefficient buildings from the EU building stock should be one of the pillars of the ‘renaissance of EU industry’. A policy framework, or in short an EU energy renovation plan, will be needed. It should combine the existing EU 2020 policies regarding the:
• smart, sustainable and inclusive growth (EC, 2010-a), by enhancing the building sector’s prominent role in the EU economy;
• climate and energy targets (EC, 2014-c), by reducing energy demand and consumption in the building sector. Consequently, Europe’s energy dependency will be reduced and resources will be freed up for further investment targeting growth, innovation and jobs. It will also be easier to meet the EU’s climate targets if the impact from buildings is mitigated; and
• social and territorial cohesion policy (EC, 2014-d), by ensuring access to energy services (heating and cooling ) for all EU citizens, especially in Member States with per capita GDPs below the EU average.
Such framework stimulates cross-policy initiatives and the development of new partnership models between policy-makers, financial institutions and the construction sector. The objective shall be to create a self-sustained EU energy renovation market by implementing the EU energy renovation plan. Overall, the aim is to better exploit the potential of the building sector in delivering sustainable growth and local job creation in Europe, while transforming the building stock from being an energy waster to being an energy producer. Energy renovation is the trump card for the European Energy Union. Consideration should be given to establishing a clear, coherent and decentralised governance structure, including an EU energy renovation facilitator and a risk-sharing pool cascaded at different levels of governance as a hub for energy renovation investment and technological innovation. Energy renovation is a stabiliser for the building sector and consequently the overall EU economy. However, the road to a fully functional energy renovation market is still bumpy. The assessment of the investments needs is still difficult due to imperfect information about energy renovation costs and building's energy performance data. Utility data must therefore be unlocked and energy renovation costs made more transparent. A regional tailored approach needs to be considered when developing the EU renovation plan. Less developed regions in Member States with per capita GDPs below the EU average should be prioritised. Improving the quality of buildings should not be the privilege of a minority and efficient buildings should become the offer for all EU citizens.

64
Annex I: Analytical framework
Cost based regulation means giving incentives to set "cost caps" or maximum renovation costs in order to give the market incentives to carry out the renovation of the building stock for which it is the cheapest. "Quota based" regulation sets targets or percentages of building stock to be renovated. However the effects of these policies cannot be estimated until the range of marginal cost function of supply is not approximated (Pearce & Pizer). Economic theory gives references for certain cases where the regulator has imperfect information about the position and gradient of cost functions for the abatement options. The standard assumptions of mainstream economic theory (i.e. access to perfect information for all stakeholders) guarantee that an optimum can be found in all regulatory cases. Standard and taxation-type regulation both achieve the least cost or optimum (carbon) emission/renovation level (Figure A1.1). However, applying a more realistic assumption of asymmetric access to information for the regulator and the regulated on the production (and consequently the mitigation) cost structure changes this optimum level. The theory and case studies highlight that the regulator usually underestimates the costs of abatement (mainly because market player have an incentive not to reveal all the profit from their activities). The efficiency of regulation from the point of view of environmental economics depends on the relative positions of the marginal abatement cost curve (MAC) and the marginal external cost curve (MEC). The MEC function shows the external costs linked to each unit of additional production, while the MAC function gives an order of the costs of available options for reducing the external effects (emissions) of a certain activity. In the case of building renovation, the MEC shows the additional cost linked to greenhouse gas emissions due to unnecessarily high energy consumption as a result of insufficient insulation. The MAC function is composed of the unit costs, in decreasing order, of the various options for reducing these emissions from fuels. Today, the lower-end MAC function (cheaper option) is probably shallow renovation for the building stock for which deep renovation is not feasible (e.g. old, protected buildings in city centres). As the deep building renovation options come in the marginal orders, the unit cost of renovation increases. Typically, the regulator under- or over-estimates the abatement costs (see the position of the MACexp function in the graph below the MACtrue) and the implementation of the measures results in quite different social losses. If the regulator over-estimates the gradient or the position of the cost function, the ‘quota-based’ measures will result in bigger social welfare losses (represented by the red triangle in the graph) than the ‘cost-cap-based’ approach. All these options are very complex. They can be further subdivided and arranged by the incremental order of costs. Their availability also varies by building type and age group, and country by country. At present, there is insufficient information available to organise all the options for building renovation in a marginal order. Also, that would go beyond scope of this study. While it is still a very complex task, it is possible, on the basis of some rational assumptions, to calculate an initial

65
approximation of the potential costs for a limited subset of building stocks differentiated according to three age groups for 10 reference cities. Quotas or cost caps can be set effectively only if the market and the regulators have a good approximation of the marginal costs of building renovation.
Figure A 1.1 regulation under uncertainty

66
Annex II: Map catalogue
Map A2.1 Regional contribution to the national GDP in 2011. The map shows the second-level NUTS of the European Union. Presented values are the percentage of the DGP produced by the region comparing to the national total of each member state.
Map A2.2 Contribution of the building sector to regional employment in 2011. The map shows the second-level NUTS of the European Union. Presented values are the percentage of the persons employed in the building sector within the non-financial business economy by the member states.
Map A2.3 Electricity consumption per inhabitants in 2012, regarding the residential sector.
Map A2.4 Gas consumption per inhabitants in 2012, regarding the residential sector.
Map A2.5 Heat consumption per inhabitants in 2012, regarding the residential sector.
Map A2.6 National and European distribution of energy carrier used for heating in residential sector in 2012.
Map A2.7 Proportion of final gas consumption in buildings comparing to the national total gas consumption in 2010.
Map A2.8 Proportion of final gas consumption in buildings comparing to the national total gas consumption in 2011.
Map A2.9 Proportion of final gas consumption in buildings comparing to the national total gas consumption in 2012.
Map A2.10 Origin of gas import in 2010. The size of the pie chart symbolizes the total imported gas volume as 100%.
Map A2.11 Origin of gas import in 2011. The size of the pie chart symbolizes the total imported gas volume as 100%.
Map A2.12 Origin of gas import in 2012. The size of the pie chart symbolizes the total imported gas volume as 100%.
Map A2.13 Gas import of EU member states from other member(s) of the EU in 2011
Map A2.14 Gas import of EU member states from Russia in 2011
Map A2.15 Gas import of EU member states from Norway in 2011
Map A2.16 Gas import of EU member states from out of the European continent in 2011
Map A2.17 Estimated carbon intensity of the non-residential sector based on national GDP and reported CO2 emission of the non-residential sector in 2012.
Map A2.18 CO2 emission of residential sector per inhabitants in 2012.
Map A2.19 CO2 emission of residential sector per square-metres in 2012.
Map A2.20 Proportion of inhabitants who are unable to keep their home adequately warm in winter
Map A2.21 Proportion of inhabitants who are living in a dwelling not comfortably cool in summer
Map A2.22 Impact of degree of urbanisation on households' energy expenditures - share of energy consumption expenditure in consumption expenditure of households (electricity, gas and other fuels) regarding densely populated areas in the year 2010.
Map A2.23 Impact of degree of urbanisation on households' energy expenditures - share of energy consumption expenditure in consumption expenditure of households (electricity, gas and other fuels) regarding towns and suburbs in the year 2010.
Map A2.24 Impact of degree of urbanisation on households' energy expenditures - share of energy consumption expenditure in consumption expenditure of households (electricity, gas and other fuels) regarding rural areas in the year 2010.
Map A2.25 Proportion of the population with arrears on utility bills in 2012.
Map A2.26 Proportion of the population with incomes above 60% of median equalised income and their distribution regarding their living environment (degree of urbanisation and building type) in 2012.
Map A2.27 Proportion of the population with incomes above 60% of median equalised income and the distribution regarding the tenure status of this group of inhabitants in 2012.
Map A2.28 Proportion of the population with incomes below 60% of median equalised income and their distribution regarding their living environment (degree of urbanisation and building type) in 2012.
Map A2.29 Proportion of the population with incomes below 60% of median equalised income and the distribution regarding the tenure status of this group of inhabitants in 2012.
Map A2.30 Proportion of properties where the owner is living in the dwellings in 2012. The map also shows the typical construction periods of the building stock in most of the EU member states.

67
Map A2.1 Regional contribution to the national GDP in 2011. The map shows the second-level NUTS of the European Union. Presented values are the percentage of the DGP produced by the region comparing to the national total of each member state.

68
Map A2.2 Contribution of the building sector to regional employment in 2011. The map shows the second-level NUTS of the European Union. Presented values are the percentage of the persons employed in the building sector within the non-financial business economy by the member states.

69
Map A2.3 Electricity consumption per inhabitants in 2012, regarding the residential sector.

70
Map A2.4 Gas consumption per inhabitants in 2012, regarding the residential sector.

71
Map A2.5 Heat consumption per inhabitants in 2012, regarding the residential sector.

72
Map A2.6 National and European distribution of energy carrier used for heating in residential sector in 2012.

73
Map A2.7 Proportion of final gas consumption in buildings comparing to the national total gas consumption in 2010.

74
Map A2.8 Proportion of final gas consumption in buildings comparing to the national total gas consumption in 2011.

75
Map A2.9 Proportion of final gas consumption in buildings comparing to the national total gas consumption in 2012.

76
Map A2.10 Origin of gas import in 2010. The size of the pie chart symbolizes the total imported gas volume as 100%.

77
Map A2.11 Origin of gas import in 2011. The size of the pie chart symbolizes the total imported gas volume as 100%.

78
Map A2.12 Origin of gas import in 2012. The size of the pie chart symbolizes the total imported gas volume as 100%.

79
Map A2.13 Gas import of EU member states from other member(s) of the EU in 2011.

80
Map A2.14 Gas import of EU member states from Russia in 201.1

81
Map A2.15 Gas import of EU member states from Norway in 2011.

82
Map A2.16 Gas import of EU member states from out of the European continent in 2011.

83
Map A2.17 Estimated carbon intensity of the non-residential sector based on national GDP and reported CO2 emission of the non-residential sector in 2012.

84
Map A2.18 CO2 emission of residential sector per inhabitants in 2012.

85
Map A2.19 CO2 emission of residential sector per square-metres in 2012.

86
Map A2.20 Proportion of inhabitants who are unable to keep their home adequately warm in winter.

87
Map A2.21 Proportion of inhabitants who are living in a dwelling not comfortably cool in summer.

88
Map A2.22 Impact of degree of urbanisation on households' energy expenditures - share of energy consumption expenditure in consumption expenditure of households (electricity, gas and other fuels) regarding densely populated areas in the year 2010.

89
Map A2.23 Impact of degree of urbanisation on households' energy expenditures - share of energy consumption expenditure in consumption expenditure of households (electricity, gas and other fuels) regarding towns and suburbs in the year 2010.

90
Map A2.24 Impact of degree of urbanisation on households' energy expenditures - share of energy consumption expenditure in consumption expenditure of households (electricity, gas and other fuels) regarding rural areas in the year 2010.

91
Map A2.25 Proportion of the population with arrears on utility bills in 2012.
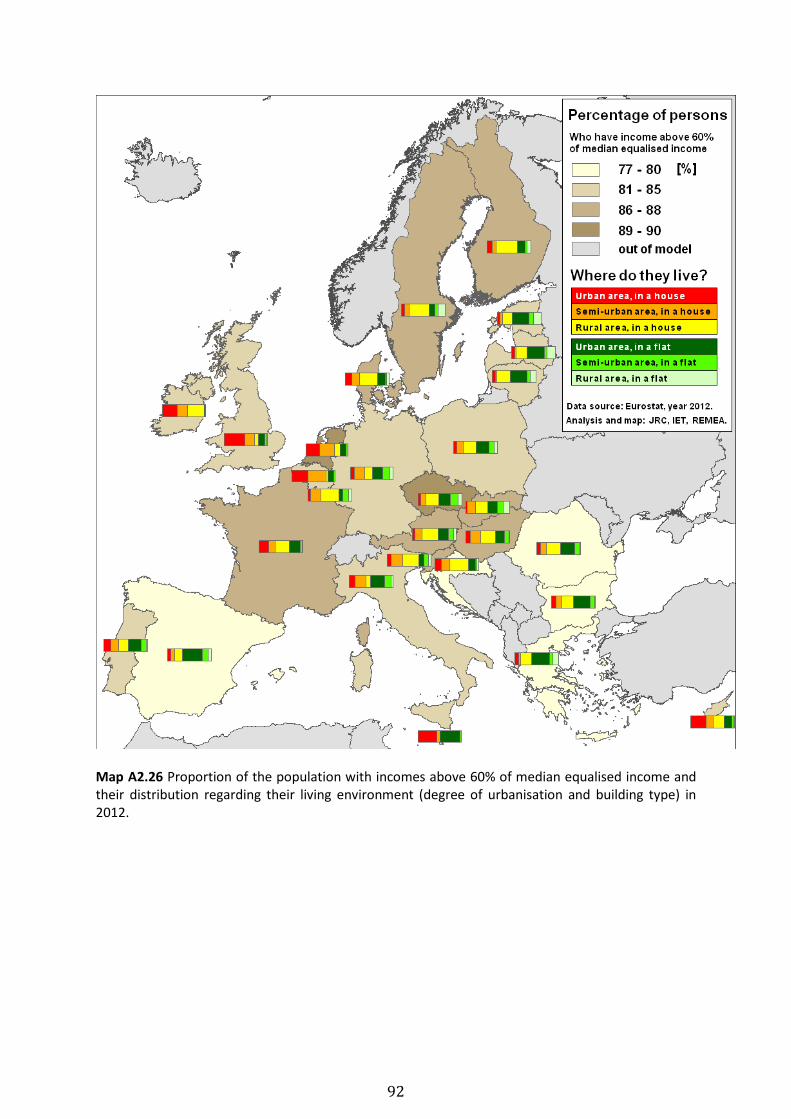
92
Map A2.26 Proportion of the population with incomes above 60% of median equalised income and their distribution regarding their living environment (degree of urbanisation and building type) in 2012.

93
Map A2.27 Proportion of the population with incomes above 60% of median equalised income and the distribution regarding the tenure status of this group of inhabitants in 2012.

94
Map A2.28 Proportion of the population with incomes below 60% of median equalised income and their distribution regarding their living environment (degree of urbanisation and building type) in 2012.

95
Map A2.29 Proportion of the population with incomes below 60% of median equalised income and the distribution regarding the tenure status of this group of inhabitants in 2012.

96
Map A2.30 Proportion of properties where the owner is living in the dwellings in 2012. The map also shows the typical construction periods of the building stock in most of the EU member states.

97
Annex III: Glossary
A Air sealing: these are an indication of future construction activity in terms of useful floor area or an alternative size measure. A building permit is an authorisation to start work on a building project. As such, a permit is the final stage of planning and building authorisations from public authorities, prior to the start of work. Source Eurostat: http://ec.europa.eu/eurostat/cache/metadata/en/sts_esms.htm B Building permit indices (square metres of useful floor area): these are an indication of future construction activity in terms of useful floor area or an alternative size measure. A building permit is an authorisation to start work on a building project. As such, a permit is the final stage of planning and building authorisations from public authorities, prior to the start of work. Source Eurostat: http://ec.europa.eu/eurostat/cache/metadata/en/sts_esms.htm Bioclimatic design principles: is about that taking into account the climate and environmental conditions when designing a building. The objective is to reach cohesion between design and natural elements (such as the sun, wind, rain and vegetation), leading to an optimisation of the use of natural resources to achieve the required comfort level. C Cascaded governance structure is a cross-level (EU, national, regional and local) collaborative governance structure D Derived heat: Derived heat covers the total heat production in heating plants and in combined heat and power plants. It includes the heat used by the auxiliaries of the installation which use hot fluid (space heating, liquid fuel heating, etc.) and losses in the installation/network heat exchanges. For auto producing entitles (= entities generating electricity and/or heat wholly or partially for their own use as an activity which supports their primary activity) the heat used by the undertaking for its own processes is not included. Source Eurostat District heating system is a system for distributing heat generated in a centralized location for residential and non-residential heating requirements such as space heating and water heating. The heat is often obtained from a cogeneration plant burning fossil fuels but increasingly also biomass, although heat-only boiler stations, geothermal heating, heat pumps and central solar heating are also used, as well as nuclear power. District heating plants can provide higher efficiencies and better pollution control than localised boilers. Double low-e, low conductive window frames are well insulated windows E Energy carrier is either a substance or a phenomenon that can be used to produce mechanical work or heat or to operate chemical or physical processes. It is any system or substance that contains energy for conversion as usable energy later or somewhere else. This could be converted for use in, for example, an appliance or vehicle

98
Energy plus Windows are windows producing energy Energy renovation kits are technological solutions to implement in order to improve energy performance of buildings L Lock-in-effect is a result of the implementation of low hanging fruit solutions when buildings are renovated. N Number of persons employed: The number of persons employed is defined as the total number of persons who work in the observation unit (including working proprietors, partners working regularly in the unit and unpaid family workers), and those working outside the unit who belong to it and are paid by it (e.g. sales representatives, delivery personnel, repair and maintenance teams). Source Eurostat: http://ec.europa.eu/eurostat/cache/metadata/en/sts_esms.htm O On-bill financing is a financial product provided by a third party for energy efficiency improvements and repaid via energy savings on utility bills. S Sorption cooling system is cooling system that a heat source (e.g., solar energy, a fossil-fueled flame, waste heat from factories, or district heating systems) which provides the energy needed to drive the cooling process. T Thermal Energy Storage (TES) allows excess thermal energy to be collected for later use, hours, days or many months later, at individual building, multiuser building, district, town or even regional scale depending on the specific technology. Storage mediums include heat or cold produced with heat pumps from off-peak and lower cost electricity and from combined heat and power plants as well as heat produced by renewable electrical energy. Water or ice-slush and other aquifers could also be used to produce the heat. V VIPs (vacuum insulated panel) is a form of thermal insulation consisting of a nearly gas-tight enclosure surrounding a rigid core, from which the air has been evacuated. It is used in building construction to provide better insulation performance than conventional insulation materials.

99
References
ECORYS et al., 2010, Sustainable competitiveness of the construction sector, http://ec.europa.eu/enterprise/sectors/construction/studies/sustainable-competitiveness_en.htm Age UK, 2013, The cost of cold http://www.ageuk.org.uk/Documents/EN-GB/Campaigns/The_cost_of_cold_2012.pdf?dtrk=true EC, 2009-a, The functioning of retail electricity markets for consumers in the European Union, DG SANCO, http://ec.europa.eu/consumers/archive/consumer_research/market_studies/docs/retail_electricity_full_study_en.pdf EC, 2009-b, Directive 2009/72/EC of the European Parliament and of the Council of 13 July 2009 concerning common rules for the internal market in electricity http://eur-lex.europa.eu/LexUriServ/LexUriServ.do?uri=OJ:L:2009:211:0055:0093:EN:PDF
EC, 2010-a, EUROPE 2020. A European strategy for smart, sustainable and inclusive growth http://ec.europa.eu/eu2020/pdf/COMPLET%20EN%20BARROSO%20%20%20007%20-%20Europe%202020%20-%20EN%20version.pdf EC, 2010-b, Directive 2010/31/EU of the European Parliament and of the Council of 19 May 2010 on the energy performance of buildings (recast) http://eur-lex.europa.eu/legal-content/EN/TXT/PDF/?uri=CELEX:32010L0031&from=EN EC, 2012-a, Strategy for the sustainable competitiveness of the construction sector and its enterprises, Communication from the Commission to the European Parliament and the Council, http://ec.europa.eu/enterprise/sectors/construction/studies/sustainable-competitiveness_en.htm EC, 2012-b, Energy Efficiency Directive, Directive 2012/27/EU of the European Parliament and of the Council of 25 October 2012 on energy efficiency http://eur-lex.europa.eu/legal-content/EN/TXT/PDF/?uri=CELEX:32012L0027&from=EN EC, 2012-c, Commission Delegated Regulation (EU) No 244/2012 of 16 January 2012 supplementing Directive 2010/31/EU of the European Parliament and of the Council on the energy performance of buildings by establishing a comparative methodology framework for calculating cost-optimal levels of minimum energy performance requirements for buildings and building elements http://eur-lex.europa.eu/legal-content/EN/TXT/PDF/?uri=CELEX:32012R0244&from=EN EC, 2014-a, In-depth study of European energy security accompanying the Communication from the Commission to the Council and the European Parliament on a European energy security strategy http://ec.europa.eu/energy/doc/20140528_energy_security_study.pdf EC, 2014-b, Energy prices and costs report accompanying the Communication from the Commission to the European Parliament, the Council and the European Economic and Social Committee of the regions on Energy prices and costs in Europe http://ec.europa.eu/energy/doc/2030/20140122_swd_prices.pdf

100
EC, 2014-c, Policy framework for climate and energy for the period between 2020 and 2030 http://eur-lex.europa.eu/legal-content/EN/TXT/PDF/?uri=CELEX:52014DC0015&from=EN EC, 2014-d, Investment for jobs and growth: Promoting development and good governance in EU regions and cities. 6th report on economic, social and territorial cohesion. http://ec.europa.eu/regional_policy/sources/docoffic/official/reports/cohesion6/6cr_en.pdf EC, 2014-e, European Energy Security Strategy, Communication from the Commission to the European Parliament and the Council. http://eur-lex.europa.eu/legal-content/EN/TXT/PDF/?uri=CELEX:52014DC0330&from=EN EC, 2014-f, An investment plan for Europe, Communication from the Commission to the European Parliament and the Council. http://eur-lex.europa.eu/legal-content/EN/TXT/PDF/?uri=CELEX:52014DC0903&from=EN EC, 2014-g, Energy Efficiency and its contribution to energy security and the 2030 framework for climate and energy policy https://ec.europa.eu/energy/sites/ener/files/documents/2014_eec_ia_adopted_part1_0.pdf EC, 2015, Energy union package, a framework strategy for a resilient energy union with a forward-looking climate change policy, European energy security strategy, Communication from the Commission to the European Parliament and the Council. http://ec.europa.eu/priorities/energy-union/docs/energyunion_en.pdf ECORYS et al., 2012, study on a Lead market initiative — assessing the impact of national recovery measures on construction in the EU-27 http://bookshop.europa.eu/it/study-lead-market-initiative-assessing-the-impact-of-national-recovery-measures-on-construction-in-the-eu-27--pbNB0214408/ EEFIG, 2015, Energy efficiency, the first fuel for the EU economy. How to drive new finance for energy-efficiency investments https://ec.europa.eu/energy/sites/ener/files/documents/Final%20Report%20EEFIG%20v%209.1%2024022015%20clean%20FINAL%20sent.pdf Eurostat, 2008, NACE Rev 2, Statistical classification of economic activities in the European Community http://epp.eurostat.ec.europa.eu/cache/ITY_OFFPUB/KS-RA-07-015/EN/KS-RA-07-015-EN.PDF Eurostat, 2009, European business: facts and figures http://epp.eurostat.ec.europa.eu/cache/ITY_OFFPUB/KS-BW-09-001/EN/KS-BW-09-001-EN.PDF Eurostat, 2010-a, Statistics in focus: the EU-27 construction sector: from boom to gloom http://epp.eurostat.ec.europa.eu/cache/ITY_OFFPUB/KS-SF-10-007/EN/KS-SF-10-007-EN.PDF Eurostat, 2010-b, Statistics in focus: an analysis of building construction based on building permit statistics http://epp.eurostat.ec.europa.eu/cache/ITY_OFFPUB/KS-SF-10-055/EN/KS-SF-10-055-EN.PDF Eurostat, 2012. Living conditions and social protection. Europe in figures .Eurostat year book, 2012 http://epp.eurostat.ec.europa.eu/cache/ITY_OFFPUB/CH_06_2012/EN/CH_06_2012-EN.PDF

101
Eurostat, 2013. Manual for statistics on energy consumption in households http://epp.eurostat.ec.europa.eu/cache/ITY_OFFPUB/KS-GQ-13-003/EN/KS-GQ-13-003-EN.PDF Euroconstruct, 2013. Summary report. The construction sector in Europe IEA, 2010, Energy technology perspectives, OECD/IEA http://www.iea.org/publications/freepublications/publication/etp2010.pdf IEA, 2013, Innovative market framework to enable deep renovation of existing buildings in IEA countries, paper presented at IEPEC conference http://www.iepec.org/conf-docs/conf-by-year/2013-Chicago/061a.pdf#page=1 IEA-UNDP, 2013. Modernising building energy codes to secure our global energy future http://www.iea.org/publications/freepublications/publication/PolicyPathwaysModernisingBuildingEnergyCodes.pdf INVS, 2007, Bulletin épidémiologique hebdomadaire http://www.invs.sante.fr/beh/2007/22_23/beh_22_23_2007.pdf JRC, 2014, SET-Plan, towards an integrated roadmap https://setis.ec.europa.eu/set-plan-process/integrated-roadmap-and-action-plan JRC, 2015-a, Do current financing structures boost or hinder energy efficiency transition? forthcoming JRC, 2015-b, Energy renovation: how deep can we go? forthcoming OECD, 2012, Towards a green investments low-carbon, climate resilient infrastructure http://www.oecd-ilibrary.org/docserver/download/5k8zth7s6s6d.pdf?expires=1425577766&id=id&accname=guest&checksum=A160A2D776717A2C285588A99FE1179B Pearce & Turner, "Economics of Natural Resources and the Environment" 1989. Pizer, “Prices vs. Quantities Revisited: The Case of Climate Change”, Discussion Paper 98-02, Resources for the Future, October 1997. WBCSD, 2007, EEB1. Roadmap to energy-efficient buildings http://www.wbcsd.org/work-program/sector-projects/buildings/eeb-first-phase.aspx

102
Europe Direct is a service to help you find answers to your questions about the European Union Freephone number (*): 00 800 6 7 8 9 10 11 (*) Certain mobile telephone operators do not allow access to 00 800 numbers or these calls may be billed.
A great deal of additional information on the European Union is available on the Internet. It can be accessed through the Europa server http://europa.eu. How to obtain EU publications
Our publications are available from EU Bookshop (http://bookshop.europa.eu), where you can place an order with the sales agent of your choice. The Publications Office has a worldwide network of sales agents. You can obtain their contact details by sending a fax to (352) 29 29-42758. European Commission EUR 26888 EN – Joint Research Centre – Institute for Energy and Transport
Title: Energy Renovation: The Trump Card for the New Start for Europe Author(s): Yamina SAHEB, Katalin BÓDIS, Sándor SZABÓ, Heinz OSSENBRINK, Strahil PANEV Luxembourg: Publications Office of the European Union 2015 –103 pp. – 21.0 x 29.7 cm EUR – Scientific and Technical Research series – ISSN 1831-9424 (online), ISSN 1018-5593 (print) ISBN 978-92-79-43603-1 (PDF) ISBN 978-92-79-43604-8 (print) doi 10.2790/39989 (online)

103
doi 10.2790/39989 ISBN 978-92-79-43603-1
JRC Mission As the Commission’s in-house science service, the Joint Research Centre’s mission is to provide EU policies with independent, evidence-based scientific and technical support throughout the whole policy cycle. Working in close cooperation with policy Directorates-General, the JRC addresses key societal challenges while stimulating innovation through developing new methods, tools and standards, and sharing its know-how with the Member States, the scientific community and international partners. Serving society Stimulating innovation Supporting legislation
LD-NA-26888-EN
-N