energy potential estimates for agro-industrial residues in
TRANSCRIPT
Energy potential estimates for agro-industrial residuesin Spain
Javier Zubizarretaa, Antonio Gomeza, Marcos Rodriguesa, Cesar Dopazoa,Norberto Fueyo∗,a
aFluid Mechanics Group (University of Zaragoza)Marıa de Luna 3, 50018, Zaragoza, Spain
Abstract
In this paper, we assess the potential for the generation of electricity in Spain
from agro-industrial residues. The industries considered are olive-oil mills, rice
mills, wineries, dairy plants, breweries and wood, meat and nut processing
plants. The methodology used is based on statistical data, and is integrated
into a Geographical Information System (GIS) from which geo-referenced re-
sults are obtained. We estimate the overall energy contents of the residues
(the primary-energy potential) and we carry out an economic analysis of the
electric generation from them. The waste-to-electricity technologies analyzed
are: grate firing followed by steam turbine, co-firing in coal power plants and
anaerobic digestion plus internal combustion engine. The combined potential
for the agro-industrial residues in Spain is estimated at 2625.7 ktoe/y of pri-
mary energy representing 1.77% of the primary-energy consumption in Spain
in 2007. Olive-mill and wood processing residues have the largest energy po-
tentials. Comparisons are presented with (partial) results from other studies.
Considering only economic profitable plants, grate-firing followed by steam tur-
bine is the conversion option with a large potential, totalling 653 MWe and
an electric generation of 4.57 TWh (1.45% of the gross electric generation in
Spain in 2007). Finally, a complete sensitivity analysis is done to investigate the
influence of the economic parameters into the economic profitability of electric
∗Corresponding author. Tel: +34 976762153; fax: +34 976761882.Email address: [email protected] (Norberto Fueyo)
Preprint submitted to Elsevier October 6, 2009

generation from agro-industrial residues. Thus, a reduction of 50% of invest-
ment costs of grate firing technology makes that electric power of profitable
plants increases to 1102 MWe (being the electric generation of 7.70 TWh).
Key words: Biomass energy, Agro-food industry, Electricity, Renewable
energy, GIS
2
Nomenclature
a annuitization factor
A fraction of oil per unit mass of olives (t oil/t olives)
B fraction of wine per unit mass of grapes (t wine/t grapes)
C fraction of methane in the biogas produced (m3 CH4/m3 biogas)
CB biomass generation cost (e/year)
CCF electricity cost by co-firing (e/kWh)
Cinv,AD investment cost for an AD/ICE plant (e)
Cinv,CF investment cost for a CF/PC plant (e)
Cinv,GF investment cost for a GF/ST plant (e)
D fraction of residue generated per unit mass of total byproducts (t residue/t byproducts)
E fraction of dairy wastewater per unit volume of milk (m3 wastewater/m3 milk)
F production of brewery residue per unit volume of beer (t brewery residue/m3 beer)
FPr,p,CF potential share (by co-firing) of the residue r generated in the province
p in the coal power plants of the province p
G biogas production per unit mass of brewery residue (m3 biogas/t brewery residue)
hAD operating hours during a year of an AD/ICE plant (hours/year)
hCF operating hours during a year of a CF/PC plant (hours/year)
hGF operating hours during a year of a GF/ST plant (hours/year)
H organic polluting content per unit volume of dairy wastewater (kg COD/m3 wastewater)
i discount rate
M methane production per unit mass of organic content (m3 CH4/kg COD)
N lifetime of a power installation (year)
NPV net present value
P fraction of penetration of a technology in the industry
PB biomass price at the transformation plant (e/GJ)
Pc,p electric power of coal boilers in the province p
PCF electric power of the co-firing installation (MWe)
Ph heat price (e/kWh)
3
Pr,p,GF electric power of a GF/ST plant which use the residue r generated in
the province p
Pr,f,AD electric power of an AD/ICE plant which use the residue r generated
in the factory f
PI profitability index
R annual final product production (t/y)
RE annual income from the selling of generated electricity (e/year)
Q lower heating value (MJ/kg, GJ/m3 or MJ/m3)
TE feed-in tariff (e/kWh)
TCI total capital investment (e/year)
TOC total operating cost (e/year)
α fraction of the total capital investment dedicated to O&M costs
ηAD electric efficiency of an AD/ICE plant
ηCF electric efficiency of a CF/PC plant
ηGF electric efficiency of a GF/ST plant
π energy potential of the residue in Spain (ktoe/y)
πr,f energy potential of the residue r generated in factory f (MWh/y)
πr,p energy potential of the residue r in province p (MWh/y)
Subscripts
AD relative to AD/ICE technology
c coal power plant
CF relative to CF/PC technology
CH4 methane
E electricity
ex olive-oil-extraction technology
f factory
GF relative to GF/ST technology
h heat
p province
r residue
4

Superscripts
w residue type
m mechanical operation in the wood industry
n nut processing industry
Abbreviations
AD/ICE anaerobic digestion/internal combustion engine
AS almond shell
BIG/CC Integrated biomass gasification/combined cycle
BIG/ICE Integrated biomass gasification/internal combustion engine
BSG brewers’ spent grain
CF/PC Co-firing in pulverized coal boilers
CHP Combined heat & power
COD chemical oxygen demand
GC/ST grate combustion/steam turbine
GIS geographic information system
GP grape pomace
HS hazelnut shell
IDAE Institute for Diversification and Saving of Energy
MITYC Spanish Ministry of Industry, Tourism and Trade
MMA Spanish Ministry of the Environment and Rural and Marine Affairs
OH olive husk
O&M Operation and maintenance
OMW olive-mill wastewater
REE Spanish Electric Grid
UNESA Spanish Electric Industry Association
UHT ultra high temperature
5

1. Introduction
The European Union is promoting a global target of 20% of renewable en-
ergy in the final energy consumption by 2020. In addition, the Spanish gov-
ernment has set ambitious goals in renewable-energy production for the period
2005-2010 (IDAE, 2005) and beyond. Biomass-to-electricity is a well-known
electricity-generating option but for the time being it does not appear to be
playing the important role in the renewable energy mix that was expected. For
waste biomass, the goal was an increase of 200 MW in installed power from
agro and forest industry residues in 2010. In order to support policy decisions
leading to realistic targets, it is important to accurately estimate the potential
and costs of the electricity-generation from this kind of industrial waste.
In terms of turn-over, the Spanish food and beverage industry ranks the
fifth in the European ranking, as well as leading the national industrial sector
with 17% of total production in 2006. Furthermore, it underwent a produc-
tion increase of about 4 percent in that year (MITYC, 2007a). The agro-food
sector encompasses a broad variety of manufacturing processes that generate
considerable quantities of different wastes, but especially organic residues, with
an annual production of 2.43 million tonnes in 2005. In the last decades, the
European legislative requirements for waste disposal are becoming increasingly
restrictive (European Council, 1999); accordingly, there is a pressing need for
the proper disposal of waste material. A number of studies in the literature
conclude that agro-industrial residues are a suitable source of biomass for elec-
tricity production (Caputo et al., 2003; Kuiper et al., 1998; Boateng et al.,
1992; Malaspina et al., 1996; Mussatto et al., 2006); however, its use as an en-
ergy source is hindered by several limitations, such as for instance the seasonal
supply of waste (correlated to the seasonality of the main product); or the high
investment costs required for waste pre-treatment (IDAE, 2005).
Regarding the electricity-generation technology, combustion followed by a
steam cycle is, as for fossil fuels, the most developed and worldwide used route
for biomass (DeMeo, 1997). For instance, Caputo et al. (2003) highlight the
6

advantages of employing thermochemical processes for the disposal of residues
from olive-oil manufacturing, due to the substantial reduction waste volume and
polluting substances, as well as the high energy recovery. However, it is also
stated that the fraction of moisture in the material is a crucial parameter in the
combustion efficiency and even feasibility. It is generally accepted that moisture
contents greater than 65% impairs combustion as the moisture greatly delays
the release of volatiles (Agarwal and La Nouze, 1989). Biochemical processes
are more a suitable solution for the conversion into electricity of high-moisture
residues. Specifically, anaerobic treatments followed by compost production
appear to be in this case the preferred solution, with the added benefit of the
additional revenues accrued through the sale of byproducts (Caputo et al., 2003).
As a result, several anaerobic-digestion (AD) plants have been established in
Europe with acceptable success and good growing expectations (IDAE, 2005).
Table 1 shows the typical moisture contents of the residues considered in the
present study. Moisture content data have been obtained from Celma et al.
(2007), FAO (1990), Gonzalez et al. (2006), Haykiri-Acma and Yaman (2007),
Fang et al. (2004) and Santos et al. (2003).
In the present work, the potential of generation of electricity from organic
residues generated in the most important Spanish agro-industries, namely olive-
oil mills, rice mills, wineries, dairy plants, breweries, and wood, meat and nut
processing industries is estimated. To do it, in the first part of the study,
a methodology is developed, based on statistical data, for the evaluation of
the energy potential of these residues. This methodology is integrated into a
Geographic Information System (GIS) from which geo-referenced results are
obtained. In the second part, an economic analysis of the electricity generation
from these agro-industrial residues is carried out. As the energy potential data,
geo-referenced results are obtained from the economic analysis. Thermochemical
(grate combustion followed by steam turbine, GC/ST, and co-firing in pulverized
coal power plants, CF/PC) and biochemical technologies (anaerobic digestion
plus internal-combustion engine, AD/ICE) are considered for the conversion of
agro-industrial residues into electricity.
7
There are few studies published in the open literature with estimates of
energy potential from agro-industrial residues and economic analyses of the
electricity generation from them at a country level. Among those which share
some degree of commonality with the present one, the following are noteworthy.
Celma et al. (2007) evaluated the potential and profitability of the production
of electricity from olive-mill and winery residues in Extremadura (a region of
Spain), Matteson and Jenkins (2007) evaluated the potential and cost of the
production of electricity from food-processing residues in California (United
States of America) and Penniall and Williamson (2009) analysed the feasibility
of gasification plants in the New Zealand wood-processing industry. At a local
level, these kind the studies are more common, as for example, this carried out
by Boukis et al. (2009), in which the viability of a biomass-residues combustion
plant is investigated. It is more common to find in the literature studies in which
only the energy potential of biomass residues is calculated. Thus, Ericsson and
Nilsson (2006) evaluated the energy potential from byproducts from the forest
industry in the European countries; Siemons et al. (2004) reported the potential
of the wood-processing-industry residues also in the European countries, while
AFB-NET (2000) presented a similar study for Spain; IDAE (2005) calculated
the potential in Spain and in some of the Spanish Autonomous Communities
from residues from olive-oil manufacturing and from wood processing; Andalu-
sian Energy Agency (2007) reported the potentials from residues from olive-mill,
and from the nut-, rice- and wood-processing industries in Andalusia (Spain);
and Matsumura et al. (2005) evaluated the potential from different biomass in
Japan. The methodology used for these studies is mainly statistical, and, in
general, the results are not geo-referenced.
2. Methodology for energy potential
For the assessment of energy potential of agro-industrial waste we use a
methodology that estimates the maximum amount of energy available from
each source of residues. Generally, the energy potential of a source of residues
8

results from two basic estimations: the amount of residues generated in a given
temporal cycle (typically one year) with a certain geographical disaggregation,
and the energy content of the material which is transformed into electricity.
2.1. Olive-mill residues
The production of olive-mill waste has risen sharply in the last four decades,
especially in the Mediterranean area where most of worldwide olive-oil produc-
tion takes place. Kapellakis et al. (2006) attribute this growth mainly to the
industrialization of the agricultural sector and to the development of the oil-
extraction technology. Waste disposal has become a major concern for olive-oil
producers due to its polluting power and to the increasing severity of the appli-
cable legislation.
According to IDAE (2005), olive-oil milling is the most attractive agricultural
sector for energy recovery from residues in Spain. In general, three different
residues are generated: olive husk (OH), olive-mill wastewater (OMW) and
sludge. OH is a solid waste containing the pulp, the tegument and the stone
of the olive. Traditionally OH has been used as animal feed but nowadays it is
carried to seed-oil factories where the small percentage of residual oil it contains
is extracted. As a result an easy-to-burn material is obtained (Caputo et al.,
2003). OMW is made up of the water contents of the olive and frequently of
some additional fresh water added in the process. It presents high biological and
chemical pollutant load and it has been commonly used for fertilizing irrigation.
Finally, the sludge is a byproduct similar in appearance to a mixture of OH and
OMW (MMA, 2000). Some studies have suggested several physical and chemical
treatments for these residues, e.g. lagooning, concentration by evaporation,
ultrafiltration/reverse osmosis, or waste-to-energy processes such as incineration
or aerobic/anaerobic digestion (Vitolo et al., 1999).
For the assessment of the amount of residues generated some considerations
must be made. The types and quantities of residues obtained from olive mills
depend greatly on the oil extraction system installed at the facility. There are
currently three different extraction technologies commonly used in the Mediter-
9

ranean basin, each one presenting different degrees of regional penetrations.
These three technologies are the olive press, the three-phase system and the
two-phase system (MMA, 2000). The press is the traditionally-used system,
consisting in the crushing of the pulp by sequential pressing cycles with hy-
draulic devices. In this process, all three byproducts are generated: olive oil,
OH and OMW. From the 70’s, presses have been increasingly replaced by contin-
uous systems, while they are still used in small production facilities. Continuous
systems use centrifuges for the extraction of the byproducts permitting lower
operating costs and higher performance and production rates. For a couple of
decades the most successful of these resulting techniques was the three-phase
system, which is based on the separation of byproducts by horizontal centrifuges
called decanters. The byproducts of the three-phase system are oil, OH and
OMW as in the traditional system. Finally, the two-phase system was devel-
oped in the early 90’s as an evolution of the three-phase system with the intent
to reduce the amount of waste generated, especially of OMW given its highly-
polluting nature. The main innovation of this technique is that it eliminates
the need to add hot water in the process. It results in less polluting production,
higher processing capacity and slightly higher quality of the olive oil. Only two
byproducts are generated in this process, oil and sludge. The two-phase sys-
tem is currently the most widely-adopted process in the Spanish oil industry,
accounting to three-quarters of the total olive oil production. Table 2 shows the
values considered in this study for the distribution of byproducts per unit olive
weight entering the mill for the different extraction systems, as reported by Ca-
puto et al. (2003), and their corresponding penetration in the Spanish olive-oil
sector (Celma et al., 2007). (The breakdown for the three-phase system exceeds
100% because some water is added in the process for the washing of the raw
material.).
The energy potential of olive-mill residues is computed in this work from
provincial data as follows:
10

π =∑
p
∑r
∑ex
Rp
ADw
exPexQw (1)
where Rp is the annual olive-oil production in province p ((MMA, 2007)), A
is the fraction of oil produced per unit olive treated, 0.20 (Caputo et al., 2003),
Dwex is the fraction of the residue type w per unit weight of olives using the
extraction technology ex (Caputo et al., 2003), Pex is the penetration of the
extraction system ex, Qw is the lower heating value of the residue type w, 8.87
MJ/kg for OH, 1.59 MJ/kg for OMW and 7.75 MJ/kg for sludge, (Celma et al.,
2007).
2.2. Winery residues
Spain is a major wine producer in the world, manufacturing more than 41
million hectolitres of wine and grape juice in 2005 (MMA, 2007). The residues
generated in wine-making include grape stalk, grape pomace (GP) and wine lee.
GP is the most significative one, with a worldwide generation about 7 million
tons each year (Baumgartel et al., 2007). Its dumping results in environmental
impacts owing its polluting characteristics such as low pH and high content of
phytotoxic and bacterial phenolic substances. GP and wine lee have often been
used for the distillation of spirit beverages, but current European legislation
is more restrictive in this respect, prompting their processing in distilleries to
obtain ethanol and brandy (European Council, 1999). Their use as animal feed
or fertilizer has also been traditionally very common in the Mediterranean re-
gion. Other treatments for GP have been also suggested, including the recovery
of valuable antioxidant polyphenols (Amico et al., 2008), or direct combustion
(Celma et al., 2007).
In this study, the national energy potential of GP is calculated from provin-
cial data as follows:
π =∑
p
2Rp
BDQ (2)
where Rp is the annual wine and grape juice production in province p (MMA,
2007), B is the fraction of wine produced per unit grape pressed, 72% (Celma
11
et al., 2007), D is the fraction of GP per unit weight of grapes generated in
the pressing of grapes, 14% (Celma et al., 2007)), Q is the lower heating value
of wine residue, 7.40 MJ/kg (Celma et al., 2007). A factor of 2 is included in
the equation because the washing of the GP requires an important amount of
water, some of which remains as moisture in the residue; hence, its final weight
is about twice of the initial before washing (Celma et al., 2007).
2.3. Residue from forest-operation and wood-processing industries
This section considers the energy contents of residues from the forest op-
erations (such as logging for timber) aimed at producing raw materials for
subsequent industries, and of the wood-processing activities of these industries
resulting in semi-finished products used to manufacture final wood products.
Wood processing is a basic sector closely related to the building industry which
has exhibited a considerable increase in the production of plywood and parti-
cleboard in Spain in the last years (MITYC, 2007a). Several residue types are
generated both in the harvesting of timber and in mill-site operations, such as
branches, needles, leaves, bark, sawdust, sunderdust, fines or trimmings. Due to
their wide-ranging characteristics, these residues are usually classified accord-
ing to the mechanical operation from which they are generated. The residues
considered in this work are: forest residues, sawmilling residues, plywood manu-
facturing residues and particleboard manufacturing residues (FAO, 1990). The
wood-processing industries in developed countries attempt to make an exhaus-
tive use of their waste by burning it in hog fuel furnaces, thus helping to offset
the cost of expensive fossil fuels. The residues often do have alternative uses
such as building materials, fuelwood or pulp manufacturing; their final use varies
with market location and demand (FAO, 1990).
The energy potential of wood processing residues is calculated in this work
from each mechanical operation m and province p as follows:
π =∑
p
∑m
Rmp DmQm (3)
where Rp is the annual production of wood in the province p consumed in the
12

mechanical operation m (MMA, 2007), Dm is the percentage of residue from
mechanical operation m per unit volume of wood processed, taken as 30%, 43%,
45% and 5% for forest, sawmilling, plywood and particleboard residues respec-
tively (Ericsson and Nilsson, 2006; FAO, 1990), Q is the lower heating value
of the residue from mechanical operation m, 6.8 GJ/m3 for forest residues and
7.2 GJ/m3 for sawmilling, plywood and particleboard manufacturing residues
(Ericsson and Nilsson, 2006).
2.4. Nut-processing residues
Nut-processing residues, together with olive mill effluents, are the most rel-
evant source of biomass for electricity production from agro-food industries in
Spain (IDAE, 2005). The large quantities of product generated and its low
market value foster the recovery of energy from nut residues. Two nuts are
considered here, viz almond and hazelnut, since they have by far the largest
production in Spain (MMA, 2007); nougat (Spanish: turron) producers are the
main consumers of almond and hazelnut. Spain is the second world producer of
almonds with a mean production of 75,000 t/y and the fourth one of hazelnut
with 8,000 t/y; this is an indication of the importance of the nut processing
industry in the Spanish food sector.
The main almond and hazelnut residues are generated in post-harvesting
processing facilities. These facilities are basically divided into two types, hullers
and huller/shellers. Hullers remove the outer covering of the nut by cracking it
with hulling cylinders obtaining an in-shell nut. Huller/shellers involve a more
complete process as the nut meat is also removed from its shell (EPA, 2000).
Typically, hulls are sold as an ingredient for animal food while a number of
studies suggest the use of shells as fuel in thermochemical processes (Gonzalez
et al., 2006, 2004; Haykiri-Acma and Yaman, 2007; Demirbas, 2004). Accord-
ingly, we therefore consider the energy potential of almond and hazelnut shells
(AS, HS) for all the Spanish nut production, which is estimated as follows:
π =∑
p
∑n
Rnp DnQn (4)
13
where Rnp is the annual nut consumption by processing industry n in province p
(MMA, 2007), Dn is the percentage of nut residue per unit weight of nut in the
nut processing industry n, equal to 50.0% and 46.4% for almond and hazelnut
respectively (Di Blasi et al., 1997; Ozdemir and Akinci, 2004), Qn is the lower
heating value of the residue from nut processing industry n, taken as 18.8 and
17.5 MJ/kg (Demirbas and Akdeniz, 2002; Haykiri-Acma and Yaman, 2007).
2.5. Rice-mill residues
Rice-milling residues, namely straw, stalk and rice husk, are the most im-
portant agricultural residue by quantity in the world, representing 43% of the
total residues generated. Asia accounts for more than 92% of the world’s rice
milling residues, while Europe contributes under 0.5% (Werther et al., 2000).
Rice husk is the outer cover of the rice and one of the most attractive residues
for energy recovery through thermochemical processes due to its high availabil-
ity (some large mills process 10-20 t/h), its large heating value of 12-18 MJ/kg,
and its high volatile-matter content (Mansaray and Ghaly, 1998; Armesto et al.,
2002; Kueng Song Lin et al., 1998; Fang et al., 2004; Maiti et al., 2006). The
energy potential of rice-mill residue is calculated in this work from provincial
data through the equation:
π =∑
p
RpDQ (5)
where Rp is the annual production of rice in province p (MMA, 2007), D is
the percentage of residue per unit weight of byproducts, equal to 20% (Beagle,
1978), Q is the lower heating value of the residue of paddy rice, 12.3 MJ/kg
(Fang et al., 2004).
2.6. Wastewater from the meat-processing industry
The meat sector is the largest producer in the Spanish food-industry sec-
tor, representing 19.7% of the total sales (FIAB, 2006). This leading industry
generates large quantities of highly polluting residual wastewater, mainly from
several process facilities in slaughterhouses, such as blood rafts and meat and
guts washing rooms. Most meat processing-plants include a sewage-treatment
14
facility within the complex, as it is often compulsory to treat wastewater sep-
arately before pouring it into the public sewage system. Aerobic digestion has
been traditionally the most widely-used biochemical treatment for wastewater
(Tritt and Schuchardt, 1992), although a combination of anaerobic and aer-
obic lagoons are more common in some countries, e.g. in the United States
(Rodrıguez Rebollo, 1998). The benefits of developing anaerobic systems have
been studied by Salminen and Rintala (2002); Borja et al. (1998); Masse and
Masse (2001) and Caixeta et al. (2002), but such systems have not been ex-
tensively used on a large scale despite their benefits of biogas production and
decreased generation of sludge.
The energy potential of meat processing wastewater is calculated as follows:
π =∑
p
RpEPMQCH4 (6)
where Rp is the annual meat production from animal carcasses from slaughter-
houses in province p (MMA, 2008a), E is the volume of wastewater generated
per unit weight of meat, taken as 16 m3/t (Rodrıguez Rebollo, 1998), P is the
organic polluting content of wastewater, 5.05 kg COD/m3 (Borja, 1995), M
is the production of methane per unit mass of organic content, equal to 0.297
m3/kg COD (Fountoulakis et al., 2008), QCH4 is the lower heating value of the
methane (37.2 MJ/m3).
2.7. Dairy wastewater
The diary sector ranks third among the Spanish food industries, represent-
ing 10.3% of total sales, despite the massive closure of diary operations since
the 90’s due to the decrease in production allocation from the European Union
(FIAB, 2006; COAG, 2006). Dairy industry production includes UHT, pas-
teurized, condensed, skimmed and powdered milk (accounting for 78% of the
industry) and other products such as cheese, desserts, cream and butter (Vidal
et al., 2000). Dairies generate wastewater flows with characteristics heavily de-
pendent on the products, the processing methods and even the season of the
year. This variability modifies the organic loading rate of wastewater, and for
15

this reason the choice of optimal treatment method for the plant is not straight-
forward. In general, several methods are suitable for dairy wastewater treatment
including reutilization of waste components, aerobic digestion and primary phys-
ical/chemical treatments. However, a prominent focus on anaerobic digestion
has recently taken place due to the lower quantities of sludge generated and the
absence of aeration compared with aerobic digestion (Vidal et al., 2000).
The energy potential of dairy wastewater is calculated from provincial data
as follows:
π =∑
p
RpEHMQCH4 (7)
where Rp is the annual milk production in province p (MMA, 2008a), E is the
volume of wastewater generated per unit volume of milk, taken as 3 m3/m3
(AINIA, 1997), H is the organic polluting content of wastewater, taken as 4.44
kg COD/m3 (Janczukowicz et al., 2007), M is the production of methane per
unit mass of organic content, 0.371 m3/kg COD (Haridas et al., 2005), QCH4 is
the lower heating value of the methane (37.2 MJ/m3).
2.8. Brewery residues
Spain is the third beer producer in the European Union and the ninth in
the world. The beer sector is very prominent in the Spanish industry, with an
input to the economy of 5,100 Me/y, and generating ca. 8,000 direct jobs and
more than 200,000 indirect jobs (MMA, 2008a). The brewing industry generates
three main residues: spent grains, spent hops and yeast. The industry makes
a proficient reuse of the last two since they can be composted or used as soil
amendment or food for livestock.
Large quantities of brewers spent grain (BSG) are produced with more dif-
ficulties for its proper disposal, due to environmental problems and its scarce
value as marketable product (Mussatto et al., 2006). Because BSG represents
85% of the residues generated by breweries, several possible uses have been pro-
posed, such as a food ingredient for animal fodder, a fuel for energy production,
a component for brick manufacturing or charcoal production. For energy recov-
ery from BSG, thermochemical and biochemical processes are often considered
16

as most viable, although most studies have focused on biogas production with
heat recovery (Yu and Gu, 1996; Cronin and Lo, 1998; Alvarado Lassman et al.,
2008).
The energy potential of brewery residue is estimated from provincial data
using the equation:
π =∑
p
RpFGCQCH4 (8)
where Rp is the annual beer production in province p (MMA, 2008a), F is
the production of brewery residue per unit volume of beer, 200 kg/m3 (Mussatto
et al., 2006), G is the production of biogas per unit BSG, 34.76 m3/t (Ezeonu
and Okaka, 1996), C is the percentage of CH4 in the biogas produced, taken as
0.60 (Mussatto et al., 2006), QCH4 is the lower heating value of methane (37.2
MJ/m3).
3. Methodology for the economic analysis
In this section, the methodology used to carry out the economic analysis of
the production of electric energy from agro-industrial residues is described.
An economic analysis of the use of biomass for the production of electricity
must to consider, among other factors, the characteristics of the residue (as for
example, moisture content and lower heating value), its geographical dispersion,
the technology for the transformation into electricity (which, at the same time,
depends on the properties of the residue), the economy of scale of the transfor-
mation plant and the received feed-in tariffs. In this work, we have incorporated
all this factors in the economic analysis to get an estimate of the production of
electricity from agro-industrial residues which would be feasible in Spain.
For olive-mill residues, winery residues, residues from wood-processing in-
dustries, nut processing industries and rice-mill residues, we have considered
two possible options to generate electricity: grate-fired combustion followed by
a steam turbine (GF/ST) and co-firing in pulverized coal boilers (CF/PC). For
brewery residues and wastewater from dairy products and meat-processing in-
dustries, we have considered anaerobic digestion plus an internal combustion
17
engine (AD/ICE) for the production of electricity due to their high moisture
content. Further, anaerobic digestion would form part of the process for compul-
sory treatment of wastewater before pouring it into the public sewage system.
For these residues, conversion plants are located in the own factories.
Obviously, there are other options to transform residues into electricity as for
example fluidized bed combustion followed by a steam turbine (FBC/ST), gasifi-
cation with an internal combustion engine (BIG/ICE) and gasification/combined
cycle system (BIG/CC). FBC/ST is a proved technology and has better elec-
tric efficieny than GF/ST (Celma et al., 2007; Dornburg and Faaij, 2001); on
the other hand, it requires higher investment costs (Dornburg and Faaij, 2001;
Celma et al., 2007) and its profitability is lower than GF/ST (Celma et al.,
2007). BIG/ICE is a technology that is commercially available, but its deploy-
ment is stalled due to technical problems (it requires a high quality fuel and a
careful operation) and economic aspects (it requires a high investment) (Faaij,
2006). Finally, BIG/CC is a promising technology with higher electrical efficien-
cies than the other ones, but it is yet in a demonstration phase. It has to face
important technical problems, as for example, the cleaning of gases, and fur-
ther, developed projects have needed important investments (Faaij, 2006). For
these reasons, the probability of deployment of these technologies in the short-
medium term is low, and therefore, these technologies have not been included
in the economic analysis.
Next, we describe the economic analysis done for the three conversion tech-
nologies chosen.
3.1. Firing-grate combustion
This option is considered for olive-mill residues, winery residues, residues
from forest-operation and wood-processing industries, nut processing industries
and rice-mill residues. To do the economic evaluation we have considered that
the residues generated in each province are used in the same province for the
production of electricity. Taking this into account, we first calculate the electric
18

power of a GF/ST plant in each province as:
Pr,p,GF =πr,p
hGFηGF (9)
where Pr,p,GF (MW ) is the electric power of a GF/ST plant which use the
residue r generated in the province p, πr,p (MWth/ year) is the energy-potential
of the residue r in the province p (calculated with the methodology described
in section 2), hGF (hours/year) are the operating hours during a year and ηGF
is the electric efficiency of the GF/ST plant. Hours/year and electric efficiency
considered for this technology are shown in Table 5. The expression used to
calculated the electric efficiency is obtained from Celma et al. (2007). Elec-
tric efficiency of these kind of installation diminishes as electric power do so
(Dornburg and Faaij, 2001; Celma et al., 2007; Bridgwater et al., 2002; Resch
et al., 2006); this increases the importance of economies of scale for these plants.
The maximum electric power considered is 25 MWe; this maximum size is fixed
taking into account the current size of this installations and the feed-in tariffs
in Spain are only given to renewable installations with electric power under 50
MWe (MITYC, 2007b). Larger sizes of biomass-to-electricity plants involve an
increase of the risks, as for example, a temporary lack of residues. If energy
potential is enough, several installations GF/ST plants are considered. Once
electric power of a transformation plant is obtained, the economic profitabil-
ity of each plant is calculated through the net present value (NPV ) and the
profitability index (PI).
Net present value is calculated as:
NPV =N∑
t=1
[RE − TOC]t(1 + i)t − TCI (10)
where N is the lifetime of the installation (taken as 20 years), RE (e/year)
are the annual incomes from the selling of generated electricity (e/year), TOC
(e/year) are the annual operating costs, including costs of residues and operat-
ing and maintenance costs, i is the discount rate (assumed as 9%) and TCI is
the total investment costs (e).
19
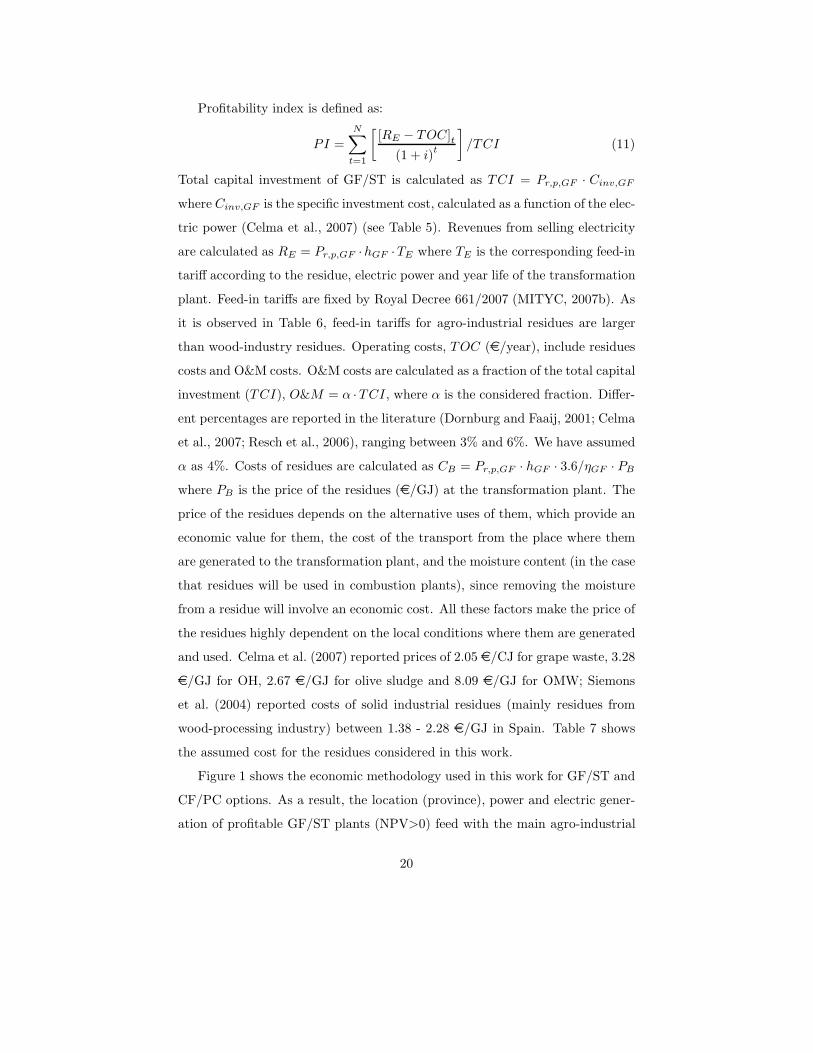
Profitability index is defined as:
PI =N∑
t=1
[[RE − TOC]t
(1 + i)t
]/TCI (11)
Total capital investment of GF/ST is calculated as TCI = Pr,p,GF · Cinv,GF
where Cinv,GF is the specific investment cost, calculated as a function of the elec-
tric power (Celma et al., 2007) (see Table 5). Revenues from selling electricity
are calculated as RE = Pr,p,GF ·hGF ·TE where TE is the corresponding feed-in
tariff according to the residue, electric power and year life of the transformation
plant. Feed-in tariffs are fixed by Royal Decree 661/2007 (MITYC, 2007b). As
it is observed in Table 6, feed-in tariffs for agro-industrial residues are larger
than wood-industry residues. Operating costs, TOC (e/year), include residues
costs and O&M costs. O&M costs are calculated as a fraction of the total capital
investment (TCI), O&M = α ·TCI, where α is the considered fraction. Differ-
ent percentages are reported in the literature (Dornburg and Faaij, 2001; Celma
et al., 2007; Resch et al., 2006), ranging between 3% and 6%. We have assumed
α as 4%. Costs of residues are calculated as CB = Pr,p,GF · hGF · 3.6/ηGF · PB
where PB is the price of the residues (e/GJ) at the transformation plant. The
price of the residues depends on the alternative uses of them, which provide an
economic value for them, the cost of the transport from the place where them
are generated to the transformation plant, and the moisture content (in the case
that residues will be used in combustion plants), since removing the moisture
from a residue will involve an economic cost. All these factors make the price of
the residues highly dependent on the local conditions where them are generated
and used. Celma et al. (2007) reported prices of 2.05 e/CJ for grape waste, 3.28
e/GJ for OH, 2.67 e/GJ for olive sludge and 8.09 e/GJ for OMW; Siemons
et al. (2004) reported costs of solid industrial residues (mainly residues from
wood-processing industry) between 1.38 - 2.28 e/GJ in Spain. Table 7 shows
the assumed cost for the residues considered in this work.
Figure 1 shows the economic methodology used in this work for GF/ST and
CF/PC options. As a result, the location (province), power and electric gener-
ation of profitable GF/ST plants (NPV>0) feed with the main agro-industrial
20
residues in Spain is obtained. Finally, a sensitivity analysis is carried out to
treat the uncertainty of parameters as cost of residues, investment costs, O&M
costs and discount rate.
3.2. Coal co-firing
This option is considered for olive-mill residues, winery residues, residues
from forest-operation and wood-processing industries, nut processing industries
and rice-mill residues. In first place, information about coal power plants in
Spain is obtained: location, electric power and lifetime (UNESA, 2007). After
it, we have considered for the economic analysis only coal power plants whose
lifetime is extended, at least, until 2020. Table 8 shows the electric power of
coal boilers that will be working by 2020 and the province where are located.
It is observed that these coal power plants are concentrated in only 8 provinces
(of the 50 provinces of Spain). Next, in these provinces, the electric power
that could be substituted by generated residues in the respective province is
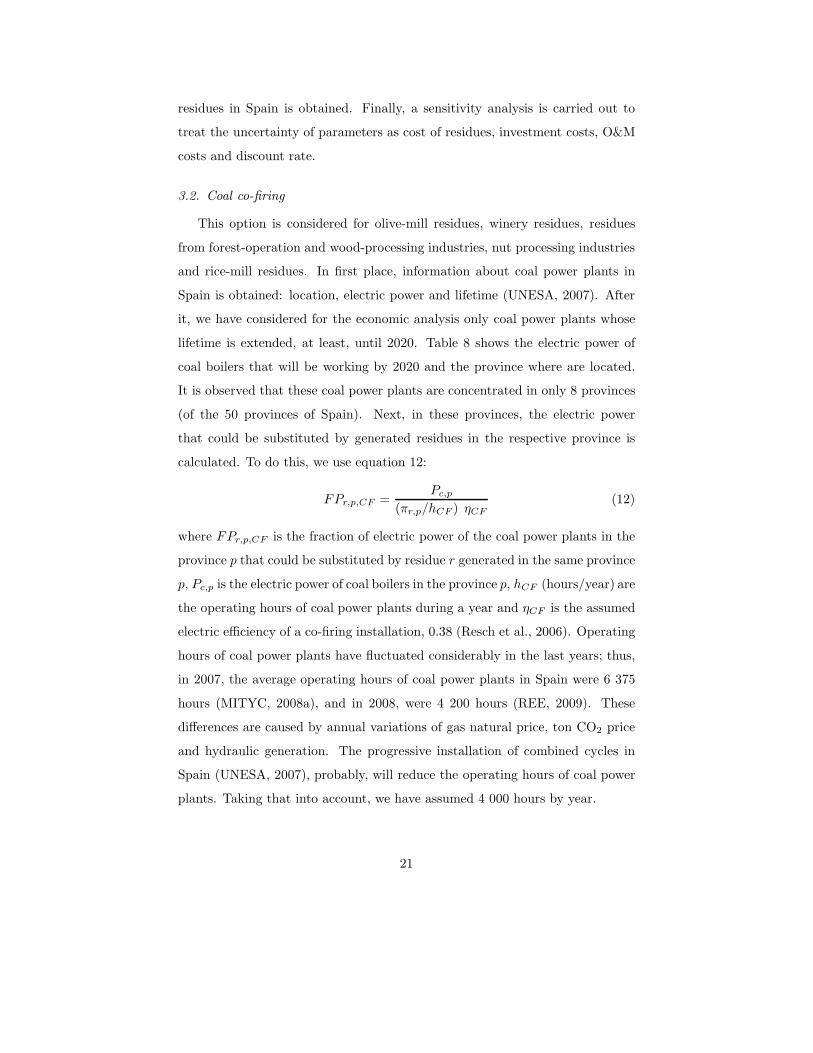
calculated. To do this, we use equation 12:
FPr,p,CF =Pc,p
(πr,p/hCF ) ηCF(12)
where FPr,p,CF is the fraction of electric power of the coal power plants in the
province p that could be substituted by residue r generated in the same province
p, Pc,p is the electric power of coal boilers in the province p, hCF (hours/year) are
the operating hours of coal power plants during a year and ηCF is the assumed
electric efficiency of a co-firing installation, 0.38 (Resch et al., 2006). Operating
hours of coal power plants have fluctuated considerably in the last years; thus,
in 2007, the average operating hours of coal power plants in Spain were 6 375
hours (MITYC, 2008a), and in 2008, were 4 200 hours (REE, 2009). These
differences are caused by annual variations of gas natural price, ton CO2 price
and hydraulic generation. The progressive installation of combined cycles in
Spain (UNESA, 2007), probably, will reduce the operating hours of coal power
plants. Taking that into account, we have assumed 4 000 hours by year.
21

Royal Decree 661/2007 (MITYC, 2007b) does not fix feed-in tariffs for co-
firing plants; it states that these installations could receive feed-in tariffs and
them will be calculated for each specific case. Therefore, in spite of calculating
the profitability of the co-firing installations, we have calculated the cost of the
electricity generation by co-firing residues. Moreover, a sensitivity analysis is
carried out to study the influence of different parameters in that cost.
To calculate the electricity cost by co-firing residues, we use equation 13:
CCF = (a · TCI + TOC) / (PCF · hCF ) (13)
where CCF is the cost of the electricity generated by co-firing e/kWh, a is the
annuitization factor, given by a = r/(1 − 1/ (1 + i)N
), where i is the nominal
discount rate (taken as 9%) and N is the investment lifetime (10 years); and,
PCF is the electric power of the co-firing installation. Total capital investment
is calculated as TCI = PCF · Cinv,CF where Cinv,CF is the specific investment
cost of a co-firing installation. It depends on the type of coal power plant
(Berggren et al., 2008) (fluidized bed, fired-grate or pulverized coal) and the
co-firing system (direct, indirect or parallel)(Garcıa, 2006). Further, inside each
type of co-firing systems, there are variations; for example, in direct co-firing
systems, the biomass could be introduced into the boiler by the same burners
as coal, or, by a new burner (only for biomass) (Hughes, 2000). For these
reasons the range of specific investment costs reported for co-firing installations
is wide, from 100 e/kW to 880 e/kW (Faaij, 2006; Ericsson, 2007; Berggren
et al., 2008; Garcıa, 2006); for direct co-firing systems (which requires a lower
investment) and pulverized coal power plants (in Spain, all coal power plants
are pulverized boilers) the reported range of Cinv,CF goes from 100 e/kW to
550 e/kW. Thus, in this work, we have taken a specific investment cost of
300 e/kW (assuming direct co-firing systems). Residues cost is calculated as
CB = PCF · hCF · 3.6/ηCF · PB. The price of the residues, PB could be higher
for CF/PC than for a GF/ST since the location of a GF/ST plant could be
optimised (to reduce transport costs) before the construction, but this is not
possible for a co-firing installation. Nevertheless, we have assumed that prices
22

are the same (see Table 7). O&M cost is considered as a fraction of the total
capital investment, O&M = α · TCI, where α is assumed as 4%.
Figure 1 shows the methodology used in this work for the analysis of the
potential of CF/PC option. As a result, it is obtained: the share of agro-
industrial residues in coal power boilers in Spain (considering only the residues
generated in the same province where coal boilers are located) and the electricity
generation cost.
3.3. Anaerobic digestion
This option is considered for brewery residues and wastewater from dairy
products and meat-processing industries. To carry out the economic analy-
sis, we have obtained information about typical size of slaughterhouses, dairy
factories and breweries in Spain. Thus, there are nearly 1 200 slaughterhouses,
though 80% of meat production is carried out by only 25 slaughterhouses, whose
capacity ranges between 30 000 and 150 000 ton/year (Langreo, 2002). The situ-
ation of dairy sector is similar; there are 670 companies dedicated to elaboration
of dairy products, but nearly 80% of production is controlled by 15 companies
(MMA, 2008b), whose factories treat between 50 000 and 200 000 ton/year of
milk. Finally, there are 21 breweries in Spain whose capacity of production
ranges between 509 000 and 2 200 000 hl/year (Cerveceros de Espana, 2008).
For the production ranges of slaughterhouses, dairy factories and breweries, we
calculate the power of an AD/ICE plant that use the residues of these industries
with equation:
Pr,f,AD =πr,f
hADηAD (14)
where Pr,f,AD (MW ) is the electric power of a AD/ICE plant which use the
residue r generated in the factory f , πr,f (MWth/ year) is the energy-potential
of the residue r generated in the factory f (calculated with equations 6, 7
and 8 using data of annual production of slaughterhouses, dairy factories and
breweries), hAD (hours/year) is the operating hours during a year and ηAD is
the electric efficiency of the AD/ICE plant. Operating hours are fixed taking
23
into account the labour activity of the factories (see Table 5). The electric
efficiency is assumed considering the efficiency of an internal combustion engine
(Flynn and Ghafoori, 2006).
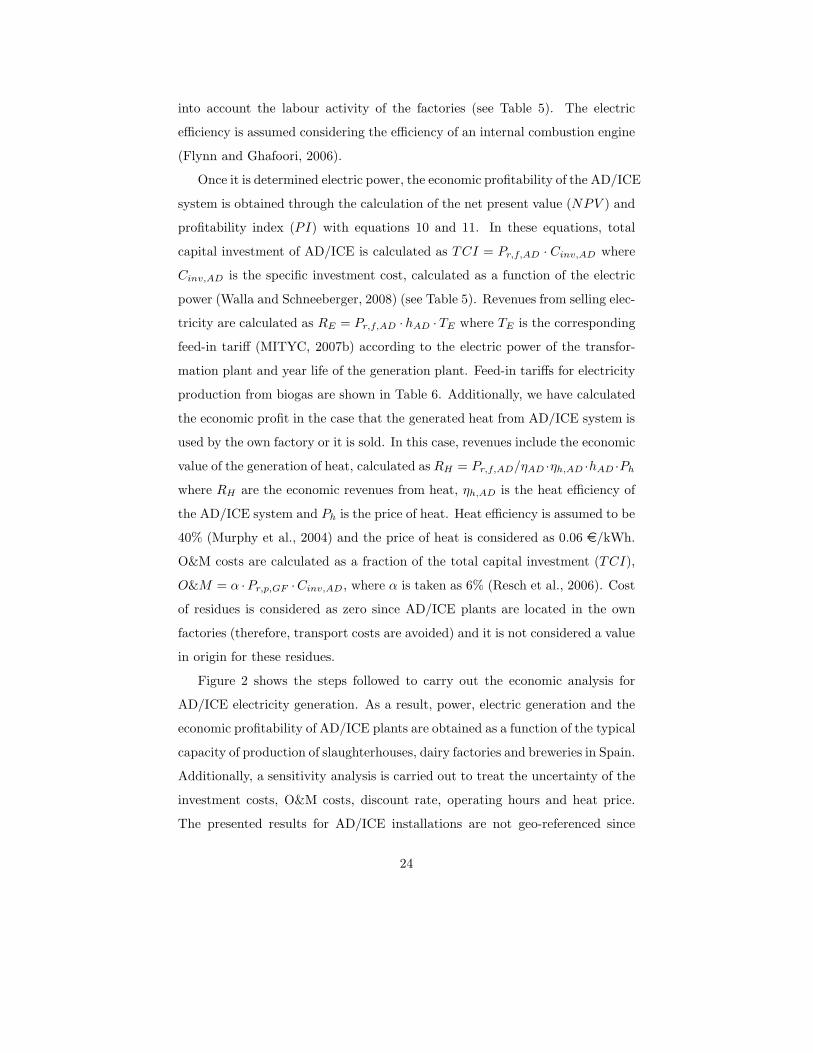
Once it is determined electric power, the economic profitability of the AD/ICE
system is obtained through the calculation of the net present value (NPV ) and
profitability index (PI) with equations 10 and 11. In these equations, total
capital investment of AD/ICE is calculated as TCI = Pr,f,AD · Cinv,AD where
Cinv,AD is the specific investment cost, calculated as a function of the electric
power (Walla and Schneeberger, 2008) (see Table 5). Revenues from selling elec-
tricity are calculated as RE = Pr,f,AD · hAD · TE where TE is the corresponding
feed-in tariff (MITYC, 2007b) according to the electric power of the transfor-
mation plant and year life of the generation plant. Feed-in tariffs for electricity
production from biogas are shown in Table 6. Additionally, we have calculated
the economic profit in the case that the generated heat from AD/ICE system is
used by the own factory or it is sold. In this case, revenues include the economic
value of the generation of heat, calculated as RH = Pr,f,AD/ηAD ·ηh,AD ·hAD ·Ph
where RH are the economic revenues from heat, ηh,AD is the heat efficiency of
the AD/ICE system and Ph is the price of heat. Heat efficiency is assumed to be
40% (Murphy et al., 2004) and the price of heat is considered as 0.06 e/kWh.
O&M costs are calculated as a fraction of the total capital investment (TCI),
O&M = α ·Pr,p,GF ·Cinv,AD, where α is taken as 6% (Resch et al., 2006). Cost
of residues is considered as zero since AD/ICE plants are located in the own
factories (therefore, transport costs are avoided) and it is not considered a value
in origin for these residues.
Figure 2 shows the steps followed to carry out the economic analysis for
AD/ICE electricity generation. As a result, power, electric generation and the
economic profitability of AD/ICE plants are obtained as a function of the typical
capacity of production of slaughterhouses, dairy factories and breweries in Spain.
Additionally, a sensitivity analysis is carried out to treat the uncertainty of the
investment costs, O&M costs, discount rate, operating hours and heat price.
The presented results for AD/ICE installations are not geo-referenced since
24

there are available geographical data about the production by province, but not
for the location of the factories.
4. Results: energy potential
The combined potential for the agro-industrial residues is estimated at 2625.7
ktoe/y of primary energy; for the sake of comparison, this represents 1.77% of
the primary energy consumption in Spain in 2007 (MITYC, 2008a). Table 3
shows the overall energy potential broken down by residue. Figures 3 and 4
show the geographic distribution of the energy potential of the residues. Olive
mill, wood processing and winery residues have the higher potentials. Three
Andalusian provinces, Jaen (187 ktoe/y), Cordoba (118 ktoe/y) and Seville (48
ktoe/y) exhibit the highest potential from olive mill residues. On the other hand,
the largest potentials for residues from forest operations and wood processing
industries are in the North-West of the country, corresponding to regions with
wettest climate (Figure 3); Lugo, A Coruna and Asturias present 216, 214 and
124 ktoe/y respectively. The highest potential from winery residues is located in
the provinces on the South sub-plateau of Spain (Castilla-La Mancha), Ciudad
Real, Toledo and Cuenca with energy potentials of 66, 35 and 25 ktoe/y respec-
tively. For this residue, the geographic dispersion is higher than the observed
one for olive-mill and wood-processing residues.
The results obtained in the present contribution can be related to some other
ones reported in previous studies by other authors; Table 4 presents a summary
of the energy potentials. In addition to the results summarized in Table 4,
the combined potential for olive mill residues and wood processing residues is
estimated by IDAE (2005) at 2949 ktoe for Spain (compared with 2053 ktoe
obtained in this study). In general, the results can be judged to be in good
agreement, given that differences in the estimates can arise out of a multiplicity
of factors (including the methodology used, the resource-availability data, or
the heating value of the residues).
25

5. Results: economic analysis
In this section the results of the economic analysis for the considered op-
tions (GF/ST, CF/PC and AD/ICE) for electricity conversion of agro-industrial
residues are presented.
5.1. GF/ST
Here, the results of the economic analysis of electricity generation from olive-
mill, winery, wood-processing, nut-processing and rice-mill residues through
GF/ST plants are presented. The results are shown separately for each residue.
GF/ST plants feed with different residues have not been considered in this work.
5.1.1. Olive-mill residues
Table 9 shows the location, electric power, electric generation, NPV and
PI of the GF/ST plants feed with agro-industrial residues that have positive
NPV . Figure 5 shows the electric power and location of these GF/ST plants.
We have calculated only 6 provinces (all of them located in the South of
Spain, as it is seen in Figure 5) with profitable GF/ST plants feed with olive-
mill residues, totalling 216.8 MWe and an electric generation of 1.51 TWh/year.
Respect to the energy-potential of this residue in Spain, 579.9 ktoe/year, this
electric generation represents, approximately, a 22.3% of the primary energy of
this residue. Figure 6 shows the number of GF/ST plants for different ranges
of electric power calculated for the residues analysed in this work. Indirectly,
Figure 6 indicates the geographical dispersion of the residues. Olive-mill residues
are relatively concentrated since there are several plants with electric power over
20 MWe and, at the same time, an important number of plants with electric
power under 1 MWe. This indicates that there are provinces with a high energy-
potential of olive-mill residue while the rest of provinces have a very low energy-
potential, as it also can be seen in Figure 3.
Figures 7, 8, 9 and 10 shows the influence in the profitability of GF/ST
plants of the variation of the cost of residues, investment costs, O&M costs and
discount rate, respectively. In the case of GF/ST plants feed with olive-mill
26

residues, cost of residues and investments costs have the largest influence in the
economic profitability; thus, a reduction of 50% of the investment costs increases
the electric power of GF/ST plants with positive NPV to 268 MWe; on the
other hand, a increase of 50% of the investment cost diminishes the number of
profitable GF/ST plants, totalling 125 MWe. In terms of the electric genera-
tion of profitable GF/ST plants, it is increased to 1.87 TWh when investment
cost is reduced the 50% from assumed values, and it is reduced to 0.875 TWh
when investment cost is increased the 50%. The influence of discount rate is
important too, but to a lesser extent that investment and residues cost. Among
the analysed parameters, O&M costs has the lowest influence in the economic
profitability.
5.1.2. Winery residues
There are only 3 provinces with profitable GF/ST plants feed with winery
residues (as it is seen in Figure 5 and Table 9), totalling 53.4 MWe and a
generation of 0.373 TWh/year. Respect to the energy-potential of this residue
in Spain, 282.4 ktoe/year, this electric generation represents, approximately, a
11.3% of the primary energy of the winery residues.
Energy-potential of winery residues is lower than olive-mill residues one and,
as it can see in Figure 6, winery residues are more dispersed geographically
than olive-mill residues. So, the GF/ST plants calculated for winery residues
have electric power predominantly under 10 MWe. This worses the economic
profitability due to the effect of scale economies. Smaller GF/ST plants requires
higher specific investment costs and has lower electric efficiencies. For these
reasons, the electric generation of GF/ST plant with positive NPV represents a
low fraction of the primary energy of the residues.
Investments costs have the largest influence in the economic profitability
of GF/ST plants feed with winery residues; thus, a reduction of 50% of the
investment costs increases the electric power of GF/ST plants with positive
NPV to 118 MWe; on the other hand, a increase of 50% of the investment
cost makes that power of profitable GF/ST plants disminishes to 25 MWe. In
27
terms of the electric generation of profitable GF/ST plants, it is increased to
0.830 TWh when investment cost is reduced the 50% from assumed values, and
it is reduced to 0.175 TWh when investment cost is increased the 50%. The
influence of the cost of the residues and the discount rate is similar, but it is
lower than the influence of investment costs.
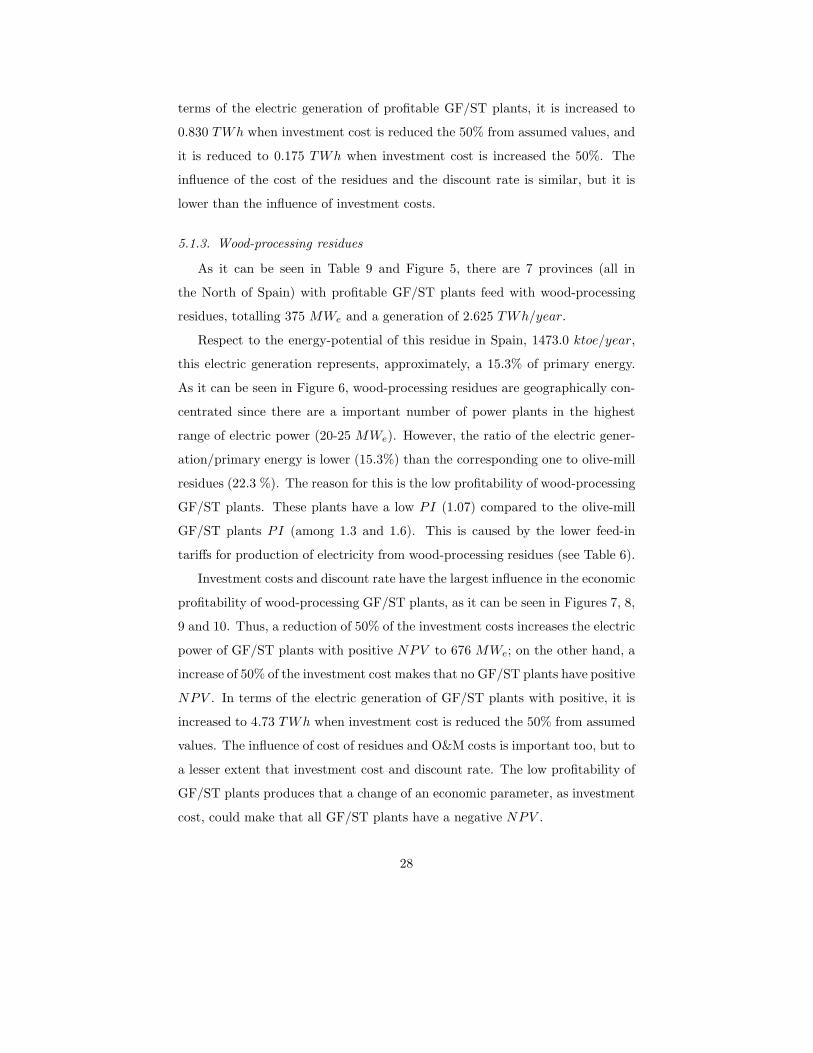
5.1.3. Wood-processing residues
As it can be seen in Table 9 and Figure 5, there are 7 provinces (all in
the North of Spain) with profitable GF/ST plants feed with wood-processing
residues, totalling 375 MWe and a generation of 2.625 TWh/year.
Respect to the energy-potential of this residue in Spain, 1473.0 ktoe/year,
this electric generation represents, approximately, a 15.3% of primary energy.
As it can be seen in Figure 6, wood-processing residues are geographically con-
centrated since there are a important number of power plants in the highest
range of electric power (20-25 MWe). However, the ratio of the electric gener-
ation/primary energy is lower (15.3%) than the corresponding one to olive-mill
residues (22.3 %). The reason for this is the low profitability of wood-processing
GF/ST plants. These plants have a low PI (1.07) compared to the olive-mill
GF/ST plants PI (among 1.3 and 1.6). This is caused by the lower feed-in
tariffs for production of electricity from wood-processing residues (see Table 6).
Investment costs and discount rate have the largest influence in the economic
profitability of wood-processing GF/ST plants, as it can be seen in Figures 7, 8,
9 and 10. Thus, a reduction of 50% of the investment costs increases the electric
power of GF/ST plants with positive NPV to 676 MWe; on the other hand, a
increase of 50% of the investment cost makes that no GF/ST plants have positive
NPV . In terms of the electric generation of GF/ST plants with positive, it is
increased to 4.73 TWh when investment cost is reduced the 50% from assumed
values. The influence of cost of residues and O&M costs is important too, but to
a lesser extent that investment cost and discount rate. The low profitability of
GF/ST plants produces that a change of an economic parameter, as investment
cost, could make that all GF/ST plants have a negative NPV .
28

5.1.4. Rice-mill residues
Only a GF/ST plant feed with rice-mill residues is calculated with a positive
NPV (see Table 9). It is located in the South of Spain (see Figure 5) and has an
electric power of 8.6 MWe. Its electric generation is 0.06 TWh/year. Respect
to the energy-potential of this residue in Spain, 52.8 ktoe/year, this electric
generation is equivalent, approximately, to 9.7% of primary energy of rice-mill
residues in Spain.
Rice-mill residues energy potential is low, and further, it is geographically
dispersed (see Figure 6); as a result, nearly all calculated GF/ST plants have
electric power under 5 MWe. Scale economies is really negative for GF/ST
plants with these sizes; and for this reason, the calculated ratio electric genera-
tion/primary energy is so low.
Investments costs and discount rate have the largest influence in the eco-
nomic profitability (see Figures 7, 8, 9 and 10) as it is expected due to small
sizes of GF/ST plants and the low cost of this residue (see Table 7). A reduc-
tion of 50% of the investment costs increases the electric power of GF/ST plants
with positive NPV to 21 MWe (0.14 TWh); on the other hand, a increase of
50% of the investment cost makes that no GF/ST plants have positive NPV .
5.1.5. Nut-processing residues
With the assumed economic parameters, all the calculated nut-processing
GF/ST plants have negative NPV . Figure 6 shows that all calculated GF/ST
plants feed with nut-processing residues have electric power under 5 MWe. It
is due to the low energy-potential of this residue and its high geographical
dispersion. The small plant-sizes makes difficult to get an economic profitability
for these plants.
Investment cost and discount rates are the economic parameters with a large
influence in the economic profitability of these plants, as it is seen in Figures 7,
8, 9 and 10. This is expected due to the small sizes of the GF/ST plants and
the low cost of the residue (see Table 7). In the best case, a reduction of 50%
of the investment costs, the electric power of profitable nut-processing GF/ST
29
plants increases to 16.8 MWe (0.12 TWh).
5.2. Coal co-firing
In this section the results obtained for the coal co-firing of agro-industrial
residues in Spain are presented. Table 10 shows the potential share of residues
in coal power plants (considering only residues generated in the same province)
whose lifetime will be extended, at least, until 2020. Assuming only CF/PC
installations with substantial shares (more than 5%) and taken the maximum
residues power share as 10% (higher residues share could reduce the efficiency
of coal boiler (Tillman, 2000) and cause problems of corrosion (Sondreal et al.,
2001)), co-firing power from agro-industrial residues rises to 430.9 MWe and
electric generation is up to 1.724 TWh (see Table 11). Figure 11 shows the
location of these CF/PC installations.
Figures 12 and 13 show the electricity cost for co-firing wood-processing
residues and olive-mill residues, respectively. We have extended the economic
analysis only to these residues, since, as it can be seen in Table 10, only olive-mill
and wood processing residues could have large shares in coal boilers. For both
residues, operating hours is the parameter with the highest influence in the cost
of electricity; investment costs and cost of residues have a considerable influence,
too. For wood-processing residues, in most of the cases, electricity cost is under
0.035 e/kWh. For olive-mill residues, electricity cost is under 0.055 e/kWh in
most of the range studied. Both costs are considerably lower than feed-in tariffs
given for combustion of wood-processing residues and olive-mill residues.
5.3. Anaerobic digestion
In this section, the results of the economic analysis for production of elec-
tricity through the anaerobic digestion of brewery residues and wastewater from
dairy products and meat-processing industries are presented. Table 12 shows
the electric power, NPV if only electricity is produced, and, NPV and PI
in the case that heat is used, of AD/ICE installation corresponding to differ-
ent sizes of the generating-residues industries. The calculated electric power of
30

AD/ICE facilities for the considered sizes of the industries range from 0.135 to
2.32 MWe, though in most of the cases, electric power is under 0.6 MWe. In
Table 12 is observed that the net present value of AD/ICE plants that produce
only electricity is negative for all the cases. These installations are profitable
only if generated heat can be used; further, in that cases, profitability index
of 1.5 are achieved. It is observed that PI increases along with the increase of
electric power due to the scale economies. Nevertheless, PI in the range of 0-0.5
MWe are larger than for higher electric powers; this is caused by feed-in tariffs.
As it is observed in Table 6, feed-in tariffs are higher in the range of 0-0.5 MWe
than for electric power greater than 0.5 MWe.
A sensitivity analysis of the economic profitability of AD/ICE plants has
been made. For it, a generic AD/ICE plants has been chosen with electric
power of 0.1 MWe, 0.25 MWe, 0.5 MWe and 1.0 MWe. Figure 14 and 15
present this sensitivity analyisis, respectively in the case that only electricity
is produced and in the case that heat is used or sold. The studied parameters
are: investment costs, discount rate, O&M costs and operating hours. It is
observed that investment costs and operating hours have the highest influence
on the net present value. When only electricity is produced, the net present
value is negative for most of the cases; conversely, net present value is positive
for most of the cases when heat is used. Therefore, profitability of AD/ICE
plants is highly dependent on the use of the generated heat; the feed-in tariffs
are not enough to consider only the production of electricity. Figure 16 shows
the NPV of the AD/ICE plants against heat price. It is observed that heat
prices above 0.04 e/kWh makes net present value positive for all the range of
AD/ICE electric powers.
6. Conclusions
In this study, the energy potentials from the organic residues of the most im-
portant agro-industries in Spain are estimated. These potentials are integrated
into a GIS and the results obtained are geo-referenced. The agro-industries
31
considered are: olive mills, wineries, wood-processing industries, nut-processing
industries, rice mills, meat-processing industries, diaries and breweries. Us-
ing the estimated energy potentials, the profitability of the electricity genera-
tion from these residues is calculated. Three waste-to-electricity technologies,
grate firing/steam turbine (GF/ST), co-firing in pulverized coal power plants
(CF/PC) and anaerobic digestion/internal combustion engine (AD/ICE), have
been considered. The two first ones, GF/ST and CF/PC, are analysed for the
use of olive-mill, winery, wood-processing, nut-processing and rice-mill residues,
and the last one, AD/ICE for the treatment of waste water of meat-processing
industries, diaries and breweries industries.
Wood-processing and olive-mill residues are the largest contributors in the
aggregated potential from agro-industry residues. This total potential is esti-
mated at 2625.7 ktoe/y of primary energy, which is equivalent to 1.77% of the
consumption of primary energy in Spain in 2007 (MITYC, 2008a). The higher
energy potential is located in the North-Western provinces of Spain (since them
have the largest energy potential of wood-processing residues) and the South
sub-plateau provinces of Spain (since them have the largest energy potential of
olive-mill residues). The potentials found in this work are consistent with par-
tial ones reported previously by other authors, within the variability resulting
from the use of different methods and data sources.
The economic analysis for the GF/ST plants shows that 28 GF/ST plants
have a positive net present value, totalling 653.6 MWe and an electric gener-
ation of 4.574 TWh, 1.46% of the gross electric generation in Spain in 2007
(MITYC, 2008a). Olive-mill and wood-processing residues are the largest con-
tributors to GF/ST power, 216.6 MWe and 375.0 MWe, respectively. How-
ever, the profitability of wood-processing residues GF/ST plants is lower than
olive-mill residues GF/ST plants one. This is caused because feed-in tariffs
for electricity produced by agro-industrial residues are higher than for wood-
processing residues; and, in spite of wood-processing residues costs are lower,
this does not offset the low feed-in tariff. This situation is reflected into the
installed electric power that use agro-industrial residues as fuel in Spain. There
32

are 206 MWe of electric power installations feed with agro-industrial residues:
125 MWe are feeded with olive-mill residues, 70 MWe with wood-processing
residues, 5.5 MWe with winery residues, 3.3 MWe with nut-processing residues
and 2.2 MWe with rice-mill residues (MITYC, 2008b; CNE, 2009). Therefore,
there is a wide margin to increase the electric power and generation from these
residues, specially for wood-processing residues. However, the low feed-in tar-
iffs for the electricity generation from this resource slows down the deployment
of power installations that use this residue. Respect to winery residues, nut-
processing and rice-mill residues the energy potential is low and, besides, they
are dispersed geographically. Due to it, calculated GF/ST plants have small
electric powers (in most of the cases, under 10 MWe or even lower) and for
these plant-sizes the effect of scale economies is really negative for the economic
profitability. Therefore, the use of these residues to generate electricity is not
probable currently. A reduction of investment costs of small GF/ST plants or
the development of small plant-sizes technologies with lower investment costs, as
for example, small gasification plants plus an internal combustion engine, could
improve the economic profitability of these residues. Biomass heating plants
are another option for the contribution of energy generation; currently there are
heat boilers feeded with almond shells in Spain (Rakos, 2003).
Respect to electricity generation by co-firing in coal power boilers, we have
calculated the potential share of residues in coal power plants (considering only
residues generated in the same province) whose lifetime will be extended, at
least, until 2020. Assuming only CF/PC installations with substantial shares
(more than 5%) and taken the maximum residues power share as 10% , we have
estimated a potential of co-firing power from agro-industrial residues of 430.9
MWe, with an electric generation of 1.724 TWh. Only olive-mill residues and
wood-processing residues have enough enegy potential to have large shares in
coal boilers. we have carried out an sensitiviy analysis of the electricity cost
by co-firing using as fuel wood-processing residues and olive-mill residues. For
wood-processing residues, in most of the cases, electricity cost is under 0.035
e/kWh. For olive-mill residues, electricity cost is under 0.055 e/kWh in most of
33

the range studied. Both costs are considerably lower than given feed-in tariffs
for combustion of wood-processing residues and olive-mill residues. herefore,
CF/PC could be a profitable option, compared with combustion alone. However,
the lack of regulation about co-firing (MITYC (2007b) does not specify any feed-
in tariff for CF/PC, only it establishes that feed-in tariff will be calculated for
each specific case) avoids the deployment of this option for residues. Currently,
there are not co-firing installations working in Spain.
AD/ICE option is considered for brewery residues and wastewater from dairy
products and meat-processing industries. The electric power of AD/ICE facili-
ties has been calculated for the typical sizes of the industries. As a result, the
electric power range goes from 0.135 to 2.32 MWe, though in most of the cases,
it is under 0.6 MWe. For these installations without heat recovery, net present
value is negative for all the range of electric powers. In the case that heat is
used, AD/ICE installations are profitable if heat prices are above 0.04 e/kWh.
It must be mentioned that AD/ICE plants form part of the waste water treat-
ment system, but in this work, the profit due to the treatment of the waste
water has not been accounted for. For this reason, profitability of AD/ICE
plants could be higher than calculated one in this work. Nevertheless, the use
of heat improves significantly the profitability of AD/ICE plants. Currently, the
deployment of this technology is limited in Spain since factories use generally
other treatment for waste water (as for example, aerobic systems), and, if their
requirements of heat are high, use gas co-generation systems (which have feed-in
tariffs, too).
To sum up, except for olive-mill residues, there is an important unused
potential for generation of electricity from agro-industrial residues in Spain.
There are different reasons for this: for wood-processing residues, the low feed-
in tariffs produce a low economic profitability; for winery, nut-processing and
rice-mill residues, the low energy-potential and high geographical dispersion
cause an important negative effect of the scale economies in the profitability;
the option of CF/PC is interesting, but the lack of regulation and of a fix feed-
in tariff avoids its deployment; the installation of ADE/ICE plants depends
34

highly on the possibility to use or sold the generated heat for the industry,
and, besides, it must compete with other technologies that could develop the
same work. Regulation, adequate feed-in tariffs and development of profitable
technologies for small sizes of power plants could be the main tools to improve
the energy use of agro-industrial residues.
35
References
AFB-NET. Export & import possibilities and fuel prices. Country report of
Spain. Tech. rep., European Agriculture and Forestry Biomass Network; 2000.
Agarwal P, La Nouze R. Transfer processes local to the coal particle: a review of
drying, devolatilization and mass transfer in fluidized bed combustion. Chem
Eng Res Des 1989;67 (5):457-80.
AINIA. Mejores tecnicas disponibles en la industria lactea (in Spanish). Tech.
rep., Instituto Tecnologico Agroalimentario; 1997. See also: http://www.prtr-
es.es/data/images/la%20industria%20l%C3%A1ctea-3686e1a542dd936f.pdf.
Alvarado Lassman A, Rustrian E, Garcıa Alvarado M, Rodrıguez Jimenez G,
Houbron E. Brewery wastewater treatment using anaerobic inverse fluidized
bed reactors. Bioresour Technol 2008;99 (8): 3009-15.
Amico V, Chillemi R, Mangiafico S, Spatafora C, Tringali C. Polyphenol-
enriched fractions from sicilian grape pomace: HPLC-DAD analysis and an-
tioxidant activity. Bioresour Technol 2008;99 (13):5960-66.
Andalusian Energy Agency. Situacion de la biomasa en Andalucıa (in Span-
ish); 2007. See also: http://www.dibiosur.com/doc/es-situacion-biomasa-
andalucia.pdf.
Armesto L, Bahillo A, Veijonen K, Cabanillas A, Otero J. Combustion behaviour
of rice husk in a bubbling fluidised bed. Biomass Bioenerg 2002;23 (3):171-9.
Baumgartel T, Kluth H, Epperlein K, Rodehutscord M. A note on digestibility
and energy value for sheep of different grape pomace. Small Ruminant Res
2007;67 (2-3): 302-6.
Beagle E. Rice-husk conversion to energy. Tech. rep., Food and Agriculture
Organization of the United Nations; 1978.
36
Berggren M, Ljunggren E, Johnsson F. Biomass co-firing potentials for elec-
tricity generation in poland–matching supply and co-firing opportunities.
Biomass Bioenerg 2008;32 (9):865-79.
Boateng A, Walawender W, Fan L, Chee C. Fluidized-bed steam gasification of
rice hull. Bioresour Technol 1992;40 (3):235-9.
Borja R. Effect of organic loading rate on anarobic treatment of slaughterhouse
wastewater in a fluidised-bed reactor. Bioresour Technol 1995;52 (2): 157-62.
Borja R, Banks C, Wang Z, Mancha A. Anaerobic digestion of slaughterhouse
wastewater using a combination sludge blanket and filter arrangement in a
sigle reactor. Bioresour Technol 1998;65 (1-2): 125-33.
Boukis I, Vassilakos N, Karellas S, Kakaras E. Techno-economic analysis of the
energy exploitation of biomass residues in Heraklion Prefecture–crete. Renew.
Sust. Energ Rev. 2009;13 (2):362-77.
Bridgwater A, Toft A, Brammer J. A techno-economic comparison of power pro-
duction by biomass fast pyrolysis with gasification and combustion. Renew.
Sust. Energ Rev. 2002;6 (3):181-248.
Caixeta C, Cammarota M, Xavier A. Slaughterhouse wastewater treatment:
evaluation of a new three-phase separation system in a UASB reactor. Biore-
sour Technol 2002;81 (1):61-9.
Caputo A, Scacchia F, Pelagagge P. Disposal of by-products on olive oil indus-
try: waste-to-energy solutions. Appl Therm Eng 2003; 23 (2): 197-214.
Celma A, Rojas S, Lopez Rodrıguez F. Waste-to-energy possibilities for in-
dustrial olive and grape by-products in Extremadura. Biomass Bioenerg
2007;31 (7):522-34.
Cerveceros de Espana. Informe socioeconomico del sector de la cerveza en
Espana (in Spanish); 2008. See also: http://www.cerveceros.org/
37
CNE. Informacion estadıstica sobre las ventas de energıa en regimen especial.
(in Spanish); 2009. See also: http://www.cne.es/cne/Publicaciones?id nodo=
144&accion=1&sIdCat=10&keyword=&auditoria=F.
COAG. Situacion actual sector lacteo. Anuario 2006 (in Spanish). Tech. rep.,
Coordinadora de Organizaciones de Agricultores y Ganaderos; 2006. See also:
http://194.30.12.92/rep ficheros web/ea9c59fd2131a9483dac67eea7df002e.pdf.
Cronin C, Lo K. Anaerobic treatment of brewary wastewater using UASB reac-
tors seeded with activated sludge. Bioresour Technol 1998;64 (1): 33-8.
DeMeo E. Renewable Energy Technology Characterizations. Tech. rep., Electric
Power Research Institute; 1997.
Demirbas A. Effect of initial moisture content on the yields of oily products
from pyrolysis of biomass. J Anal Appl Pyrolysis 2004;71 (2): 803-15.
Demirbas A, Akdeniz F. Fuel analyses of selected oilseed shells and supercritical
fluid extraction in alkali medium. Energ Convers Manage 2002; 43 (15): 1977-
84.
Di Blasi C, Tanzi V, Lanzetta M. A study on the production of agricultural
residues in Italy. Biomass Bioenerg 1997;12 (5):321-31.
Dornburg V, Faaij APC. Efficiency and economy of wood-fired biomass energy
systems in relation to scale regarding heat and power generation using com-
bustion and gasification technologies. Biomass Bioenerg 2001;21 (2):91-108.
EPA. Compilation of air pollutant emission factors. Tech. rep., Environmental
Protection Agency of the United States; 2000.
Ericsson K. Co-firing-a strategy for bioenergy in Poland? Energy 2007;32(10):
1838-47.
Ericsson K, Nilsson L. Assesment of the potential biomass supply in Europe
using a resource-focused approach. Biomass Bioenerg 2006;30 (1): 1-15.
38
European Council. European Council Regulation 1493/1999; 1999.
Ezeonu F, Okaka A. Process kinetics and digestion efficiency of anaerobic batch
fermentation of brewers’ spent grains (bsg). Process Biochem 1996;31 (1):7-12.
Faaij APC. Bio-energy in Europe: changing technology choices. Energ Policy
2006;34 (3):322-42.
Fang M, Yang L, Chen G, Shi Z, Luo Z, Cen K. Experimental study on
rice husk combustion in a circulating fluidized bed. Fuel Process. Technol
2004;85 (11):1273-82.
FAO. Energy conservation in the mechanical forest industries. Tech. rep., Food
and Agriculture Organization of the United Nations, Rome; 1991.
FIAB. Perfil de la industria alimentaria espanola (in Spanish). Tech. rep., Fed-
eracion Espanola de Industrias de la Alimentacion y Bebidas; 2006. See also:
http://www.fiab.es.
Flynn P, Ghafoori E. Optimun sizing for anaerobic digestion. Tech. rep., De-
partment of Mechanical Engineering. University of Alberta; 2006.
Fountoulakis M, Drakopoulou S, Terzakis S, Georgaki E, Manios T. Potential for
methane production from typical mediterranean agro-industrial by-products.
Biomass Bioenerg 2008;32 (2): 155-61.
Garcıa A. Co-combustion de la biomasa. papel y problematica tecnico-
economica de la co-combustion de la biomasa (in Spanish);2006. See also:
http://www.upcomillas.es/catedras/crm/report06-1.html.
Gonzalez J, Ganan J, Ramiro A, Gonzalez Garcıa C, Encinar J, Sabio E, Roman
S. Almond residues gasification plant for generation of electric power. Prelim-
inary study. Fuel Process. Technol 2006;87 (12-13): 149-55.
Gonzalez J, Gonzalez-Garcıa A, Ramiro C, Gonzalez J, Sabio E, Ganan J,
Rodrıguez M. Combustion optimisation of biomass residue pellets for do-
mestic heating with a mural boiler. Biomass Bioenerg 2004;27 (2):145-54.
39

Haridas A, Suresh S, Chitra K, Manilal V. The buoyant filter bioreactor: a high-
rate anaerobic reactor for complex wastewater-process dynamics with dairy
effluent. Water Res 2005;39 (6): 993-1004.
Haykiri-Acma H, Yaman S. Effect of co-combustion on the burnout of lig-
nite/biomass blends: A Turkish case study. Waste Manage 2007; 28 (11):2077-
84.
Hughes E. Biomass cofiring: economics, policy and opportunities. Biomass
Bioenerg 2000;19 (6):457-65.
IDAE. Spanish Renewable Energy Plan 2005-2010. Tech. rep., Institute for Di-
versification and Saving of Energy; 2005. See also: http://www.idae.es/.
Janczukowicz W, Zielinski M, Debowski M. Biodegradability evaluation of dairy
effluents originated in selected sections of dairy production. Bioresour Technol
2007;99 (10):4199-205.
Kapellakis I, Tsagarakis K, Avramaki Ch, Angelakis A. Olive mill wastewater
management in river basins: A case study in Greece. Agr Water Manage
2006;82 (3):354-70.
Kueng Song L, Paul Wang H, Lin CJ, Ching-I J. A process development for
gasification of rice husk. Fuel Process Technol 1998;55 (3):185-92.
Kuiper L, Sikkema R, Stolp J. Establishment needs for short rotation forestry
in the EU to meet the goals of the commission’s White Paper on renewable
energy. Biomass Bioenerg 1998;15 (6):451-56.
Langreo A. Los mercados de carnes en Espana, en el proceso de verticalizacion
(in Spanish). Distribucion y consumo 2002;12 (62): 43-66.
Maiti S, Dey S, Purakayastha S, Ghosh B. Physical and thermochemical char-
acterization of rice husk char as a potential biomass energy source. Bioresour
Technol 2006;97 (16):2065-70.
40

Malaspina F, Cellamare C, Sante L, Tilche A. Anaerobic treatment of
cheese whey with a downflow-upflow hybrid reactor. Bioresour Technol
1996;55 (2):131-39.
Mansaray K, Ghaly A. Thermal degradation of rice husks in nitrogen atmo-
sphere. Bioresour Technol 1998;65 (1-2):13-20.
Masse D, Masse L. The effect of temperature on slaughterhouse wastewa-
ter treatment in anaerobic sequencing batch reactors. Bioresour Technol
2001;76 (2):91-98.
Matsumura Y, Inoue T, Komoto K, Hirata S, Hada K, Fukuda K, Minowa T,
Yamamoto H. The scale of biomass production in Japan. Biomass Bioenerg
2005;29 (5):321-30.
Matteson G, Jenkins B. Food and processing residues in California: Re-
source assessment and potential for power generation. Bioresour Technol
2007;98 (16):3098-105.
MITYC, 2007a. Informe del Ministerio de Industria, Turismo y Comercio
2006. Sectores y polıticas (in Spanish). See also: http://www.mityc.es/es-
ES/IndicadoresyEstadisticas/Informes/InformesMITYC/Sectores%20y%20P
ol%C3%ADticas/Informe%202006.pdf.
MITYC, 2007b. Royal decree 661/2007.
MITYC, 2008a. Energy in Spain - 2007 (in Spanish). See also:
http://www.mityc.es/energia/es-ES/Servicios1/Destacados/LaEnerg%C3%
ADaenEspa%C3%B1a2007.pdf.
MITYC, 2008b. Registro administrativo de productores de electricidad en
regimen especial (in Spanish). See also: http://www.mityc.es/energia/electri
cidad/RegimenEspecial/Paginas/Index.aspx.
MMA. Pollution prevention in olive oil production. Tech. rep., Regional Activity
Centre for Cleaner Production. Spanish Ministry of Environment; 2000.
41

MMA, 2007. Anuario de Estadıstica Agroalimentaria (in Spanish). See also:
http://www.mapa.es/es/estadistica/pags/anuario/Anu 06/indice.asp.
MMA, 2008a. Informe socioeconomico del sector de la cerveza en Espana (in
Spanish). See also: http://www.mapa.es/notas/documentos/n080418%20Inf
orme Socioeconomico Cerveza%202007.pdf.
MMA, 2008b. Resultados de la encuesta estructural del sector lacteo en Espana
(in Spanish). See also: http://www.mapa.es/es/estadistica/pags/Lactea/lact
ea anual.htm.
Murphy JD, McKeogh E, Kiely G. Technical/ economic/ environmental analysis
of biogas utilisation. Appl Energy 2004;77 (4):407-27.
Mussatto S, Dragone G, Roberto I. Brewers’ spent grain: generation, charac-
teristics and potential applications. J Cereal Sci 2006; 43 (1):1-14.
Ozdemir F, Akinci I. Phisical and nutritional properties of four major commer-
cial turkish hazelnut varieties. J Food Eng 2004;63 (3):341-47.
Penniall C, Williamson C. Feasibility study into the potential for gasifica-
tion plant in the New Zealand wood processing industry. Energ Policy
2009;37 (9):3377-86.
Rakos C. Final Report BIOHEAT. Promoting biomass heating in large building
and blocks; 2003. See also: http://www.bioheat.info/handbook/index int.
html.
REE. Informe del sistema electrico espanol 2008 (in Spanish); 2009. See also:
http://www.ree.es/sistema electrico/informeSEE.asp.
Resch G, Faber T, Haas R, Ragwitz M, Held A, Konstantinaviciute I. Potentials
and cost for renewable electricity in Europe. Report (D4) of the IEE project
optres: Assessment and optimisation of renewable support schemes in the
European electricity market. Tech. rep., Intelligent Energy Europe; 2006.
42
Rodrıguez Rebollo M. Manual de industrias carnicas (in Spanish). 1st ed.
Madrid: Publicaciones tecnicas alimentarias S.A.; 1998.
Salminen E, Rintala J. Anaerobic digestion of organic solid poultry slaugther-
house waste - a review. Bioresour Technol 2002;83 (1):13-26.
Santos M, Jimenez J, Bartolome B, Gomez Cordovas C, del Nozal M. Variability
of brewer’s spent grain within a brewery. Food Chem 2003:80 (1);17-21.
Siemons R, Martijn V, van den Berg D, McChesney I, Whiteley M, Nikolaou
N. Bio-energy’s role in the EU energy market. A view of developments until
2020. Tech. rep., BTG Biomass technology group BV; 2004.
Sondreal EA, Benson SA, Hurley JP, Mann MD, Pavlish JH, Swanson ML,
Weber GF, Zygarlicke CJ. Review of advances in combustion technology and
biomass cofiring. Fuel Process Technol 2001;71 (1-3):7-38.
Tillman DA. Biomass cofiring: the technology, the experience, the combustion
consequences. Biomass Bioenerg 2000;19 (6):365-84.
Tritt W, Schuchardt F. Materials flow and possibilities of treating liquid and
solid wastes from slaughterhouses in Germany. A review. Bioresour Technol
1992;41 (3):235-45.
UNESA. Prospectiva de generacion electrica 2030 (in Spanish). Tech.
rep., Asociacion Espanola de la Industria Electrica; 2007. See also:
http://www.unesa.es.
Vidal G, Carvalho A, Mendez R, Lema J. Influence of the content in fats and
proteins on the anaerobic biodegradability of dairy wastewaters. Bioresour
Technol 2000;74 (3):231-39.
Vitolo S, Petarca L, Bresci B. Treatment of olive oil industry wastes. Bioresour
Technol 1999; 67 (2):129-37.
Walla C, Schneeberger W. The optimal size of biogas plants. Biomass Bioenerg
2008;32 (6):551-57.
43

Werther J, Saenger M, Hartge E-U, Ogada T, Siagi Z. Combustion of agricul-
tural residues. Prog Energ Combust Sci 2000;26 (1): 1-27.
Yu H, Gu G. Biomethanation of brewery wastewater using an anaerobic upflow
blanket filter. J Clean Prod 1996;4 (3-4):219-23.
44
List of Figures
1 Methodology used for the economic analysis of GF/ST plants and
CF/PC installations. . . . . . . . . . . . . . . . . . . . . . . . . . 46
2 Methodology used for the economic analysis of AD/ICE plants. . 47
3 Geographic distribution of the energy potential of olive-mill, win-
ery, wood-processing and rice-mill residues. . . . . . . . . . . . . 48
4 Geographic distribution of the energy potential of nut-processing,
meat-processing, wood-processing, dairy plants and brewery residues. 49
5 Geographic location of the GF/ST plants with positive net present
value. . . . . . . . . . . . . . . . . . . . . . . . . . . . . . . . . . 50
6 Number of GF/ST plants for different ranges of electric power
and for the residues analysed in this work. . . . . . . . . . . . . . 51
7 Influence of the residues cost in the profitability of GF/ST plants. 52
8 Influence of the investment cost in the profitability of GF/ST
plants. . . . . . . . . . . . . . . . . . . . . . . . . . . . . . . . . . 53
9 Influence of the discount rate in the profitability of GF/ST plants. 54
10 Influence of the O&M cost in the profitability of GF/ST plants. . 55
11 Geographic location of the CF/PC plants with substantial share
from agro-industrial residues. . . . . . . . . . . . . . . . . . . . . 56
12 Sensitivity analysis of the electricity cost by co-firing wood-processing
residues in coal power plants. . . . . . . . . . . . . . . . . . . . . 57
13 Sensitivity analysis of the electricity cost by co-firing olive-mill
residues in coal power plants. . . . . . . . . . . . . . . . . . . . . 58
14 Sensitivity analysis of electricity cost by AD/ICE plants without
heat recovery. . . . . . . . . . . . . . . . . . . . . . . . . . . . . . 59
15 Sensitivity analysis of electricity cost by AD/ICE plants with
heat recovery. . . . . . . . . . . . . . . . . . . . . . . . . . . . . . 60
16 Influence of the heat price in the profitability of AD/ICE plants
with heat recovery. . . . . . . . . . . . . . . . . . . . . . . . . . . 61
45
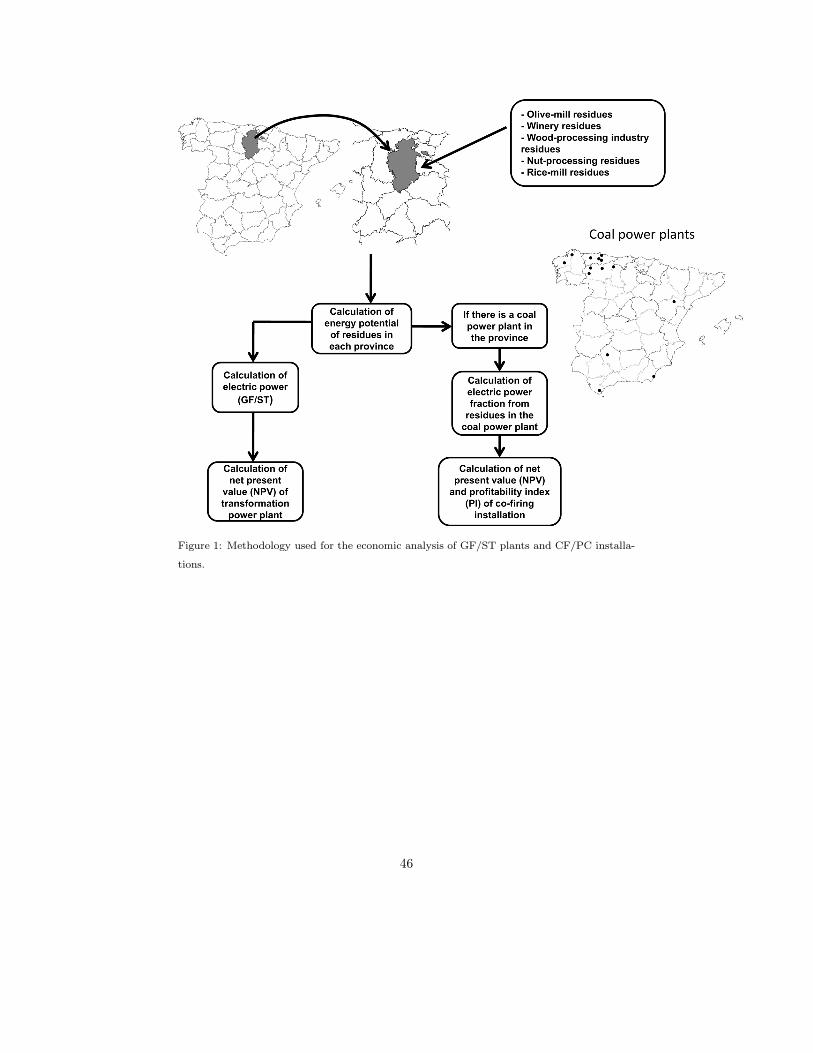
Figure 1: Methodology used for the economic analysis of GF/ST plants and CF/PC installa-
tions.
46
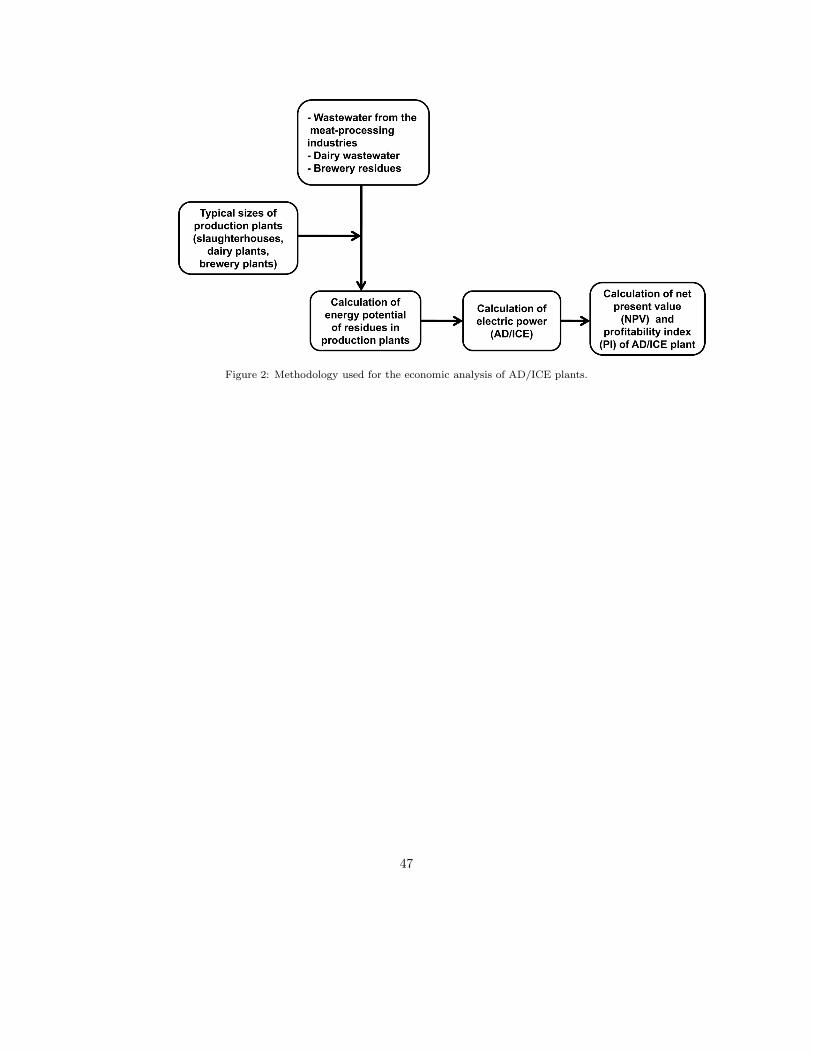
Figure 2: Methodology used for the economic analysis of AD/ICE plants.
47
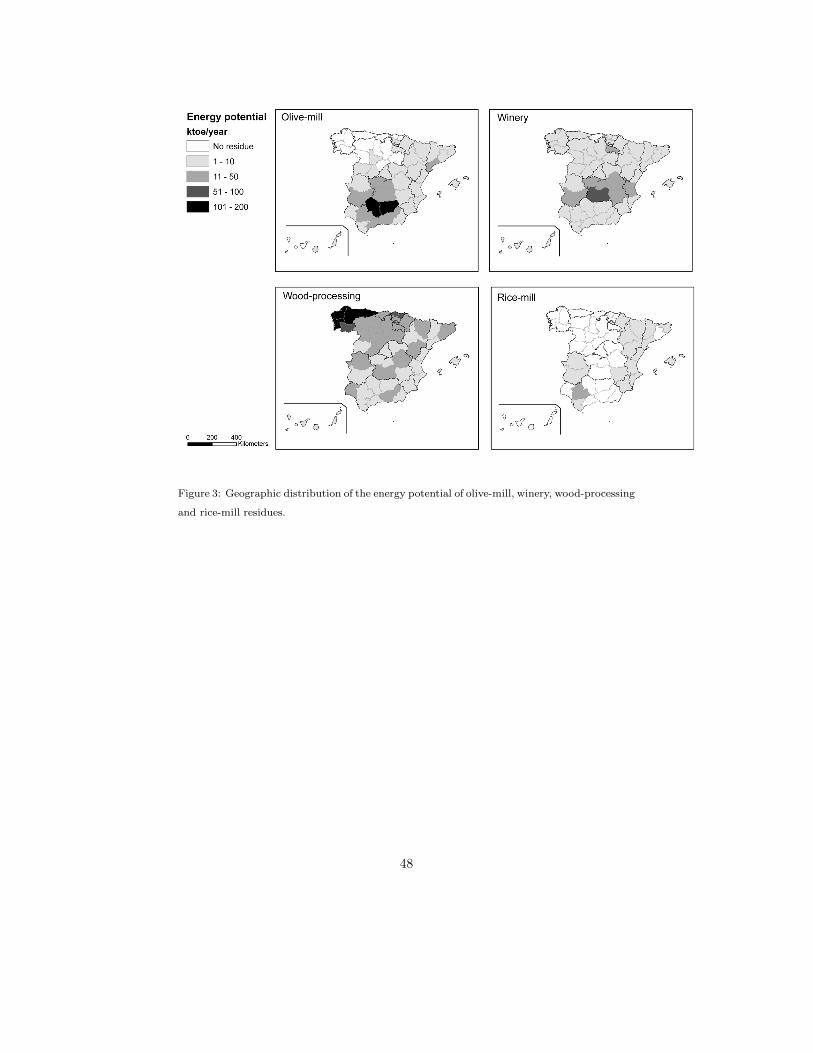
Figure 3: Geographic distribution of the energy potential of olive-mill, winery, wood-processing
and rice-mill residues.
48
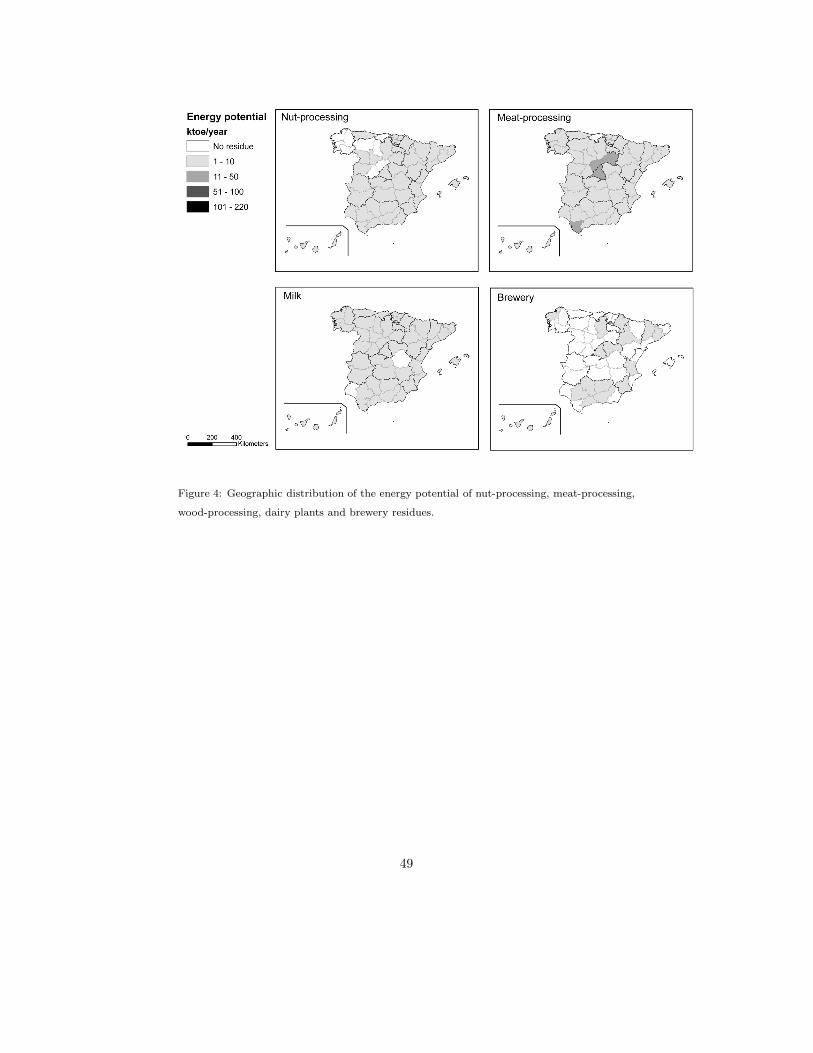
Figure 4: Geographic distribution of the energy potential of nut-processing, meat-processing,
wood-processing, dairy plants and brewery residues.
49
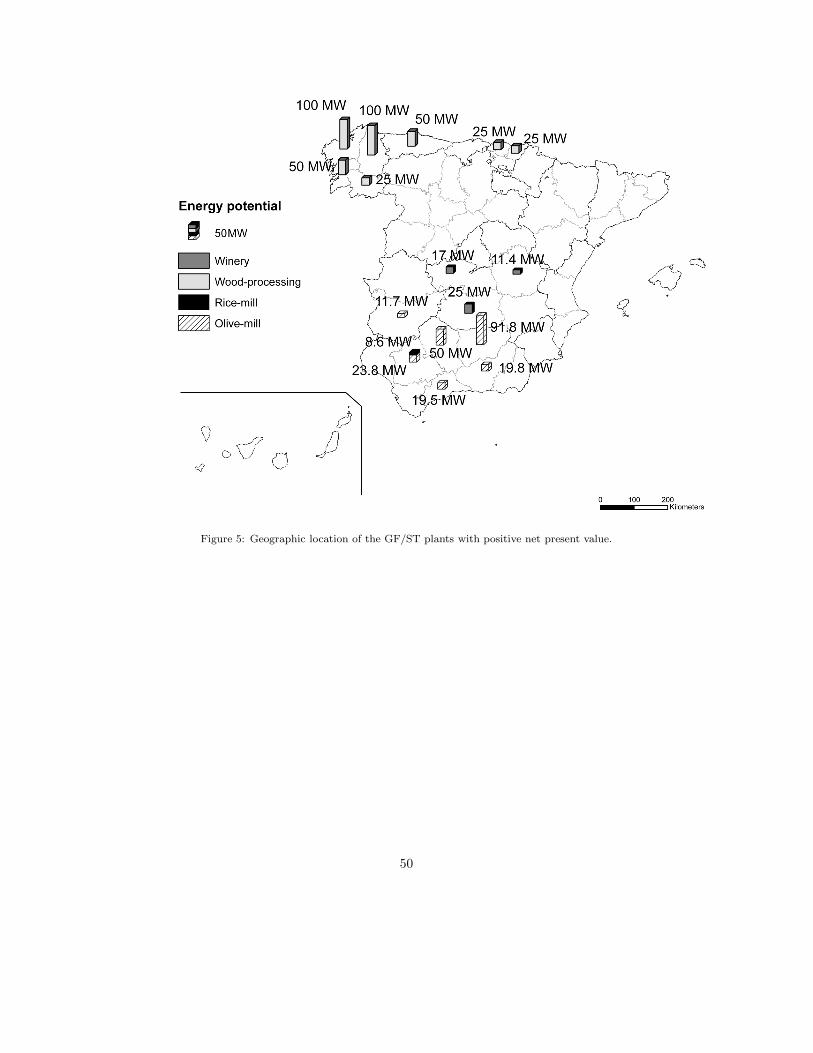
Figure 5: Geographic location of the GF/ST plants with positive net present value.
50

Figure 6: Number of GF/ST plants for different ranges of electric power and for the residues
analysed in this work.
51
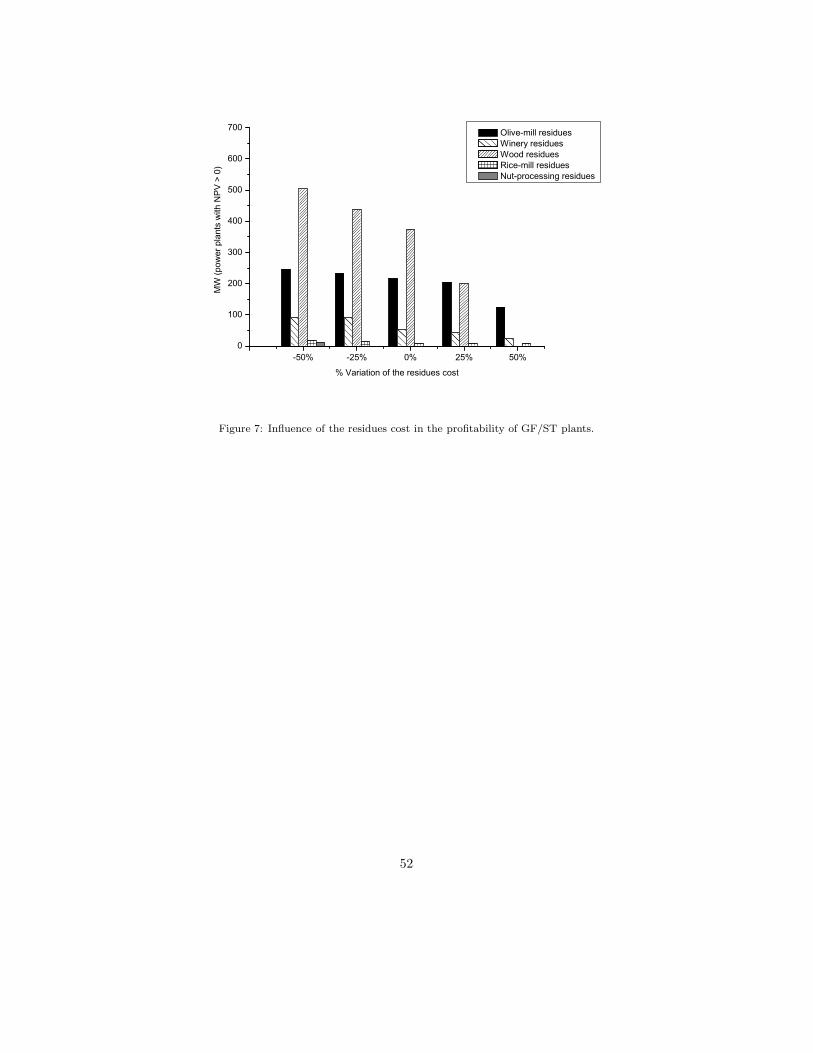
Figure 7: Influence of the residues cost in the profitability of GF/ST plants.
52
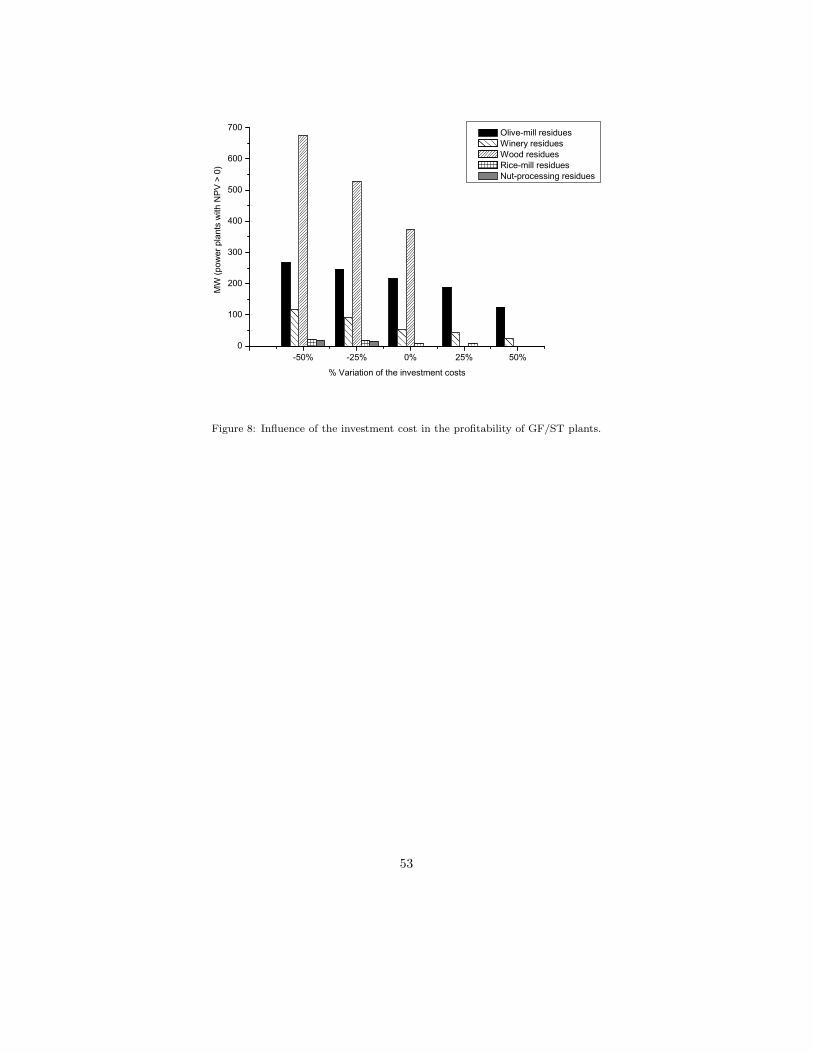
Figure 8: Influence of the investment cost in the profitability of GF/ST plants.
53

Figure 9: Influence of the discount rate in the profitability of GF/ST plants.
54

Figure 10: Influence of the O&M cost in the profitability of GF/ST plants.
55
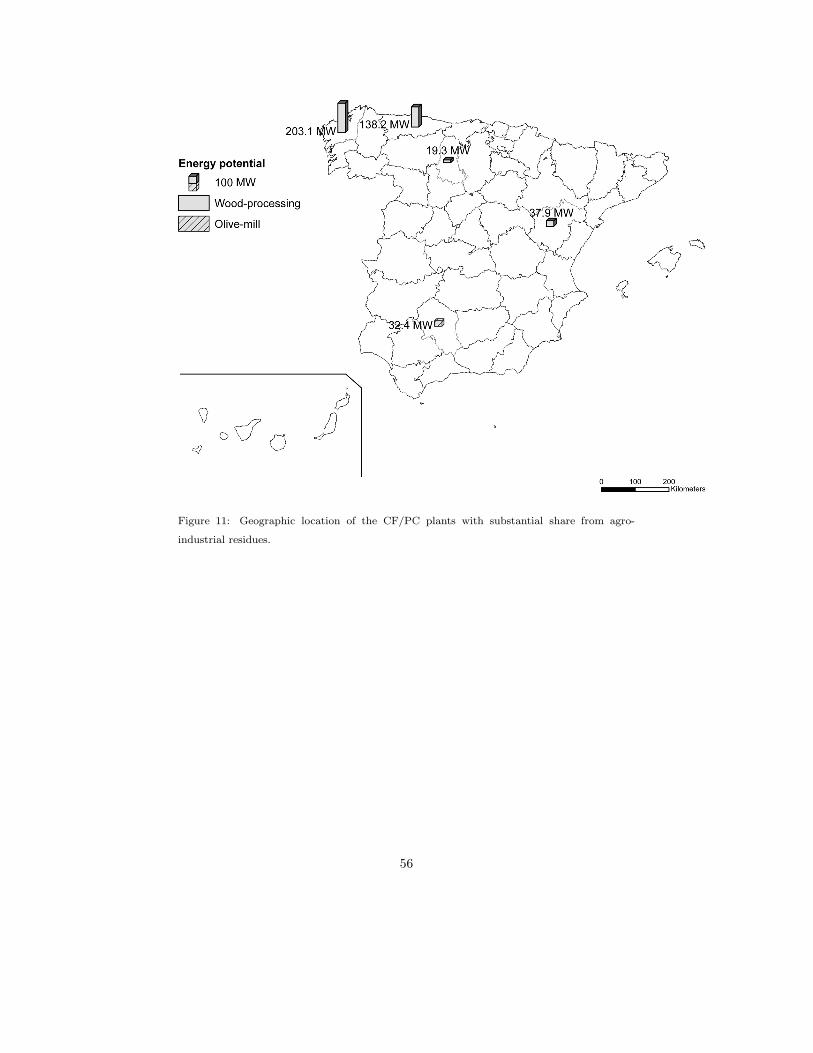
Figure 11: Geographic location of the CF/PC plants with substantial share from agro-
industrial residues.
56

Figure 12: Sensitivity analysis of the electricity cost by co-firing wood-processing residues in
coal power plants.
57
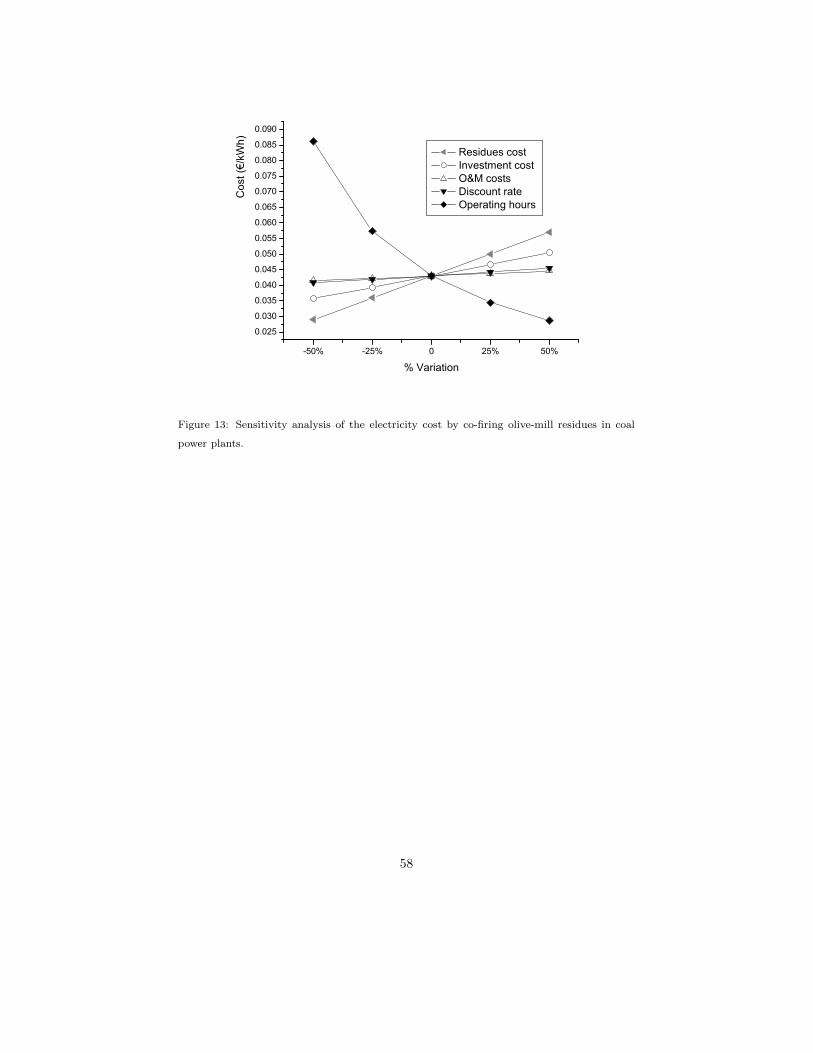
Figure 13: Sensitivity analysis of the electricity cost by co-firing olive-mill residues in coal
power plants.
58
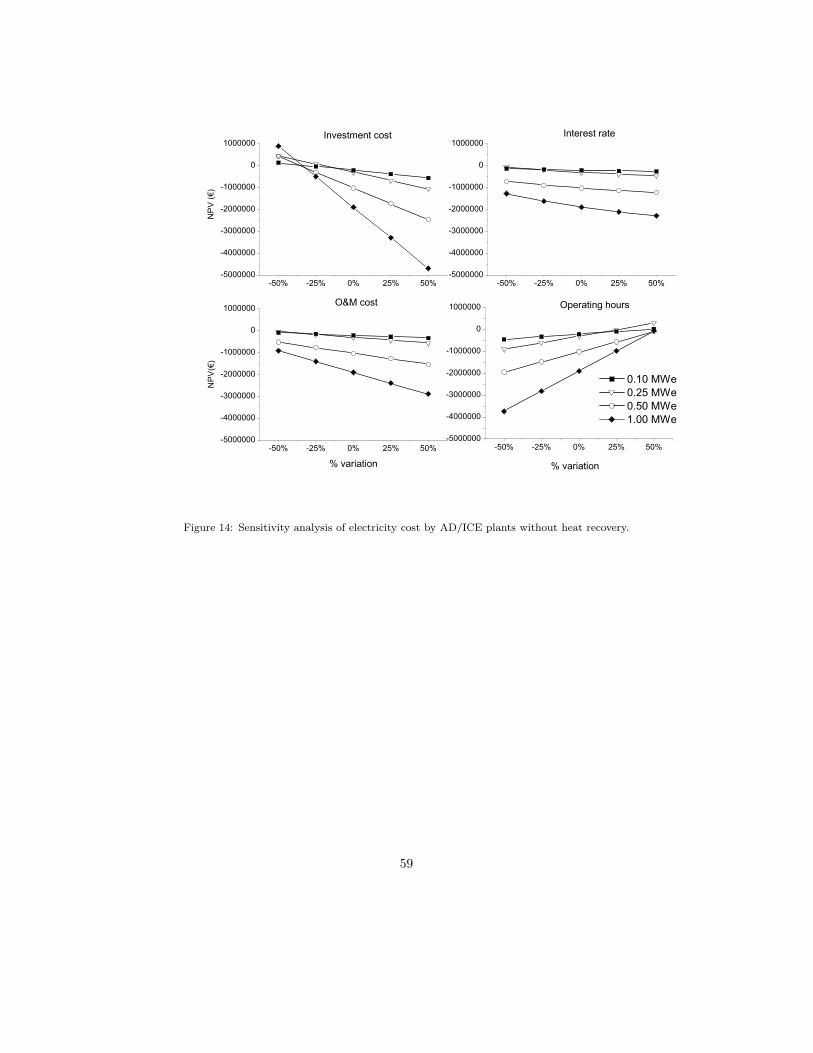
Figure 14: Sensitivity analysis of electricity cost by AD/ICE plants without heat recovery.
59

Figure 15: Sensitivity analysis of electricity cost by AD/ICE plants with heat recovery.
60
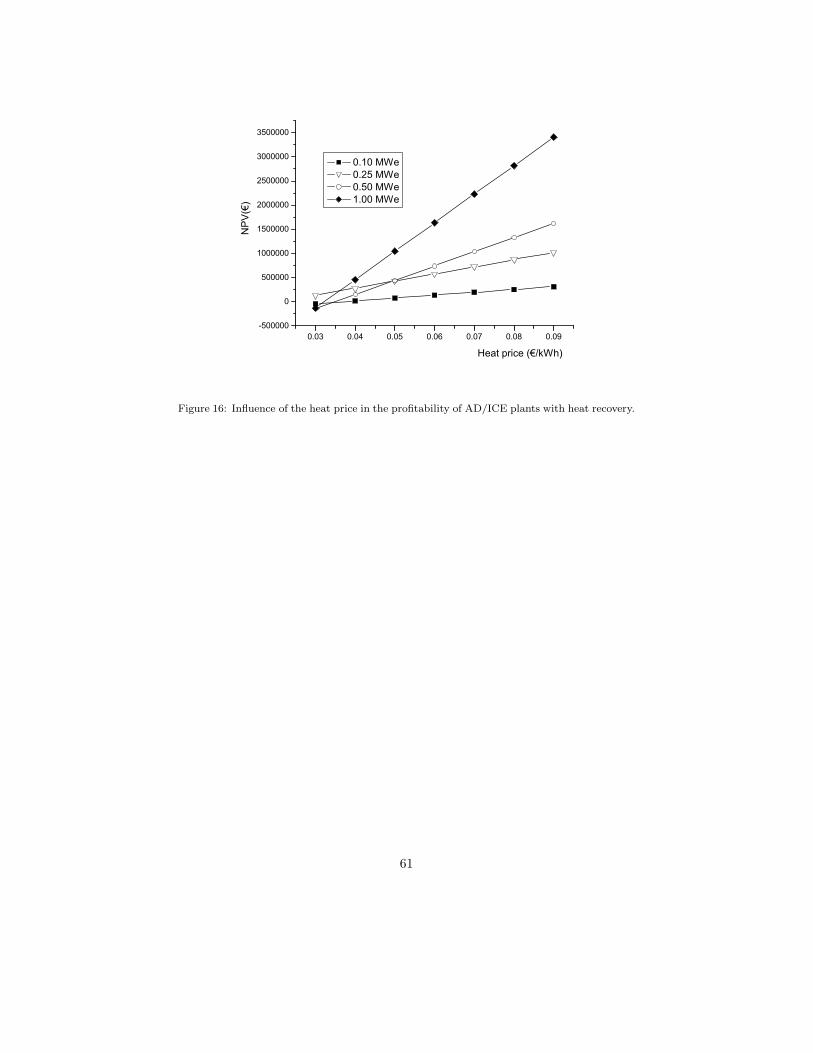
Figure 16: Influence of the heat price in the profitability of AD/ICE plants with heat recovery.
61
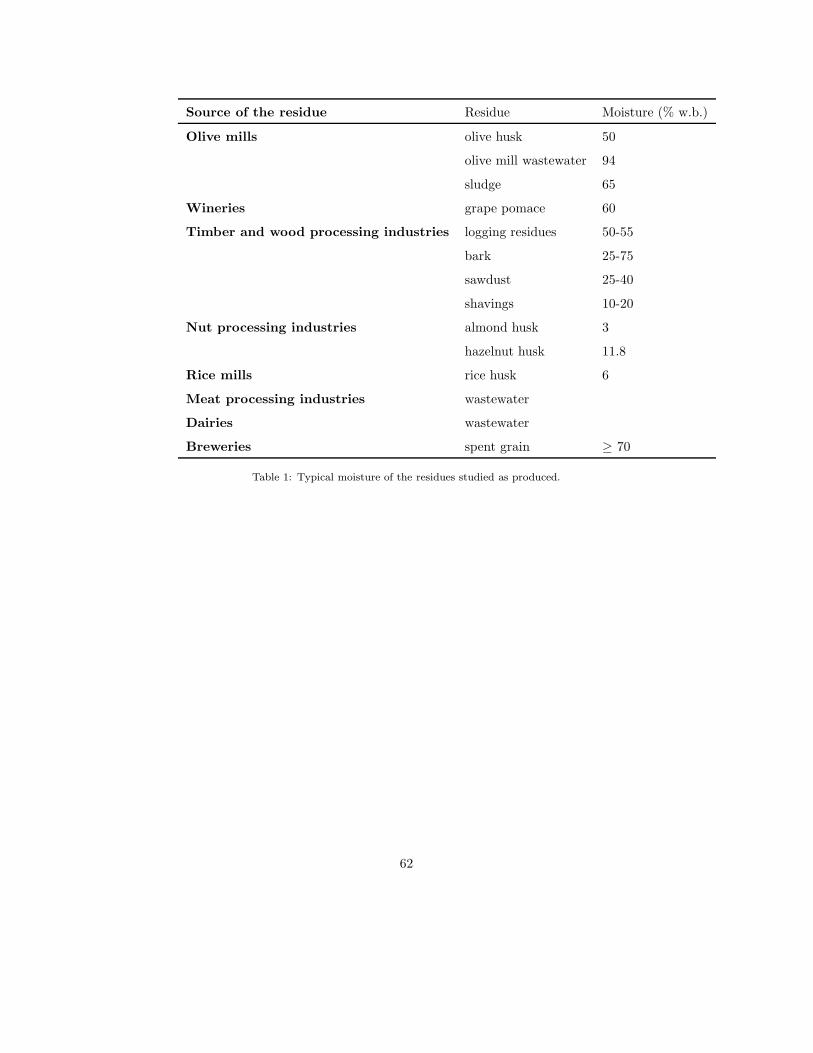
Source of the residue Residue Moisture (% w.b.)
Olive mills olive husk 50
olive mill wastewater 94
sludge 65
Wineries grape pomace 60
Timber and wood processing industries logging residues 50-55
bark 25-75
sawdust 25-40
shavings 10-20
Nut processing industries almond husk 3
hazelnut husk 11.8
Rice mills rice husk 6
Meat processing industries wastewater
Dairies wastewater
Breweries spent grain ≥ 70
Table 1: Typical moisture of the residues studied as produced.
62

Extraction system % Penetration Byproduct Ratio byproduct/olives (%)
Presses 15 Oil 20
OH 40
OMW 40
Three-phase 15 Oil 20
OH 50
OMW 120
Two-phase 70 Oil 20
Sludge 80
Table 2: Fraction (in percentage) of byproducts depending of the extraction technology used
in olive mills, and their penetration in the Spanish industry.
63
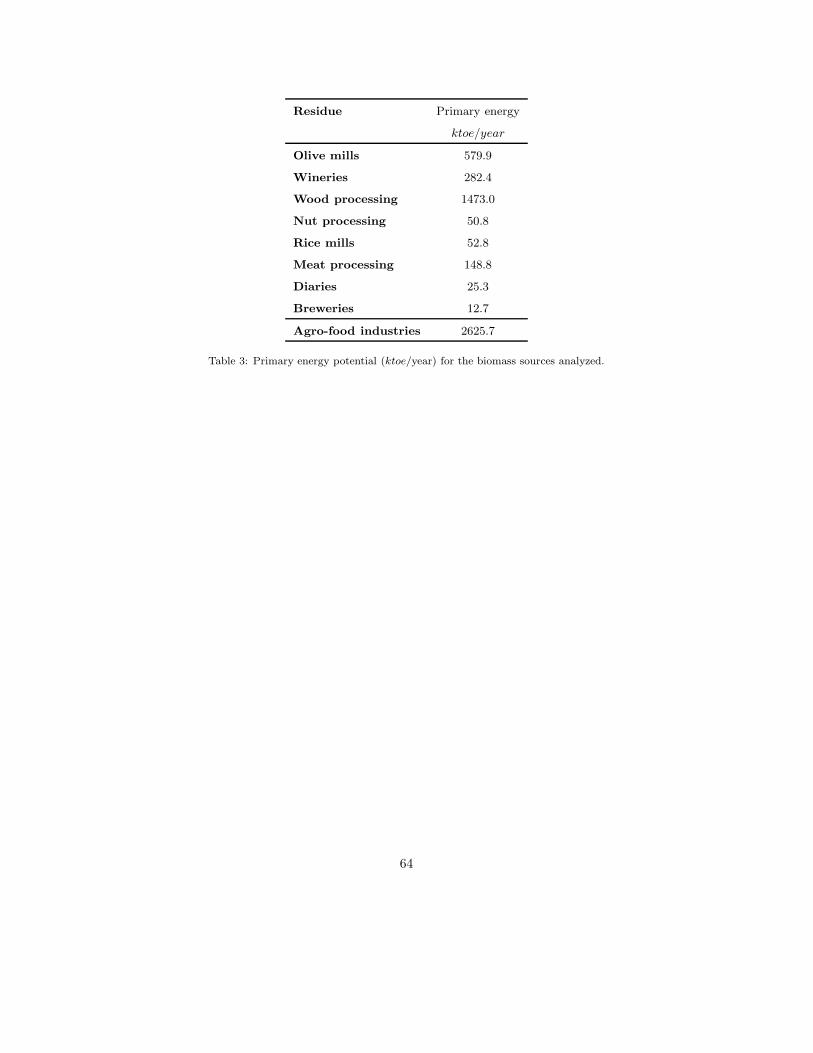
Residue Primary energy
ktoe/year
Olive mills 579.9
Wineries 282.4
Wood processing 1473.0
Nut processing 50.8
Rice mills 52.8
Meat processing 148.8
Diaries 25.3
Breweries 12.7
Agro-food industries 2625.7
Table 3: Primary energy potential (ktoe/year) for the biomass sources analyzed.
64

Olive mills Wood processing Nut processing Rice mills
ktoe/year ktoe/year ktoe/year ktoe/year
This study (Spain) 579.9 1473 50.8 52.8
Siemons et al. (2004) - 2085 - -
AFB-NET (2000) - 2629 - -
Ericsson and Nilsson (2006) - 1673 - -
This study (Andalusia only) 451 68 7 21
Andalusian Energy Agency (2007) 455 41 17 19
Table 4: Energy potential of some of the agro-industrial residues in Spain and Andalusia
reported in several studies.
65

Technology
GF/ST Electrical efficiency ηe = 0.0323 Ln (x) + 0.1545 (x, MWth)
Investment cost Cinv(e/kWe) = −966.6 · Ln (x) + 5206.7 (x, MWe)
O&M cost OM (e/year) = 4% of initial investment
Operating hours 7000 h
Lifetime 20 years
Discount rate 9%
CF/PC Electrical efficiency ηe = 0.38
Investment cost Cinv(e/kWe) = 300
O&M cost OM (e/y) = 4% of initial investment
Operating hours 4000 h
Lifetime 10 years
Discount rate 9%
AD/ICE Electrical efficiency ηAD = 0.26
Heat efficiency ηh,AD = 0.40
Investment cost Cinv(e/kWe) = 101522/x + 3500 (x, kWe)
O&M cost α = 6% of initial investment
Heat price Ph = 0.06e/kWh
Operating hours 4200 h
Lifetime 20 years
Discount rate 9%
Table 5: Parameters used for the economic analysis of GF/ST, CF/PC and AD/ICE tech-
nologies.
66

Agro-industrial residues
Electric Power Time ce/kWh
< 2 MWe First 15 years 12.5710
From then onwards 8.4752
> 2 MWe First 15 years 10.7540
From then onwards 8.0660
Wood-processing industry residues
Electric Power Time ce/kWh
< 2 MWe First 15 years 9.2800
From then onwards 6.5100
> 2 MWe First 15 years 6.5080
From then onwards 6.5080
Biogas from biodegradable residues
Electric Power Time ce/kWh
< 500 kWe First 15 years 13.069
From then onwards 6.5100
> 500 kWe First 15 years 9.6800
From then onwards 6.5100
Table 6: Feed-in tariffs for electricity production from agro-industrial residues, wood-
processing residues and biogas in Spain (MITYC, 2007b)
67

Residue Cost at transformation plant (e/GJ)
Olive-mill 3.0
Winery 3.0
Wood-processing 1.5
Nut-processing 1.5
Rice-mill 1.5
Table 7: Assumed cost of the residues at transformation plant. Transport and drying costs
are included.
68

Province Power MWe
A Coruna 2031
Asturias 1628
Almerıa 1159
Cadiz 568
Cordoba 324
Leon 1451
Palencia 361
Teruel 366
Total 7888
Table 8: Location and power of coal boilers in Spain by 2020.
69

Olive-mill residues
Province Electric power (MWe) Generation (TWh) NPV (Me) PI
Badajoz 11.7 0.082 1.14 1.03
Cordoba 50.0 0.35
2 plants 25.0 MWe 33.30 1.64
Granada 19.8 0.139 19.06 1.41
Jaen 91.8 0.525
3 plants 25.0 MWe 33.30 1.64
1 plant 16.8 11.67 1.28
Malaga 19.5 0.137 18.23 1.40
Sevilla 23.8 0.167 29.91 1.59
Total 216.6 1.516
Winery residues
Province Electric power (MWe) Generation (TWh) NPV (Me) PI
Ciudad Real 25.00 0.175 37.33 1.71
Cuenca 11.40 0.079 2.96 1.09
Toledo 17.00 0.119 15.13 1.36
Total 53.40 0.373
Wood-processing residues
Province Electric power (MWe) Generation (TWh) NPV (Me) PI
A Coruna 100.0 0.743
4 plants 25.0 MWe 3.47 1.07
Guipuzcoa 25.0 0.183 3.47 1.07
Lugo 100.0 0.752
4 plants 25.0 MWe 3.47 1.07
Ourense 25.0 0.152 3.47 1.07
Asturias 50.0 0.432
2 plants 25.0 MWe 3.47 1.07
Pontevedra 50.0 0.409
2 plants 25.0 MWe 3.47 1.07
Vizcaya 25.0 0.316 3.47 1.07
Total 375.0 2.625
Rice-mill residues
Province Electric power (MWe) Generation (TWh) NPV (Me) PI
Sevilla 8.6 0.060 9.62 1.36
Table 9: Location, electric power, electric generation, net present value and profitability index
of GF/ST plants with a positive NPV .
70

Province Olive-mill Winery Wood-processing Rice-mill Nut-processing
A Coruna 0.00% 0.06% 11.70 % 0% 0%
Asturias 0.00% 0.00% 8.49 % 0% 0%
Almerıa 0.70% 0.02% 0.56 % 0.00% 0.32%
Cadiz 0.79% 0.49% 0.34 % 0.29% 0.03%
Cordoba 40.37% 0.75% 1.42 % 0.00% 0.09%
Leon 0.00% 0.19% 1.46 % 0.00% 0.00%
Palencia 0.00% 0.02% 5.28 % 0.00% 0.00%
Teruel 1.07% 0.12% 6.67 % 0.00% 0.93%
Table 10: Share of agro-industrial residues in coal power plants (considering only residues
generated in the same province) whose lifetime will be extended, at least, until 2020.
71

Province Coal boilers Residue Residues Co-firing Electric
power type share (%) power (MWe) generation (TWh)
A Coruna 2031 Wood-processing 10.00 % 203.1 0.812
Asturias 1628 Wood-processing 8.49 % 138.2 0.553
Cordoba 324 Olive-mill 10.00 % 32.4 0.130
Palencia 361 Wood-processing 5.28 % 19.3 0.077
Teruel 366 Wood-processing 6.67 % 37.9 0.152
Total 430.9 1.724
Table 11: Co-firing power and generation considering only coal power plants with substantial
shares of agro-industrial residues.
72
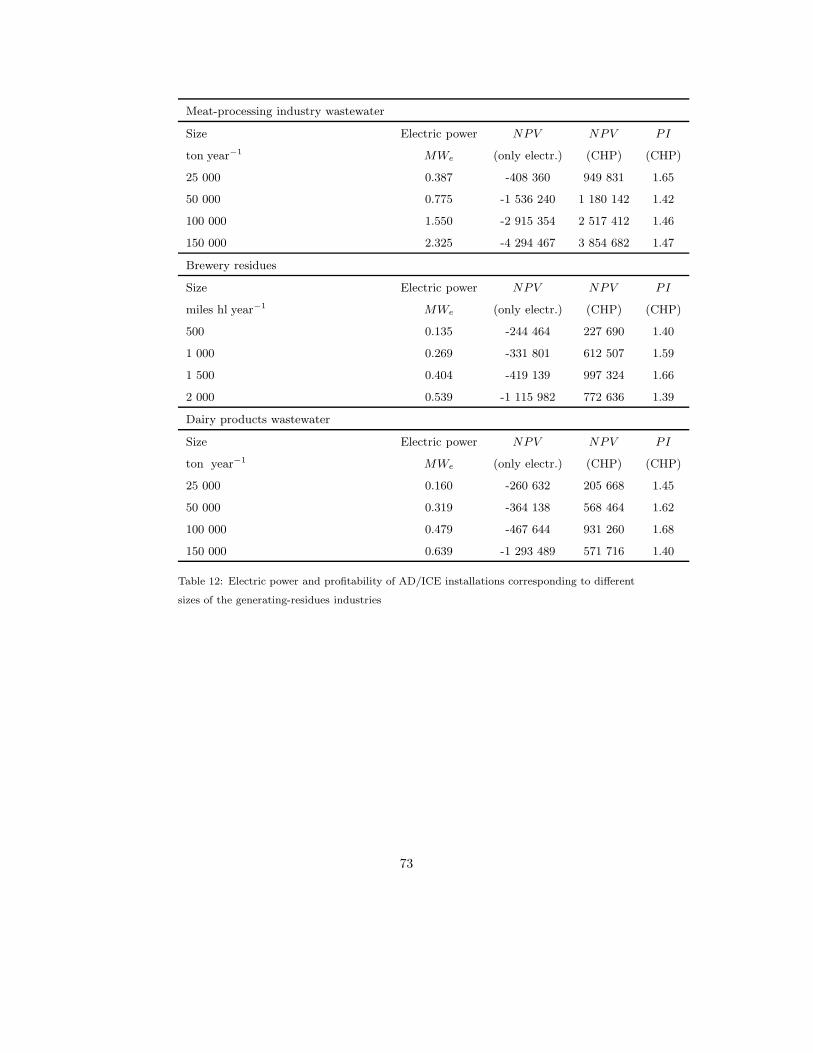
Meat-processing industry wastewater
Size Electric power NPV NPV PI
ton year−1 MWe (only electr.) (CHP) (CHP)
25 000 0.387 -408 360 949 831 1.65
50 000 0.775 -1 536 240 1 180 142 1.42
100 000 1.550 -2 915 354 2 517 412 1.46
150 000 2.325 -4 294 467 3 854 682 1.47
Brewery residues
Size Electric power NPV NPV PI
miles hl year−1 MWe (only electr.) (CHP) (CHP)
500 0.135 -244 464 227 690 1.40
1 000 0.269 -331 801 612 507 1.59
1 500 0.404 -419 139 997 324 1.66
2 000 0.539 -1 115 982 772 636 1.39
Dairy products wastewater
Size Electric power NPV NPV PI
ton year−1 MWe (only electr.) (CHP) (CHP)
25 000 0.160 -260 632 205 668 1.45
50 000 0.319 -364 138 568 464 1.62
100 000 0.479 -467 644 931 260 1.68
150 000 0.639 -1 293 489 571 716 1.40
Table 12: Electric power and profitability of AD/ICE installations corresponding to different
sizes of the generating-residues industries
73