energy-performance tradeoffs for hpc applications on...
TRANSCRIPT

Energy-performance tradeoffs for HPC applicationson low power processors
E. Calore1 S. F. Schifano1 R. Tripiccione1
1INFN Ferrara and Università degli Studi di Ferrara, Italy
UnConventional High Performance Computing 2015
Euro-Par Workshop
Vienna - August 25, 2015
E. Calore (INFN and Univ. Ferrara) Energy vs Performance on Jetson TK1 Vienna, August 25, 2015 1 / 42

Outline
1 Introduction
2 Measuring the energy consumptionHow to measureManaging the acquisition
3 Lattice Boltzmann Model (D2Q37)Code ImplementationsManaging the Frequency ScalingC with NEON intrinsics, on the Cortex A15CUDA on the GK20A
4 Conclusions
E. Calore (INFN and Univ. Ferrara) Energy vs Performance on Jetson TK1 Vienna, August 25, 2015 2 / 42

Outline
1 Introduction
2 Measuring the energy consumptionHow to measureManaging the acquisition
3 Lattice Boltzmann Model (D2Q37)Code ImplementationsManaging the Frequency ScalingC with NEON intrinsics, on the Cortex A15CUDA on the GK20A
4 Conclusions
E. Calore (INFN and Univ. Ferrara) Energy vs Performance on Jetson TK1 Vienna, August 25, 2015 3 / 42

Exploiting the NVIDIA Tegra K1 for HPC applications
Why?
To use embedded hardware may cost less
To use embedded hardware may consume less
Execution time for the single processor will be higher than for HPC hardware
Need to identify new metrics
Cost per GFLOP (in Dollars/Euro):We need to know hardware cost
Energy to solution (in Joule):We need to measure energy consumption
E. Calore (INFN and Univ. Ferrara) Energy vs Performance on Jetson TK1 Vienna, August 25, 2015 4 / 42

Outline
1 Introduction
2 Measuring the energy consumptionHow to measureManaging the acquisition
3 Lattice Boltzmann Model (D2Q37)Code ImplementationsManaging the Frequency ScalingC with NEON intrinsics, on the Cortex A15CUDA on the GK20A
4 Conclusions
E. Calore (INFN and Univ. Ferrara) Energy vs Performance on Jetson TK1 Vienna, August 25, 2015 5 / 42

Outline
1 Introduction
2 Measuring the energy consumptionHow to measureManaging the acquisition
3 Lattice Boltzmann Model (D2Q37)Code ImplementationsManaging the Frequency ScalingC with NEON intrinsics, on the Cortex A15CUDA on the GK20A
4 Conclusions
E. Calore (INFN and Univ. Ferrara) Energy vs Performance on Jetson TK1 Vienna, August 25, 2015 6 / 42

Choosing what to measure
Actually, there are several energy metrics
Instantaneous Power consumption (Watt)
Average Power consumption during execution (Watt)
Energy to solution (Joule)
Sampling the instantaneous Current absorption, all the other metrics could bederived knowing the execution time T and the supply voltage V :
p[n] = v [n]× i[n]
v [n] = V ∀ n
Pavg =1N
N−1∑n=0
p[n]
N = T × Fsamp
Etosol =1
Fsamp
N−1∑n=0
p[n]
E. Calore (INFN and Univ. Ferrara) Energy vs Performance on Jetson TK1 Vienna, August 25, 2015 7 / 42

Setup to sample instantaneous current absorptionOne current to voltage converter......plus an Arduino UNO (microcontroller + 10-bit ADC + Serial over USB)
E. Calore (INFN and Univ. Ferrara) Energy vs Performance on Jetson TK1 Vienna, August 25, 2015 8 / 42

Current to Voltage + Digitization with Arduino + USB Serial
E. Calore (INFN and Univ. Ferrara) Energy vs Performance on Jetson TK1 Vienna, August 25, 2015 9 / 42

Outline
1 Introduction
2 Measuring the energy consumptionHow to measureManaging the acquisition
3 Lattice Boltzmann Model (D2Q37)Code ImplementationsManaging the Frequency ScalingC with NEON intrinsics, on the Cortex A15CUDA on the GK20A
4 Conclusions
E. Calore (INFN and Univ. Ferrara) Energy vs Performance on Jetson TK1 Vienna, August 25, 2015 10 / 42

Arduino Sketch code
The Arduino board waits a char on the serial connection over the USB port.’A’: starts to digitize at 1kHz, storing samples in its memory till it runs out of it’S’: sends the acquired samples over the Serial connection emptying its buffer
/ / Ser ia lEven t occurs whenever a new/ / data comes i n the hardware s e r i a l RX.void serialEvent ( ) {while (Serial .available ( ) ) {
/ / get the new byte :char inChar = (char )Serial .read ( ) ;/ / Send b u f f e r v ia S e r i a lif (inChar == ’S’ ) {
acquireData = false ;sendData = true ;
/ / S t a r t data a c q u i s i t i o n} else if (inChar == ’A’ ) {acquireData = true ;sendData = false ;idx = 0;
}}
}
/ / This i s c a l l e d every msISR (TIMER0_COMPA_vect ) {if (acquireData ) {
byte i ;unsigned int sensorValue = 0;/ / Average over avgSamples readings/ / one read costs about 0.11msfor (i = 0; i < avgSamples ; i++) {
/ / read the i npu t on analog pin0sensorValue += analogRead (A0 ) ;
}isendBuffer [idx ] = sensorValue ;idx++;
}}
E. Calore (INFN and Univ. Ferrara) Energy vs Performance on Jetson TK1 Vienna, August 25, 2015 11 / 42

From the host code
To measure the energy consumption of a specific function, we can start theacquisition just before starting the computations:int fd ;struct termios newtio , oldtio ;char filename [ 2 5 6 ] ; / / f i lename were to s to re acqui red data
/ / I n i t i a l i z e Arduino S e r i a l connect ionfd = init_serial(&oldtio , &newtio ) ;
/ / S t a r t arduino data a c q u i s i t i o nstart_arduino_acq (fd ) ;usleep (10000) ; / / Wait a b i t to have some base l ine po in t s i n the p l o t
run_my_function ( ) ;
/ / S t a r t arduino data read−outstart_arduino_readout (fd , filename , 900) ;close_serial (fd , &oldtio ) ;
To store acquired data in the Arduino memory grants for minimalinterferences with the code execution in the Jetson board.
E. Calore (INFN and Univ. Ferrara) Energy vs Performance on Jetson TK1 Vienna, August 25, 2015 12 / 42

Acquired data example with default frequency scaling
200
300
400
500
600
700
800
900
0 100 200 300 400 500 600 700 800 900
Cu
rren
t [m
A]
Time [ms]
Propagate on Jetson - 128x4096
20 Propagate Iterations
⇑ ⇑ ⇑ · · ·
Iterations can be counted
⇑
This is a D2H transfer
E. Calore (INFN and Univ. Ferrara) Energy vs Performance on Jetson TK1 Vienna, August 25, 2015 13 / 42

Outline
1 Introduction
2 Measuring the energy consumptionHow to measureManaging the acquisition
3 Lattice Boltzmann Model (D2Q37)Code ImplementationsManaging the Frequency ScalingC with NEON intrinsics, on the Cortex A15CUDA on the GK20A
4 Conclusions
E. Calore (INFN and Univ. Ferrara) Energy vs Performance on Jetson TK1 Vienna, August 25, 2015 14 / 42

The D2Q37 Lattice Boltzmann ModelLattice Boltzmann method (LBM) is a class of computational fluid dynamics(CFD) methods
LBM methods simulate a discrete Boltzmann equation, which undercertain conditions, reduce to the Navier-Stokes equation
virtual particles called populations arranged at edges of a discrete andregular grid are used to simulate a synthetic and simplified dynamics
the interaction is implemented by two main functions applied to the virtualparticles: propagation and collision
D2Q37 is a D2 model with 37 components of velocity (populations)
suitable to study behaviour of compressible gas and fluids optionally inpresence of combustion 1 effects
correct treatment of Navier-Stokes, heat transport and perfect-gas(P = ρT ) equations1chemical reactions turning cold-mixture of reactants into hot-mixture of burnt
product.E. Calore (INFN and Univ. Ferrara) Energy vs Performance on Jetson TK1 Vienna, August 25, 2015 15 / 42

Simulation of the Rayleigh-Taylor (RT) InstabilityInstability at the interface of two fluids of different densities triggered bygravity.
A cold-dense fluid over a less dense and warmer fluid triggers an instabilitythat mixes the two fluid-regions (till equilibrium is reached).
E. Calore (INFN and Univ. Ferrara) Energy vs Performance on Jetson TK1 Vienna, August 25, 2015 16 / 42

Computational Scheme of LBMforeach time−step
foreach lattice−pointpropagate ( ) ;
endfor
foreach lattice−pointcollide ( ) ;
endfor
endfor
Embarassing parallelismAll sites can be processed in parallel applying in sequence propagate andcollide.
ChallengeDesign an efficient implementation able exploit a large fraction of availablepeak performance.
E. Calore (INFN and Univ. Ferrara) Energy vs Performance on Jetson TK1 Vienna, August 25, 2015 17 / 42

D2Q37: propagation scheme
perform accesses to neighbour-cells at distance 1,2, and 3
generate memory-accesses with sparse addressing patterns
E. Calore (INFN and Univ. Ferrara) Energy vs Performance on Jetson TK1 Vienna, August 25, 2015 18 / 42

D2Q37 collision
collision is computed at each lattice-cell after computation of boundaryconditions
computational intensive: for the D2Q37 model requires ≈ 7500 DPfloating-point operations
completely local: arithmetic operations require only the populationsassociate to the site
computation of propagate and collide kernels are kept separate
after propagate but before collide we may need to perform collectiveoperations (e.g. divergence of of the velocity field) if we includecomputations conbustion effects.
E. Calore (INFN and Univ. Ferrara) Energy vs Performance on Jetson TK1 Vienna, August 25, 2015 19 / 42

Outline
1 Introduction
2 Measuring the energy consumptionHow to measureManaging the acquisition
3 Lattice Boltzmann Model (D2Q37)Code ImplementationsManaging the Frequency ScalingC with NEON intrinsics, on the Cortex A15CUDA on the GK20A
4 Conclusions
E. Calore (INFN and Univ. Ferrara) Energy vs Performance on Jetson TK1 Vienna, August 25, 2015 20 / 42
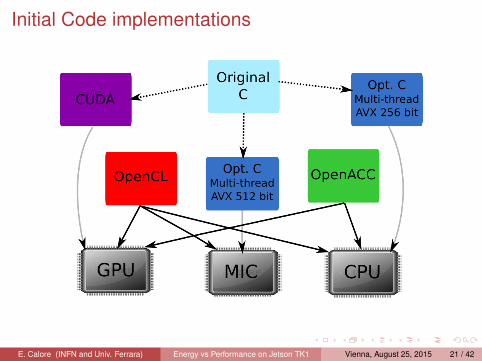
Initial Code implementations
E. Calore (INFN and Univ. Ferrara) Energy vs Performance on Jetson TK1 Vienna, August 25, 2015 21 / 42

Code implementations
E. Calore (INFN and Univ. Ferrara) Energy vs Performance on Jetson TK1 Vienna, August 25, 2015 22 / 42

Outline
1 Introduction
2 Measuring the energy consumptionHow to measureManaging the acquisition
3 Lattice Boltzmann Model (D2Q37)Code ImplementationsManaging the Frequency ScalingC with NEON intrinsics, on the Cortex A15CUDA on the GK20A
4 Conclusions
E. Calore (INFN and Univ. Ferrara) Energy vs Performance on Jetson TK1 Vienna, August 25, 2015 23 / 42
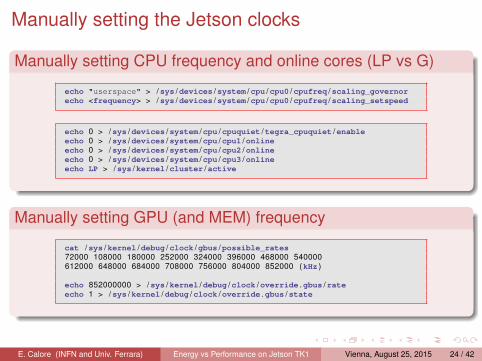
Manually setting the Jetson clocks
Manually setting CPU frequency and online cores (LP vs G)
echo "userspace" > /sys /devices /system /cpu /cpu0 /cpufreq /scaling_governorecho <frequency> > /sys /devices /system /cpu /cpu0 /cpufreq /scaling_setspeed
echo 0 > /sys /devices /system /cpu /cpuquiet /tegra_cpuquiet /enableecho 0 > /sys /devices /system /cpu /cpu1 /onlineecho 0 > /sys /devices /system /cpu /cpu2 /onlineecho 0 > /sys /devices /system /cpu /cpu3 /onlineecho LP > /sys /kernel /cluster /active
Manually setting GPU (and MEM) frequency
cat /sys /kernel /debug /clock /gbus /possible_rates72000 108000 180000 252000 324000 396000 468000 540000612000 648000 684000 708000 756000 804000 852000 (kHz )
echo 852000000 > /sys /kernel /debug /clock /override .gbus /rateecho 1 > /sys /kernel /debug /clock /override .gbus /state
E. Calore (INFN and Univ. Ferrara) Energy vs Performance on Jetson TK1 Vienna, August 25, 2015 24 / 42

Optimizing for the new metrics
Using the regular time to solution metric (aka faster is better)
Highest CPU frequency is the best
Highest GPU frequency is the best
Highest MEM frequency is the best
Best software parameters have to be identified (e.g. CUDA block size)
Using the energy to solution metric
Which CPU frequency is the best?
Which GPU frequency is the best?
Which MEM frequency is the best?
Best software parameters have still to be identified (e.g. CUDA block size)
E. Calore (INFN and Univ. Ferrara) Energy vs Performance on Jetson TK1 Vienna, August 25, 2015 25 / 42

Outline
1 Introduction
2 Measuring the energy consumptionHow to measureManaging the acquisition
3 Lattice Boltzmann Model (D2Q37)Code ImplementationsManaging the Frequency ScalingC with NEON intrinsics, on the Cortex A15CUDA on the GK20A
4 Conclusions
E. Calore (INFN and Univ. Ferrara) Energy vs Performance on Jetson TK1 Vienna, August 25, 2015 26 / 42

Propagate changing the G cluster clock
200
300
400
500
600
700
800
900
1000
0 50 100 150 200 250 300 350 400 450
Cu
rren
t [m
A]
Time [ms]
Propagate on Jetson - 128x1024sp - Changing CPU Clock
4-2320500-0-924000.dat4-2218500-0-924000.dat4-2116500-0-924000.dat4-2014500-0-924000.dat4-1938000-0-924000.dat4-1836000-0-924000.dat4-1734000-0-924000.dat4-1632000-0-924000.dat4-1530000-0-924000.dat4-1428000-0-924000.dat4-1326000-0-924000.dat4-1224000-0-924000.dat4-1122000-0-924000.dat4-1092000-0-924000.dat
4-960000-0-924000.dat4-828000-0-924000.dat4-696000-0-924000.dat4-564000-0-924000.dat4-312000-0-924000.dat4-204000-0-924000.dat
E. Calore (INFN and Univ. Ferrara) Energy vs Performance on Jetson TK1 Vienna, August 25, 2015 27 / 42

Propagate changing the MEM clock
100
200
300
400
500
600
700
800
900
1000
0 50 100 150 200 250 300 350 400 450
Cu
rren
t [m
A]
Time [ms]
Propagate on Jetson - 128x1024sp - Changing MEM Clock
4-2320500-0-924000.dat4-2320500-0-792000.dat4-2320500-0-600000.dat4-2320500-0-528000.dat4-2320500-0-396000.dat4-2320500-0-300000.dat4-2320500-0-204000.dat4-2320500-0-102000.dat
4-2320500-0-68000.dat
E. Calore (INFN and Univ. Ferrara) Energy vs Performance on Jetson TK1 Vienna, August 25, 2015 28 / 42

Time and Energy to solution (Propagate)
204
696 1122
1632
2320.5
12.7 300
600 924
101
102
103
Tim
e t
o S
olu
tio
n [
ms]
CPU Clock [MHz]
Memory Clock [MHz]
Tim
e t
o S
olu
tio
n [
ms]
101
102
Energy toSolution [mJ]
E. Calore (INFN and Univ. Ferrara) Energy vs Performance on Jetson TK1 Vienna, August 25, 2015 29 / 42

Collide changing the G cluster clock
200
400
600
800
1000
1200
1400
0 100 200 300 400 500 600 700 800 900
Cu
rren
t [m
A]
Time [ms]
Collide on Jetson - 128x1024sp - Changing CPU Clock
4-2320500-0-924000.dat4-2218500-0-924000.dat4-2116500-0-924000.dat4-2014500-0-924000.dat4-1938000-0-924000.dat4-1836000-0-924000.dat4-1734000-0-924000.dat4-1632000-0-924000.dat4-1530000-0-924000.dat4-1428000-0-924000.dat4-1326000-0-924000.dat4-1224000-0-924000.dat4-1122000-0-924000.dat4-1092000-0-924000.dat
4-960000-0-924000.dat4-828000-0-924000.dat4-696000-0-924000.dat4-564000-0-924000.dat4-312000-0-924000.dat4-204000-0-924000.dat
E. Calore (INFN and Univ. Ferrara) Energy vs Performance on Jetson TK1 Vienna, August 25, 2015 30 / 42

Collide changing the MEM clock
200
400
600
800
1000
1200
1400
0 100 200 300 400 500 600 700 800 900
Cu
rren
t [m
A]
Time [ms]
Collide on Jetson - 128x1024sp - Changing MEM Clock
4-2320500-0-924000.dat4-2320500-0-792000.dat4-2320500-0-600000.dat4-2320500-0-528000.dat4-2320500-0-396000.dat4-2320500-0-300000.dat4-2320500-0-204000.dat4-2320500-0-102000.dat
4-2320500-0-68000.dat
E. Calore (INFN and Univ. Ferrara) Energy vs Performance on Jetson TK1 Vienna, August 25, 2015 31 / 42

Time and Energy to solution (Collide)
204
696 1122
1632
2320.5
12.7 300
600 924
101
102
103
Tim
e t
o S
olu
tio
n [
ms]
CPU Clock [MHz]
Memory Clock [MHz]
Tim
e t
o S
olu
tio
n [
ms]
102
103
Energy toSolution [mJ]
E. Calore (INFN and Univ. Ferrara) Energy vs Performance on Jetson TK1 Vienna, August 25, 2015 32 / 42

Outline
1 Introduction
2 Measuring the energy consumptionHow to measureManaging the acquisition
3 Lattice Boltzmann Model (D2Q37)Code ImplementationsManaging the Frequency ScalingC with NEON intrinsics, on the Cortex A15CUDA on the GK20A
4 Conclusions
E. Calore (INFN and Univ. Ferrara) Energy vs Performance on Jetson TK1 Vienna, August 25, 2015 33 / 42

Time and Energy to solution (Propagate)
72 252
468 648
852
12.7 300
600 924
101
102
103
Tim
e t
o S
olu
tio
n [
ms]
GPU Clock [MHz]
Memory Clock [MHz]
Tim
e t
o S
olu
tio
n [
ms]
101
102
Energy toSolution [mJ]
E. Calore (INFN and Univ. Ferrara) Energy vs Performance on Jetson TK1 Vienna, August 25, 2015 34 / 42

Time and Energy to solution (Collide)
72 252
468 648
852
12.7 300
600 924
101
102
103
Tim
e t
o S
olu
tio
n [
ms]
GPU Clock [MHz]
Memory Clock [MHz]
Tim
e t
o S
olu
tio
n [
ms]
102
103
Energy tosolution [mJ]
E. Calore (INFN and Univ. Ferrara) Energy vs Performance on Jetson TK1 Vienna, August 25, 2015 35 / 42

Energy to Sol. vs Time to Sol. CPU(top), GPU(bottom)
0
0.5
1
1.5
2
2.5
3
0 100 200 300 400 500 600 700 800 900
En
erg
y t
o S
olu
tio
n [
J]
Time to Solution [ms]
PropagateCollideFit line
0
0.5
1
1.5
2
2.5
3
0 100 200 300 400 500 600 700 800 900
En
erg
y t
o S
olu
tio
n [
J]
Time to Solution [ms]
PropagateCollideFit line
E. Calore (INFN and Univ. Ferrara) Energy vs Performance on Jetson TK1 Vienna, August 25, 2015 36 / 42

Energy to Solution vs Time to Solution (CPU)
0
0.2
0.4
0.6
0.8
1
0 100 200 300 400 500 600 700 800 900
En
erg
y t
o S
olu
tio
n [
J]
Time to Solution [ms]
PropagateCollide
E. Calore (INFN and Univ. Ferrara) Energy vs Performance on Jetson TK1 Vienna, August 25, 2015 37 / 42

Energy to Solution vs Time to Solution (GPU)
0
0.2
0.4
0.6
0.8
1
0 100 200 300 400 500 600 700 800 900
En
erg
y t
o S
olu
tio
n [
J]
Time to Solution [ms]
PropagateCollide
72 12180 12252 12
396 12
468 12
612 12
648 12
708 12
804 12
852 12
468 20
540 20
612 20648 20
684 20
708 20
756 20
804 20
852 20
E. Calore (INFN and Univ. Ferrara) Energy vs Performance on Jetson TK1 Vienna, August 25, 2015 38 / 42

Energy to Solution vs Time to Solution (GPU) zoom
130
140
150
160
170
180
40 45 50 55 60
En
erg
y t
o S
olu
tio
n [
mJ]
612,792
612,924
648,396
648,528
648,600
648,792
648,924
684,300684,396
684,528
684,600
684,792
684,924
708,300
708,396
708,528
708,600708,792
708,924
756,300
756,396756,528
756,600756,792
756,924
804,300
804,396
804,528
804,600804,792
804,924
852,300
852,396
852,528
852,600
852,792
852,924
E. Calore (INFN and Univ. Ferrara) Energy vs Performance on Jetson TK1 Vienna, August 25, 2015 39 / 42

Outline
1 Introduction
2 Measuring the energy consumptionHow to measureManaging the acquisition
3 Lattice Boltzmann Model (D2Q37)Code ImplementationsManaging the Frequency ScalingC with NEON intrinsics, on the Cortex A15CUDA on the GK20A
4 Conclusions
E. Calore (INFN and Univ. Ferrara) Energy vs Performance on Jetson TK1 Vienna, August 25, 2015 40 / 42

Conclusionsbaseline power consumption (leakage current + ancillary electronics) isrelevant concerning the whole energy budget.
limited but not negligible power optimization is possible by adjusting clockson a kernel-by-kernel basis (≈ 20 · · · 30%).
best region is close to the system highest frequencies.
options to run the processor at very low frequencies seem almost useless;if possible would be interesting to be able to remove power from the(sub-)system while idle.
Future worksperform similar measurements on a high-end node and compare results.
test on newer low-power processors, such us the Tegra X1.
consider not only hardware-based tuning, but also software tuning.
E. Calore (INFN and Univ. Ferrara) Energy vs Performance on Jetson TK1 Vienna, August 25, 2015 41 / 42

Thanks for Your attention
E. Calore (INFN and Univ. Ferrara) Energy vs Performance on Jetson TK1 Vienna, August 25, 2015 42 / 42