“energy optimization from plant to plug…” · cheapest electricity ... the world’s current...
TRANSCRIPT

Solutions for the Crossroads:
“Energy Optimizationfrom Plant to Plug…”
Aaron Davis, Chief Marketing OfficerPhilippe Delorme, EVP Strategy & Innovation
2
Solutions of the pastare simply not sufficient for the future
The world’s energy system is at a crossroads. Current global trends in
energy supply and consumption are patently unsustainable –
environmentally, socially, economically. But that can – and must – be altered;
there’s still time to change the road we’re on. It is not an exaggeration to claim
that the future of human prosperity depends on how successfully
we tackle the two central energy challenges facing us today: securing the
supply of reliable and affordable energy; and effecting a rapid transformation to
a low –carbon, efficient and environmentally benign system of energy supply.
What is needed is nothing short of an energy revolution .
Source: World Energy Outlook

3
Pervasive changesfrom population, standard of living, and technology
●Humans created 161 Exabyte of data in 2006, approximately three million times the information in all the books ever written. Projected to be 988 in 2010.
● In 2005, the average IT network user consumed 3Mb bandwidth per month. In
2008, this became 3Mb per day●Microsoft and Google announce new datacenter plans based on location of
cheapest electricity
● $12 trillion will be spent for energy in the next 20 years, equaling the spending
of the past 100 years
●Between 2002 & 2007 the cost of electricity was multiplied by 3
● « Last year human beings produced more transistors than ricegrains…and at lower cost… » - IBM
* source: IDC, EMC

4
Physical sales of virtual goods topped more than $300M in 2007
20 milligramsCO2 per second
The Internet will
produce 20% of
the world’s
GHG in 10
years…

5
Welcome to the “inelastic” Digital Worldcreating the requirement for an energy revolution…
● Impacting the way we use all types of power● Impacting the way we design and interact with our buildings and
homes● Impacting the way we design and use our production and
manufacturing centers, which in turn drives massive demographic changes
● Impacting our datacenters and personal technology habits
and the Machine to Machine Internet has barely begun!
Rates of change are exponential on the problem side… while solutions to date have been component and linear…

6
The future demands new solutionsand the largest companies must lead
InformationTechnology
TraditionalEnergy & Automation
Solutions must take the best of both worlds….The “I” and the “E”
7
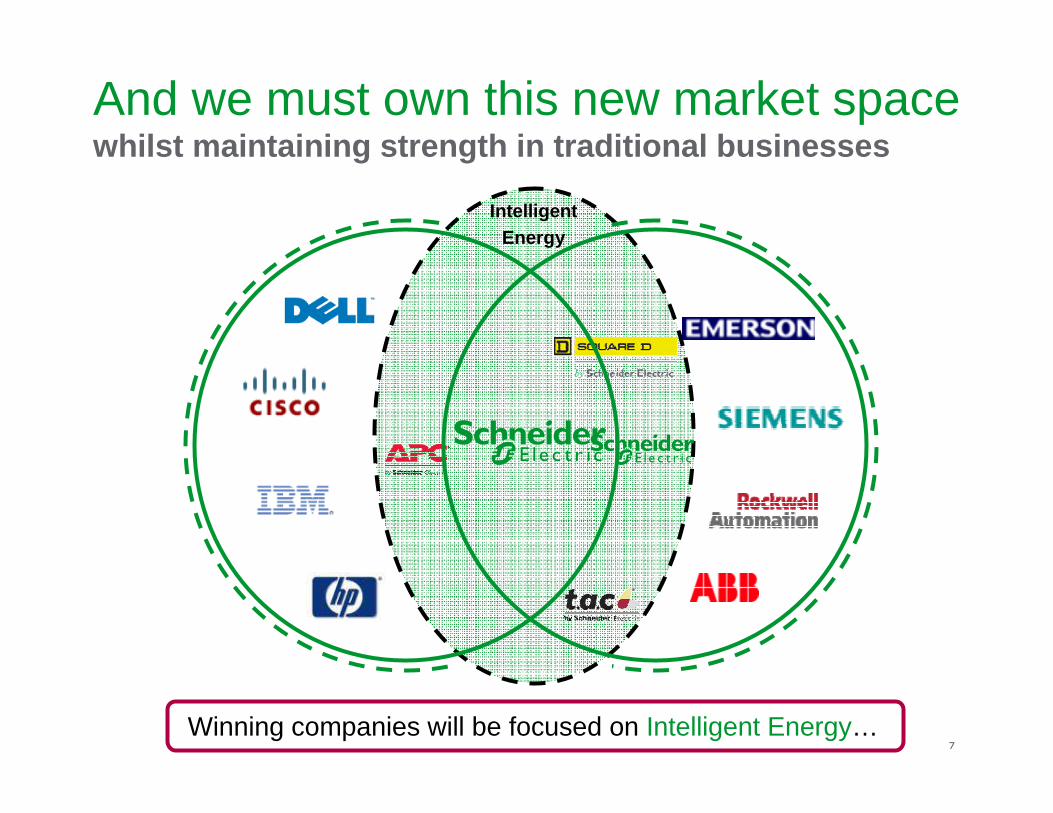
And we must own this new market spacewhilst maintaining strength in traditional business es
Winning companies will be focused on Intelligent Energy…
IntelligentEnergy
8
Intelligent Energy :Enabling the architectural integration of data, power, security, cooling and automation in the Digital World

9
Generation supply mattersbut demand behavior matters most, first !
Source: World Energy Outlook 2009, OECD / IEA
●Over 67% of CO2 emissions reduction will come from power generation
World energy-related CO 2 emissions
10
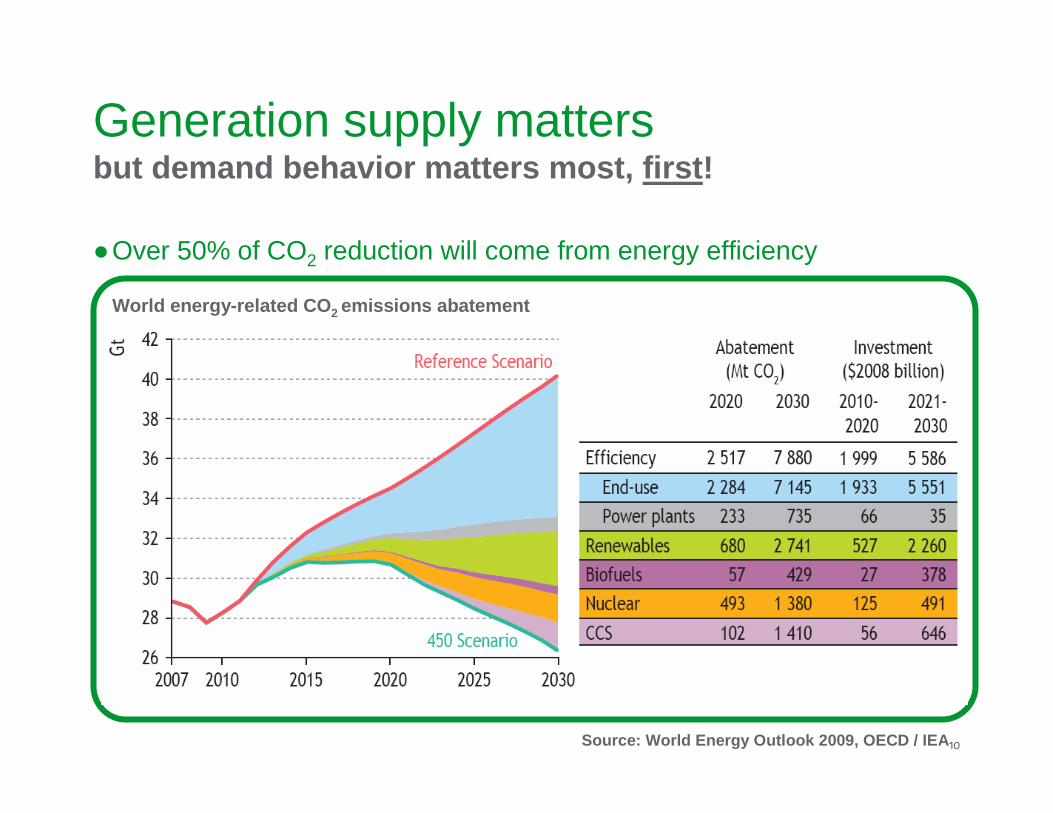
Generation supply mattersbut demand behavior matters most, first !
Source: World Energy Outlook 2009, OECD / IEA
●Over 50% of CO2 reduction will come from energy efficiency
World energy-related CO 2 emissions abatement

11
Generation:> 10 years to fix
Problems:CO2 EmissionsTransmission EfficiencyCapacity Constraints
Transmission:> 10 years to fix
Stranded CapacityCapacity Constraints
Buildings and Process:1- 5 years to fix
Point of Use:1-5 years to fix
Stranded CapacityService Entrance Capacity
Efficiency and Integration
Focusing on point of use architecture provides fastest impact and frees upstream capacity through Power Plant to Plug Optimization
The quickest wins: 50% of C0 2 cut must come from behaviour
We have 10 years…to fix 4 critical problems
Source: Hot, Flat and Crowded: Tom Friedman

12
Behaviour and good system architecture …can they really make a difference?
17,096 TWh* Total annual electric power use on earth
41%approximately goes to industrial & commercial buildings or about 6,960 TWh
20%**estimation of the % of the 41% wasted due to inefficiency of the traditional building infrastructure, (compared to what is possible for the same cost.)
1,392 TWhPotential savings now!
*CIA World Factbook 2008**ACEEE Study, 2005
France electricity consumption (536 TWh)
13
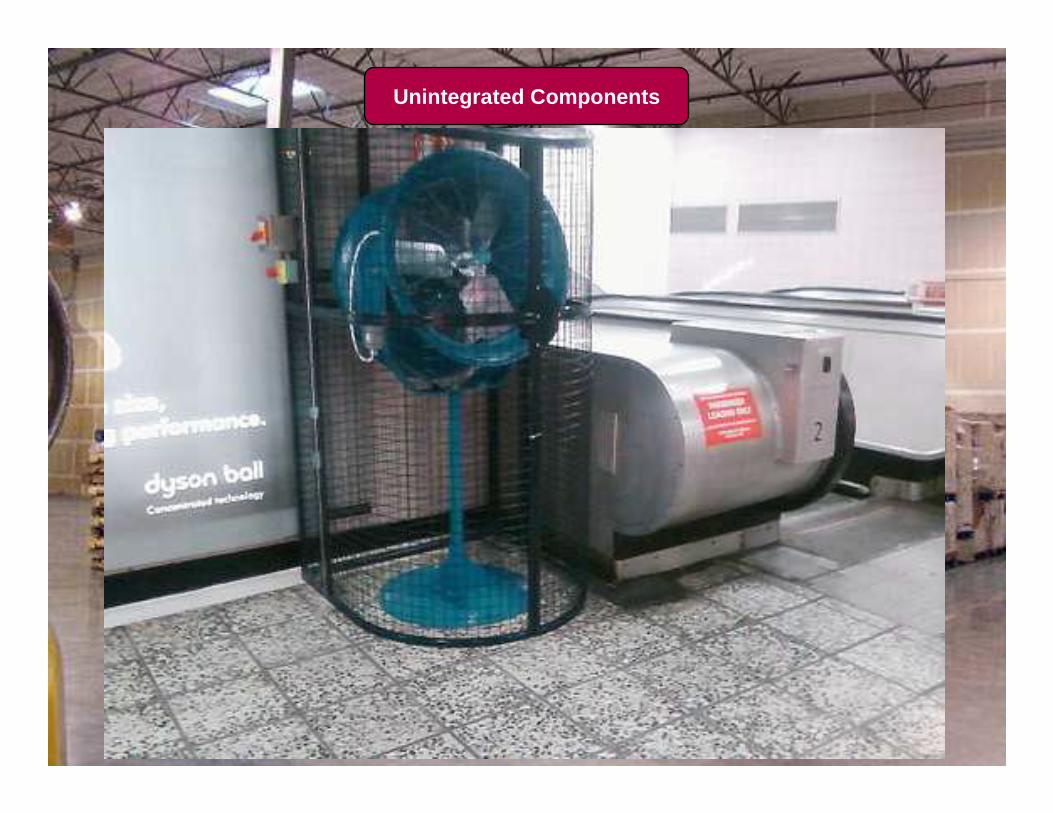
Unintegrated Components

14
Yes, a very big difference!
26 TWh *
The world’s current Photo Voltaic power generation capacity continuous equivalent output
Efficient building design are therefore 53+ times greater(purely a behaviour and education issue)
Efficient data center design, the savings available in are 7 times greater… over 60x!
*World PV Industry Report Summary March 16, 2009

15
The energy equation:a system under tension and conflict
Saf
e
Reliable
Efficient
Environmental impactPeople safetyAsset integrity
Energy availabilityEnergy qualityOffer quality
Energy efficiencyReduced OpexReduced Capex
Deployment speedAbility to integrateAbility to scale
Carbon freeEasy installationEasy connection
Prod
uctiv
e
Green

16
From primordial ooze to the modern ageThe evolution of management systems for facilities
The five management “domains” take shape
Emerging ability to answer basic questions1
“Facility management”quasi-system
The reign of “domain excellence”
Getting better – “separate but equal”2
Integrated MANAGEMENT system
Domain excellence + collaboration evolves
towards “solution excellence”
Moving toward “solution excellence”3

17
:the right ecosystem to support the convergence of 5 key domains
promise :●Guaranteed compatibility / synergy /
capability between the 5 domains of expertise
●Energy monitoring everywhere, with up to 30% EE
●Enabled by the right connecting technologies :● IP as a common highway
● Web services as a common language (SOA architectures)
Process
& Machine
Management
BuildingManagement
Security Management
Making energy Safe, reliable, efficient, productive and green
PowerManagement
White Space Management

18
A complete system approach
EEM
SECURITY
POWER
BUILDINGCONTROL
WHITE SPACE
PROCESS &MACHINES
THIRD PARTIES
MES
Energy& CO2 portal
Process Control SCADA
White space monitoring
Building Control
Video surveillance
Access control
Power & Energy monitoring
Power SCADA
Inventory mgt & workflow
Access controlVideo surveillanceEmergency lightingAlarms
LightingHeatingVentilationAir conditioningZone controlLifts & escalators
PDUs (rack, traditional)UPSCooling (in raw, perimeter)SurveillanceEnvironmental monitoring
Continuous processDiscrete processGeneral machine controlPackagingMaterial HandlingHoistingPump & fan control
Power QualityEnergy savingsIPMCCLocal MV controlLocal LV controlRenewables energy conversion
Capacity simulation & modelling
Products EnterpriseSupervision CloudControlServicesDomain

19
Enterprise portal
Supervision
Supervision
Solution offer overview
PROCESS& MACHINES
BUILDINGCONTROL
WHITE SPACE
POWER
SECURITYSupervision
Energy data access at low cost
Energy Management
Services

20
What we plan to bring to the market
Seamless inter-connection and integration of Power, Build Control, Security & White space mgt Systems
Generic BuildingsHospitals
Data-centers
Easy integration of Security (access/video) in Process management
MMM WWW O&G
Universal Energy monitoring Module
One Schneider-Electric Customer portal
Simple integration between Power & Process
Enhance Non-Permanent Monitoring & Control Capabilities

21
So let’s take a look…

22
Water Treatment & Distribution

23
● Industry & Infrastructure 15% 678 TWh
●Data Center & Network 30% 410 TWh
●Building 20% 1,392 TWh
●Residential 15% 552 TWh
Source: US DOE-EIA (Energy Outlook 2007), Green Grid for Data Centers, CIA WorldbookIndustry Buildings are included in building and not in industry. SE estimations of possible savings based upon best practice design and behaviour changes
ElectricitySaved
PossibleSavings
Active energy management architectures…from Power Plant to Plug
3,033 TWh annually

Schneider Electric 24- Division - Name – Date
Make the most of your energy™