energy opportunities for agriculture systems and … · through a detailed scoping process, project...
TRANSCRIPT
USAID.GOV ENERGY OPPORTUNITIES FOR AGRICULTURAL SYSTEMS AND FOOD SECURITY | GPTECH, ACDI/VOCA
ENERGY OPPORTUNITIES FOR AGRICULTURE SYSTEMS AND FOOD SECURITY
PROJECT: Identifying Opportunities Along the Post-Harvest Agriculture Value Chain
Solutions to food security challenges in Sub-Saharan Africa (SSA) should consider the complex
interrelationships of value chains, social and gender dynamics, and enabling environment factors: detailing
post-harvest inefficiencies and improving the nexus between agriculture and energy systems that link
farms to consumers. The need for reliable distribution, storage, and processing facilities is creating new
energy markets within agricultural value chains and food systems. Under USAID’s Energy
Opportunities for Agriculture Systems and Food Security Project (E4AS) (2017-2018), a team
of energy and agriculture and market systems experts, respectively from Green Powered Technology
and ACDI VOCA, worked with USAID program offices and mission representatives in Senegal and
Kenya to identify key challenges and opportunities related to access, efficiency, and reliability of energy
in agriculture processes that bridge rural agriculture production and urban food demand.
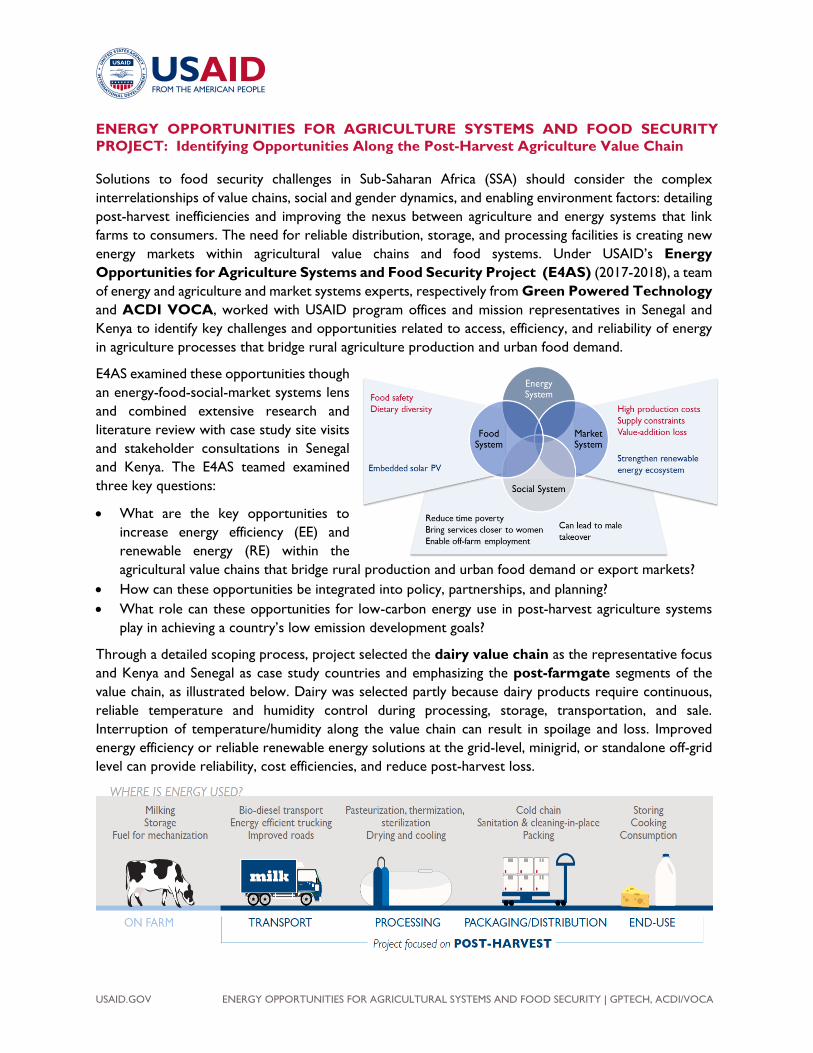
E4AS examined these opportunities though
an energy-food-social-market systems lens
and combined extensive research and
literature review with case study site visits
and stakeholder consultations in Senegal
and Kenya. The E4AS teamed examined
three key questions:
• What are the key opportunities to
increase energy efficiency (EE) and
renewable energy (RE) within the
agricultural value chains that bridge rural production and urban food demand or export markets?
• How can these opportunities be integrated into policy, partnerships, and planning?
• What role can these opportunities for low-carbon energy use in post-harvest agriculture systems
play in achieving a country’s low emission development goals?
Through a detailed scoping process, project selected the dairy value chain as the representative focus
and Kenya and Senegal as case study countries and emphasizing the post-farmgate segments of the
value chain, as illustrated below. Dairy was selected partly because dairy products require continuous,
reliable temperature and humidity control during processing, storage, transportation, and sale.
Interruption of temperature/humidity along the value chain can result in spoilage and loss. Improved
energy efficiency or reliable renewable energy solutions at the grid-level, minigrid, or standalone off-grid
level can provide reliability, cost efficiencies, and reduce post-harvest loss.

USAID.GOV ENERGY OPPORTUNITIES FOR AGRICULTURE SYSTEMS AND FOOD SECURITY 2
With the capital investment costs of renewable energy technologies continuing to decrease while access
to energy services in Sub-Saharan Africa severely lacking in many rural areas, there are opportunities for
deployment of renewables, both on-grid and off-grid, exist from a technical and financial feasibility
perspective within each segment of the value chain. For the dairy VC segments (milk production,
transportation, collection/reception, processing), examples of both on and off-grid include, among others:
Energy Efficiency: Renewable Energy
Variable Frequency Drive (VfD) Motors Solar generated power
Improved efficiency of pumps and equipment Biofuel generated power
Solar-powered evaporative cooling Solar powered refrigeration
Pre-cooling with ground source heat pumps Solar thermal heating
Improved refrigeration efficiency Solar drying
Pre-cooling with contra-flow cold water Pre-heating water with solar energy
Pre-heat using energy from processed milk Cool with waste heat from biofueled
combined heat & power
Heating with power from waste heat Biodiesel-fueled transportation
Improved packing equipment efficiency Bio-based packing materials
The E4AS team prepared implementation and technical brief
documents and an Infographic to further illustrate several of technical
opportunities and related project focal areas, as follows:
(1) Using solar thermal to lower energy costs for small scale dairy
processors
(2) Solar PV options for small-scale dairy aggregators
(3) Generating three-phase electrical power from a single-phase source
(4) Implementation Brief: Assessing Renewable Feasibility for Value Chain
Partners
From a market perspective, the E4AS team examine the market structures
for the dairy value chains, both the formal and informal markets in Kenya and
Senegal, looking at market-based opportunities for increased clean energy
uptakes. E4AS considered factors such as how private and impact capital
investments can fill renewable energy financing gap left by commercial banks
and examined before and after scenarios of potential costs savings from clean energy investments, as
illustrated in the adjacent figure. Moreover, with an overarching gender-sensitive lens, the project also
examined how clean energy opportunities in the value chain can provide opportunities to further
women’s empowerment, improve livelihood and business opportunities for women, address mobility
issues, and further gender equality opportunities.
The E4AS Final Project Report and related deliverables also provided information on opportunities on
how potential energy savings from these clean energy opportunities can contribute to low emissions
goals of these countries, such as Kenya’s Nationally Appropriate Mitigation Actions (NAMA) in the dairy
sector, as well as potential partnerships with ongoing donor and private sector initiatives. Opportunities
for integration of an energy considerations into national policy initiatives were also identified.
Additional technical opportunities were detailed in the E4AS Final Project Report and project documents.
The Final Report, technical and implementation briefs, and the Infographic are available on the Agrilinks
website.

PROCESSINGTRANSPORT END-USEPACKAGING/DISTRIBUTION
Project focused on POST-HARVESTON FARM
MilkingStorage
Fuel for mechanization
Bio-diesel transportEnergy efficient trucking
Improved roads
StoringCooking
Consumption
Cold chainSanitation & cleaning-in-place
Packing
Pasteurization, thermization, sterilization
Drying and cooling
BUSINESS IMPLICATIONS (field work findings)
MARKET-BASED OPPORTUNITIES TO INCREASE UPTAKE OF CLEAN ENERGY
The Time is Ripe for Energy-Fueled Agricultural Transformation
WHERE IS ENERGY USED?
Reliability Expense Value addition& market access
Employment Long-termcompetitiveness
Hidden Impacts
Many solar products have oversized inverters and batteries, affecting product efficiencies and lifespan.
Outages increase operating costs by: (1) requiring dairies to invest in backup power systems; (2) increasing wear and tear on equipment through frequent stops and starts; and (3) spills and jams on packing lines, with wasted product and labor clean up costs.
Tight delivery times restrict rural market access, divert fresh into fermented milk
In Kenya, dairies said high energy operating costs were a major factor limiting business growth, hiring, or diversification. The majority (3/5) of dairies in Kenya stated that energy cost savings would go to increased wages.
Kenya’s dairy sector is formalizing for food safety –energy is required all along this shift. Without it, small operations will struggle to remain competitive.
Energy’s hidden impact is on business growth, food safety, and value addition. This affects farm-gate prices and demand for producers, employment, and retail prices and product availability for consumers.
Addressing Energy Constraints in Off-farm Dairy Segments is Critical to Inclusive Growth in Africa
CLEAN AND RENEWABLE ENERGY FOR PRODUCTIVE USE: SPOTLIGHT ON DAIRYKey Findings from the Energy for Agriculture and Food Security Project
Solar minigrids increase rural electricity access off-grid and minimize costs and power disruption for those on-grid
Small-scale solar chillers extend delivery windows from farm to collection center & refrigerate transport by bicycle, bus or donkey
Energy efficiency audits for SMEs identify tailored options (e.g. blended solar and on-grid energy models)
Private and impact capital investments can fill renewable energy financing gap left by commercial banks—key due to high upfront RE costs
Infrastructure: Well-maintained, networked roads reduce travel time and fuel use. Access to electricity and potable water reduces spoilage
Waste heat recovery is a relatively simple, inexpensive process that uses pumps, pipes, and heat exchangers to recover waste heat from the chilling process, using it to reduce energy in pasteurization and sterilization. WHR can reduce total energy use by up to 19%.
Yogurt, cheese, & butter require energy to chill and/or heat products
Electricity consumes 20-40% of operating costs in Kenyan small-scale dairies
28 %SENEGALaccess to electricity
rural
3-5 x /week
power outages in dairiesKENYA
BEFORE AFTER
$1,000/mo
$4,000/mo
SME SNAPSHOT10,000L/day
DAIRYinvested in a 100kWh
solar array for $100,000
& reduced monthly costs by 75%
SENEGAL
dairies in KENYA
3 of 5 dairies in KENYA
24% SMEs, 15% large enterprises in
Power outages reduced hiring
High energy operating costs are a major factor limiting business growth, hiring, or diversification
Energy cost savings would go to increased wages
+ +WisconsinUSA
KENYA0
10
20
30
40
20%
40%
2%5%

RENEWABLES INCREASINGLY BEAT FOSSIL FUELS ON COST
Interested in more? Visit www.agrilinks.org/post/clean-energy-productive-use-post-harvest-value-chains-integrated-literature-review-field-work for more E4Ag resources, including briefs on solar thermal and solar PV for small scale dairies; single to three phase electrical conversion; and energy-sensitive value chain development design, plus a series of gender-focused blogs.
The Energy Opportunities for Agricultural Systems and Food Security Project (E4AS) expands and focuses information on how clean energy and energy efficiency can strengthen post-harvest value chains and reduce loss in sub-Saharan Africa, while also contributing to LED goals and incorporating gender considerations. E4AS is funded by USAID’s Africa Bureau and implemented by Green Powered Technology in partnership with ACDI/VOCA.
Clean and Renewable Energy Can Reduce Greenhouse Gases and Contribute to Low Emission Development
CONTEXT MATTERS
CONTINUE TO INVEST IN IMPROVED GHG DATA FOR TRANSPORT, PROCESSING, AND RETAIL
2010 2017
Change in average cost of utility-scale renewables ($/kWh)
0.36
0.100.050.17
27%
KENYA84%
SENEGAL
% fossil fuel in power generation mix
Off-set high fossil fuels by targeting on-grid, larger dairies. In off-grid areas, dairy is currently highly informal and therefore does not use significant energy
Dairies use more energy. GoK's NEMA plans to reduce GHGs in dairy, but must improve livestock emission estimation methods to monitor mitigation and trends
Energy consumption data post-harvest is often lacking; better quantifying energy savings and GHG emissions and reductions can inform future policy and illustrate policy impacts
Empowering Women Through Energy in Dairy? A Complex Reality
Reduce women’s time poverty
Address women’s mobility constraintsi.e. solar-powered chilling on motorized transport enables collection at farm gate
Create jobs for women as businesses expandBeyond the farm gate, women mostly work in cleaning, packaging, retail; jobs less at risk of automation as businesses grow
Trigger male takeover of functions and incomeas milk becomes more commercial and value-added
ENERGY SOLUTIONS CAN:
Understand this risk and how it will
influence technology adoption and growth
Policy and Partnership Opportunities
6. Strengthen the solar energy ecosystem e.g:• Installation and maintenance: strengthen vocational
and enterprise skills, alternative delivery models (e.g. layered service onto rural agent networks)
• Support alternative financing and directed investment for companies and end customers to minimize upfront costs. (e.g. alternative collateral, bundled investments, business accelerators)
• Expand access and availability of appropriately sized inverters, batteries, and chargers
• Build industry platforms for collaboration, advocacy and co-creation
1. Embrace a systems approach to analysis and designExciting ideas can fail to have systemic impact; many energy opportunities struggle with widescale adoption and market penetration. Systems approaches help us understand the broader ecosystem, social and economic dynamics that will influence impact, and design smarter policies and programs
2. Leverage partnerships with solar and energy innovators and programs to synergize investments, support scale-up and commercialization, and apply lessons learned. E.g. Powering Ag, USAID’s Photovoltaics for Sustainable Milk for Africa through Refrigeration Technology (PV-SMART) project; Strathmore Univ’s Energy Research Centre in Kenya
5. Support user education campaignson energy efficient best practices
4. Reduce or eliminate tariffs on solar products (as in Kenya) and provide subsidies (guarantees, subsidized debt interest, tax incentives) to spur investment, adoption and reduce user costs
S
3. Net meteringincentivizes distributed storage and increases total supply of RE

1
Options for providing 3-phase power from a single-phase source
Several relatively simple and inexpensive alternatives exist to provide 3-phase power where only sin-gle-phase service is available. These alternatives include:
• Static 3-phase Converter
• Rotary 3-phase Converter
• Digital 3-phase Converter
• Variable Frequency Drive (VFD)
ENERGY OPPORTUNITIES FOR AGRICULTURAL SYSTEMS AND FOOD SECURITY PROJECT
POWERING THREE-PHASE ELECTRICAL DEVICES FROM A SINGLE-PHASE SOURCETechnical Brief #1
Introduction
Field work during the Energy Opportunities for Ag-ricultural Systems and Food Security Project (E4AS), found that access to 3-phase electrical power was a limiting constraint to value chain development in the Kenyan dairy sector.
Unfortunately, most electrical supply across the developing world is not 3-phase, it is single-phase (for explanation of the difference between the two, see text box next page). The E4AS project found that this lack of 3-phase supply significantly restricts the use of more efficient 3-phase equipment by agro-processing firms. Beyond very small scale, most industrial equipment, including dairy or any other agro-processing equipment, have three-phase mo-tors that require three-phase supply.
Electrical utilities in most countries can provide a 3-phase connection, but it can require significant financial investment, months of bureaucratic hurdles and coordination of electrical installation. This was the situation faced by some of the dairies visited by E4AS. They were faced with significant delays in opening and significant additional costs from the public utility company to extend three-phase supply to their operation locations. This brief summarizes several simple and inexpensive alternatives to create or simulate three-phase electrical supply at point of use.
This document was produced for review by the United States Agency for International Development. It was developed by Martin Anderson for Green Powered Technology with support from ACDI/VOCA under the USAID Energy Opportunities for Agriculture and Food Security Project (Contract Number AID-OAA-C-17-00112).
This brief is the first of four practical guides developed by the Energy Opportunities for Agricultural Systems and Food Security Project (E4AS). Funded by USAID’s Africa Bureau with field work in Senegal and Ken-ya, E4AS is implemented by Green Powered Technology in partnership with ACDI/VOCA. The objective of E4AS is to expand and focus information related to how clean energy (CE) and energy efficiency (EE) can strengthen post-harvest value chains and reduce loss in sub-Saharan Africa, while also contributing to low emission development strategies (LEDS) and incorporating gender-aware strategies. Visit www.agrilinks.org/post/clean-energy-pro-ductive-use-post-harvest-value-chains-inte-grated-literature-review-field-work to access additional briefs and an integrated literature review with field work findings.
2
Before considering one of these choices, it is rec-ommended to evaluate the feasibility of replacing 3-phase motors with single-phase motors. If a sub-stitution is possible, this may be the least expensive alternative. However, this may not be possible due
to motor mount sizing, special mounting brackets, special shaft sizing or design, overall space, or the required horsepower rating. If that is the case, then consider one of the four converter technologies discussed below.
3-Phase vs. Single Phase
Electric current is the flow an electric charge. There are two primary types of electrical current: Direct and alternating (DC and AC). Direct current moves in one direction, alternating current periodically reverses its direction depending on its frequen-cy. Alternating current is available as single-phase (typically for residential applications) and as 3-phase (typically for industrial applications).
When using alternating current, in a single-phase cir-cuit, power is equal to the product of voltage, cur-rent and the phase angle between them. In a 3-phase circuit this product is multiplied by the square root of 3, or 1.73.
As a result, single-phase circuits require 1.73 times more current (Amps) to provide the same amount of power:
Single-phase: Power = V x I x ø
3-Phase: Power = V x I x ø x 1.73
Since current carrying capacity is directly related to the size of the conductor, this means that for a single-phase circuit, more conductor material is required at a higher cost.
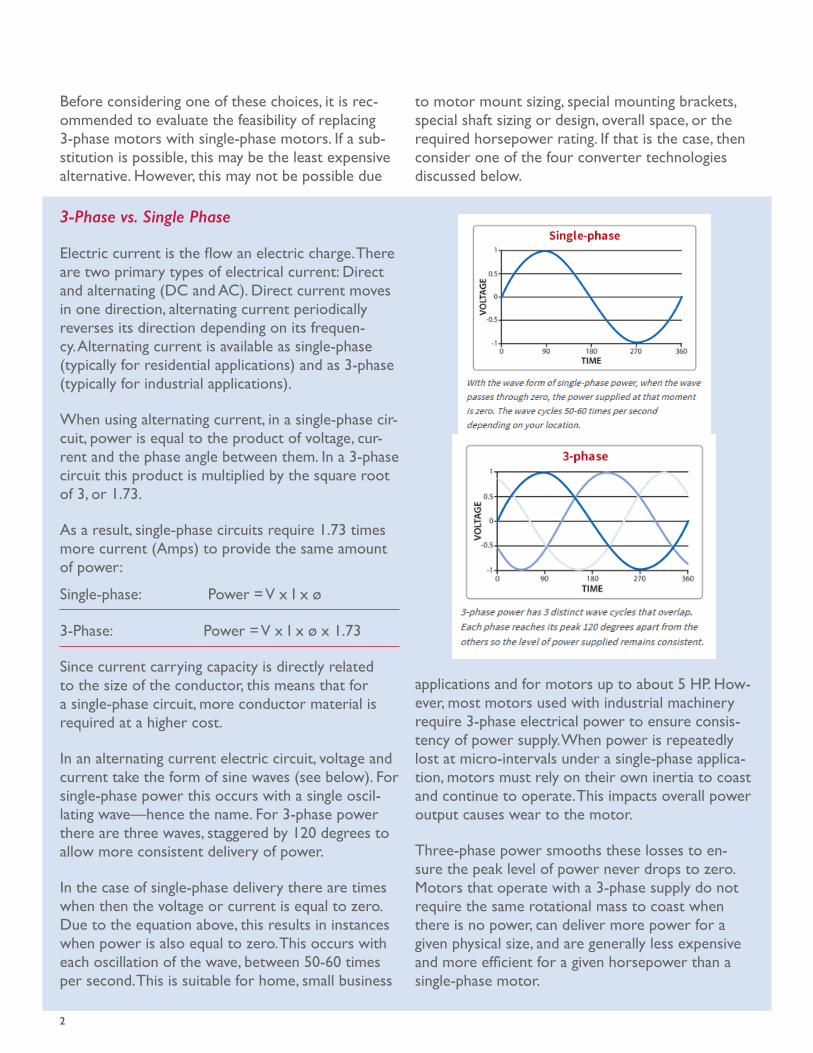
In an alternating current electric circuit, voltage and current take the form of sine waves (see below). For single-phase power this occurs with a single oscil-lating wave—hence the name. For 3-phase power there are three waves, staggered by 120 degrees to allow more consistent delivery of power.
In the case of single-phase delivery there are times when then the voltage or current is equal to zero. Due to the equation above, this results in instances when power is also equal to zero. This occurs with each oscillation of the wave, between 50-60 times per second. This is suitable for home, small business
applications and for motors up to about 5 HP. How-ever, most motors used with industrial machinery require 3-phase electrical power to ensure consis-tency of power supply. When power is repeatedly lost at micro-intervals under a single-phase applica-tion, motors must rely on their own inertia to coast and continue to operate. This impacts overall power output causes wear to the motor.
Three-phase power smooths these losses to en-sure the peak level of power never drops to zero. Motors that operate with a 3-phase supply do not require the same rotational mass to coast when there is no power, can deliver more power for a given physical size, and are generally less expensive and more efficient for a given horsepower than a single-phase motor.

3
Static 3-phase Converter
A static converter is the least expensive alterna-tive for 3-phase conversion. It has no moving parts; however, it needs to be sized to match the motor size (i.e. horsepower). The major disadvantage of a static converter is that it reduces a motor’s available horsepower by about one third. It also has difficul-ty in starting motors with high starting loads (e.g. compressors, dust collectors, large fans, etc.). To overcome this, a lightly loaded motor can be started first to act as an electrical flywheel to improve the starting ability of other motors. An “idler” motor (a spare motor connected to the same system) can also be used to provide this electrical flywheel, but this adds to the overall system cost.
Note, not all motors can run using a static phase converter. Static phase converters are not recom-mended for welders, heaters, two speed motors, air compressors, pumps, fans, CNC machines, plasma cutters, refrigeration trucks, blowers, large flywheels and large lathes1.
Typical single-phase to 3-phase Rotary Converters from North American Phase Converter Co. (left), Phoenix Phase Converters (center), and American Rotary Phase Converters (right)
1 How to size a Static Phase Converter - www.northamericaphaseconverters.com/how-to-size-a-static-phase-converter
Rotary 3-phase Converter
A rotary converter functions as both a motor and a generator using a single-phase motor to drive a gen-erator to produce 3-phase power. A rotary convert-er looks like a large motor with a large junction box attached. It is more expensive than a static convert-er but doesn’t have the starting and reduced power problems that occur with a static converter. A major advantage is that a suitably sized rotary converter can be used to supply 3-phase power to all—or multiple—3-phase motors in a facility.
Typical single-phase to 3-phase static converters from American Rotary Phase Converters (left) and Phase-A-Matic (right)
Figure 1. Schematic of 3-phase static converter installation
Figure 2. Schematic of 3-phase rotary converter installation

4
Variable Frequency Drive (VFD)
A Variable Frequency Drive (VFD or VSD or elec-tronic 3-phase inverter) changes single-phase power into direct current and then inverts the direct cur-rent to 3-phase power. This is done using electronic controls to simulate 3-phase alternating current.
The electronics in the converter allow control of motor speed, torque and direction of rotation, and often allow for a soft start to bring the motor up to speed gradually. Since it must be programmed, a VFD typically is dedicated to running only one motor. VFDs can be more affordable that rotary converters for lower horsepower motors, however above 10 HP the savings decline (see relative cost chart).
Digital 3-phase Converter (often called 3-phase Inverter)
A digital phase converter uses a rectifier and in-verter to create a single voltage. This is done using power electronics, added to the two legs of the incoming single-phase source. The new single voltage can match both the voltage and frequency of the incoming single-phase power, resulting in an out-put that is a well-balanced 3-phase sine wave, not a stepped waveform typical of a variable frequency drive (VFD). Digital converters are more efficient than rotary converters. In contrast to a standard rotary converter, a digital converter only uses pow-er when a load is present and has minimal internal power use. The digital 3-phase converter cannot vary frequency and motor speed like a VFD (dis-cussed below), which may be a better choice as cost are relatively the same.
Typical single-phase to 3-phase Digital Phase Converters from North American Phase Converter Co. (left), and American Rotary Phase Converters (right)
Variable Frequency drives from DURApulse (left), and Hitachi (right)
Figure 4. Schematic of Variable Frequency Drive
Figure 3. Schematic of digital 3-phase converter

5
Suppliers
There are numerous suppliers of phase converters and VFDs. The following list provides the website address of some examples of suppliers:
www.phoenixphaseconverters.com
www.americanrotary.com
www.northamericaphaseconverters.com
www.phase-a-matic.com
www.schneider-electric.us
eaton.com
technolectric.com (Kenya)
sollatek.co.ke (Kenya)
www.parker.com
Phase Converter or Variable Frequency Drive?
A phase converter is the easiest “plug and play” solution. It requires the least programming, can be selected based on the motor size, and is simple to install. It is most suitable for 3-phase motors where speed and torque control are not required (e.g. refrigeration equipment, freezers, etc.) and where a machine has numerous low voltage internal controls. Variable frequency drives are well suited for phase conversion when control of speed, motor torque and soft starting are needed for such applications as pumps, fans, compressors and process machinery.
Voltage
Phase converters are not transformers. Unless a transformer is included in the system, outgoing 3-phase voltage will equal the incoming single-phase supply voltage. Therefore, a transformer may be re-quired to match the supply voltage required for the 3-phase application.
MOTOR SIZE
EQUIPMENT TYPE 3 H.P. 5 H.P. 10 H.P 15 H.P. 20 H.P.
Static 3-phase Converter $180 - 500 $300 - 600 $550 - 750 $750 – 1,000 $750 – 1,200
Rotary 3-phase Converter $450 - 1,000 $450 - 1,500 $820 - 1,900 $1,250 - 2,500 $1,350 - 2,500
Digital 3-phase Converter $400 - 600 $500 - 800 $1,500 - 2,250 $2,000 - 3,000 $2,500 - 4,000
Variable Frequency Drive $450 - 600 $600 - 850 $1,750 - 2,500 $2,500 - 3,200 $2,750 - 4,000
Prices are in US Dollars and are based on equipment available from several different suppliers in April 2018.
Relative Costs
The following relative costs are based on currently available equipment in the USA. The ranges in pric-ing reflect equipment from different manufacturers and suppliers in early April, 2018.

1
Introduction
Field work during the Energy Opportunities for Agricultural Systems and Food Security Project (E4AS) found that power interruptions and local power costs affect the profitability of fresh camel and cattle milk sales. While project observations centered around primary chilling at small-scale cooperative dairies in Kenya, the key issues and lessons learned are applicable to broader small-scale cold chain aggregation applications.
E4AS’ report Clean Energy for Productive Use in Post Harvest Value Chains: An Integrated Literature Review with Field Work for the Kenya and Senegal Dairy Sectors1 highlighted a number of different solar photovoltaics (PV) products as promising opportunities to improve uptake of clean energy in sub Saharan Africa. PVs offer an alternative power supply that can improve reliability of electric supply and lower overall electric costs. This brief expands on this finding by highlight-ing a series of technical factors specific to uptake by small-scale dairy aggregators of PV technologies.
1 To access the report as well as other E4AS briefs, visit: www.agrilinks.org/post/clean-energy-productive-use-post-harvest-value-chains-integrated-literature-review-field-work
Solar thermal explained
Cooperative dairies collect and chill milk in rural areas and transport it to urban centers where they sell the “fresh” product. To avoid the milk warming and spoiling on this journey, cooperatives chill it as much as possible before transport. Upon receipt, warm milk is poured into 20L jerry cans and placed inside chest freezers to chill and partially freeze overnight. The milk is then transport in a highly
chilled - if not frozen - state, allowing it to be as fresh a possible when arriving at market. This pro-cess presents two primary problems: the energy costs required to adequately chill large quantities of warm liquid; and insufficient cooling due to common short and long duration power interruptions.
ENERGY OPPORTUNITIES FOR AGRICULTURAL SYSTEMS AND FOOD SECURITY PROJECT
SOLAR PV OPTIONS FOR SMALL-SCALE DAIRY AGGREGATORSTechnical Brief #2
This brief is the second of four practical guides developed by the Energy Opportunities for Agricultural Systems and Food Security Project (E4AS). Funded by USAID’s Africa Bureau with field work in Senegal and Ken-ya, E4AS is implemented by Green Powered Technology in partnership with ACDI/VOCA. The objective of E4AS is to expand and focus information related to how clean energy (CE) and energy efficiency (EE) can strengthen post-harvest value chains and reduce loss in sub-Saharan Africa, while also contributing to low emission development strategies (LEDS) and incorporating gender-aware strategies. Visit www.agrilinks.org/post/clean-energy-pro-ductive-use-post-harvest-value-chains-inte-grated-literature-review-field-work to access additional briefs and an integrated literature review with field work findings.
This document was produced for review by the United States Agency for International Development. It was developed by Martin Anderson of GP TECH and Kevin Boylan of ACDI/VOCA under the USAID Energy Opportunities for Agriculture and Food Security Project (USAID Contract Number AID-OAA-C-17-00112).

2
Energy Costs
Cooperatives typically power freezers for chilling with energy purchased from a local power utility, or from energy produced by diesel generators. In Kenya, the power purchased from the utility by dairy cooperatives typically ranges from 35,000 KSh (US$ 350) to 40,000 KSh (US$ 400) depending on the season. Other than the cost for the raw milk, this power bill is the single largest expense faced by cooperatives.
Power Interruptions
Daily power interruptions can be a common oc-currence in developing economies. While not only inconvenient, these outages can be costly for coop-eratives and other business that rely on cold chain integrity. In the case of dairy, milk that is insufficient-ly chilled overnight, may not remain fresh during transport to an urban market. In the case of longer outages, milk may even spoil prior to transport. If fresh milk spoils during the journey, it is still sold, however at a discounted price that may not cover the costs of transportation and the initial purchase of raw milk.
Alternative Supply Thorough Photovoltaics
The installation of photovoltaic (PV) systems to generate power and battery storage can allow cooperatives to improve the surety and consistency of energy supply and lower overall energy costs. A solar powered system with battery storage can provide either a complete off-grid power supply or a system to provide back-up power during utility interruptions.
2 150 KSh/litre (fresh) – 80 KSh/litre (spoiled) x 500 litres x 12 months = 420,000 KSh/year ; this assumption may be conservative, and if in fact it occurs more frequently, then the payback period would be reduced.
3 Simple payback does not account for slight degradation of panels and batteries over time and any maintenance costs.
Complete off-grid solar power supply
A 100% solar power supply would include sufficient photovoltaic panels to generate power throughout the daylight hours to provide the immediate power requirements and to charge batteries to provide power throughout the nighttime hours. An appro-priate investment would allow a cooperative to provide all its own power and minimize any inter-ruptions resulting in spoiled milk or insufficiently chilled milk.
Given chilling loads may vary regardless of installed capacity, past utility bills offer the best estimation of average energy consumption.
The avoided annual power costs can be calculated based on past utility bills. In this example they are estimated at US$4,600 annually. The reduction of costs due to milk spoilage must also be considered. This is difficult to estimate without exact records. Interviews with cooperative members showed it reasonable to assume that utility power interrup-tions and outages result in at least one loss of fresh milk (still sold as spoiled milk) per month. This costs the cooperative approximately US$4,200/year2.
Therefore, the total annual savings with a 100% solar powered system with 16 hours of battery storage would be approximately US$8,800/year for an investment of approximately US$47,000. This would result in a simple payback of just over five years3.
In the case of a Kenyan cooperative with 11 chest freezers and an average utility bill of 39,400 KSh for 2.74Kwh/hr, the esti-mated cost to provide a 100% solar power supply with 16 hours of battery storage is 4.7 million KSh (US$47,000).

3
Partial Backup Power Storage
The largest cost component of a complete solar power supply as described above are the batteries necessary for power storage. Reducing the total amount hours of required storage, while continuing to supplement with power purchased from a utility, will reduce the overall installation cost. For example, a reduction in the storage capacity outlined above from 16 hours to 8 hours would reduce installa-tion costs by US$15,000 to US$32,0004. Such an approach would still require the purchase of pow-er from a utility. Using the same costs from our example above, if 8 hours per day were required to still be purchased, the annual cost would be US$1,530, resulting in a total energy bill savings of US$3,070 per year. The same reduction of milk spoilage costs is also applicable under this scenario (US$4,200/year). Total annual savings of a partial backup system would result in a simple payback in 2.8 years.
4 Reduction in number of batteries from 24 to 12, reduction in number of pv panels required as they are not required to charge the batteries, and various other savings.

1
Introduction
Solar energy from the sun can be captured to generate both electricity (solar electric) and heat (solar thermal). Solar electric can be used to pro-vide renewable power to replace traditional fossil fuel based forms of power generation. Solar thermal energy can be used to provide primary and supple-mental heat in a wide range of applications from space conditioning in buildings and heating of swim-ming pools, to specific applications in a variety of industrial processing operations.
This technical brief discusses the use of solar ther-mal in the dairy processing industry and how solar thermal can reduce milk pasteurizing and processing costs, particularly for small-scale processors in a sub Saharan African context.
Solar thermal explained
Electromagnetic radiation from the sun provides both light and heat on Earth. Much of this radiation is invisible to the human eye, but its impact caus-es the molecular structure of materials to vibrate which results in heat. This is how the Earth is heat-ed. Capturing that heat provides a renewable and useful source of thermal energy.
A simple example of a garden hosepipe on a sun-ny day demonstrates this. The water temperature in a hosepipe left out in bright sun, even for a few minutes, can increase to scalding temperatures because the sun’s infrared radiation heats the water in the hose. Solar thermal panels operate in the same way, with the sun’s infrared radiation heating
ENERGY OPPORTUNITIES FOR AGRICULTURAL SYSTEMS AND FOOD SECURITY PROJECT
USING SOLAR THERMAL TO LOWER ENERGY COSTS FOR SMALL SCALE DAIRY PROCESSORSTechnical Brief #3
This brief is the third of four practical guides developed by the Energy Opportunities for Agricultural Systems and Food Security Project (E4AS). Funded by USAID’s Africa Bureau with field work in Senegal and Ken-ya, E4AS is implemented by Green Powered Technology in partnership with ACDI/VOCA. The objective of E4AS is to expand and focus information related to how clean energy (CE) and energy efficiency (EE) can strengthen post-harvest value chains and reduce loss in sub-Saharan Africa, while also contributing to low emission development strategies (LEDS) and incorporating gender-aware strategies. Visit www.agrilinks.org/post/clean-energy-pro-ductive-use-post-harvest-value-chains-inte-grated-literature-review-field-work to access additional briefs and an integrated literature review with field work findings.
This document was produced for review by the United States Agency for International Development. It was developed by Martin Anderson for Green Powered Technology under the USAID Energy Opportunities for Agriculture and Food Security Project (Contract Number AID-OAA-C-17-00112).
Figure 1. Roof Mounted Solar Thermal Panel at Moi’s Bridge Muun-gano Farmer’s Cooperative Society Ltd., Moi’s Bridge, Kenya

2
a fluid (usually water or a water glycol mixture) in a solar collector or panel. These panels are typical-ly flat and mounted in an unshaded area on a roof or the ground. They often have glass covers under which there are multiple interconnected black tubes through which the heat transfer fluid is pumped. Hot fluid is stored in insulated tanks for later use. In some designs thermo-siphoning of the fluid to and from the panel obviates the need for a pump.
Solar thermal in small-scale dairy processing operations
Solar thermal energy can be used in a number of applications in dairy processing operations, including:
• providing hot water for CIP (clean-in-place) and sanitary use
• pre-heating boiler feedwater
• directly heating milk in the pasteurizing process
Each of these are discussed briefly below, and their relative economics examined.
Costs of electricity and equipment used in these economics are based on actual costs found in Kenya, but the applications would be applicable in any country with suitable adjustment for local econom-ics. Because the costs of the alternative fuels used for heating such as oil and biomass can vary consid-erably between countries and regions within coun-tries, for the summary economic analysis discussed below, it has been assumed that electricity at a cost of 20.0 Kenyan Shillings per kilowatthour (20.0 KSh/kWh or US$0.20/kWh) is used in all heating appli-cations. Local Kenyan equipment supplier costs of 121,000 KSh (US$1,210) for a 3.5 m² solar thermal panel (equipment only) were also used in these calculations.
Clean-in-place (CIP) and sanitary water heating with solar thermal
All equipment used in food processing needs to be cleaned and sanitized on a regular basis. This is espe-cially important in milk processing where bacterial contamination can quickly cause product spoilage and consumer illness. Processing equipment used in milk processing, including the pasteurizing equip-ment, must be washed and sanitized using warm water, detergents and disinfectants. Typically the water temperature used with the detergents and disinfectants is the same as the temperature used in pasteurizing, but for the initial equipment rinse, milk fat solids that are deposited within the processing equipment will be flushed better using warm water (<55 °C or 131 °F) so proteins in the milk do not coagulate.
• The energy required to raise water temperature from ambient of 16°C (61°F) to 55 °C (131 °F) is 0.045 kWh/litre (= 587 Btu/US Gal or 704 Btu/Imp Gal).
• A single flat glass panel solar thermal collector of 3.5 m² in a high solar radiation region (i.e. > 6.3 kWh/m²/day or 2,000 Btu/ft2/day) such as Eldoret, Kenya can heat approximately 200 litres/day (53 US Gal/day or 44 Imp Gal/day) from 16 °C (61 °F) to 55 °C (131 °F).
• If this same heat energy is provided by an electric heater, the electric heater would consume ap-proximately 10 kWh/day or 3,650 kWh/year at a cost in Kenya of 20 KSh/kWh (US$0.20/kWh) or 73,000 KSh/year (US$730).
An installed cost of a single 3.5 m² solar thermal panel is estimated at approximately 140,000 – 150,000 KSh (US$1,400 – 1,500). Although this upfront cost is higher than a monthly electric bill (straight-lined monthly average of US$60.80, or $730 a year), the solar thermal panel pays for it-self with a payback period of approximately two years, providing long-term cost savings.
The number of panels installed would depend on available capital, suitable available space (e.g. available roof space or nearby land), and the total volume of

3
warm water required for CIP and sanitation each day. In a system used to heat CIP and sanitation water in an area where there is no chance of freez-ing, the actual CIP and sanitation water could flow directly through the solar thermal panel.
Where there is a chance of freezing, a water glycol mixture would be required in the solar thermal panel, so a heat exchanger would be required to exchange heat between the water/glycol mix and the CIP and sanitation water. This would add to the installed capital cost and increase the estimated payback by approximately 50%.
Boiler feedwater pre-heating with solar thermal
In a similar way to heating water for CIP, boiler feedwater used for heating milk prior to and during pasteurization can also be heated using solar ther-mal. A heat exchanger would be used between the fluid flowing in the solar thermal panel and the boiler feedwater to minimize chemical fouling of the solar thermal panel. Savings, costs and payback are similar to those for the CIP and sanitation water heating.
Pre-heating and heating of milk for pasteurizing
Solar thermal can also be used to partially or com-pletely heat the milk input into the pasteurizing equipment.
Depending on the pasteurizing process used and the duration the milk is held at the pasteurizing tem-perature, the actual input temperature required for the milk may vary. However, the typical flash pas-teurizing or High-temperature Short-time (HTST) pasteurizing requires a temperature of 72 °C (161.6 °F) for 15 seconds. Milk stored at 4 °C (40 °F) requires a heat input of 0.0785 kWh/litre (1,015 Btu/US Gal or 1,218 Btu/Imp Gal) to raise it to that pasteurizing temperature.
The figure below illustrates the use of solar thermal to heat the milk completely.
• Because of the higher differential (input to output) temperatures required, a single flat glass panel solar thermal collector of 3.5 m² in a high solar radiation region (i.e. > 6.3 kWh/m²/day or 2,000 Btu/ft2/day) can heat approximately 50 litres/day (13 US Gal/day or 11 Imp Gal/day) from 4 °C (40 °F) to 72 °C (161.6 °F).
• If this same heat energy is provided by an elec-tric heater, the electric heater would consume approximately 4 kWh/day or 1,460 kWh/year at a cost in Kenya of 20 KSh/kWh (US$0.20/kWh) or 29,200 KSh/year (US$292).

4
• The installed cost of a single 3.5 m² solar thermal panel with heat exchanger and pumps is esti-mated at approximately 160,000 – 175,000 KSh (US$1,600 – 1,750). Although this upfront cost is higher than a monthly electric bill (straight-lined monthly average of US$24.33), the solar thermal panel pays for itself with a payback period of approximately six years—providing long-term cost savings.
• For a milk processing plant in a high solar radiance region that flash pasteurizes 10,000 litres of raw milk per day with no heat recovery from the hot pasteurizer output milk, the heat required for pas-teurizing could be produced by approximately 200 flat glass panel solar thermal collectors at a cost of approximately 30,000,000 - 35,000,000 KSh (US$300,000 - 350,000). This would require 700 m² of flat glass panel solar thermal collectors.
Blended solar/electric model: instead of heating the milk to the full required pasteurizing tempera-ture, solar thermal can be used to partially heat the milk and then the remainder of the heat is provided by the existing electric heaters, as shown in the figure below.
• With this, because the differential temperature between the input and output (∆T = TOutput – TInput) of the solar thermal panel would be less, and because a solar panel’s efficiency is generally greater the lower the differential temperature from input to output, the number of panels, the capital cost, and the payback would be re-duced.

1
Introduction
Solar energy from the sun can be captured to Field Energy is a critical and often neglected component of value chain development. On-farm mechaniza-tion, value addition processing, and supply chain improvements like cold chain expansion all hinge on the availability of affordable power sources. Rapidly expanding innovation in renewables (e.g. solar, ther-mal) and energy efficiency (e.g. waste heat recovery systems, variable-frequency drives) are providing novel and increasingly cost competitive energy opportunities to support these kinds of value chain upgrading. When appropriately designed and priced, productive energy solutions can also support inclu-sion through expanding the geographic footprint of rural supply chains and helping small and mid-size businesses remain competitive.
At the same time, the history of foreign aid is lit-tered with donor-funded mills, cold storage facili-ties, and other value chain investments that sit idle, often in part because energy and other recurring costs were prohibitive, equipment was incompatible with local energy supply, or unconsidered gender and social dynamics affected uptake and use of the investment.
This brief provides value chain and market system development specialists with the basic tools and resources to integrate analysis of energy opportuni-ties—particularly modeling costs and payback peri-ods for RE or EE investments—into their design and implementation work. We present a six-step process that helps practitioners to:
• Rapidly identify energy constraints to market op-portunities in a target value chain (steps 1 and 2);
• Identify energy demand needs by value chainpartners and comparative energy supply options(steps 3 and 4);
• Assess the feasibility of these energy opportuni-ties for firm investment (step 5)
• Recognize key gender and social considerationsthat could impact uptake, use, and benefit (inte-grated into all steps); and
• Design interventions to catalyze those opportuni-ties for more broad-based, sustained impact (step 6).
ENERGY OPPORTUNITIES FOR AGRICULTURAL SYSTEMS AND FOOD SECURITY PROJECT
ASSESSING THE FEASIBILITY OF RENEWABLE ENERGY & ENERGY EFFICIENCY FOR VALUE CHAIN PARTNERS Technical Brief #4
This brief is the last of four practical guides developed by the Energy Opportunities for Agricultural Systems and Food Security Project (E4AS). Funded by USAID’s Africa Bureau with field work in Senegal and Ken-ya, E4AS is implemented by Green Powered Technology in partnership with ACDI/VOCA. The objective of E4AS is to expand and focus information related to how renewable energy (RE) and energy efficiency (EE) can strengthen post-harvest value chains and reduce loss in sub-Saharan Africa, while also contributing to low emission development strategies (LEDS) and incorporating gender-aware strategies. Visit www.agrilinks.org/post/clean-energy-pro-ductive-use-post-harvest-value-chains-inte-grated-literature-review-field-work to access additional briefs and an integrated literature review with field work findings.
This document was produced for the United States Agency for International Development (USAID) by Dan White, Kevin Boylan, Jenn Williamson and Anna Garloch of ACDI/VOCA for Green Powered Technology, LLC under the USAID Energy Opportunities for Agriculture and Food Security Project (Contract Number AID-OAA-C-17-00112).

2
Guide
1 www.marketlinks.org/good-practice-center/value-chain-wiki/value-chain-mapping-process
Below we provide a 6-step process to integrate energy opportunities into value chain and market system analysis and program design. Each step also includes an example case study in blue text boxes to show that step in action. In summary:
STEP 1: Map the Value Chain System and Target Pathways for Change
It is standard practice for market development practitioners to develop value chain system maps (especially as part of broader system analyses) that include key functions and actors such as: input supply, production activities, assembly/processing, packaging, transport, retail, export (if applicable), end consumer; along with support services (such as finance). Good visualizations and analysis reflect various market segments, overlay trade volumes, and consider how relationship/power dynamics, growth trends, and major enabling environment factors within these chain segments affect how the value chain is structured. In particular, look out for how these factors combine to create new market op-portunities. For basics on how to map a value chain system, and use this to identify the best opportuni-ties to target in order to affect positive change, see USAID’s guidance on the Value Chain Wiki1.
STEP 1 IN ACTION:
You are part of a team of value chain specialists starting up implementation on a new activity in Kenya with the goal of strengthening horticulture value chains to reduce poverty for those engaged in agriculture. You and your team map the horti-culture system and its value chains (e.g. tomato, avocado, etc), identifying market opportunities as you go. Through interviews with stakeholders and reviewing trends in market data, you have identified growing and unmet demand for processed toma-to products, including products requiring dried tomatoes, as well as strong relationships between this opportunity and its impact on both your target beneficiaries and positive market behaviors in the horticulture system overall.
You and your team decide to dig deeper into the potential for processed tomatoes as a pathway to strengthen the horticulture market
Note! This guide assumes the primary entry point into a market system is an agricultural value chain (e.g. dairy, tomatoes, maize); this guide helps you understand where energy is a constraint within that value chain, explore a range of options to address it, and calculate feasibility for investment in those options. However, development practitioners may also consider treating energy as a value chain system in and of itself, in addition to focusing on a specific agricultural system. Steps 1 and 2 will give you insight as to how significant energy is to transform-ing inclusive growth, and therefore help you prioritize how much resources you spend in treating energy as an interrelated system and set of value chains itself. Doing this would involve a different, more robust set of considerations than are focused on in this guide.
STEP 1: Map the Value Chain System & Target Pathways for Change
STEP 2: Identify Energy Constraints to Opportunities
STEP 3: Determine Energy Demand by Partners
STEP 4: Determine Energy Supply: On and Off-Grid Energy Availability and Cost
STEP 5: Model Returns (Feasibility) to Investment
STEP 6: Design Systemic, Sustainable Interventions to Catalyze on Opportunities

3
STEP 2: Overlay an Energy Lens: Identify Energy Constraints to Opportunities
2 https://poweringag.org3 www.fao.org/3/a-i5125e.pdf
Using the value chain system map and identified opportunities from Step 1 as a filter, identify where energy is used for the market opportunity-related points along the chain. This will involve a mix of consultations with teams involved in the VC system mapping as well as incorporating energy-specific questions into field surveys normally part of value chain analysis or other market research (see text box below for survey tips). For example, the adja-cent figure, from Powering Agriculture’s2 ‘Opportu-nities for Agri-Food Chains to Become Energy Smart’3, shows basic energy uses in the vegetables supply chain from the farm through retail. As shown, it is helpful to disaggregate energy needs by their use: heating, cooling, electricity, or moving materials from one place to another. This will enable you to match opportunities to technologies in steps 3—5 below. At this phase it is not critical that you have ex-tremely detailed documentation on energy uses; you will only need those for points in the value chain where you will drill down for further cost estima-tion, as outlined in steps 3—5 below.
As part of this process, ask the firm or farm what their energy access is like—do they get power from the grid, or their own off-grid source, like solar PV or a diesel generator? What energy challenges do they have? For further examples, see text box below on field survey tips.
FIELD SURVEY TIPS: Identifying Energy Use by Value Chain Actors or Functions
Identifying energy use types and intensity can easily be integrated into value chain analysis or any other interview opportunity with beneficiaries. This information will provide inputs into Step 3.
• When visiting farms or firms, ask them to walk youthrough their process from when materials/inputs arriveto when they leave. Note steps that:
• Require machinery or other electrical devices (e.g. ham-mer mills or other processing equipment). Ask if you canrecord the make and model number of the equipment. Most manufacturers will have energy load profiles fortheir equipment available on request.
• Require product temperature changes (e.g. cooling orheating points for milk). Make sure to note total volumesthat go through these processes, and total temperaturechanges (entry temperature, target chill/heating tempera-ture, etc.).
• Require the pumping or conveyance of water, air or othermedium.
• Involve substantial manual labor. Try to note the mechan-ical energy needs—i.e. what is the labor doing? Movingbags of rice from truck beds to a warehouse? Sortingvegetables by grade? Packaging yogurt? Record the num-ber of people needed in these roles, and the distances/volumes or other magnitudes of work required.
• Note the products, processes, or technologies currentlyused for these steps.
• Ask firms or individuals to share recent electrical bills. Some firms will know their recurring energy costs off thetop of their head, but it is always better to get a copy of abill or other summary in writing.
• Ask about any energy challenges: Do they have blackouts?Do their energy bills seem to fluctuate wildly, even whentheir energy use remains stable? Any challenges relatedto access or price will be helpful in evaluating alternativeenergy options later.

4
Apply a gender and social inclusion lens:
4 AgriProFocus Gender in Value Chains Toolkit (2014) has a section on gender sensitive value chain analysis. https://agriprofocus.com/toolkit. USAID’s Pro-moting Equitable Opportunities for Women in Agricultural Value Chain Analysis (2009) also includes guidance on gender sensitive value chain analysis. https://pdf.usaid.gov/pdf_docs/pnaeb644.pdf
5 Available at www.agrilinks.org/post/clean-energy-productive-use-post-harvest-value-chains-integrated-literature-review-field-work
Consider and document gender and social gaps or differences in use, access, and agency.4 Due to gaps in access to resources and lower levels of deci-sion-making power, women, youth, and other mem-bers of marginalized groups tend to have: less access to technologies (including energy opportunities); less ability to upgrade to these technologies; greater reluctance to invest; and greater risks when they do. It is important to assess not just financial gaps (i.e., who pays, who can pay, and how much they can pay), but also gender and social norms, including which group has access to energy, what kind of energy, and how this is different. For one example of such risks, such as marginalization in enterprise as access to energy increases, see the Senegal Case Study in the
E4AS Integrated Literature Review and Field Work Report5.
Of course there can also be gender-specific positive benefits, which are equally important to understand and incorporate into design; for example, installing solar powered coolers on motor bikes expands access to cold storage to more smallholder milk producers who cannot travel to a central collection point, often a unique constraint for women.
STEP 2 IN ACTION:
Now that you have identified processed tomatoes as a key market opportunity, drill down further to get a clear sense of the range of energy uses, constraints, and opportunities to upgrade processes with renew-able energy (RE) or energy efficient (EE) options.
One of the firms you interviewed during value chain mapping in step 1, The Tomato Fresh Company, men-tioned that they are interested in developing a new product line, and have asked for help to determine its feasibility. Tomato Fresh currently creates ketchup and canned tomato preserves, but have reached capacity for their cold storage and processing line. They are interested in developing a new product line for dried tomatoes as a way to convert more tomatoes when market prices are low into a shelf stable, low volume product.
You work with Tomato Fresh to develop a list of all of their energy needs, from when tomatoes arrive at their facility through packaging and sale, which you list out as below. They also note that they have frequent blackouts, 2-3 times a week, and feel like their electric-ity is expensive.
Here is the list of energy uses at each phase in their production process—where relevant, you note where
women or men complete tasks, as this will be helpful later on in anticipating potential gendered effects of changes to production processes:
Produce intake:
• Manual labor to move produce from trucks to stor-age sheds (mostly done by men)
Storage:
• Electricity for cold storage coolers• Washing, grading, sorting:• Electric to run spray pumps and produce conveyor
belts• Manual labor to grade and sort produce (mostly
completed by women)• Processing:• Electric for tomato juice extractors, pulpers, pre-
heaters, conveyance pumps• Heating for pasteurization• Packaging:• Electric for conveyor belts• Manual labor for final packaging and labeling (mostly
completed by women)
You are most interested in the heat energy require-ments for the tomato drying process, which you will delve deeper into under step 3.

5
Step 3: Determine total energy demand for value chain partners
6 A load profile is a table, chart, or graph that plots energy use over time—this is the industry standard method for capturing total energy requirements over a given period of time.
Based on the energy constraints identified in Step 2, plot energy use over time by developing a rough load profile6 for the processes or technologies in the value chain that are targeted for improvement.
To do this, first determine the total energy demand of the new equipment or process. Energy require-ments should be available from the manufacturer for
known/existing technology or machinery in watts per hour (or convertible equivalent). This can be used to determine total energy demand by multiply-ing by the operational duration needed to reach a set production goal.
STEP 3 IN ACTION:
Tomato Fresh has a production target to dry 400MT of tomatoes each year in 10MT batches. They have found a commercial dehydrator model with a 100kg per hour capacity, and will purchase 10 of them to give them a total production capacity of 1MT per hour.
However, as you determined during step 2, one of the key issues holding back Tomato Fresh’s compet-itiveness are issues with electricity. They experience blackouts 2-3 times per week, and note that energy is one of their largest monthly expenses. A food safety specialist noted that this may be a problem for their new drying operation: If the power were to go out while tomatoes were insufficiently dry, they could spoil in the dryers, leading to wasted product at best, or poisoned customers at worst. Tomato Fresh wants your help to figure out two things:
1. What will their energy costs be for their new dried tomato processing line using the current, on-grid power supply?
2. What would it cost to replace their on-grid energy with an off-grid solar photovoltaic array?
To answer these questions, you need to first estimate their energy demand in this Step 3, then determine the cost with their current supply versus a renewable alternative. (You’ll do this in Step 4).
Calculating energy demand first requires multiplying the kilowatts used by one machine per MT processed x number of machines. Tomato Fresh has sent photos of the electrical information plate on the dehydrator. The red box to the right gives you the total wattage—this is the total energy draw for the machine. They bought 10 machines—so multiply by 10—which gives 12,000 watts, or 12 kilowatts (KW) of total power needed per MT processed.
Recall that Tomato Fresh is planning to process 400MT in year, and want to process 10MT per 10 hour work-ing day, so have decided to buy ten 100kg/hr units. Tomato Fresh will be running the units for 10 hour days, 40 days a year to process the full 400MT. So total KWH needed per year are 12KW X 10 hrs/day X 40 days/year = 4,800 KWH per year. This is their energy demand.
Model G2369240V ~50Hz
1,200W
6
Step 4: Determine availability and costs of energy supply options
7 https://energydata.info/dataset/africa-electricity-transmission-and-distribution-2017
8 http://africagrid.energydata.info9 www.geni.org/globalenergy/library/national_energy_grid/index.shtml10 Kilowatt hours are the standard unit used to measure energy consumption. Guidance on determining KWH rates for specific equipment and processes are laid out under
step 3 below.
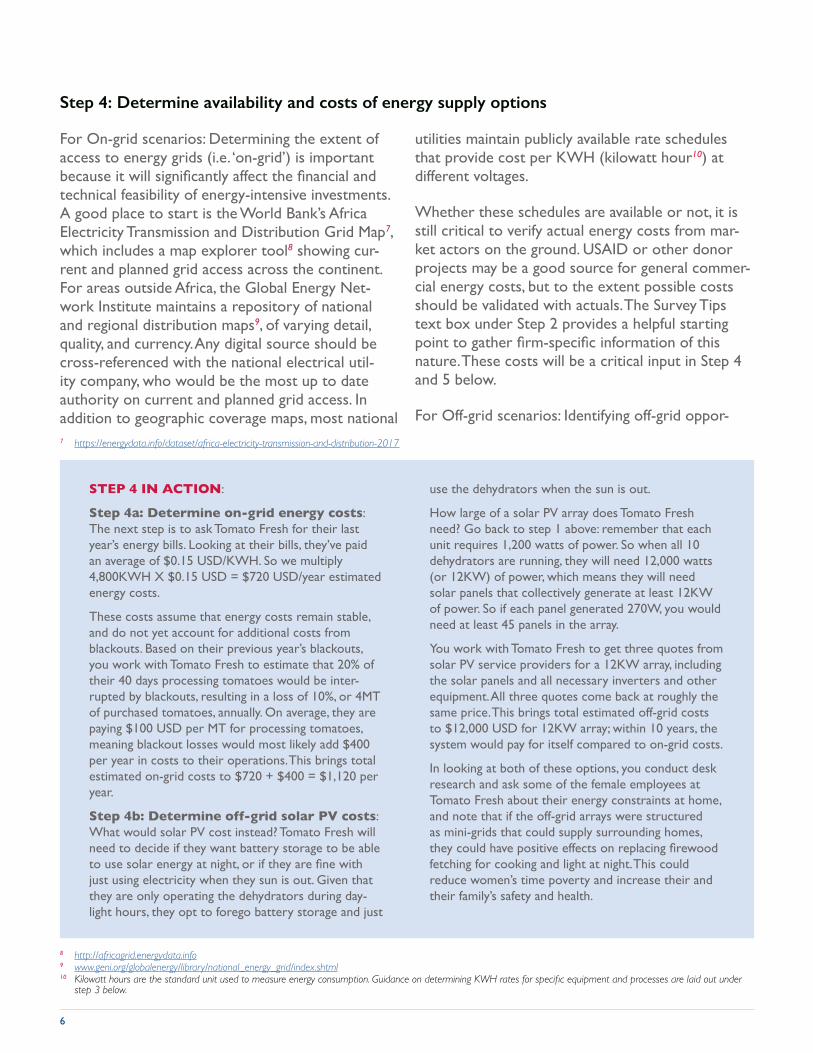
For On-grid scenarios: Determining the extent of access to energy grids (i.e. ‘on-grid’) is important because it will significantly affect the financial and technical feasibility of energy-intensive investments. A good place to start is the World Bank’s Africa Electricity Transmission and Distribution Grid Map7, which includes a map explorer tool8 showing cur-rent and planned grid access across the continent. For areas outside Africa, the Global Energy Net-work Institute maintains a repository of national and regional distribution maps9, of varying detail, quality, and currency. Any digital source should be cross-referenced with the national electrical util-ity company, who would be the most up to date authority on current and planned grid access. In addition to geographic coverage maps, most national
utilities maintain publicly available rate schedules that provide cost per KWH (kilowatt hour10) at different voltages.
Whether these schedules are available or not, it is still critical to verify actual energy costs from mar-ket actors on the ground. USAID or other donor projects may be a good source for general commer-cial energy costs, but to the extent possible costs should be validated with actuals. The Survey Tips text box under Step 2 provides a helpful starting point to gather firm-specific information of this nature. These costs will be a critical input in Step 4 and 5 below.
For Off-grid scenarios: Identifying off-grid oppor-
STEP 4 IN ACTION:
Step 4a: Determine on-grid energy costs: The next step is to ask Tomato Fresh for their last year’s energy bills. Looking at their bills, they’ve paid an average of $0.15 USD/KWH. So we multiply 4,800KWH X $0.15 USD = $720 USD/year estimated energy costs.
These costs assume that energy costs remain stable, and do not yet account for additional costs from blackouts. Based on their previous year’s blackouts, you work with Tomato Fresh to estimate that 20% of their 40 days processing tomatoes would be inter-rupted by blackouts, resulting in a loss of 10%, or 4MT of purchased tomatoes, annually. On average, they are paying $100 USD per MT for processing tomatoes, meaning blackout losses would most likely add $400 per year in costs to their operations. This brings total estimated on-grid costs to $720 + $400 = $1,120 per year.
Step 4b: Determine off-grid solar PV costs: What would solar PV cost instead? Tomato Fresh will need to decide if they want battery storage to be able to use solar energy at night, or if they are fine with just using electricity when they sun is out. Given that they are only operating the dehydrators during day-light hours, they opt to forego battery storage and just
use the dehydrators when the sun is out.
How large of a solar PV array does Tomato Fresh need? Go back to step 1 above: remember that each unit requires 1,200 watts of power. So when all 10 dehydrators are running, they will need 12,000 watts (or 12KW) of power, which means they will need solar panels that collectively generate at least 12KW of power. So if each panel generated 270W, you would need at least 45 panels in the array.
You work with Tomato Fresh to get three quotes from solar PV service providers for a 12KW array, including the solar panels and all necessary inverters and other equipment. All three quotes come back at roughly the same price. This brings total estimated off-grid costs to $12,000 USD for 12KW array; within 10 years, the system would pay for itself compared to on-grid costs.
In looking at both of these options, you conduct desk research and ask some of the female employees at Tomato Fresh about their energy constraints at home, and note that if the off-grid arrays were structured as mini-grids that could supply surrounding homes, they could have positive effects on replacing firewood fetching for cooking and light at night. This could reduce women’s time poverty and increase their and their family’s safety and health.

7
tunities requires a more traditional sector mapping exercise. The best place to start is to identify local off-grid technology distributors and design-build firms. Other sources of potential innovative tech-nologies include:
USAID’s Powering Agriculture Program, which main-tains a database11 of emerging renewable energy tech-nology providers with focus on USAID target markets.
The International Renewable Energy Agency (IRE-NA) maintains a public GIS database12 showing wind and solar feasibility in different localities around the world.
In most of the world, diesel generators are the most common and default off-grid energy source. Gener-ator and fuel costs can be determined by speaking with local service providers in the target region/districts.
Once the cost per KWH for energy is determined, it can be multiplied by the total energy demand (Step 3). This will be needed to model returns in Step 5 and ultimately determine the feasibility of the upgrading technology.
11 https://poweringag.org/innovators12 www.irena.org/documentdownloads/publications/ga_booklet_web.pdf
Apply a gender and social inclusion lens:
Consider whether on-grid or off-grid opportunities are more easily or less easily accessible to women, youth, and members of marginalized groups. In ad-dition to comparing costs and determining whether these groups have the resources and information necessary to connect to these energy sources, assess whether there are other factors that may promote or deter access. This may include:
• Does the local service provider assess and include women or marginalized groups when advertising or educating about their services?
• Do they have local representatives that are female?
• Are there policies or procedures that make accessing these services challenging for women, youth, or marginalized groups (i.e., Can women sign a legal contract in this context? Is collateral required? Is a bank account required? Are there any legal or policy requirements, such as tax incentives or requirements, that they need to be informed about)?

8
Step 5: Model Returns (Feasibility) of Energy Investment
13 For example, see step by step guides at www.mathsisfun.com/money/internal-rate-return.html, www.accountingtools.com/articles/how-to-calculate-the-internal-rate-of-return.html, or www.investopedia.com/ask/answers/022615/what-formula-calculating-internal-rate-return-irr-excel.asp.
14 For one take on systems thinking within a development context, see USAID’s “5Rs Framework in the Program Cycle” at https://usaidlearninglab.org/sites/default/files/re-source/files/5rs_techncial_note_ver_2_1_final.pdf. Oxfam also has a helpful video accessible at www.youtube.com/watch?v=WfyWgp95kgA
Combine the load profile information from Step 3 with the cost data collected in Step 4 to model the financial feasibility of the proposed technology upgrade opportunity. In doing this, it is necessary to identify gaps between energy demand needs and energy supply.
There are many metrics to do this, but one of the most common is internal rate of return (IRR13), a way to evaluate different uses of cash at any given point of time against one another. There are many good resources that can walk you through how to calculate IRR so we will not go through them here, but instead will simply give the final values.
Note: For the purpose of identifying opportunities to integrate renewable energy technologies into a market systems or value chain strengthening pro-grams, it is sufficient to use the information resourc-es and process laid out in this brief. However, we stress the importance of consulting with qualified electrical engineers and other specialists as relevant before advising firms on or subsidizing investment in actual equipment purchases. There are many nuances, safety, financial, and other technical consid-erations too varied to cover in this brief that should be addressed as part of any energy investment.
Step 6: Design Systemic, Sustainable Interventions to Catalyze on Identified Opportunities
This brief provides a practical roadmap to under-stand energy constraints, costs, and opportunities for partners involved in core agricultural value chain functions (e.g. processors, producers, transporters). This is an important piece of information for de-sign. However, to act on this information and design appropriate interventions requires a much broader view of the agriculture and energy systems. Many good programmatic investments fail to have any sus-tainable, scalable impact because the interventions were in the wrong place to leverage broad-based impact; root causes weren’t considered and target-
ed and thus only short term ‘band-aids’ get applied; or critical relationships and partnerships fall apart once the project ended. With this in mind, this step provides some basic tips to consider as programs move into the intervention design phase, within the broader context of a value chain development or market systems approach.
The most foundational best practice involves un-derstanding the broader system of actors, forces, norms, and networks that shape incentives, behav-iors, and patterns14. Systems thinking helps us ‘zoom
STEP 5 IN ACTION:
We can simply add up how long it would take for Tomato Fresh to recoup its solar PV investment through electrical bill savings and avoiding wasted produce, which would be about 10.7 years. Since the solar PV system comes with a 20 year warranty and expected lifespan of 30 years, this would make it a very good investment.
However, the different cost structures of renewable energy sources and legacy technologies require a different set of calculations. For solar PV or wind, all of your costs are up front, whereas for grid power, or diesel-powered generators costs are spread out over time.
Using the internal rate of return (IRR) referenced above, we can evaluate the best use of cash for Tomato Fresh: are the electrical savings worth it, or should they invest it in another line of business?
If we take the above numbers, we would assume that in Year 1 Tomato Fresh spends $12,000 on a solar PV system, which would save them $1,120 a year over the next 20 years (while the system is ful-ly under warranty). The IRR in this scenario would be 6.52%. In other words, this would be equivalent to investing the $12,000 in the stock market, and getting an average return of 6.52% per year for 20 years straight; all in all a good investment.

9
out’ to understand other systems and forces that influence the core outcome we want to see (e.g. increased uptake of energy solution X by small firms in region Y of value chain Z), and then ‘zoom in’ to more deeply understand the root causes that drive key behaviors and changes we are targeting (not only by individual firms or consumers but also at the system-wide level).
In designing a programmatic response to identified energy opportunities, we must consider the broader ecosystem and other dynamics that influence behav-iors, rate of uptake, and more. For example, the best way to address these constraints and support these opportunities will not necessarily involve direct en-gagement with the core value chain firm (i.e. the end user of a technology). The best ‘bang for buck’—or the leverage point for truly sustainable, system-wide impact—may actually lie in support to a totally sepa-rate group of actors, or in tackling an underlying norm that shapes behavior across the system.
For example, to help firms increase uptake of solar PV technologies for small scale dairy cool chain, our programmatic response may actually focus on strengthening industry groups to pressure the government to reduce tariffs or subsidies on the materials that go into engineering and manufactur-ing that product locally. Or, we may support energy firms to conduct more tailored market research so they can better design, price, market and service their products to rural clients. Or, we may informally partner with various media platforms to amplify the voices of businesses who have successfully adopted solar PV, encouraging others to copy or crowd in a behavior. Or, we may work with financial institutions or impact investors to co-create and pilot tailored, bundled alternative financing options that reduces the upfront cost consumers pay and therefore nur-tures more widespread uptake. Our response will depend on the insights from our systems analysis, which helps us uncover the real reasons (or ‘root causes’) driving negative or positive outcomes, and the best leverage points for change.
Here are some additional considerations which draw from market systems approach best practice:
• identify opportunities to co-create and co-own interventions with partners
• embrace a phased test—reflect—adapt timeline that allows models and assumptions to evolve, and for partners to take increasing ownership and investment roles
• in co-creating, be cognizant of embracing diverse perspectives through diverse representation—see the Gender & Social Inclusion box below)
• be sensitive to distorting market incentives and price thresholds through large program subsidies or ‘brokering’, at both the firm and customer levels;
• use grant funds in more systemic ways—don’t just jump to giving a series of in-kind grants to individ-ual businesses so they can upgrade a technology. Consider other types of market facilitation sup-port: funding market research or willingness to pay surveys, sponsoring pay for performance compe-titions/contests with product suppliers, financers, and/or service providers; supporting vocational development programs to address local service provision skills and service models; buying-down risk of investment or innovation by financers by using grant funds as first-loss capita/guarantee funds; etc
• build networks amongst key industry actors and foster meaningful, repeated collaboration
• as noted under Step 1, consider treating energy as a value chain system in and of itself, given its relative importance to overall market system transformation and inclusive growth
• don’t work in isolation! There are many collabora-tors and partners innovating in the energy-agricul-ture nexus space.

10
STEP 6 IN ACTION:
Recall in Step 5 you identified that a solar PV array would be a good addition to Tomato Fresh’s new tomato drying operation. At this point, many projects would simply give Tomato Fresh a grant to go out and purchase a solar array. And while this would be good for Tomato Fresh, and potentially good for their neighbors, its impact probably ends there. What will the next firm do?
So, you and your team take a different approach. You aim to ask ‘why’ a bit more, pushing deeper, to help uncover the underlying reasons at a systems level—not just the level of 2-3 actors—behind why uptake of solar PV is so low, even though the payback period makes business sense. You go out and identify the ma-jor solar equipment suppliers in Kenya and interview them about their business constraints. They highlight that even though selling to a customer like Tomato Fresh clearly makes good business sense, Tomato Fresh doesn’t have the cash up front to pay for the solar pv system, and there are limited financing options out there for these sized firms. You interview financing firms to understand the reasons for this and discover there is limited information flows between tomato processors, clean and renewable energy providers, and investors—as well as poor incentives for finance staff to innovate. You combine this with the social and gender analyses on your project, which highlighted that women tended to congregate in smaller, more cash-strapped businesses and don’t always have title to land and assets needed for collateral—further complicating access to large upfront cash investments, although energy-fueled enterprise growth would disproportion-ately benefit the primarily female workforce.
You and your team then sit down and, together with investors, processors, and service provider—co-design some pilot interventions, which you’ll refine and scale up as you discover what works and how committed partners are. This includes:
1. Identifying a set of impact investors interested in renewable energy opportunities, working with them and the solar PV suppliers to bundle Tomato Fresh’s venture with several similar upgrade opportunities.
The larger investment amount of these opportunities combined makes the investment worth it for investors, and solves Tomato Fresh’s financing challenge. Through media and business networks, you support dissemina-tion of learning from this model, building competitive pressure, perceptions of risk, and capacity for others to adapt it.
2. Facilitating investor visits to build direct relation-ships with solar PVs and end user processors, identify-ing a champion to host a feedback session
3. Support a joint advocacy effort by the horticulture industry and renewable energy providers to pressure the government to reduce tariffs or subsidies on the materials that go into engineering and manufacturing of solar PV technologies—to reduce the end custom-er cost.
4. Provide a small subsidy to a vocational school to train equal numbers of women and men in solar PV installation and maintenance, with training delivered by solar PV firms for quality control
5. Conduct a business feasibility assessment that helps set a modest pricing structure for neighboring homes to access the solar PV after working hours at Tomato Fresh and the other firms, decreasing women’s time burdens for boiling water and enhancing social capital through enabling easier communication with family elsewhere.
As a result of these new business lines, the solar PV business develops a new dedicated sales and installa-tion unit targeting small-scale agribusinesses—a new business line for them—and the increased information flows and pilot investments attract interest from other investors and entrepreneurs, amplifying the messages of the advocacy efforts. As a result of this approach, you and your team have successfully leveraged donor resources to in efficient, less distortionary ways that address deeper constraints at the systems level to sus-tainably expand access to energy, support the horti-culture sector, and increase employment and decrease time poverty for women. This approach enhances the likelihood that development outcomes are broad-based and sustained.

11
Apply a gender and social inclusion lens:
15 www.agrilinks.org/sites/default/files/resource/files/WEAI%20Intervention_Guide_Final%208.2016.pdf; and www.marketlinks.org/library/womens-economic-empower-ment-briefs-suite-0
• Ensure women’s and youth participation in design-ing the activity—consultation and participation in identifying what is needed, what are the challenges and what are the potential solutions are the keys to designing inclusive and sustainable interven-tions.
• Facilitate women’s and youth engagement in solu-tions that are attractive to market actors—sup-port market research, sensitize market actors on the value of this approach and build their capac-ity, help them understand the business case for engaging women and youth in order to promote sustainable interventions.
• Assess gender and social factors such as time burdens, control over income, leadership, access to resources, and decision-making in value chain and energy assessments. These dynamics can both inhibit participation and benefit from energy upgrades so this information should factor into intervention selection and design. Meanwhile, increased access to and participation in energy upgrade activities can have positive or negative impact on these empowerment factors, so it is important to monitor, evaluation and respond to changes during implementation.
• Engage men and community leaders to understand the negative impacts of gender inequality and to promote female engagement and benefit from energy upgrades.
• Be informed—three of many resources include15:
− Intervention Guide for the Women’s Empower-ment in Agriculture Index (WEAI): Practitioners’ Guide to Selecting and Designing WEAI Inter-ventions
− Women’s Economic Empowerment Briefs on Engaging Men and Women’s Engagement Beyond Production
See the Step 6 in Action box for the Tomato Fresh case application. For more reflections on pro-grammatic and policy implications of increasing CE and RE opportunities, see the full E4Ag integrated literature review and field work report, available at www.agrilinks.org/post/clean-energy-produc-tive-use-post-harvest-value-chains-integrated-litera-ture-review-field-work .