energy metabolism of chickens - agrifutures australia · pdf fileenergy metabolism of chickens...
TRANSCRIPT

Energy Metabolism of Chickens
Physiological Limitations
A report for the Rural Industries Research and Development Corporation by R.J. Hughes
February 2003 RIRDC Publication No 02/151 RIRDC Project No SAR-13A

ii
© 2003 Rural Industries Research and Development Corporation. All rights reserved. ISBN 0642 58550 4 ISSN 1440-6845 Energy Metabolism in Chickens: Physiological Limitations Publication No. 02/151 Project No. SAR-13A The views expressed and the conclusions reached in this publication are those of the author and not necessarily those of persons consulted. RIRDC shall not be responsible in any way whatsoever to any person who relies in whole or in part on the contents of this report. This publication is copyright. However, RIRDC encourages wide dissemination of its research, providing the Corporation is clearly acknowledged. For any other enquiries concerning reproduction, contact the Publications Manager on phone 02 6272 3186. Researcher Contact Details R.J. Hughes SARDI – PPPI Nutrition Research Laboratory Roseworthy Campus, University of Adelaide Roseworthy SA 5371, Australia Phone: 08 8303 7788 Fax: 08 8303 7977 Email: [email protected]
In submitting this report, the researcher has agreed to RIRDC publishing this material in its edited form. RIRDC Contact Details Rural Industries Research and Development Corporation Level 1, AMA House 42 Macquarie Street BARTON ACT 2600 PO Box 4776 KINGSTON ACT 2604 Phone: 02 6272 4539 Fax: 02 6272 5877 Email: [email protected] Website: http://www.rirdc.gov.au Published in February 2003 Printed on environmentally friendly paper by Canprint

iii
Foreword A diet for broiler chickens that provides all of the nutrients essential for maintenance and growth of the flock as a whole may also have other chemical and physical properties that are detrimental to the processes of ingestion, digestion, absorption, transport and utilisation of nutrients. This project examined the general hypothesis that feed-related and bird-related factors interact to produce a variable effect on the digestion of energy by individual chickens within the flock with the consequence that flock variability is increased. A total of 12 experiments were conducted during this study. Breath tests were developed as non-invasive indicators of digestive function and gut microbial activity and were used in conjunction with conventional methods for measuring energy digestion in commercial breeds of chickens. The results indicated that gut function and bacterial colonisation of the gut are important determinants of digestive function, and that both are partially dependent on the sex of the chicken. One third of the variation in apparent metabolisable energy (AME) was associated with physical features of the lining of the small intestine. The breed and sex of chicken significantly affected villus length in the jejunum and ileum, respectively. The structure of the lining of the small intestine differed between male chickens depending on breed, but there were no differences observed in female chickens. Hence there is good reason to believe that gut morphology is a limiting feature of digestive function, but that other aspects are collectively more important, given that two thirds of the variation in AME remained unexplained. The influence of gut microflora on the digestive function of the chicken was partially dependent on the composition of the diet. Inherent characteristics of grains induced different responses in male and female chickens. It may be economically worthwhile to feed and manage commercial broilers in single sex flocks rather than jointly as is the current situation, in order to reduce flock variability. This project was funded from industry revenue which is matched by funds provided by the Federal Government. This report, a new addition to RIRDC’s diverse range of over 900 research publications, forms part of our Chicken Meat R&D program, which aims to support increased sustainability and profitability in the chicken meat industry by focusing research and development on those areas that will enable the industry to become more efficient and globally competitive and that will assist in the development of good industry and product images. Most of our publications are available for viewing, downloading or purchasing online through our website:
• downloads at www.rirdc.gov.au/reports/Index.htm • purchases at www.rirdc.gov.au/eshop
Simon Hearn Managing Director Rural Industries Research and Development Corporation

iv
Acknowledgements This report includes a number of experiments that I conducted as part of my PhD studies at the Pig and Poultry Production Institute on the Roseworthy Campus of Adelaide University I gratefully acknowledge the financial support provided by RIRDC Chicken Meat Program for Project SAR13A, GRDC Premium Grains for Livestock Program, and SARDI for my salary. My PhD studies would not have been possible without the inspiration, support and guidance provided by my supervisors Dr David Tivey (Adelaide University), Dr Ross Butler (Women’s and Children’s Hospital) and A/Prof Mingan Choct (University of New England), and the generosity of my SARDI managers Mr Rob Lewis, Dr Don Plowman and Dr Andy Pointon who gave me this opportunity. I thank Dr Dean Revell and A/Prof John Brooker for additional help and guidance provided during my candidature. I am most grateful to the many people from SARDI, PPPI, WCH, AU and UNE who helped with the experimental work. Special thanks go to my SARDI colleagues Derek Schultz, Evelyn Daniels, and Christine Adley for their dedication and enthusiasm. My thanks go also to Natasha Penno (Animal Science, Adelaide University) and Marie Kozulic (Roseworthy Library, Adelaide University) for providing specialised technical support. To my close friends, A/Prof Mingan Choct and Dr Robert van Barneveld, and to the other members of the technical committee of the GRDC Premium Grains for Livestock Program, thanks for providing stimulating discussion, encouragement, advice and ideas during the course of these studies. Finally, this work is dedicated to Dr R.B. Cumming (formerly of UNE, Armidale, New South Wales, Australia) who inspired me to ponder the differences between individual birds within the flock, and to explore the consequences of that variation through basic and applied experiments with chickens.
Animal ethics issues Approvals for this study were granted by the Animal Ethics Committees of the Department of Primary Industries South Australia (applications 38/00 and 31/98) and Adelaide University (applications W/38/00 and W/55/98). All procedures complied with "Australian code of practice for the care and use of animals for scientific purposes" (Australian Agricultural Council, 1997) and "Australian model code of practice for the welfare of animals. Domestic Poultry" (Standing Committee on Agriculture and Resource Management, 1995).

v
Abbreviations AME apparent metabolisable energy
ANOVA analysis of variance
AU Adelaide University
CE competitive exclusion
CSIRO Commonwealth Scientific and Industrial Research Organisation
DE digestible energy
DM dry matter
DMD dry matter digestibility
FCR feed conversion ratio
GE gross energy
GLM general linear model
GRDC Grains Research and Development Corporation
LSMEANS least squares means
MOS mannan oligosacharide
NSP non-starch polysaccharide
OCTT oro-caecal transit time for digesta
PPPI Pig and Poultry Production Institute
RIRDC Rural Industries Research and Development Corporation
SARDI South Australian Research & Development Institute
SAS Statistical Analysis System®
UNE University of New England
WCH Women’s and Children’s Hospital
WTTT whole tract transit time for digesta
vi
Contents Foreword ...................................................................................................................iii Acknowledgements..................................................................................................iv Animal ethics issues ................................................................................................iv Abbreviations.............................................................................................................v List of tables ...........................................................................................................viii List of figures..........................................................................................................viii Executive Summary...................................................................................................x 1. Introduction .........................................................................................................1 2. Objectives ............................................................................................................1 3. Background .........................................................................................................2
3.1 Feed-related factors influencing energy metabolism..............................................................2 3.2 Bird-related factors influencing energy metabolism ..............................................................2 3.3 Concept of digestive capacity of the individual chicken........................................................6
4. Variation in the digestion of energy ..................................................................7 4.1 Introduction ............................................................................................................................7 4.2 Experimental diet ...................................................................................................................9 4.3 AME procedures ....................................................................................................................9 4.4 Statistical analysis ..................................................................................................................9 4.5 Results ....................................................................................................................................9 4.6 Discussion ............................................................................................................................11 4.7 Conclusions ..........................................................................................................................12
5. Influence of gut structure on digestive function ............................................13 5.1 Introduction ..........................................................................................................................13 5.2 Birds, housing and management ..........................................................................................13 5.3 Results ..................................................................................................................................15 5.4 Discussion ............................................................................................................................17 5.5 Conclusions ..........................................................................................................................17
6. Development of breath tests as non-invasive indicators of digestive function ..............................................................................................................19 6.1 Introduction ..........................................................................................................................19 6.2 Face masks for collecting breath samples from chickens.....................................................20 6.3 Helmets for collecting breath samples from chickens..........................................................20 6.4 Development of breath tests for assessing digestive function of chickens...........................27 6.5 Conclusions ..........................................................................................................................29
7. Rate of passage of digesta influences digestion of energy ..........................30 7.1 Introduction ..........................................................................................................................30 7.2 Relationship between oro-caecal transit time and whole tract transit time (Experiment 1) .30 7.3 Relationship between whole tract transit time and AME value of wheat (Experiment 2) ...31 7.4 Discussion ............................................................................................................................34 7.5 Conclusions ..........................................................................................................................34

vii
8. Influence of gut microflora and sex on digestive function............................35 8.1 Introduction ..........................................................................................................................35 8.2 Glycanase activity of gut microflora in chickens given wheat and barley
diets (Experiment 1) .............................................................................................................35 8.3 Metabolic activity of gut microflora of chickens given a diet based on low AME
wheat (Experiments 2 and 3)................................................................................................39 8.4 Effects of age of chicken and exogenous enzymes on AME and metabolic activity of gut
microflora of chickens given wheat and barley diets (Experiment 4) ..................................42 8.5 Effects of antibiotic in the feed on the site of digestion of carbohydrate (Experiment 5)...47
9. General discussion ...........................................................................................53 10. Implications of the findings..............................................................................56 11. Recommendations ............................................................................................57 References ...............................................................................................................59

viii
List of tables Table 1. Composition of the experimental diet ................................................................................. 9 Table 2. Summary of analysis of variance of results....................................................................... 11 Table 3. Respiratory characteristics of poultry (Freeman, 1984) .................................................... 21 Table 4. Partial pressure of carbon dioxide in air spaces and blood
(McLelland and Molony, 1983)........................................................................................ 21 Table 5. Summary of analysis of variance of results....................................................................... 33 Table 6. Composition of the basal diet ............................................................................................ 36 Table 7. Composition of the experimental basal diets..................................................................... 48 Table 8. Reduced model analysis of variance of data ..................................................................... 49 Table 9. Description of variables in summary of analysis of variance in Table 8........................... 49
List of figures Figure 1. A schematic representation to demonstrate that the digestive capacity of the chicken is
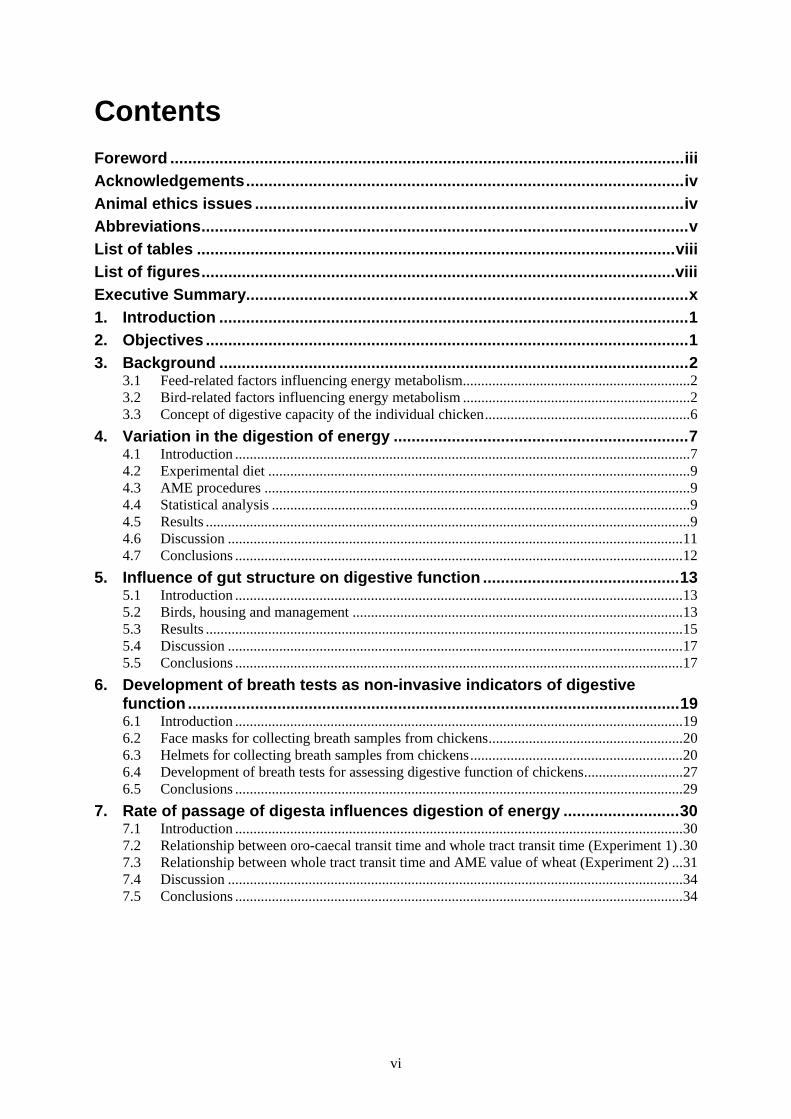
an integration of bird-related and feed-related factors. Adapted from Hughes (2001)...... 6 Figure 2. AME (MJ/kg dry matter) values for a single sample of wheat determined with 40
broiler chickens housed individually in metabolism cages. Each vertical bar in the figure represents an AME value obtained for a single chicken. Adapted from Hughes and Choct (1997). ............................................................................................................... 8
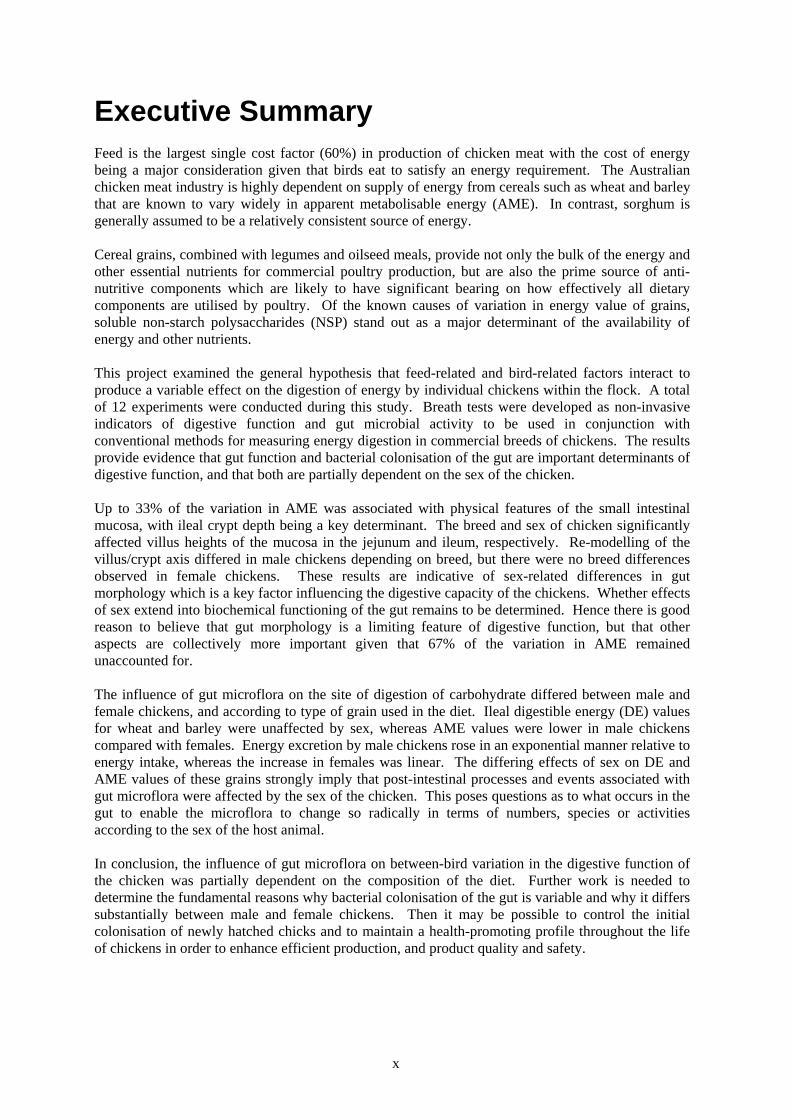
Figure 3. AME (MJ/kg dry matter) values for a single sample of barley determined with broiler chickens housed in groups of six in 96 metabolism cages. Each vertical bar in the figure represents an AME value obtained from a pen of six chickens. Adapted from Hughes et al. (2001a). ........................................................................................................ 8
Figure 4. Variability in apparent metabolisable energy (AME) of a wheat diet given to male and female chickens of two commercial breeds. ..................................................................... 10
Figure 5. Effects of breed and sex of chicken on apparent metabolisable energy (AME) of the diet. Means ± SE with common letters are not significantly different P>0.05)................ 10
Figure 6. Relationship between energy excreted and gross energy intake for male and female chickens ............................................................................................................................ 11
Figure 7. The digestive tract of the chicken. Adapted from Sturkie (1976) .................................... 14 Figure 8. Effects of cleanliness of the rearing environment on villus height (µm) and crypt depth
(µm) in duodenum, jejunum and ileum (means ± SE; n=12 chickens)............................. 18 Figure 9. Effects of breed and sex of chicken on villus height and crypt depth in intestinal
mucosa (means ± SD). Jejunal villus means with a common letter are not significantly different (P>0.05). ............................................................................................................ 18
Figure 10. Upper respiratory tract of the chicken. Adapted from Nickels et al. (1977). .................. 20 Figure 11. Lungs and air sacs in the chicken (Fedde, 1976) .............................................................. 21 Figure 12. Enrichment of 13CO2 in breath following ingestion of a gelatine capsule containing
3.6-3.8 mg 13C-octanoic acid dissolved in vegetable oil. Each curve represents results from an individual chicken. .............................................................................................. 23
Figure 13. Enrichment of 13CO2 in breath following ingestion of cooked corn kernel naturally enriched with 13C-starch. Each curve represents results from an individual chicken. ..... 24
Figure 14. Breath hydrogen concentration (in ppm) in chickens fed a commercial diet ad libitum, and then two days later from the same chickens (fasted overnight) immediately before and 3 h after dosing with lactulose (130 mg in 5mL water) ............................................. 26
Figure 15. Breath hydrogen concentration (in ppm) in male chickens fasted for 3 h prior to test dosing with lactulose (130 mg in 5mL water) in Experiment 1........................................ 28

ix
Figure 16. Breath hydrogen concentration (in ppm) in male chickens fasted for 3 h prior to test dosing with lactulose (130 mg in 5mL water) In Experiment 1. The vertical arrows indicate whole tract transit time for ferric oxide marker. ................................................. 32
Figure 17. Breath hydrogen concentration (in ppm) in female chickens fasted for 3 h prior to test dosing with lactulose (130 mg in 5mL water) in Experiment 1. The vertical arrows indicate whole tract transit time for ferric oxide marker. ................................................. 32
Figure 18. Relationship between AME of wheat and whole tract transit time................................... 34 Figure 19. Association between AME (MJ/kg DM) of diet and increase in viscosity as digesta
pass through the caeca ...................................................................................................... 38 Figure 20. Concentrations of acetic acid and butyric acid in fresh excreta. Data are sorted by
acetic acid concentration within each combination of grain type and sex of chicken. Each bar represents results from one chicken................................................................... 38
Figure 21. Hydrogen concentration in breath samples taken on day 6 from chickens given a low AME wheat diet for seven days. Each bar in the figure is the result for one chicken in Experiment 1..................................................................................................................... 40
Figure 22. Change in methane concentration in breath from day 0 to day 6 in chickens given a low AME wheat diet for seven days. Each bar in the figure is the result for one chicken in Experiment 1. .................................................................................................. 40
Figure 23. Relationship between feed conversion ration (FCR) and hydrogen concentration in samples taken on day 6 from chickens given a low AME wheat diet for seven days. Each point in the figure is the result for one chicken. ...................................................... 41
Figure 24. Effects of age of chicken, grain type and addition of enzyme to the diet on feed intake. 44 Figure 25. Effects of age of chicken, grain type and addition of enzyme to the diet on weight
gain. .................................................................................................................................. 44 Figure 26. Effects of age of chicken, grain type and addition of enzyme to the diet on feed
conversion......................................................................................................................... 44 Figure 27. Effects of age of chicken, grain type and addition of enzyme to the diet on AME of the
diet. ................................................................................................................................... 46 Figure 28. Effects of age of chicken, grain type and addition of enzyme to the diet on hydrogen
concentration in breath on day 6....................................................................................... 46 Figure 29. Effects of age of chicken, grain type and addition of enzyme to the diet on methane
concentration in breath on day 6....................................................................................... 46 Figure 30. Ileal DE (MJ/kg dry matter) and faecal AME (MJ/kg dry matter) values for cereal
grains fed to broiler chickens for seven days commencing at 22 days of age. From Hughes et al. (2001a). ...................................................................................................... 47
Figure 31. Effects of grain and antibiotic on AME and ileal DE expressed as a proportion of gross energy (GE) (means ± standard deviations). ........................................................... 50
Figure 32. Effects of grain and antibiotic on live weight gain (means ± standard deviations). ......... 50 Figure 33. Effects of grain and antibiotic on feed conversion ratio (means ± standard deviations). . 50 Figure 34. Effects of grain and antibiotic on change in hydrogen concentration in breath from day
0 to day 6 of the 7-day metabolism study (means ± standard deviations). ....................... 52 Figure 35. Effects of grain and sex of chicken feed conversion ratio (means ± standard
deviations)......................................................................................................................... 52 Figure 36. Effects of grain and sex of chicken on AME and ileal DE (means ± standard
deviations)......................................................................................................................... 52
x
Executive Summary Feed is the largest single cost factor (60%) in production of chicken meat with the cost of energy being a major consideration given that birds eat to satisfy an energy requirement. The Australian chicken meat industry is highly dependent on supply of energy from cereals such as wheat and barley that are known to vary widely in apparent metabolisable energy (AME). In contrast, sorghum is generally assumed to be a relatively consistent source of energy. Cereal grains, combined with legumes and oilseed meals, provide not only the bulk of the energy and other essential nutrients for commercial poultry production, but are also the prime source of anti-nutritive components which are likely to have significant bearing on how effectively all dietary components are utilised by poultry. Of the known causes of variation in energy value of grains, soluble non-starch polysaccharides (NSP) stand out as a major determinant of the availability of energy and other nutrients. This project examined the general hypothesis that feed-related and bird-related factors interact to produce a variable effect on the digestion of energy by individual chickens within the flock. A total of 12 experiments were conducted during this study. Breath tests were developed as non-invasive indicators of digestive function and gut microbial activity to be used in conjunction with conventional methods for measuring energy digestion in commercial breeds of chickens. The results provide evidence that gut function and bacterial colonisation of the gut are important determinants of digestive function, and that both are partially dependent on the sex of the chicken. Up to 33% of the variation in AME was associated with physical features of the small intestinal mucosa, with ileal crypt depth being a key determinant. The breed and sex of chicken significantly affected villus heights of the mucosa in the jejunum and ileum, respectively. Re-modelling of the villus/crypt axis differed in male chickens depending on breed, but there were no breed differences observed in female chickens. These results are indicative of sex-related differences in gut morphology which is a key factor influencing the digestive capacity of the chickens. Whether effects of sex extend into biochemical functioning of the gut remains to be determined. Hence there is good reason to believe that gut morphology is a limiting feature of digestive function, but that other aspects are collectively more important given that 67% of the variation in AME remained unaccounted for. The influence of gut microflora on the site of digestion of carbohydrate differed between male and female chickens, and according to type of grain used in the diet. Ileal digestible energy (DE) values for wheat and barley were unaffected by sex, whereas AME values were lower in male chickens compared with females. Energy excretion by male chickens rose in an exponential manner relative to energy intake, whereas the increase in females was linear. The differing effects of sex on DE and AME values of these grains strongly imply that post-intestinal processes and events associated with gut microflora were affected by the sex of the chicken. This poses questions as to what occurs in the gut to enable the microflora to change so radically in terms of numbers, species or activities according to the sex of the host animal. In conclusion, the influence of gut microflora on between-bird variation in the digestive function of the chicken was partially dependent on the composition of the diet. Further work is needed to determine the fundamental reasons why bacterial colonisation of the gut is variable and why it differs substantially between male and female chickens. Then it may be possible to control the initial colonisation of newly hatched chicks and to maintain a health-promoting profile throughout the life of chickens in order to enhance efficient production, and product quality and safety.
1
1. Introduction Feed is the largest single cost factor (60%) in production of chicken meat with the cost of energy being a major consideration given that birds eat to satisfy an energy requirement. The Australian chicken meat industry is highly dependent on supply of energy from cereals such as wheat, triticale and barley that are known to vary widely in AME. In contrast, sorghum is generally assumed to be a relatively consistent source of energy. Cereal grains, combined with legumes and oilseed meals, provide not only the bulk of the energy and other essential nutrients for commercial poultry production, but are also the prime source of anti-nutritive components which are likely to have a significant bearing on how effectively all dietary components are utilised by poultry. Of the known causes of variation in energy value of grains, soluble NSP stands out as a major determinant of the availability of energy and other nutrients for poultry (Hughes and Choct, 1999). On a global scale, feed enzymes have proven to be a very effective tool for not only increasing the energy values of grains for poultry but also for improving the uniformity of growth and feed efficiency of broiler flocks. Despite the huge success of feed enzyme technology, questions remain about the specific modes of actions of enzymes (Smits and Annison, 1996; Williams, 1997), and why enzymes can reduce but do not eliminate variation in energy values for grains (Bedford, 1996; Kocher et al., 1997). In this report, reasons for and the magnitude of variation in energy metabolism by individual chickens are discussed in relation to physical and chemical properties of diets.
2. Objectives
• Development of non-invasive methods for measuring gut function in chickens.
• Definition of the role of gut structure and function in limiting energy metabolism.
• Identification of the mechanism(s) by which physical and chemical properties of feed promote sub-optimal digestion of energy.
• Development of a clearer understanding of the physiological limitations of digestion which will under-pin opportunities for development of specific strategies to reduce the cost of production of lean chicken meat.

2
3. Background The Australian chicken meat industry is highly dependent on supply of energy from wheat and barley that are known to vary widely in nutritive value (Hughes and Choct, 1999). For example, surveys by Mollah et al. (1983) and Rogel et al. (1987) indicated a range of 10 to16 MJ/kg DM in wheat. More recently, Hughes and Choct (1997) reported apparent metabolisable energy (AME) values ranging from 9 to 15 MJ/kg DM for a single sample of wheat containing a high level of soluble arabinoxylan when given to 40 individually caged broilers hatched and reared under identical conditions. Hughes et al. (2001a) observed AME values ranging from 12.3 to 13.5 MJ/kg DM for a single sample of barley fed to 96 single-sex groups of six broilers. Hence, it can be concluded that the “low-ME” phenomenon in wheat and barley is a multi-faceted problem involving highly variable responses by individual chickens to anti-nutritive factors in grains. The following sections describe the various feed-related and bird-related factors affecting energy metabolism in chickens and develops the hypothesis that these factors interact to influence the digestive capacity of the individual chicken in a variable manner. 3.1 Feed-related factors influencing energy metabolism In a recent review, Hughes and Choct (1999) concluded that grains such as wheat and barley, combined with legumes and oilseed meals, provide not only the bulk of essential nutrients for commercial poultry production and reproduction, but are also the prime source of anti-nutritive components which are likely to have a significant bearing on how effectively all dietary components are utilised by poultry. Sources of variation in the physical and chemical characteristics of grains used in poultry diets include variety, seasonal effects and growth sites, crop treatment and grain fumigants, and post-harvest storage conditions and period of storage. Variation in the available energy and protein content of grains can be attributed to a wide range of anti-nutritive factors such as non-starch polysaccharides (NSP), tannins, alkyl resorcinols, protease inhibitors, α-amylase inhibitors, alkaloids, phytohaemagglutinins, saponins, and lathyrogens. The relative importance of such factors will also differ according to the type of grain in question. Of the known anti-nutritive components of grains, soluble NSP stands out as a major determinant of the availability of energy and other nutrients for poultry (Choct, 1999; Hughes and Choct, 1999; Hughes et al., 2001b). One of the modes of action of soluble NSP is to form a viscous gel in the gut which in turn affects the rates of digestion and absorption of nutrients. Also, rates of gastric emptying and transit time of digesta are thought to be influenced by increased digesta viscosity, thereby providing hind-gut microflora with an opportunity to colonise the small intestine to the detriment of the host in terms of diminished use of nutrients and reduced ability to ward off ingested pathogens (Choct, 1999). 3.2 Bird-related factors influencing energy metabolism Tivey and Butler (1999) described the digestive capacity of an animal as the integration of residence time of digesta, enzyme secretion, absorptive mechanisms, microbial activity, surface area, and barrier function. The importance of each of these determinants of digestion and assimilation of nutrients is discussed in relation to chickens in the following sections. 3.2.1 Gut structure Net utilisation of energy by the chicken will be influenced by requirements for growth and maintenance of the gut (Choct, 1999), and by its overall gut surface area. The latter will be determined by gross morphological features such as length and cross-sectional area of the duodenal,

3
jejunal and ileal segments, and by finer morphological features such as villus height and surface area of the epithelium in each of those segments (Jin et al., 1998; Iji, 1999). 3.2.2 Rate of passage of digesta The relative opportunities for contact between ingested food, digestive enzymes and bile salts, and the time available for contact between digested particles and absorptive surfaces are likely to influence energy uptake by the chicken. Gastric emptying rate of solids and liquids, and transit time in the small intestine are known to influence the nutritional status of human subjects (Tivey and Butler, 1999). Growth performance and nutrient absorption are influenced by rate of passage of digesta in chickens (van der Klis and van Voorst, 1993; Uni et al., 1995) and rats (Gohl and Gohl, 1977). Clench and Mathias (1992) observed a reversal of the flow of digesta in response to fasting in adult cockerels. They described the phenomenon as a rhythmic oscillating complex that could be an adaptive mechanism for the return of undigested food in the caeca to the small intestine during a period of inadequate food intake, in birds only. Godwin and Russell (1997) noted that the reverse peristalsis was highly effective in fasted birds but appeared to have little effect in the fed animal. The reversal of flow of digesta could result in the entry of uric acid, other potentially toxic waste products and harmful micro-organisms into the small intestine. The reflux of uric acid could have a detrimental effect on gut epithelial function under these circumstances. Langar et al. (1993) reported a reduction in villus height in the small intestine with an associated decline in nutrient absorption in poultry given diets containing 1 to 1.75% uric acid. On the other hand, reflux of volatile fatty acids with bacteriostatic action (Corrier et al., 1990) may be beneficial in blocking microbial proliferation in the small intestine. Furthermore, Choct and Kocher (2000) reported that the caecal flora of the broiler chicken produce some xylanase and β-glucanase, which may be refluxed into the small intestine where these enzymes could cause variable gut viscosity. The nutritional implications of bacterial enzyme activity in the gut warrant investigation. 3.2.3 Digestion and absorption Capacity to digest and absorb carbohydrates develops during incubation, providing the newly hatched chick with a relatively mature system for utilisation of starch, the main carbohydrate in the diet of poultry, according to Moran (1985). On the other hand, the capacity to utilise fat can take 10 days or so to develop in broiler chickens due to a lag in lipase secretion by the pancreas (Jin et al., 1998). Uni et al. (1995) reported differences in ability to digest starch in the period 0 to 4 days post-hatch between two strains of broiler chicken. However, by day 14, starch digestion was greater than 90% in both strains. These changes are consistent with those noted by Vieira and Moran (1999) who concluded that the full capacity of the small intestine to digest and absorb nutrients took up to two weeks to develop. They attributed this in part to the initial orientation of enterocytes towards absorption of maternal antibody from remnants of the yolk sac. In contrast, Uni et al. (1996) previously concluded that nutrient supply from yolk was less crucial than a lack of feed in the first 36 hours post-hatching, which subsequently delayed normal intestinal development for several days. Uni et al. (1998) studied changes in the structure and function of the duodenum, jejunum and ileum in broilers from hatch to 14 days of age. They noted that development of the small intestine was rapid from day 2 after hatch but that the rates of development differed between the segments of the small intestine. Villus volume in the duodenum reached a plateau after 7 days but continued to increase in the jejunum and ileum. Indices of tissue activity, ribosomal capacity, and cell size decreased with age but at differing rates in these intestinal sections. Sucrase-maltase activity was low in the duodenum at hatch, increased to a maximum at day 2, then decreased. Enzyme activity in the jejunum and ileum was at its highest at hatch. Density of the enterocytes changed little from 0 to 14 days post-hatch.

4
As with the physical changes in gut structure observed in the two-week post-hatch period, major biochemical changes in the development of the gut also seem to have stabilised within a relatively short time after hatch. Nevertheless, it seems plausible that the subtle differences in gut structure and function between individual chickens may be sufficient to affect the uptake of energy in the variable manner. The effect of the sex of the individual animal on its functional capacity to digest and absorb nutrients has received little attention by researchers. Indeed, much of the knowledge about nutrient utilisation by commercial broiler chickens has been gained by study of males only. Yet there are tantalising hints in the scientific literature that males and females differ in unexpected ways of a fundamental nature. Sex effects in chickens were noted by Guirguis (1975; 1976) in metabolism of energy in oats but not in wheat, and energy in tallow and fish meal. More recent examples include the transient post-weaning differences observed in piglets by Dunshea et al. (1998), and the conclusion of Chicurel (2000) that “studies in several organisms have shown that gender and environment affect the behaviour of genes”. 3.2.4 Barrier function Like other epithelial surfaces of the body, one of the functions of the gut mucosa is to resist penetration from harmful organisms and toxic substances. Lillehoj (1997) described the immune response by gut-associated lymphoid tissues to microbial pathogens as a complex interaction of soluble factors, leucocytes, epithelial cells and other physiological mechanisms. Klasing (1996) discussed the homeorhetic responses that take place when a chicken is faced with a bacterial challenge. These include decreased appetite, the partitioning of dietary nutrients away from growth and skeletal muscle accretion in favour of metabolic processes that support the immune response and disease resistance, and alteration of nutrient requirements during and after the infectious challenge. During the challenge, the requirements for amino acids and most trace minerals are decreased whereas these are increased later to repair damaged tissue and to accelerate growth. Klasing (1996) recommended an increase in dietary carbohydrate to compensate for the decrease in appetite in order to assist the recovery and lift the performance of immune-stressed animals. 3.2.5 Microflora It is likely that dietary factors that lead to increased activity of gut microflora will depress energy utilisation (Choct et al., 1996; Choct, 1999), apparent protein digestibility (Smits et al., 1997), and availability of amino acids (Steenfeldt et al., 1995). Inclusion of an antibiotic in the diet of pigs can result in a reduction in the weight and the morphology of the small intestine (Parker and Armstrong, 1987). These changes were represented by elongated villi and a higher villus: crypt ratio, which was indicative of a lower rate of enterocyte-cell migration from the crypt to the villus. It was suggested that reduced microbial activity in digesta or microbial activity at the level of the brush border would reduce both the damage to enterocytes and the need for cell renewal in the gut. Williams (1995) has pointed out that gut microflora can significantly influence metabolism of gut tissue which in turn will affect absorption of amino acids. Protein supplements with poor digestibility will undergo more microbial fermentation than highly digestible material. For example, differences between ileal and faecal digestibilities in intact compared with caecectomised cockerels were minor for cereals and oilseeds, but were large for some animal meals. Nevertheless, relatively small differences between ileal and faecal digestibilities in grains observed by Williams (1995) could become significantly more important when comparing differences between different samples of grain.
5
Smits (1996) provided unequivocal evidence that the mechanism by which soluble NSP depresses fat digestibility in chickens hinges on the reduction of bile salts following bacterial proliferation or overgrowth of the small intestinal contents. He also demonstrated that reduction in fat digestibility was particularly severe in the case of animal fats that contained a high proportion of saturated long chain fatty acids. It seems likely that withdrawal of other essential nutrients by microbial proliferation would immediately compromise the growth performance and feed efficiency of the animal, and ultimately leads to health problems through general inflammation of the gut and invasion of tissue by pathogenic organisms.
The concept of competitive exclusion (CE), as proposed originally by Nurmi and Rantala (1973), involves the establishment and maintenance of a normal population of gut microflora to afford protection from colonisation by organisms pathogenic to chickens (e.g., Salmonella spp.) or to humans (e.g., Campylobacter spp.), or both. The topic of CE has been reviewed recently (Cox and Chung, 2000). The original concept of CE can be widened to include non-living entities such as fructo- and mannan-oligosaccharides. Iji and Tivey (1998) recently reviewed the role of oligosaccharides in the regulation of gut microflora. They suggested that the regulatory mechanisms involving oligosaccharides could include (a) provision of alternative binding sites for pathogens, thus preventing invasion of the gut tissue, (b) direct stimulation of the blood immune system after crossing the intestinal mucosa barrier, (c) preservation of the systemic immune system by blocking translocation of pathogens, (d) fermentation of carbohydrates to produce short-chain volatile fatty acids with bacteriostatic properties, (e) direct stimulation of the villus-crypt axis, and (f) induction of intestinal microflora to produce glycolytic enzymes.

6
3.3 Concept of digestive capacity of the individual chicken It is evident from the preceding sections that feed- and bird-related factors interact in a complex manner. The digestive capacity of an individual chicken can be conceptualised as follows:-
Figure 1. A schematic representation to demonstrate that the digestive capacity of the chicken is an integration of bird-related and feed-related factors. Adapted from Hughes (2001).
The particular example shown in the figure above represents the anti-nutritive effects of soluble NSP (feed-related factor) acting on all other factors. It also shows a cascading effect of metabolic activity of microflora on three other bird-related factors, as well as an effect of changed rate of passage (due to increased viscosity associated with soluble NSP) on microbial proliferation in the small intestine.
Digestive capacity of an individual chicken
Digestion and absorption
Gut structure
Passage of digesta
Barrier function
Microflora
Physico-chemical
Anti-nutritive
Nutritive
Extra-nutritive
Feed -related factorsBi r
d -r e
l at e
d f a
c to r
s

7
4. Variation in the digestion of energy 4.1 Introduction Hughes and Choct (1997) demonstrated extremes of AME in a single experiment involving only one sample of wheat containing a high level of soluble arabinoxylan given to broilers hatched and reared under identical conditions (Figure 2). They concluded that the “low-ME” wheat phenomenon was not entirely dependent on the physico-chemical nature of wheat but it was a multi-faceted problem closely linked with the individuality of digestive physiology of broiler chickens. More recently, Hughes et al. (2001a) showed a relatively wide range of AME values for a single barley sample (Figure 2). Ravindran et al. (2001) and Wiseman et al. (2000) have reported variation in AME values for wheat from New Zealand and Britain, respectively. Individual birds have demonstrated quite different responses in energy metabolism to the same samples of grains. The experimental diets used in the studies shown in Figure 2 and Figure 3 were comprised of grain, casein, limestone, dicalcium phosphate, salt, and a mineral and vitamin supplement. Carbohydrate was the main source of energy in these diets, with fat making a relatively small contribution. Hence, the large variation observed in AME was probably associated with a similarly large variation between individual birds in starch digestion and absorption of sugars, rather than with reduced lipid absorption due to removal of bile salts from digesta by microflora in the small intestine as described by Smits (1996). Other explanations for the anti-nutritive effect of soluble NSP on AME include inhibition of digestion of starch, lipid and protein in the foregut (Choct and Annison, 1992). The mechanism of action of soluble NSP is thought to involve increased viscosity of digesta which limits contact between digestive enzymes and substrates, and for contact between nutrients and absorption sites on the intestinal mucosa (Annison, 1993; Bedford and Morgan, 1996; Smits et al., 1997). The following experiment tested the hypotheses that (a) individual birds would respond in a highly variable manner to the increase in digesta viscosity induced by the soluble NSP, and (b) the responses to soluble NSP would differ according to breed and sex of chicken. 4.1.1 Birds, housing and management Cobb (Breed 1) and Ross (Breed 2) broiler chickens were obtained from the Bartter Steggles hatchery, Cavan SA 5094 and the Baiada hatchery, Willaston SA 5118, respectively, on Thursday 4 November 1999. Chickens were raised from hatch to 19 days of age in four floor pens in a controlled temperature room. Male and female chickens of each breed were reared separately. All birds were fed commercial starter crumbles (Ridley Agriproducts, diet code #503540, Steg 600 starter). On Monday 22 November, chickens were transferred in pairs to 48 single-bird metabolism cages located in a controlled-temperature room kept at 25-27oC initially, and given commercial starter crumbles (Ridley Agriproducts, diet code #503540, Steg 600 starter) for 2-3 days while they adapted to the cages. On Thursday 25 November, one bird was removed from each of the first 24 cages. The remaining 24 chickens remaining were weighed. The following day, the same procedures were applied to chickens in the second set of 24 cages. All chickens were given free access to the experimental diet described in Table 1, and to water throughout the experiment. Chickens were weighed again after seven days.

8
Figure 2. AME (MJ/kg dry matter) values for a single sample of wheat determined with 40 broiler chickens housed individually in metabolism cages. Each vertical bar in the figure represents an AME value obtained for a single chicken. Adapted from Hughes and Choct (1997).
Figure 3. AME (MJ/kg dry matter) values for a single sample of barley determined with broiler chickens housed in groups of six in 96 metabolism cages. Each vertical bar in the figure represents an AME value obtained from a pen of six chickens. Adapted from Hughes et al. (2001a).
6
8
10
12
14
16
1 3 5 7 9 11 13 15 17 19 21 23 25 27 29 31 33 35 37 39
Replications
AM
E (M
J/kg
dry
mat
ter)
Mean ± standard deviation = 12.14 ± 1.59 (n = 40)
11.5
12.0
12.5
13.0
13.5
14.0
1 4 7 10 13 16 19 22 25 28 31 34 37 40 43 46 49 52 55 58 61 64 67 70 73 76 79 82 85 88 91 94
Replications
AM
E (M
J/kg
dry
mat
ter)
Mean ± standard deviation = 12.92 ± 0.26 (n = 96)

9
4.2 Experimental diet The composition of the experimental diet is shown in Table 1. Dr Mingan Choct (UNE) supplied the wheat. Prior AME testing of a sub-sample of this wheat at PPPI indicated that it was a low-AME sample at that time. The wheat was kept in cold storage between AME testing and its use in this experiment. Table 1. Composition of the experimental diet
Ingredient g/kg Wheat (low-ME ex UNE) 700.0 Meat and bone meal 76.0 Soybean meal 170.0 Sunflower oil 40.0 Sodium chloride 2.5 L-lysine HCl 2.5 DL-methionine 3.0 Vitamin and mineral premix with millrun diluent 5.0 Choline chloride (60%) 0.8 Hydrocarbon marker (hexatriacontane C36H74) 0.2
4.3 AME procedures The AME value of the wheat-based experimental diet was determined in a conventional energy balance study involving measurements of total feed intake and total excreta output and subsequent measurement of gross energy (GE) values of feed and excreta by isoperibol bomb calorimetry (Parr Instrument Company). The first three days enabled the chickens to adapt to the feed. Feed intake was measured during this period. During the following four days feed intake was measured and all excreta were collected and dried daily. The moisture content of excreta collected on day 5 of the metabolism study was measured. 4.4 Statistical analysis Base SAS® software (SAS Institute) was used in this study. Analysis of variance (by GLM procedure) will determine the effects of breed and sex, and the breed by sex interaction. Duncan's Multiple Range Test were used to separate means of main effects (block, breed and sex) and T-tests (by LSMEANS procedure) were used to separate least-squares means for the breed by sex interaction if significant effects (P<0.05) are evident in analysis of variance. 4.5 Results Results of statistical analysis are summarised in Table 2. Breed had no effect on any measurement, nor was there any breed by diet interaction. Females were superior to males in AME (14.63 vs 14.04 MJ/kg dry matter; Figure 5) and digestibility of dry matter (0.71 vs 0.64 g/g). AME values for individual male and female chickens of both breeds are shown in Figure 4. Males ate more feed (113.3 vs 98.0 g/bird/day) and gained more weight (418 vs 377 g/bird) than females.
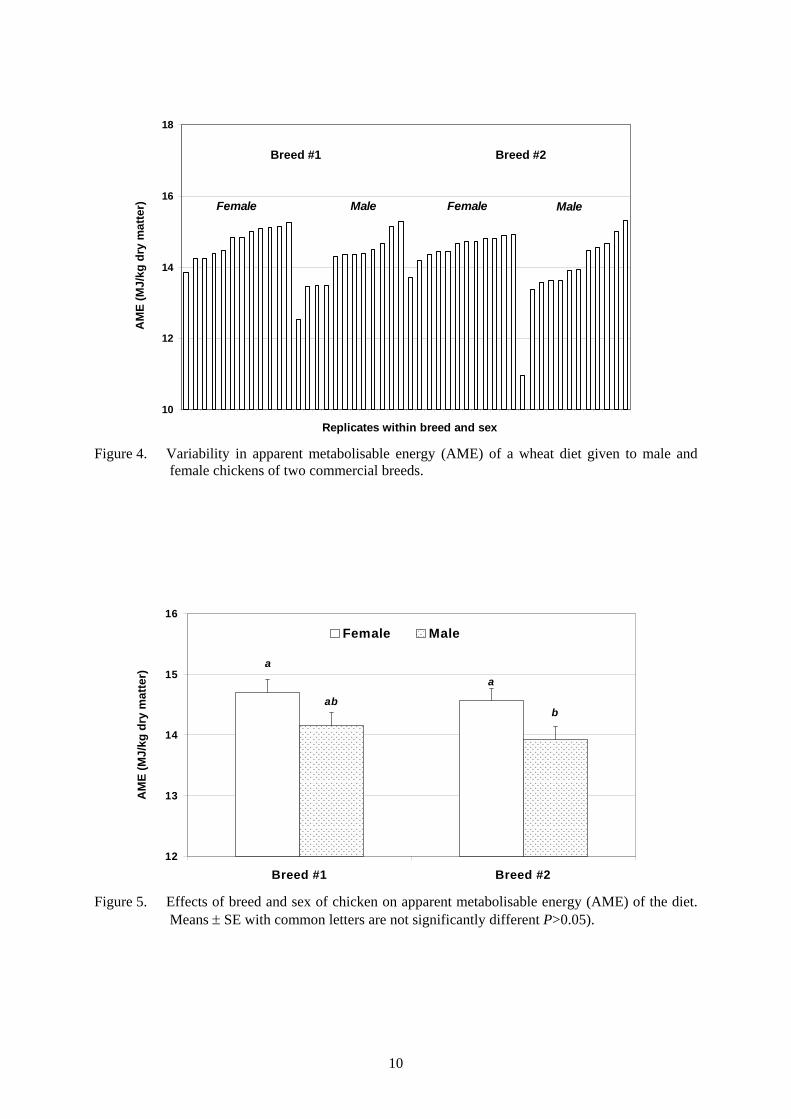
10
10
12
14
16
18
1 2 3 4 5 6 7 8 9 10 11 12 13 14 15 16 17 18 19 20 21 22 23 24 25 26 27 28 29 30 31 32 33 34 35 36 37 38 39 40 41 42 43 44 45 46 47 48
Replicates within breed and sex
AM
E (M
J/kg
dry
mat
ter)
Breed #1 Breed #2
Female Male Female Male
Figure 4. Variability in apparent metabolisable energy (AME) of a wheat diet given to male and
female chickens of two commercial breeds.
Figure 5. Effects of breed and sex of chicken on apparent metabolisable energy (AME) of the diet. Means ± SE with common letters are not significantly different P>0.05).
aa
bab
12
13
14
15
16
Breed #1 Breed #2
AM
E (M
J/kg
dry
mat
ter)
Female Male

11
Table 2. Summary of analysis of variance of results
Variable Units Description Mean Breed (B) Sex (S) B*S FBD g/bird/day Feed intake 105.7 *** BWGAIN g/bird Growth 398 * GAINRATE g/g Adjusted growth rate 1 0.444 FCR g feed: g gain Feed conversion 1.880 ME2_DIET MJ/kg AME of diet DM 14.34 ** DIG_DM g/g Dry matter digestibility 0.696 * VISCO cP Ileal viscosity 17.2 VISLN Log e (cP) Ileal viscosity 2 2.64
* P<0.05, ** P<0.01, *** P<0.0.001; cells in table with no symbols have P>0.05
1 GAINRATE = BWGAIN × 1000 ÷ BWSTART 2 Log e transformed to normalise the distribution of data
4.6 Discussion The lack of effects of sex and breed on viscosity of ileal digesta suggests that variation in AME values was not directly related to the gelling properties of NSP but that other factors were responsible. This possibility was explored further by examination of the relationships between energy excreted and gross energy intake for males and females, as described by King (2000). Variation in energy excreted increased greatly with increased feed intake and the relationships differed between males and females (Figure 6), but was unaffected by breed. The increase in energy excretion by males follows a significant exponential function with R2=0.60 (P<0.001), compared with a linear increase in females with R2=0.73 (P<0.001).
Figure 6. Relationship between energy excreted and gross energy intake for male and female chickens
0
1
2
3
4
5
5 6 7 8 9 10 11
Gross energy intake (MJ per bird)
Ener
gy e
xcre
ted
(MJ
per b
ird)
FEMALE: Energy out = 0.184 + 0.217 * energy intakeP < 0.001, R 2 = 0.73, n = 24
Male
Female
MALE: Energy out = 0.402 * e 0.203 * energy intake
P < 0.001, R 2 = 0.60, n = 24

12
4.7 Conclusions The physiological significance of these observations is worthy of further investigation. The results are consistent with the existence of a fundamental difference between males and females in overall energy metabolism, irrespective of breed of the chicken. Sex effects may be associated with differences in energy costs to repair and maintain the gut, endogenous losses, or responses to inflammatory effects of microflora. Possible reasons for differences between sexes are explored further in subsequent sections of this report.

13
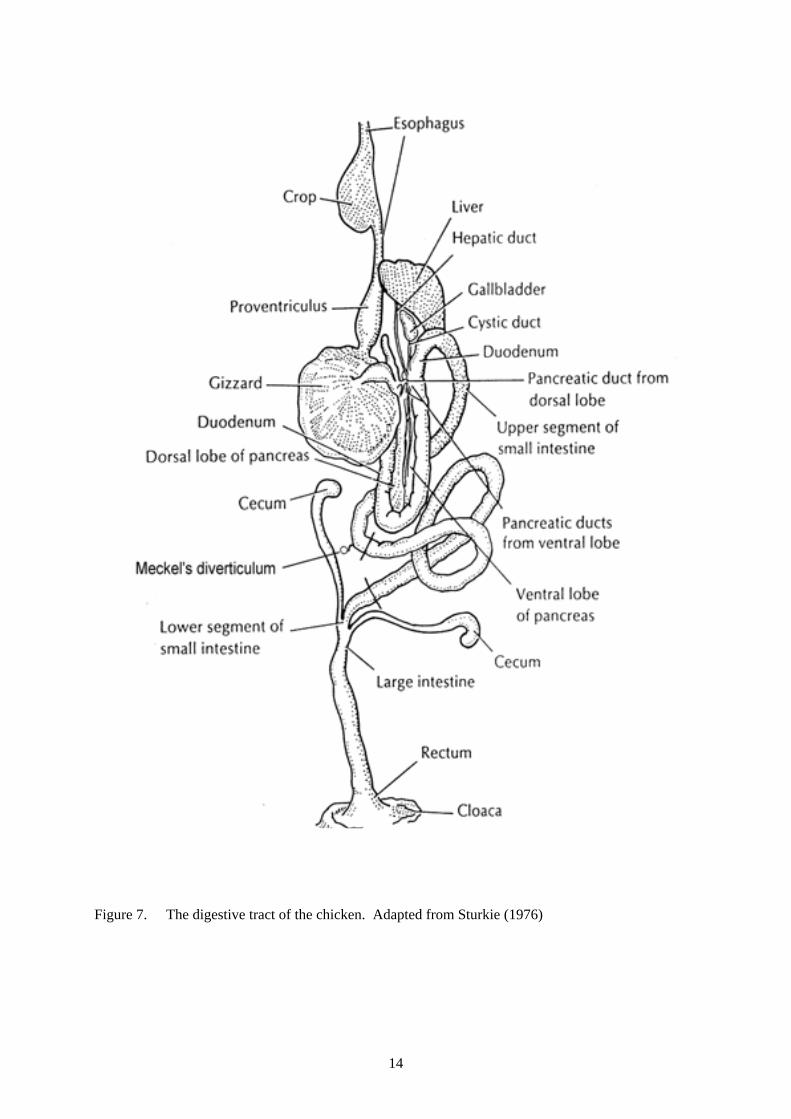
5. Influence of gut structure on digestive function 5.1 Introduction Newly hatched chickens undergo a rapid transition from utilisation of lipids in yolk to usage of carbohydrate from cereal grains as the major source of energy for maintenance and growth. Sklan (2001) described the first few days after hatching as a period of intense morphological and functional development of the small intestine, particularly of the duodenum compared with the jejunum and ileum (see Figure 7 for a schematic diagram of the gastrointestinal tract of the chicken). Iji (1998; 1999) discussed the effects of NSP in cereal grains on the changes in intestinal structure and function in relation to body mass of rapidly growing broiler chickens. Iji (1998) concluded that uneven growth and productivity among individual chickens could be traced to variable development and functionality of the small intestine. Chickens reared from hatch in the presence of older chickens exhibited wide variation in body mass without showing any signs of clinical disease (R.J. Hughes and D. Schultz, unpublished data). Variation among male chickens was usually much higher than in female chickens. Furthermore, the depression in expected body mass for age of both sexes was related to the number of prior batches of chickens reared in the shed without thorough cleaning between batches. Iji and Tivey (1998) concluded that chickens exposed to disease agents in this manner could benefit from addition of synthetic oligosaccharides to the diet, particularly mannan oligosaccharides (MOS) which are thought to act through their capacity to bind to pathogens and to stimulate the immune system. Three experiments were conducted to examine the relationships between energy metabolism and gut structure of broiler chickens. An objective in the first two experiments was to uncover the extent of variation in AME by imposing treatments such as cleanliness of the rearing environment, sex of the chicken, and addition of MOS to the diet. The third experiment examined the effect of soluble NSP on the morphology of the intestinal mucosa of male and female chickens from two different breeds. 5.2 Birds, housing and management 5.2.1 Experiment 1 Sexed broiler chickens (Ross breed) obtained from the Bartter Steggles hatchery, Cavan SA 5094 on Thursday 22 April 1999 were raised on starter crumbles from hatch to 20 days of age in experimental rearing pens. One set of pens was housed in a ‘clean’ environment and the other in a ‘dirty’ environment. The ‘clean’ rearing environment involved isolation of chickens in a rearing room cleaned and fumigated to industry standards. The ‘dirty’ environment involved exposure of chickens to air-borne debris from an older flock of healthy chickens reared in floor pens in the same room. Chickens were transferred to 96 single-bird metabolism cages located in a controlled-temperature room kept at 22 - 25oC and given two experimental diets containing MOS (Bio-mos™ added at 0 or 5 g/kg to coarsely milled finisher pellets which were then cold-pressed. At the end of the 7-day energy balance study, each bird was killed by intravenous injection of pentobarbitone. The gastro-intestinal tract (GIT) from the proventriculus down to the ileo-caecal junction was dissected. The empty proventriculus, gizzard, duodenum, pancreas, jejunum and ileum were rinsed with water, dried by blotting, then weighed. The GIT sections were dried at 40oC to constant weight. Dry matter (DM) contents of pelleted and milled feeds were measured. Gross energy values of dried excreta and milled feeds were measured with a Parr isoperibol bomb calorimeter to determine AME.
14
Figure 7. The digestive tract of the chicken. Adapted from Sturkie (1976)

15
Blood sera samples were collected from chickens at seven weeks of age. ELISA tested for the presence of antibodies against Marek’s disease virus (MDV), infectious bursal disease virus (IBDV) and chicken anaemia virus (CAV), courtesy of Dr Tom Grimes, Steggles Pty Ltd. 5.2.2 Experiment 2 Sexed broiler chickens (Ross breed) obtained from the Bartter Steggles hatchery, Cavan SA 5094 on Thursday 10 June 1999 were raised from hatch to 15 days of age in experimental rearing pens. One set of pens was housed in a ‘clean’ environment and the other in a ‘dirty’ environment, as described for experiment 1 in the previous section. Birds were given commercial starter crumbles containing MOS (Bio-mos™ at 0 or 5 g/kg). At 15 days of age, the chickens were transferred to 96 single-bird metabolism cages located in a controlled-temperature room kept at 25 - 27oC initially, and given two experimental diets based on wheat and casein, and containing MOS at 0 or 5 g/kg. AME values of the wheat and casein diets with and without MOS were measured over the following 4-day period. The purpose of this part of the study was to enable individual chickens to express natural variation in uptake of energy from a ‘novel’ diet based on wheat and casein. Then chickens were given two commercial finisher diets containing MOS at 0 or 5 g/kg. AME values of these diets were measured over the following 7-day period. A total of 24 chickens were selected on the basis of AME values obtained on the wheat and casein diet. Chickens with lowest, highest or average AME value within each combination of rearing treatment, sex of chicken and dietary addition of MOS were killed by intravenous injection of pentobarbitone. Sections of duodenum, jejunum and ileum were fixed in buffered formalin, embedded in paraffin, sectioned (7 µm longitudinal to the plane of the villi) and stained with Haematoxylin and Eosin. Villus height and crypt depth were measured by image analysis (Leading Edge Pty Ltd, Adelaide, South Australia). A minimum of 15 villi and crypts were measured in each type of tissue from each chicken. Blood sera samples were collected from chickens at seven weeks of age. ELISA tested for the presence of antibodies against Marek’s disease virus (MDV), infectious bursal disease virus (IBDV) and chicken anaemia virus (CAV), courtesy of Dr Tom Grimes, Steggles Pty Ltd. 5.2.3 Experiment 3 The birds and procedures used in this experiment are described in Chapter 4, sections 4.2 to 4.5. On completion of the 7-day AME study, each chicken was weighed then killed by intravenous injection of pentobarbitone. The gastro-intestinal tract (GIT) from the base of the gizzard down to the ileo-caecal junction was dissected. Sections of the duodenum, jejunum and ileum were placed in fixative for histology by procedures described in section 5.2.2. Ileal digesta was removed by gentle squeezing and stored on ice prior to centrifugation for measurement of viscosity of fresh supernatant. 5.3 Results 5.3.1 Experiment 1 AME of the diet (13.7 MJ/kg DM) was unaffected (P>0.05) by cleanliness of the rearing environment, sex of chicken, or addition of MOS to the diet of chickens 22-29 days of age. Live-weights of chickens from the clean environment were greater at the start (893 vs 852 g/bird) and end (1301 vs 1271 g/bird) of the 7-day metabolism study in comparison with those from the dirty environment. However, the adjusted rate of gain in live-weight during the study was greater for chickens from the dirty environment (495 vs 464 g gain/kg live-weight). There was a significant interaction between rearing environment and diet which resulted in chickens from the clean environment given MOS being heavier than controls at the end of the 7-day metabolism study (1320 vs 1283 g/bird). In contrast, there was no difference due to MOS in chickens from the dirty environment (1271 g/bird).
16
After dried weights of gut sections were adjusted for metabolic body weight (weight0.75), the proventriculus tended to be greater (P=0.09) for chickens reared in the clean environment (1.14 vs 1.06 g) compared with dirty. In addition, the pancreas was significantly heavier (P<0.05) for females compared with males (0.99 vs 0.90 g), indicating that cleanliness during rearing and sex of chicken can affect gross structure of the gut that in turn could influence growth performance through digestive function. Step-wise regression analysis was used to develop a prediction equation for AME of the diet and dry matter digestibility (DMD) from adjusted weights of gut sections. AME and DMD coefficients ranged from 12.3 to 14.4 MJ/kg DM and 0.59 to 0.68, respectively. Corresponding means and standard deviations for 96 chickens were 13.7±0.3 MJ/kg DM and 0.645±0.014. In both cases, the weight of the gizzard was the only significant variable (P<0.05) in the 6-variable equation. Only 17% of the variation in AME and 24% of the variation in DMD was associated with adjusted gut weights. These results are comparable with unpublished work done in 1997 by R.J. Hughes, A. Kocher, R.B. Cumming and M. Choct who found similarly poor statistical associations between AME and weights of freshly dissected gut sections. These two studies indicate that, at most, variation in gross structure could play a part in the overall functionality of the gut but cannot explain the massive between-bird variation in AME of the nature observed by Hughes and Choct (1997). 5.3.2 Experiment 2 Effects of cleanliness of the rearing environment on live-weight in this experiment were similar to those observed in experiment 1. Live-weights of chickens from the clean environment were greater at the start (626 vs 594 g/bird) and end (833 vs 798 g/bird) of the 4-day metabolism study in comparison with those from the dirty environment, a finding frequently noted under practical conditions. However, in contrast to results from the previous experiment, the adjusted rate of gain (338 g gain/kg live-weight) was not significantly affected (P>0.05) by rearing treatment. AME and DMD coefficient of the wheat and casein diet were significantly affected (P<0.05) by an interaction between cleanliness of the rearing environment and sex of chickens. Males had lower AME than females (15.15 vs 15.32 MJ/kg DM) when reared in the dirty environment but there was no difference between males and females (mean value 15.29 MJ/kg DM) from the clean environment. Similarly, DMD was 0.758 and 0.766, respectively, for males and females from the dirty environment, and 0.763 for chickens from the clean environment. In the following 7-day period when chickens were given commercial finisher diet, AME (13.5 MJ/kg DM) and DMD coefficient (0.626) were unaffected (P>0.05) by rearing treatment, sex of chickens, and addition of MOS to the diet. Effects of cleanliness of the rearing environment on villus height and crypt depth in duodenal, jejunal and ileal sections are shown in Figure 8. Villus height in duodenal mucosa was significantly (P<0.05) reduced in chickens reared in the dirty environment (1440 vs 1299 µm). Other morphological features were unaffected (P>0.05) by rearing conditions, dietary addition of MOS, and sex of chickens. Step-wise regression analysis was used to examine relationships between gut morphology and AME of the diet and dry matter digestibility. AME and DMD coefficients ranged from 12.7 to 14.3 MJ/kg RDM and 0.59 to 0.66, respectively. Corresponding means and standard deviations for 24 chickens were 13.46±0.36 MJ/kg DM and 0.621±0.018. Only 16% of the variation in AME and 23% of the variation in DMD was associated with villus height and crypt depth in gut sections. There was a significant (P<0.05) but weak association (R2=0.17) between DMD and crypt depth in ileal tissue, however AME was not related to any single measurement or a combination of morphological features of the small intestine. In both experiments, ELISA tests indicated an absence of challenge from immuno-suppressive agents such as MDV and IBDV. Some chickens (three from 24 in experiment 1 and 8 from 48 in experiment 2) tested positive to CAV, which implies that any challenge is likely to have occurred after each metabolism study. Hence, it seems that effects attributed to rearing treatments would have involved an immunologic stress arising from accumulation of inhaled or ingested non-pathogenic microbes, dust and dander (Klasing et al., 1999).

17
5.3.3 Experiment 3 Breed had no effect (P>0.05) on AME (14.4 vs 14.2 MJ/kg dry matter), but females were superior to males (14.6 vs 14.9 MJ/kg dry matter, P<0.05)(Refer to Figure 4 and Figure 5 in Chapter 4). Significant differences (P<0.05) due to breed and sex were detected in villus height of the mucosa in different sections of the small intestine. Chickens from breed 2 had significantly greater duodenal villus height than breed 1 chickens (1299 vs 1199 µm). Males had significantly greater ileal villus height than females (613 vs 560 µm). Jejunal villus height was significantly affected by the interaction between breed and sex (Figure 9) with male chickens of breed 2 having significantly greater jejunal villus height (1067 vs 956 µm) than male chickens of breed 1. Crypt depth was not significantly affected by breed, sex or by the breed by sex interaction (Figure 9). 5.4 Discussion Relationships between AME of the diet and gut morphology were examined in three experiments. Two experiments were designed to expose the extent of potential variation in AME by application of treatments involving cleanliness of the rearing environment, sex of chickens and addition of MOS to the diet. Less than 20% of the variation in AME was associated with either gross structural characteristics such as the weights of duodenum, jejunum or ileum relative to metabolic body weight, or with finer morphological measurement of villus height and crypt depth in these sections of the small intestine. In experiment 3, stepwise regression analysis of pooled data indicated that up to 33% of the variation in AME was associated with morphology of the small intestinal mucosa, with crypt depth being the key determinant (negative correlation r=-0.42, P<0.01). Hence there is good reason to believe that gut morphology may be a limiting feature of energy metabolism, but other aspects are collectively more important given that 67% of the variation in AME remained unaccounted in this experiment. 5.5 Conclusions Morphology of the intestinal mucosa differed between male and female chickens. However, large between-bird variation in AME reported in previous studies could not be fully explained by differences in the weights of duodenum, jejunum and ileum relative to metabolic body weight, or by changes in villus height or crypt depth in these sections of the small intestine. The possibility that variation in AME is associated with differences in gut epithelial function, not detectable by the histological methods used in these studies, is worthy of investigation.

18
0
200
400
600
800
1000
1200
1400
1600
Duodenum Jejunum Ileum Duodenum Jejunum Ileum
------ Villus ------ ------ Crypt ------
Villu
s he
ight
or c
rypt
dep
th (m
icro
ns)
Clean DirtyP = 0.013
Figure 8. Effects of cleanliness of the rearing environment on villus height (µm) and crypt depth
(µm) in duodenum, jejunum and ileum (means ± SE; n=12 chickens).
Figure 9. Effects of breed and sex of chicken on villus height and crypt depth in intestinal mucosa (means ± SD). Jejunal villus means with a common letter are not significantly different (P>0.05).
0
300
600
900
1200
1500
Duodenum Jejunum Ileum Duodenum Jejunum Ileum ------ Villus ------ ------ Crypt ------
Villu
s he
ight
or c
rypt
dep
th (m
icro
ns)
Breed #1 female Breed #1 male
Breed #2 female Breed #2 malea
bab
ab

19
6. Development of breath tests as non-invasive indicators of digestive function 6.1 Introduction Analysis of expired breath is a non-invasive method for diagnosing gastro-intestinal function in humans (Butler, 1996). Breath tests involving stable isotopes are safe alternatives to radio-scintigraphy, particularly for infants and pregnant women, and when multiple or frequent tests are required (Amarri and Weaver, 1995; Swart and van den Berg, 1998). The tests involve ingestion of a 13C-enriched substrate of relevance to the particular rate-limiting intestinal process under investigation, followed by serial breath sampling. For example, 13C-triglyceride is used to examine pancreatic lipase function (Vantrappen et al., 1989), and lactose 13C-ureide is used for measuring small intestinal transit time (Heine et al., 1995). Isotope is released as 13CO2 by a series of metabolic processes following digestion and absorption of labelled feedstuffs, then transported via the blood stream to the lungs for excretion. The breath samples are then analysed with an isotope-ratio mass spectrometer. The ratio of 13C and 12C isotopes in the breath is directly related to functionality of the gut in terms of release of digestive enzymes, epithelial function or digesta transit time, all of which are measured individually by this technology (Amarri and Weaver, 1995; Swart and van den Berg, 1998). Tivey and Butler (1999) recently concluded that stable isotope breath tests should prove to be powerful analytical tools for nutrition research and veterinary diagnostics in domestic and agricultural species. A search of the scientific literature prior to commencement of these studies failed to find any published papers on stable isotope breath testing of birds. One paper, by Ten Doeschate et al. (1995), reported the measurement of 14CO2 expired by broiler chickens housed in respiration chambers to study the effect of nutritional status on oxidation of 14C-labelled amino acids injected intraperitoneally or subcutaneously. Other breath tests used routinely in medical practice are based on release of hydrogen and methane following microbial fermentation of labelled substrates such as lactose [13C]-ureide (Heine et al., 1995) or non-labelled carbohydrates such as lactulose, a synthetic disaccharide, which is not absorbed by the small intestine (Robb and Davidson 1987). Studies on humans and other species indicate that samples of breath can be taken with simple, inexpensive equipment and remain stable for long periods, enabling these tests to be used in the field (Tivey and Butler, 1999). This part of the report summarises the development of breath tests for chickens for non-invasive measurement of gastro-intestinal function and metabolic activity of gut microflora. It was expected that breath tests would provide more insight than the usual snapshot view obtained in conventional nutrient balance studies involving the slaughter of birds to obtain digesta. It was reasoned that with breath tests it should be possible to pre-select individual chickens with known physiological characteristics, then expose them to dietary treatments involving soluble NSP and endogenous enzymes in order to follow the resulting changes in gastro-intestinal functions such as pancreatic enzyme activity, digesta transit time, and microbial proliferation in the small intestine. The following sections describe initial attempts to collect breath samples with masks fitted to chickens (section 6.2), use of helmets placed over the head of chickens to collect breath samples (section 6.3), and development of breath testing methodology for assessing digestive function of chickens (section 6.4).

20
6.2 Face masks for collecting breath samples from chickens Initial attempts to construct face masks quickly highlighted some of the practical difficulties associated with this approach to collection of breath samples from chickens. It soon became clear that masks needed to fit closely in order to gather a sufficient quantity of breath without contamination from ambient air. Furthermore, the awkward profile of the head and beak of chickens (Figure 10) made this difficult to achieve in a mask that could be taken on and off easily without upsetting the birds. The alternative of leaving the mask in place for up to three or more hours required either a pressurised air supply or a system of one-way valves to enable the chicken to breath ambient air between the taking of serial breath samples. Other approaches described in the literature such as insertion of a tracheal cannula (Scheid and Piiper, 1969) or the gluing of tubes into the nostrils (Itabisashi, 1981) were considered extreme from an animal ethics point of view and otherwise impractical or inappropriate for use in this project. Figure 10. Upper respiratory tract of the chicken. Adapted from Nickels et al. (1977). 6.3 Helmets for collecting breath samples from chickens 6.3.1 Introduction Plastic helmets were constructed from standard PVC plumbing pipe and caps. A sample of re-breathed air is taken by placing the helmet over the head and neck of the chicken. The helmet is then held firmly against the shoulders and breast of the chicken. After a predetermined period (e.g., 15 seconds) measured by stopwatch, a 10 mL gas sample is drawn through Luer lock fittings into an evacuated tube. Helmets of different dimensions (internal diameter and length) were constructed for chickens of different ages and hence size. The choices of helmet size and the period that it is placed over the head of the chicken are based on how long it is estimated for re-breathing of air to raise carbon dioxide concentration in the enclosed space to reach at least 2% but not approach 5%. Achievement of these limits is important, firstly, to ensure accurate analysis by mass spectroscopy (with CO2>1%) and, secondly, to avoid disruption to normal respiration by the chicken from excess CO2 in re-breathed air in the helmet. 6.3.2 Practical considerations for the use of helmets The period of time that the helmet is placed over the head is determined mainly by the volume of the empty helmet, the space occupied by the head of the chicken, respiratory characteristics of the chicken (Table 3), and the CO2 content of expired air (Table 4 and Figure 11). Preliminary estimates indicated that 30-45 seconds would be sufficient. Subsequent trial and error with 13CO2 measurements confirmed these estimates. Later studies involving hydrogen and methane indicated

21
shorter periods (15-30 seconds) of re-breathing were adequate for accurate measurements. The comfort of the chickens was also an important consideration in the decision over re-breathing time. Experience showed that chickens readily tolerated 15 seconds but during longer periods chickens tended to struggle after about 25-30 seconds. This was attributed to an involuntary reflex to raised CO2 concentration. Hence, the shortest possible period was used in subsequent experiments. Table 3. Respiratory characteristics of poultry (Freeman, 1984)
Male Female Respiratory frequency (breaths/minute) 12-21 20-37 Tidal volume (mL) 33-46 15-33 Ventilation rate (L/minute) 0.5-0.7 0.5-0.7 Lung capacity (mL) 70 35 Air sacs (mL) 425 260
Table 4. Partial pressure of carbon dioxide in air spaces and blood (McLelland and Molony, 1983)
mm Hg Arterial blood 29 Venous blood 39 Mean expired air 28 Abdominal air sac 15 Caudal thoracic air sac 24 Cranial thoracic air sac 42 Clavicular air sac 44
Figure 11. Lungs and air sacs in the chicken (Fedde, 1976)

22
6.3.3 Proof of the concept for the use of helmets 6.3.3.1 CO2 in expired air 6.3.3.1.1 Introduction Preliminary experiments were conducted to determine whether it was possible to detect 13CO2 in the breath of chickens. Two substrates labelled with 13C, a stable isotope of carbon, were chosen for these experiments. The first, 13C-octanoic acid, is given as a liquid meal to measure gastric emptying time for the liquid phase of ingested food in human subjects (Swart and van den Berg, 1998). The main reason for choosing 13C-octanoic acid was that it was most likely to produce a relatively large amount of 13CO2 able to be detected by mass spectroscopy. The second substrate, corn, is naturally enriched in 13C through the metabolic pathway described by Hatch and Slack (1966), and is used experimentally (Symonds et al., 1998) to examine solid phase gastric emptying and starch hydrolysis in the small intestine of rats. This substrate is readily available and cheap compared with labelled probes normally used in clinical practice (Swart and van den Berg, 1998). 6.3.3.1.2 Birds, housing and management Ross broiler chickens were purchased from the Bartter Steggles hatchery, Cavan, SA 5094 on Thursday 8 April 1999. These chickens were reared to 15 days of age in separate sex groups in two floor pens in a controlled temperature room. All birds were given commercial starter crumbles (Ridley Agriproducts, diet code #503540, Steg 600 starter) during this period. At 15 days of age (Friday 23 April), 18 male chickens were transferred in groups of three to metabolism cages in a room maintained at 24-26oC. All birds continued to receive commercial starter crumbles. Birds had free access to feed when not involved in experimental procedures and drinking water was available at all times. Room temperature was adjusted as required to suit the comfort of the chickens. 6.3.3.1.3 Experimental procedures 13CO2 in expired air following ingestion of 13C-octanoic acid. Commencing on Monday 26 April two chickens in one cage were fasted from 5 pm to 9 am the following day. The third chicken in the cage was transferred to a separate cage in readiness for test procedures involving naturally labelled starch in corn (see section below). The helmet was constructed from 40 mm PVC tube and a close-fitting cap. A gas sample was taken directly into a 10 mL evacuated tube (Exetainer cat. No. EX10Z10) via a Vacutainer holder fitted with an 18 gauge needle inserted through a luer septum connected by flexible tube to a luer lock fitting attached to the helmet. Each breath sample was taken 45 seconds after a prototype helmet was placed over the head of the chicken and held firmly against the shoulders to minimise loss of expired CO2. It was assumed that both isotopic forms of CO2 would diffuse at a similar rate under these circumstances; hence any leakage should not have affected the ratio of 13CO2 to 12CO2 in the sample. Following overnight fast, three breath samples taken at 3-minute intervals from the chicken were taken to establish the baseline 13C/12C isotope ratio. At 9 am the chicken was administered a gelatine capsule containing a weighed amount (approximately 95 mg) of vegetable oil containing 13C-octanoic acid (37.8 µg/mg vegetable oil). That is, each chicken received approximately 3.6 mg 13C-octanoic acid. The test chicken was denied feed until completion of breath sampling at 1 pm. The other chicken was given feed immediately. Breath samples were taken at 10-minute intervals for one hour followed by samples at 15-minute intervals over the next hour then samples at 30-minute intervals for another two hours. When the breath sample has been taken the helmet was removed and

23
the chicken was returned to the metabolism cage. Care was taken during handling and breath sampling to minimise stress on the chickens in order to minimise any variability associated with “exercise” and/or disruption to normal breathing patterns as indicated by visual observation of frequency and depth of breathing. This set of procedures was repeated on subsequent days using a different chicken each day. In the following week, the schedule was repeated in the same order on the same chickens to establish the repeatability of the test within the same bird. 13CO2 in expired breath following ingestion of corn. Commencing on Monday 4 May one chicken was fasted from 5 pm to 9 am the following day. Following overnight fast, three breath samples taken at 3-minute intervals from the chicken were taken to establish the baseline 13C/12C isotope ratio. At 9 am the chicken was administered with 10 mL of homogenised corn kernel (Edgel brand; high in naturally-occurring 13C labelled starch) via a disposable syringe fitted with a plastic tube that was inserted 4 cm into the oesophagus. Breath samples were taken at 15-minute intervals for two hours followed by samples at 30-minute intervals for another two hours. This set of procedures was repeated on subsequent days using a different chicken each day. 6.3.3.1.4 Results Enrichment of 13C in breath CO2 (defined as the increase in the ratio of 13C to 12C relative to the baseline determined for each chicken) following ingestion of 13C-octanoic acid is shown in Figure 12.
Figure 12. Enrichment of 13CO2 in breath following ingestion of a gelatine capsule containing 3.6-3.8 mg 13C-octanoic acid dissolved in vegetable oil. Each curve represents results from an individual chicken.
The results are consistent with observations in humans and experimental mammals in which 13C-octanoic acid is rapidly absorbed in the intestine, metabolised, then excreted by the lungs (Tivey and Butler, 1999). Peak enrichment in chickens between 5 and 30 minutes is comparable with mice (Symonds et al., 1998) and considerably less than the 53 minute delay observed in adult humans given a semi-solid test meal containing sodium [13C1]-acetate to measure emptying of the liquid phase (Braden et al., 1995). The flattened, delayed peaks for two chickens (Figure 12) might indicate true
0
10
20
30
40
50
60
0 30 60 90 120 150 180 210 240 270 300Minutes after ingestion
Enric
hmen
t of
13C
in b
reat
h C
O2
(Del
ta o
ver b
asel
ine)

24
variation between birds in terms of gastric emptying time. Alternatively, but less likely, it could be due to association of some of the 13C-label with the solid phase of the small amount of feed consumed followed by a delay in release further down the gut. The enrichment of 13C in breath following ingestion of 13C-starch in corn is shown in Figure 13. Peaks were observed 60-90 minutes post-ingestion. This is much quicker than the average time of 153 minutes observed in human infants 7-16 months of age with mean weight of 8.6 kg given a test meal made from maize flour (Weaver et al., 1995). Hiele et al. (1989) reported peaks in 13CO2 excretion at 3 and 5 hours in healthy volunteers and patients with pancreatic disease, respectively, following consumption of a test meal made from corn starch suspended in water. As with the results in Figure 12, the main difference between chickens and humans is the shorter time to peak enrichment of 13C in breath CO2 from chickens.
Figure 13. Enrichment of 13CO2 in breath following ingestion of cooked corn kernel naturally enriched with 13C-starch. Each curve represents results from an individual chicken.
The degree of enrichment of 13CO2 in breath samples from chickens in both experiments are similar to those found with humans and other experimental animals dosed with these labelled substrates. The smooth transitions in Figure 12 and Figure 13 from zero enrichment to peaks and subsequent declines to baseline imply that the sampling procedures used produce representative samples of expired breath. In conclusion, preliminary experiments using simple PVC helmets to collect breath from individual birds provided proof of the concept of using 13CO2 breath tests as non-invasive tools for studying gut physiology in broiler chickens 6.3.3.2 Hydrogen and methane in expired air 6.3.3.2.1 Introduction Breath tests based on release of hydrogen and methane are used routinely in medical practice (Robb and Davidson, 1987; Heine et al., 1995). These tests rely on bacterial fermentation of undigested carbohydrate in the large bowel, as hydrogen and methane are not produced by mammalian tissue. Preliminary experiments were conducted with chickens to see whether hydrogen and/or methane appeared in the breath of chickens given a normal diet or when dosed with lactulose, a synthetic disaccharide used in diagnostic tests in human subjects.
0
1
2
3
4
5
6
0 30 60 90 120 150 180 210 240 270 300Minutes after ingestion
Enric
hmen
t of 1
3C in
bre
ath
CO
2 (D
elta
ove
r bas
elin
e)

25
6.3.3.2.2 Birds, housing and management Ross broiler chickens were purchased from the Bartter Steggles hatchery, Cavan, SA 5094 on Thursday 15 July 1999. These chickens were reared to 22 days of age in a floor pen in a controlled temperature room. All birds were given commercial starter crumbles (Ridley Agriproducts, diet code #503540, Steg 600 starter) to 19 days of age then commercial finisher pellets (Ridley Agriproducts, diet code #504540, Steg 620 finisher). At 22 days of age (Friday 6 August), 16 chickens (8 male and 8 female) were transferred in pairs to metabolism cages in a room maintained at 24-26oC. All birds continued to receive commercial finisher pellets. Birds had free access to feed when not involved in experimental procedures. Drinking water was available at all times. Excreta trays were cleaned daily. Room temperature was adjusted as required to suit the comfort of the chickens. Commencing on Monday 9 August one chicken was removed from each cage and placed alone in another cage then all chickens were weighed. Chickens continued to have access to feed and water prior to test procedures described in the following sections. Prior to the experiment, Exetainer tubes (cat. No. EX10Z10) were opened and flushed with air to remove gaseous hydrocarbons generated in the sterilisation process, then re-evacuated by removal of air via needle and syringe. 6.3.3.2.3 Experimental procedures Hydrogen and methane in expired air from chickens given a normal diet Commencing on Monday 9 August, two 10 mL breath samples were taken from 12 chickens (6 male and 6 female). Each breath sample was taken 30 seconds after a prototype helmet was placed over the head of the chicken and held firmly against the shoulders to minimise loss of expired gas. The helmet was constructed from 40 mm PVC tube and a close-fitting cap. A gas sample was be taken directly into a 10 mL evacuated tube via a Vacutainer holder fitted with an 18 gauge needle inserted through a luer septum connected by flexible tube to a luer lock fitting attached to the helmet. The second breath sample was taken within 2 - 3 minutes of the first sample, and then the chicken was returned to the metabolism cage. Care was taken during handling and breath sampling to minimise stress on the chickens in order to minimise any variability associated with “exercise” and/or disruption to normal breathing patterns. Breath samples were kept cool (0 - 4oC) to minimise gas diffusion during transport and storage prior to analysis. Hydrogen and methane concentrations in breath were measured by gas chromatography (QuinTron Microlyzer, Women’s and Children’s Hospital) Hydrogen and methane in expired air following ingestion of lactulose All chickens were fasted overnight from 5 pm Tuesday 10 August. Commencing at 8.30 am Wednesday 11 August, each chicken was weighed and breath tested (two 10 mL samples as per the procedures described in the section above). Then each chicken was administered with 5 mL of diluted lactulose solution via a disposable syringe fitted with a plastic tube that was inserted 4 cm into the oesophagus. A total of 12 chickens (6 male and 6 female) were given approximately 130 mg lactulose in 5 mL water while the other four chickens were given double the dose (260 mg lactulose) or quadruple the dose (520 mg lactulose) in 5 mL water. The lower dose rate (1 g carbohydrate per 10 kg body weight) was equivalent to that given to human subjects to assess carbohydrate malabsorption. The higher dose rates (2 g per 10 kg and 4 g per 10 kg) were used to determine whether carbohydrate loading needed to be higher to achieve measurable levels of hydrogen or methane in expired breath for subsequent experiments with chickens. The lactulose solutions were made from Duphalac syrup (Solvay-Duphar B.V., Holland; 3.34 g lactulose/5 mL) diluted in deionised water.

26
Each chicken was breath tested (two 10 mL samples) 3 hours post-feeding of lactulose. The choice of timing was based on a combination of crude extrapolation from results of a previous experiment with chickens, where the time taken for peak 13CO2 output in expired breath was approximately 60 – 90 minutes post-feeding of homogenised corn kernel, and by comparison of results from experiments with rats (Ross Templeman, personal communication). 6.3.3.2.4 Results There was large variability in hydrogen concentration (in ppm) in breath samples from non-fasted chickens given a commercial diet, and in fasted chickens both before and after dosing with lactulose (Figure 14). In 9 out of 12 chickens studied, there was an increase in hydrogen concentration in the 3-hour period following dosing with lactulose. There was no change in one chicken and the other two chickens showed a small decline.
0
20
40
60
80
100
120
1 2 3 4 5 6 7 8 9 10 11 12Individual chickens
Hyd
roge
n
Non-fasted Pre-lactulose Post-lactulose
Figure 14. Breath hydrogen concentration (in ppm) in chickens fed a commercial diet ad libitum, and
then two days later from the same chickens (fasted overnight) immediately before and 3 h after dosing with lactulose (130 mg in 5mL water)
In addition, methane (up to 13 ppm) was detected in the breath of all 16 chickens at some stage during this experiment, either before or after dosing with lactulose (data not shown). These results tend to suggest that other factors such as the rate of passage of digesta, proliferation of facultative anaerobes (Choct et al., 1996) in the small intestine, and combinations of these contributed significantly to the large variation in breath hydrogen and methane. In conclusion, all chickens hosted microflora (presumably in the caeca) that were capable of fermenting naturally occurring carbohydrate in the diet and lactulose to hydrogen and methane. It is also possible that the dose rate of non-absorbable carbohydrate was too low.

27
6.4 Development of breath tests for assessing digestive function of chickens 6.4.1 Introduction Clinicians have known for many years that unusual breath odour is often an indication of gastrointestinal dysfunction in patients. Analysis of expired breath is now a commonly used, non-invasive diagnostic method in human medicine (Amarri and Weaver, 1995; Swart and van den Berg, 1998). Tivey and Butler (1999) concluded that breath tests could prove to be equally as useful as analytical tools for nutrition research and veterinary diagnostics in domestic and agricultural species. To date, there is scant information in the scientific literature on the use of breath tests on animals. Breath tests fall into two broad purposes of use; these are (1) the examination of some particular aspect of the metabolic function of host tissue, and (2) the examination of the metabolic activity of the gut microflora. Results shown in Section 6.3 suggest that both broad categories of breath tests have potential as analytical tools in broiler nutrition. At the outset of this project it was expected that the most useful breath tests for chickens would be those based on measurement of 13CO2 in order to study digestive function of the gut in relation to energy metabolism. That is, the initial hypothesis was that observed variation in energy metabolism in broilers given diets high in soluble NSP with or without glycanase enzymes was attributable mainly to differences in gut structure and/or function. The evidence presented in Chapter 5 tends to suggest otherwise. Furthermore, during the course of the project it became increasingly clear from other reports in the scientific literature that gut microflora played a highly significant role in energy metabolism in chickens through effects on gut tissue and rate of passage of digesta (Langhout et al., 1999; Bedford, 2000; Bedford and Apajalahti, 2001). Hence it was decided to place more emphasis on development of breath tests for measurement of metabolic activity of gut microflora and transit time of digesta in the latter part of this project. Breath hydrogen measurement is used as an indicator of carbohydrate malabsorption in humans and is used for estimating the rate of passage of digesta through the small intestine. These breath tests used routinely in medical practice are based on release of hydrogen and methane following microbial fermentation of carbohydrates such as lactulose which is a synthetic disaccharide not absorbed in the small intestine (Wutzke et al., 1997). Preliminary experiments described in section 6.3 indicated that all of the chickens hosted a microflora able to produce hydrogen and methane from fermentation of undigested carbohydrate but the results were variable. A further experiment was conducted to determine whether (1) priming the gut microflora with a prior dose of lactulose and (2) fasting prior to test dosing with lactulose would reduce the variation in hydrogen content during serial collections from chickens. 6.4.2 Birds, housing and management Ross broiler chickens were obtained from the Bartter Steggles hatchery, Cavan SA 5094 on Thursday 8 March 2001. Chickens were raised from hatch in two rearing pens in a controlled temperature room. Male and female chickens were reared separately. All birds were given commercial starter crumbles (Ridley Agriproducts, diet code #503540, Steg 600 starter). On Wednesday 28 March, 24 male chickens were transferred in pairs to 12 metabolism cages located in a controlled-temperature room kept at 25-27oC initially, and given finisher pellets (Ridley Agriproducts, diet code #504540, Steg 620 finisher) for the duration of this experiment. Birds had free access to feed and water during the experimental period except for a 3-hour period of fasting immediately before dosing with lactulose. On Friday 30 March, one chicken was removed from each

28
cage. Commencing on Monday 2 April, four chickens entered the testing cycle that run over two days. This cycle was repeated with separate sets of four chickens on Tuesday and Wednesday. On day 1 of each cycle, two chickens were given a priming dose of lactulose at 11 am. Each chicken was treated with approximately 130 mg lactulose in 5 mL of water administered via a disposable syringe fitted with a soft plastic tube that will be inserted 4 cm into the oesophagus. On day 2, two chickens (one prime-dosed and one not dosed) were fasted from 8 am. The other two chickens (one prime-dosed and one not dosed) had free access to feed. Commencing at 11 am, all four chickens were test-dosed with approximately 130 mg lactulose in 5 mL of water. The lactulose solution for dosing (130 mg lactulose in 5 mL) was made from 3.9 mL Duphalac syrup (Solvay-Duphar B.V., Holland; 3.34 g lactulose/5 mL) made up to 100 mL in water. 6.4.3 Sampling of breath Serial breath testing of each chicken commenced immediately before test dosing at 11 am then at 60, 90, 105, 120, 135, 150, 165, 180, 210, 240 and 300 minutes thereafter. A 50mL gas sample from the headspace was taken 15 seconds after a prototype helmet was placed over the head of the chicken and held firmly against the shoulders to minimise loss of expired gas. The gas sample was drawn into a pre-evacuated 60 mL syringe attached to the helmet. Then 10 mL aliquots were transferred to Exetainer tubes for determination of hydrogen and methane concentrations. Care was taken during handling and breath sampling to minimise stress on the chickens in order to minimise any variability associated with ‘exercise’ and/or disruption to normal breathing patterns. Breath samples were kept cool (0-4oC) to minimise gas diffusion during transport and storage prior to analysis. Breath samples were analysed for hydrogen and methane (QuinTron MicroLyzer, Women's and Children's Hospital). 6.4.4 Results All chickens showed an increase in breath hydrogen after dosing with lactulose whether or not they received a priming dose on the previous day. Fasting prior to dosing appeared to reduce variation in hydrogen concentration between chickens at the same time after test dosing, and to also reduce the within-chicken variation.
Figure 15. Breath hydrogen concentration (in ppm) in male chickens fasted for 3 h prior to test dosing with lactulose (130 mg in 5mL water) in Experiment 1.
Results of serial breath sampling of fasted chickens are shown in Figure 15. Estimates of oro-caecal transit time for lactulose following fasting ranged from 165 mins for chicken E, 180 mins for chickens B and F, to 210 mins for chickens A, C and D. The mean and standard error for transit time were 193 ± 8 mins. The above estimate is likely to be biased upwards because the interval between serial breath
0
50
100
150
200
250
0 30 60 90 120 150 180 210 240 270 300Time in minutes after dosing with lactulose
Hyd
roge
n (p
pm)
Chicken A Chicken B Chicken CChicken D Chicken E Chicken F
29
samples was 15 minutes up to 180 minutes post dosing, then 30 minutes thereafter. That is, mean transit time occurred after the period of most frequent sampling. The hydrogen profile for chicken D with two peaks in hydrogen concentration at 180 and 240 minutes (Figure 15) is very similar in appearance to breath profiles observed in rats and humans with small bowel bacterial overgrowth (proliferation of facultative anaerobes in the small intestine). Choct et al. (1996) observed microbial proliferation in the small intestine of chickens associated with an increase in digesta transit time as a result of the gelling properties of soluble non-starch polysaccharides in wheat. Prior dosing with the synthetic disaccharide lactulose was not necessary, as all chickens appeared to contain hindgut microflora able to utilise lactulose passing out of the small intestine. Fasting for three hours prior to dosing reduced both within- and between-bird variability in breath hydrogen concentration. 6.5 Conclusions Preliminary experiments using simple PVC helmets to collect breath from individual birds provided proof of the concept of using breath tests as non-invasive tools for study of the gastroenterology of broiler chickens. The patterns of recovery of the stable isotope in the form of 13CO2 in breath samples were similar to those seen in humans and other animals, with the possible exception of the more rapid rate of release, which is not surprising given the anatomy of the avian gastro-intestinal tract. There appeared to be no fundamental differences between avian and mammalian species in terms of basic physiology and biochemistry under-pinning these 13CO2 breath tests for gastric emptying and pancreatic function. Hence, it should be possible to develop these non-invasive tests for application in poultry research and for practical use in commercial production. Similarly, breath tests based on production of hydrogen by fermentative action of gut microflora appear to work as well in chickens as they do in humans. The hydrogen breath test is an inexpensive, non-invasive way of assessing the overall metabolic activity of the gut microflora. This constitutes a novel use for hydrogen breath testing with respect to existing applications in human medicine. It provides a way of monitoring changes in metabolic activity of microflora in groups of experimental animals subjected to different dietary treatments and other therapies likely to alter the profile of gut microflora.

30
7. Rate of passage of digesta influences digestion of energy 7.1 Introduction Transit time, or inversely the period of residence of digesta in the gastrointestinal tract, influences the rates of digestion and absorption of nutrients in chickens (van der Klis and van Voorst, 1993; Uni et al., 1995). Transit time in human subjects is measured by a non-invasive diagnostic procedure involving rise in hydrogen concentration in breath following dosing with the synthetic disaccharide lactulose. The test relies on the production of hydrogen by hindgut fermentation of lactulose that is not absorbed in the small intestine (Wutzke et al., 1997). Hydrogen not otherwise utilised as a food source by other bacteria in the gut diffuses through the gut wall to the bloodstream and is then expired via the lungs. Results of experiments described in the previous Chapter suggest that it is possible to use breath hydrogen to measure oro-caecal transit time, i.e., the time taken for ingested food to pass from the mouth through the small intestine into the caeca where undigested carbohydrate is fermented by bacteria. Two experiments were conducted. The first experiment (1) compared oro-caecal transit time (OCTT) determined by rise in breath hydrogen with whole tract transit time (WTTT) determined by appearance of ferric oxide in excreta, and (2) determined whether transit time differed between males and females. The second experiment examined whether (1) AME values for wheat were related to WTTT, (2) addition of commercial feed enzymes to the diet affected AME or WTTT, and (3) the relationship between AME and WTTT differed between males and females. 7.2 Relationship between oro-caecal transit time and whole tract transit time (Experiment 1) 7.2.1 Birds, housing and management Ross broiler chickens obtained from the Bartter Steggles hatchery, Cavan SA 5094 on Friday 11 May 2001 were raised from hatch in two rearing pens in a controlled temperature room. Male and female chickens will be reared separately. All birds will be given commercial starter crumbles (Ridley Agriproducts, diet code #503540, Steg 600 starter). On Friday 25 May, a total of 32 chickens were transferred in single-sex pairs to 16 metabolism cages (with males and females in alternate cages) located in a controlled-temperature room kept at 25-27oC initially, and given starter crumbles (Ridley Agriproducts, diet code #503540, Steg 600 starter) for the duration of this experiment. Birds had free access to feed and water during the experimental period except for a 3-hour period of fasting immediately before dosing with lactulose. On Monday 28 May, one chicken was removed from each cage. Commencing on Tuesday 29 May, eight chickens were fasted for three hours from 8 am. At 11 am all eight chickens were administered with a gelatine capsule containing ferric oxide (Fe2O3 200 mg/kg liveweight) as described by Iskander and Pym (1987). Six of the eight chickens were dosed with approximately 130 mg lactulose in 5 mL of water administered via a disposable syringe fitted with a plastic tube that was inserted 4 cm into the oesophagus. The lactulose solution for dosing (130 mg lactulose in 5 mL) was made from 3.9 mL Duphalac syrup (Solvay-Duphar B.V., Holland; 3.34 g lactulose/5 mL) made up to 100 mL in water. The two chickens not dosed with lactulose provided a measure of base-line variation in hydrogen production from undigested carbohydrate by gut

31
microflora. These procedures were repeated on Wednesday 20 May with the remaining eight chickens. No chicken was fasted or dosed with lactulose and ferric oxide more than once. 7.2.2 Estimation of whole-tract transit time Excreta trays were examined frequently for signs of ferric oxide in voided droppings. Whole-tract transit time for each chicken was taken as the time elapsed (in minutes) from time of administration of ferric oxide in a gelatine capsule to time of first observation of red colouration in droppings. 7.2.3 Sampling of breath Serial breath testing of each chicken commenced immediately before test-dosing at 11 am then at 120, 150, 165, 180, 195, 210 and 240 minutes thereafter. A 50mL gas sample from the headspace was taken 15 seconds after a prototype helmet was placed over the head of the chicken and held firmly against the shoulders to minimise loss of expired gas. The gas sample was drawn into a pre-evacuated 60 mL syringe attached to the helmet. Then 10 mL aliquots were transferred to two Exetainer tubes (288 tubes required). Care was taken during handling and breath sampling to minimise stress on the chickens in order to minimise any variability associated with “exercise” and/or disruption to normal breathing patterns. Breath samples (total 144) were analysed for hydrogen and methane (QuinTron MicroLyzer, Women's and Children's Hospital). 7.2.4 Results Oro-caecal transit time was 165 ± 12 mins and whole tract transit time was 164 ± 13 mins in male chickens (Figure 16). For female chickens (Figure 17), the corresponding values were 158 ± 13 mins for OCTT and 166 ± 12 mins for WTTT. That is, there was no difference due to sex of the chicken for either measurement. OCTT and WTTT were significantly correlated (r=0.76, P< 0.05) with WTTT being generally shorter than OCTT. OCTT and WTTT were 184 ± 8 mins and 172 ± 5 mins, respectively, in four chickens fasted for 3 h but not dosed with lactulose. 7.3 Relationship between whole tract transit time and AME value of wheat (Experiment 2) 7.3.1 Birds, housing and management Ross broiler chickens obtained from the Bartter Steggles hatchery, Cavan on Friday 11 May 2001 were raised from hatch in two rearing pens in a controlled temperature room. Male and female chickens were reared separately. All birds were given commercial starter crumbles (Ridley Agriproducts, diet code #503540, Steg 600 starter). On Monday 28 May, a total of 32 chickens were transferred in single-sex pairs to 16 metabolism cages located in a controlled-temperature room kept at 25-27oC initially, and given starter crumbles (Ridley Agriproducts, diet code #503540, Steg 600 starter). Birds had free access to feed and water prior to and during the experimental period. On Wednesday 30 May, chickens were placed one per cage in 24 cages for the experiment.

32
Figure 16. Breath hydrogen concentration (in ppm) in male chickens fasted for 3 h prior to test dosing with lactulose (130 mg in 5mL water) In Experiment 1. The vertical arrows indicate whole tract transit time for ferric oxide marker.
Figure 17. Breath hydrogen concentration (in ppm) in female chickens fasted for 3 h prior to test dosing with lactulose (130 mg in 5mL water) in Experiment 1. The vertical arrows indicate whole tract transit time for ferric oxide marker.
0
50
100
150
200
250
0 15 30 45 60 75 90 105 120 135 150 165 180 195 210 225 240 255Time in minutes after dosing with lactulose
Hyd
roge
n (p
pm)
Chicken A
Chicken B
Chicken C
Chicken D
Chicken E
Chicken F
F
DE
A B
C
0
50
100
150
200
250
0 15 30 45 60 75 90 105 120 135 150 165 180 195 210 225 240 255Time in minutes after dosing with lactulose
Hyd
roge
n (p
pm)
Chicken GChicken HChicken IChicken J
I
JH G
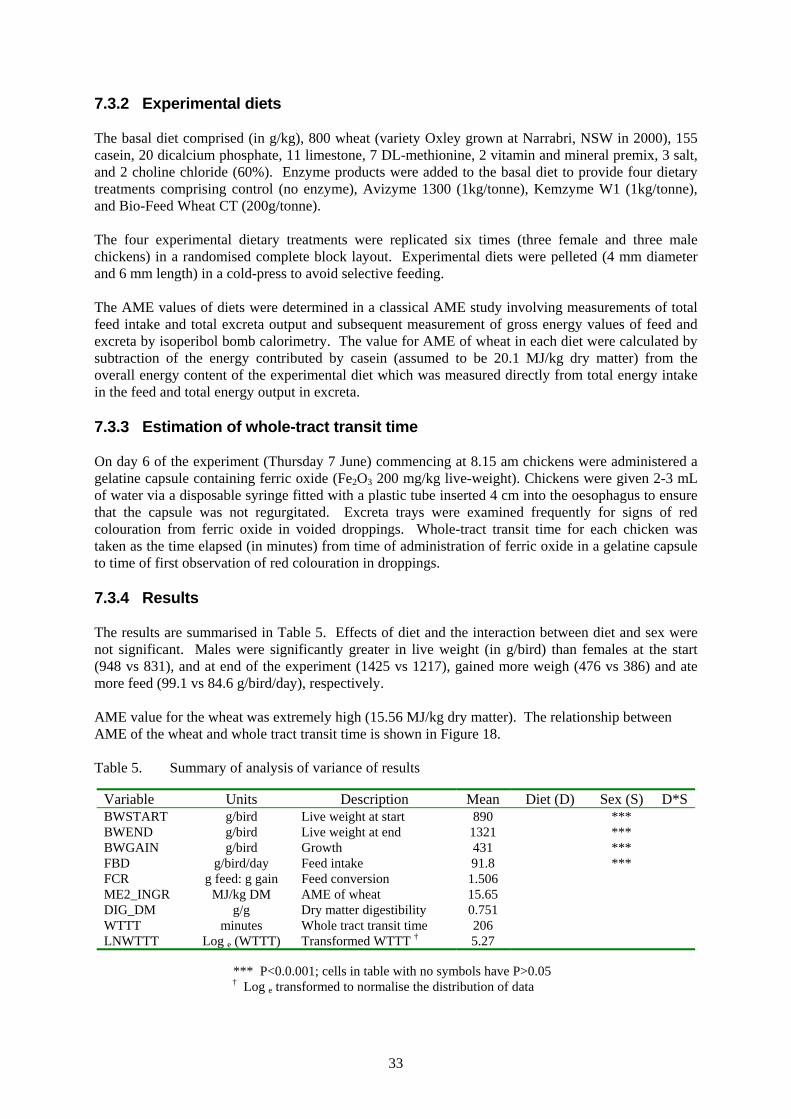
33
7.3.2 Experimental diets The basal diet comprised (in g/kg), 800 wheat (variety Oxley grown at Narrabri, NSW in 2000), 155 casein, 20 dicalcium phosphate, 11 limestone, 7 DL-methionine, 2 vitamin and mineral premix, 3 salt, and 2 choline chloride (60%). Enzyme products were added to the basal diet to provide four dietary treatments comprising control (no enzyme), Avizyme 1300 (1kg/tonne), Kemzyme W1 (1kg/tonne), and Bio-Feed Wheat CT (200g/tonne). The four experimental dietary treatments were replicated six times (three female and three male chickens) in a randomised complete block layout. Experimental diets were pelleted (4 mm diameter and 6 mm length) in a cold-press to avoid selective feeding. The AME values of diets were determined in a classical AME study involving measurements of total feed intake and total excreta output and subsequent measurement of gross energy values of feed and excreta by isoperibol bomb calorimetry. The value for AME of wheat in each diet were calculated by subtraction of the energy contributed by casein (assumed to be 20.1 MJ/kg dry matter) from the overall energy content of the experimental diet which was measured directly from total energy intake in the feed and total energy output in excreta. 7.3.3 Estimation of whole-tract transit time On day 6 of the experiment (Thursday 7 June) commencing at 8.15 am chickens were administered a gelatine capsule containing ferric oxide (Fe2O3 200 mg/kg live-weight). Chickens were given 2-3 mL of water via a disposable syringe fitted with a plastic tube inserted 4 cm into the oesophagus to ensure that the capsule was not regurgitated. Excreta trays were examined frequently for signs of red colouration from ferric oxide in voided droppings. Whole-tract transit time for each chicken was taken as the time elapsed (in minutes) from time of administration of ferric oxide in a gelatine capsule to time of first observation of red colouration in droppings. 7.3.4 Results The results are summarised in Table 5. Effects of diet and the interaction between diet and sex were not significant. Males were significantly greater in live weight (in g/bird) than females at the start (948 vs 831), and at end of the experiment (1425 vs 1217), gained more weigh (476 vs 386) and ate more feed (99.1 vs 84.6 g/bird/day), respectively. AME value for the wheat was extremely high (15.56 MJ/kg dry matter). The relationship between AME of the wheat and whole tract transit time is shown in Figure 18. Table 5. Summary of analysis of variance of results
Variable Units Description Mean Diet (D) Sex (S) D*S BWSTART g/bird Live weight at start 890 *** BWEND g/bird Live weight at end 1321 *** BWGAIN g/bird Growth 431 *** FBD g/bird/day Feed intake 91.8 *** FCR g feed: g gain Feed conversion 1.506 ME2_INGR MJ/kg DM AME of wheat 15.65 DIG_DM g/g Dry matter digestibility 0.751 WTTT minutes Whole tract transit time 206 LNWTTT Log e (WTTT) Transformed WTTT † 5.27
*** P<0.0.001; cells in table with no symbols have P>0.05
† Log e transformed to normalise the distribution of data

34
Figure 18. Relationship between AME of wheat and whole tract transit time 7.4 Discussion There was reasonable agreement between oro-caecal transit time determined by rise in breath hydrogen and whole tract transit time measured by appearance of ferric oxide marker in excreta. However, whole tract transit times were generally shorter than oro-caecal transit times. Possible explanations for this anomalous observation are (1) lactulose and ferric oxide move in a different manner through different sections of the alimentary tract, or (2) there is a pause when undigested carbohydrate reaches the caeca in fasted animals while bacterial fermentation gets under way. Males (Figure 16) tended to produce more hydrogen in breath than females (Figure 17) but there was no difference between males and females in either measure of rate of passage of digesta. The hydrogen profile for the female chicken represented by the square in Figure 17 shows a peak in hydrogen concentration at 165 minutes that is indicative of small bowel bacterial overgrowth (proliferation of facultative anaerobes in the small intestine). The first peak occurred well before appearance of ferric oxide in excreta. Methane was not detected in the breath from any chicken at any stage in contrast with results presented in section 6.3.3. The lack of response to enzymes by chickens given the wheat-based diet is probably due to the unusually high AME value of the wheat. Near infrared reflectance prediction of pig faecal digestible energy indicated a value of 15.96 MJ/kg dry matter for the wheat, which supports the measured AME value. Individual chickens with the highest AME values also had the longest whole tract transit times contrary to expectation. 7.5 Conclusions It may be possible to devise a non-invasive breath test for estimation of oro-caecal transit time without the need to dose chickens with lactulose. That is, gut microflora may produce enough hydrogen from normal levels of complex carbohydrates in commercial broiler feed. The AME value of wheat used in Experiment 2 was extraordinarily high; hence work should be repeated with wheat of lower energy to determine the importance of rate of passage of digesta on degree of completeness of digestion and absorption of nutrients.
y = 5E-06x2 - 0.001x + 15.653R2 = 0.3337
15.0
15.5
16.0
16.5
0 50 100 150 200 250 300 350 400 450 500
Whole tract transit time (minutes)
AM
E w
heat
(MJ/
kg d
ry m
atte
r)

35
8. Influence of gut microflora and sex on digestive function 8.1 Introduction Glycanase enzyme products depolymerise NSP thereby reducing the viscosity of digesta and, hence, the opportunity for proliferation of gut microflora (Choct et al., 1996). On a global scale, feed enzymes have proven to be a very effective tool for not only increasing the energy values of grains for poultry but also for improving the uniformity of growth and feed efficiency of broiler flocks. Despite the huge success of feed enzyme technology, questions remain about the specific modes of actions of enzymes (Smits and Annison, 1996; Williams, 1997), and why enzymes can reduce but do not eliminate variation in energy values for grains (Bedford, 1996; Kocher et al., 1997). It is plausible that some of the variation in AME remaining after treatment by exogenous enzymes is due to (1) small polymer fragments attaching to the gut epithelium, thereby interfering with absorption of nutrients, and (2) indigestible fragments acting as a food source for microflora. AME and ileal digestible energy (DE) values for a selection of samples of barley, oats, sorghum, triticale and wheat were measured in a series of five experiments (Hughes et al., 2001a). The results indicated a pattern for barley and oat samples in which AME exceeded ileal DE by about 0.4 MJ/kg, whereas for sorghum samples, ileal DE was approximately 0.3 MJ/kg higher than AME. Furthermore, the responses differed between males and females (results not shown). In particular, AME and DE values for barley were generally lower for males than females, whereas for sorghum, only the AME values were lower. These differences resulted in a widening of the gaps between AME and DE for males. There were no obvious patterns for wheat or triticale. Hughes et al. (2001a) concluded that for barley and oats, microbial proliferation in the hindgut utilised energy in the form of non-digestible carbohydrates which reduced the gross energy content of the excreta when volatile fermentation products were lost, as discussed by Choct (1999). In the case of sorghum, there was little loss of energy through microbial proliferation in the hindgut, and the difference between DE and AME represented endogenous energy losses. Fundamental differences between males and females in overall energy metabolism, irrespective of breed of the chicken, were noted in Chapter 3. The conclusions were that sex effects might be associated with differences in energy costs to repair and maintain the gut, endogenous losses, or responses to inflammatory effects of microflora. This chapter examines further the effects of the gut microflora and the sex of the chicken on digestion of energy from cereal grains. Hydrogen and methane breath testing was used as a non-invasive way of gauging the metabolic activity of the gut microflora. 8.2 Glycanase activity of gut microflora in chickens given wheat and barley diets (Experiment 1) 8.2.1 Introduction Recently, Choct and Kocher (2000) concluded that between-bird variation in AME was associated with the ability of gut microflora to produce xylanase that degraded NSP and lowered viscosity of excreta. These results led to the hypothesis that expression of genes for xylanase and ß-glucanase was increased in gut bacteria by the presence of high concentrations of arabinoxylans and ß-glucans in wheat and barley, and that excreta viscosity was an indicator of microbial enzyme activity. This hypothesis was tested in the following experiment

36
8.2.2 Birds, housing and management Ross chickens were obtained from the Bartter Steggles hatchery, Cavan SA 5094 on Thursday 18 November 1999 and raised from hatch to 18 days of age in floor pens in a controlled temperature room. Male and female chickens were reared separately. All birds were given commercial starter crumbles (Ridley Agriproducts, diet code #503540, Steg 600 starter). On Monday 6 December, chickens were transferred in pairs to 96 single-bird metabolism cages located in a controlled-temperature room kept at 25-27oC initially, and given commercial starter crumbles (Ridley Agriproducts, diet code #503540, Steg 600 starter) for 2-3 days while they adapted to the cages. On Thursday 9 December, one bird was removed from each of the first 48 cages. The 48 chickens remaining were weighed, and then returned to the cage. Chickens had free access to the experimental diet (Table 6) and water throughout the study. These chickens were killed on day 7 for digesta and tissue samples. Chickens in the other 48 cages received the same treatment starting on Friday 10 December and finishing on Friday 17 December. 8.2.3 Experimental diets and AME measurement Table 6. Composition of the basal diet
Ingredient g/kg Grain (wheat or barley) 700.0 Meat and bone meal 76.0 Soybean meal 170.0 Vegetable oil 40.0 Sodium chloride 2.5 L-lysine HCl 2.5 DL-methionine 3.0 Vitamin and mineral premix with millrun diluent 5.0 Choline chloride (60%) 0.8 Hydrocarbon marker (hexatriacontane C36H74) 0.2
Dr Mingan Choct (UNE) supplied the wheat. Prior AME testing of a sub-sample of this wheat at PPPI indicated that it was a low-AME sample at that time. The wheat was kept in cold storage prior to use in this experiment. Similarly, a barley sample known to be low in AME was chosen from the collection of grains used in GRDC Premium Grains for Livestock Program. The long chain hydrocarbon marker was dissolved in warm vegetable oil then slowly added to the bulk of the ingredients in a mixer. The diet was cold pressed into pellets approximately 6 mm in length. The AME value of the experimental diets was determined in a conventional energy balance study involving measurements of total feed intake and total excreta output and subsequent measurement of gross energy (GE) values of feed and excreta by isoperibol bomb calorimetry (Parr Instrument Company). 8.2.4 Collection and measurement of digesta and excreta On day 5 of the metabolism study, fresh excreta (12 g) samples were collected on plastic sheets placed in the excreta collection trays for 1-2 hours. Approximately 10 g samples were weighed in tared plastic screw-cap jars, treated with 0.5 M sulphuric acid (0.5 mL per g excreta), then securely sealed in a plastic jar to prevent loss of volatile fatty acids, and kept on ice until placed in a freezer at -20oC. Approximately 2 g fresh excreta samples was placed in untared tubes and centrifuged at 12,000 g for 12 minutes at 4oC. Viscosity of supernatant was determined on 0.5 mL of supernatant using a Brookfield DVIII model viscometer at 25oC with a CP40 cone and shear rate of 5-500 s-1.

37
At the end of the 7-day metabolism study, each chicken was weighed then killed by intravenous injection of pentobarbitone. The ileum, from 1cm below Meckel’s diverticulum to 4cm above the ileo-caecal junction, and the caeca was dissected. Approximately 3 g ileal digesta was weighed in a tared centrifuge tube, and stored on ice pending viscosity measurement of fresh supernatant. 8.2.5 Results Male chickens were significantly heavier than females at the start of the experiment (938 vs 827 g/bird), ate more feed (108 vs 95 g/bird), and gained more weight (381 vs 342 g/bird) but did so less efficiently (2.12 vs 1.98 g feed: g gain) and had a lower dietary AME value (13.4 vs 13.8 MJ/kg DM). There were no differences due to sex in viscosity of ileal digesta (24.8 cP) or viscosity of fresh excreta (7.8 cP). Chickens given the barley diet ate less feed (94 vs 109 g/bird), gained less weight (291 vs 432 g/bird), converted less efficiently (2.32 vs 1.78 g feed: g gain) and obtained a lower dietary AME value (12.4 vs 14.8 MJ/kg DM) than chickens given the wheat diet. As would be expected, ileal digesta viscosity was much higher in chickens given barley compared with wheat (30 vs 19 cP) but excreta viscosity (7.8 cP) was not significantly affected by diet, although the value for wheat was numerically greater than that for barley (8.6 vs 7.1 cP). The grain by sex interaction was significant for live weight gain, feed conversion ratio, and dietary AME. For weight gain there was no difference due to sex for chickens given the barley diet (291 g/bird) whereas males given the wheat diet were significantly heavier than females (466 vs 397 g/bird). In contrast, feed conversion (1.78 g feed: g gain) and AME (14.8 MJ/kg DM) were unaffected by sex of chicken given wheat whereas there were large differences in favour of females given barley for feed conversion (2.16 vs 2.48 g feed: g gain) and AME (12.8 vs 12.0 MJ/kg DM). There were no significant statistical relationships between AME and excreta viscosity in contrast to the earlier work of Choct and Kocher (2000). However, there was an interesting relationship between AME and the difference between viscosities of ileal digesta and fresh excreta (Figure 19). The data for acetic acid and butyric acid concentrations in excreta were so highly skewed that it was not possible to transform these sufficiently to conduct analysis of variance. The raw data are plotted in Figure 20. 8.2.6 Discussion An increase in viscosity of excreta relative to viscosity of ileal digesta (Figure 19) is indicative of microbial production of xylanases capable of cleaving insoluble NSP in wheat but not barley. Clearly, this response was not evident in all chickens given the wheat diet. Also, production of acetic and butyric acids differed widely between male and female chickens and between wheat and barley diets (Figure 20). If these observations are indicative of changes in the profiles of bacterial populations in these chickens then it follows that variation in production of microbial enzymes could contribute to the variability in energy uptake by birds through mechanisms associated with the effects of digesta viscosity on digestion and absorption of nutrients (Smits et al., 1997; Williams, 1995), use of nutrients from digesta to support microbial proliferation (Hughes et al., 2001b), and effects on gut motility and rate of passage of digesta through the gut (Tivey and Butler, 1999).

38
Figure 19. Association between AME (MJ/kg DM) of diet and increase in viscosity as digesta pass
through the caeca
0
50
100
150
200
250
300
350
1 2 3 4 5 6 7 8 9 1011121314151617181920212223242526272829303132333435363738394041424344454647484950515253545556575859606162636465666768697071727374757677787980818283848586878889909192
Replicates within diet and sex
Con
cent
ratio
n (m
icro
mol
es p
er g
)
Acetic acid Butyric acid
Wheat Barley
Female Male Female Male
Figure 20. Concentrations of acetic acid and butyric acid in fresh excreta. Data are sorted by acetic
acid concentration within each combination of grain type and sex of chicken. Each bar represents results from one chicken.
8
10
12
14
16
18
-40 -20 0 20 40 60 80Change in viscosity (ileal viscosity minus excreta viscosity)
AM
E
All chickens showingan increase in viscosity were
given wheat
Increase in viscosity Decrease in viscosity
All chickens given barley and some given wheat showed a decrease in viscosity

39
8.2.7 Conclusions Viscosity of excreta is a poor predictor of the AME value of the diet. An increase in viscosity of excreta relative to viscosity of ileal digesta is indicative of microbial production of xylanases capable of cleaving insoluble NSP in wheat but not barley. Hence, synthesis of microbial enzymes could add to the variability in energy uptake by birds through the mechanisms associated with the effects of digesta viscosity on digestion and absorption of nutrients, and any effects on gut motility and rate of passage of digesta through the small intestine 8.3 Metabolic activity of gut microflora of chickens given a diet based on low AME wheat (Experiments 2 and 3) 8.3.1 Introduction Fundamental differences between male and female chickens in overall energy metabolism and in morphology of the small intestine were described in Chapter 3. The main conclusion from this work was that differences between males and females were related to differences in the cost of energy to repair and maintain the gut, endogenous losses, or in responses to inflammatory effects of microflora. The influence of gut microflora on energy metabolism of chickens given a diet based on low AME wheat in the presence and absence of exogenous glycanase enzymes was investigated further in two experiments. 8.3.2 Experimental procedures The details for Experiment 1 are described in Chapter 4. A total of 24 Cobb and 24 Ross chickens were used in this experiment. These chickens were 22 or 23 days of age at the start of this 7-day metabolism study. A total of 24 Ross chickens were used in Experiment 2. The chickens were obtained from the Bartter Steggles hatchery, Cavan SA 5094 on Thursday 6 July 2000 and raised from hatch to 12 days of age in two rearing pens in a controlled temperature room. Male and female chickens were reared separately. All birds were given commercial starter crumbles (Ridley Agriproducts, diet code #503540, Steg 600 starter). On Tuesday 18 July, chickens were transferred in pairs to 24 single-bird metabolism cages located in a controlled-temperature room kept at 25-27oC initially, and given starter crumbles (Ridley Agriproducts, diet code #503540, Steg 600 starter) for 3 days while they adapted to the cages. On Thursday 20 July, one bird was removed from each of the 24 cages. These chickens were 15 days of age at the start of the 7-day metabolism study. The composition of the basal diet used in both experiments is shown in Table 6 in this Chapter. The basal diet was fed to each chicken in Experiment 1. The two diets used in Experiment 2 were the basal diet as a control and the basal diet supplemented with a feed enzyme product (Avizyme 1302 added at 500 g/tonne). Each chicken in both experiments was breath tested on days 0 and 6 of the 7-day study period as per the procedures described in Chapter 6. 8.3.3 Results Hydrogen and methane concentrations in breath were highly variable in both experiments. Individual data points for male and female chickens of the two different breeds used in Experiment 1 are shown in Figure 21 and Figure 22, respectively. Breath hydrogen concentration was unaffected by sex or breed of the chicken.

40
0
50
100
150
200
250
Replicates (n = 12) sorted within breed and sex
Bre
ath
hydr
ogen
(ppm
)Breed #1 Breed #2
Female Male Female Male
Figure 21. Hydrogen concentration in breath samples taken on day 6 from chickens given a low
AME wheat diet for seven days. Each bar in the figure is the result for one chicken in Experiment 1.
-4
-3
-2
-1
0
1
2
3
4
5
Replicates (n = 12) sorted within breed and sex
Bre
ath
met
hane
(ppm
)
Breed #1 Breed #2
Female Male Female Male
Figure 22. Change in methane concentration in breath from day 0 to day 6 in chickens given a low
AME wheat diet for seven days. Each bar in the figure is the result for one chicken in Experiment 1.

41
There was no significant relationship between AME and breath hydrogen concentration on day 6 of the 7-day feeding but the relationship between feed conversion ratio and breath hydrogen was highly significant (Figure 23). Growth rate and breath hydrogen were negatively correlated but the relationship was not as strong (R2=0.15) as that for feed conversion.
0.5
1.0
1.5
2.0
2.5
3.0
0 1 2 3 4 5 6Log e (breath hydrogen in ppm)
FCR
Y = 2.292 - 0.432X+ 0.091X2
R 2 = 0.44, P < 0.001, n = 48
Figure 23. Relationship between feed conversion ration (FCR) and hydrogen concentration in
samples taken on day 6 from chickens given a low AME wheat diet for seven days. Each point in the figure is the result for one chicken.
8.3.3.1 Experiment 2 Males ate more feed (82.0 vs 70.1 g/bird/day), gained weight at a faster rate (662 vs 599 g/kg), and converted more efficiently (1.59 vs 1.65) than females, but there were no statistical differences due to sex in AME, dry matter digestibility or excreta moisture during the 7-day study. Addition of enzyme to the diet significantly improved AME (15.53 vs 15.19 MJ/kg dry matter), dry matter digestibility (0.765 vs 0.747), and excreta moisture (64.4 vs 68.8%). Responses to enzyme in growth (48.6 vs 45.9 g/bird/day) and feed conversion (1.59 vs 1.65) approached significance. The effect of the enzyme by sex interaction was significant for AME of the diet. Enzyme significantly lifted AME for males (15.0 vs 15.7 MJ/kg DM) but there was no response in females (15.3 vs 15.4 MJ/kg DM). Females had significantly higher concentrations of hydrogen in breath on day 0 than males (91 vs 49 ppm). On day 6, females tended (P=0.06) to have a higher concentration of hydrogen in breath than males (64 vs 39 ppm) The change in breath hydrogen from day 0 to day 6 tended to be greater in females than males (-35 vs 17 ppm). There were no significant linear relationships between AME, feed intake or growth and hydrogen on day 6, or with change in hydrogen over a 6-day period. Seven of the 24 chickens used in the study had no detectable methane in breath at the commencement of the study (day 0). However, all 24 chickens produced methane on day 6. In a separate experiment conducted at PPPI (but not included in this report), all birds had methane in the breath prior to the start of the 7-day metabolism study involving commercial feed but only one bird (female) was expiring methane at the end.

42
8.3.4 Discussion It was clearly evident from the results of Experiment 1 that gut microflora competed for energy and possibly other nutrients thus slowing the rate of growth and reducing feed efficiency. The possibility that undigested carbohydrate leaving the small intestine was fermented to volatile products such as short-chain fatty acids also in a variable manner, like hydrogen and methane production, needs further study. In Experiment 2, there were no significant relationships between AME, feed intake or growth and hydrogen on day 6, or with change in hydrogen over a 6-day period. That is, in contrast to results in Experiment 1, there was no indication that microflora competed for energy. Despite appreciable improvements in AME, growth, feed conversion and excreta condition due to addition of enzymes to the diet, there were no effects of enzyme on hydrogen or methane concentrations in breath after 6 days in Experiment 2. The difference between females and males in change in breath hydrogen over a 6-day period is supportive of earlier conclusions that metabolic activity of gut microflora is sex-dependent. Metabolic activities of microflora, as indicated by breath hydrogen and methane, appeared to be independent of enzyme addition to the feed. The lack of effect of enzyme might be due to the nature of the enzyme product that acts mainly through viscosity reduction of the digesta by degradation of solubilised NSP rather than through release of plant cell wall material by in situ degradation of NSP. This aspect is worthy of further investigation. 8.3.5 Conclusions The observations in regard to expiration of hydrogen and methane point to remarkably different metabolic activities of gut microflora in birds reared on starter diets with the same nutrient specifications (but not necessarily the same ingredient composition), and to highly variable diet-dependent changes in activities in individual birds during each experiment which differed according to sex of the chicken. Bacterial overgrowth of the gut is likely to have detrimental effects in addition to significant losses of nutrients. Microbial proliferation could ultimately lead to health problems through general inflammation of the gut, and invasion of tissue by organisms pathogenic to the bird or to humans consuming contaminated carcasses. 8.4 Effects of age of chicken and exogenous enzymes on AME and metabolic activity of gut microflora of chickens given wheat and barley diets (Experiment 4) 8.4.1 Introduction The gut of the newly hatched broiler chicken is virtually free of bacteria (Yamauchi et al., 1990) and relatively immature in terms of absorptive capacity compared with older animals (Jin et al., 1998; Uni et al., 1999). Shortly after hatching, chickens ingest ubiquitous bacteria that colonise the gut. In addition to maturation of the intestinal function in the first two weeks of life (Vieira and Moran, 1999), it is likely that the metabolic activity of the gut microflora will also change in response to ingestion of organisms, some of which could be pathogenic to poultry, and to ingestion of various types and amounts of carbohydrate in the diet. Wheat and barley contain indigestible, soluble NSP such as β-glucanase and arabinoxylan that form gels in the gut and impede the rate of passage of digesta. Previous work by Choct et al. (1996) showed that NSP from wheat promoted an increase in viscosity of digesta that led to bacterial overgrowth of the small intestine. Addition of glycanases to the diet to degrade NSP prevented the increase in viscosity and subsequent bacterial overgrowth.

43
The purpose of this experiment was to examine the effects of age of chicken on AME and changes in metabolic activity of gut microflora as indicated by hydrogen and methane in breath sampled before and after feeding of diets based on wheat and barley with and without feed enzymes. 8.4.2 Birds, housing and management Ross broiler chickens weer obtained from the Bartter Steggles hatchery, Cavan SA 5094 on Thursday 11 January 2001. Chickens were raised from hatch in two rearing pens in a controlled temperature room. Male and female chickens were reared separately. All birds were given commercial starter crumbles (Ridley Agriproducts, diet code #503540, Steg 600 starter). On Friday 26 January, chickens were transferred in groups of five to 24 metabolism cages located in a controlled-temperature room kept at 25-27oC initially, and given finisher pellets (Ridley Agriproducts, diet code #503540, Steg 600 starter) for 3 days while they adapted to the cages. One chicken in each pen was selected at random, weighed, and identified by a leg-band for subsequent breath testing on days 0 and 6 of the 7-day experimental period. The above procedures were repeated commencing on Friday 2 February and Friday 9 February 2001 with new cohorts of chickens taken from the original rearing groups housed in floor pens. 8.4.3 Experimental procedures The AME values of the experimental diets were determined in a conventional energy balance study involving measurements of total feed intake and total excreta output and subsequent measurement of gross energy (GE) values of feed and excreta by isoperibol bomb calorimetry (Parr Instrument Company). The basal diets comprised (in g/kg), 800 new season wheat or barley (Janz or Chebec cultivars, respectively, grown on the Roseworthy Campus), 152 casein, 20 dicalcium phosphate, 11 limestone, 7 DL-methionine, 5 vitamin and mineral premix, 3 salt, and 2 choline chloride (60%). Enzyme product provided by Kemin Australia Pty Ltd was added to each basal diet at the rate of 1000 g/tonne to provide a total of four dietary treatments. Each dietary treatment was allocated to three cages of male chickens and three cages of female chickens in a randomised complete block design. Weighed experimental diet was given on day 0 after breath sampling was completed. The first three days enabled the chickens to adapt to the feed. Feed intake was measured during this period. During the following four days feed intake was measured and all excreta collected and dried daily. Moisture content of excreta collected on day 5 of the metabolism study was measured. Birds were weighed at the start and end of the 7-day period. The value for AME of wheat in each diet was calculated by subtraction of energy contributed by casein (assumed to be 20.1 MJ/kg dry matter) from the overall energy content of the experimental diet which was measured directly from total energy intake in the feed and total energy output in excreta. Breath samples were collected from the selected commencing at 8.30 am on days 0 and 6 of each of the 7-day metabolism studies. A breath sample was taken 15 seconds after a prototype helmet (50 mm diameter) was placed over the head of the chicken as per the procedures described previously.

44
60
70
80
90
100
110
120
2 3 4Age of chicken (in weeks) at start of experiment
Feed
inta
ke (g
/bird
/day
)Barley control diet
Barley enzyme diet
Wheat control diet
Wheat enzyme diet
Figure 24. Effects of age of chicken, grain type and addition of enzyme to the diet on feed intake.
200
250
300
350
400
450
2 3 4Age of chicken (in weeks) at start of experiment
Wei
ght g
ain
(g/b
ird) Barley control diet
Barley enzyme dietWheat control dietWheat enzyme diet
Figure 25. Effects of age of chicken, grain type and addition of enzyme to the diet on weight gain.
1.2
1.6
2.0
2.4
2.8
2 3 4Age of chicken (in weeks) at start of experiment
Feed
con
vers
ion
ratio
Barley control dietBarley enzyme dietWheat control dietWheat enzyme diet
Figure 26. Effects of age of chicken, grain type and addition of enzyme to the diet on feed
conversion.

45
8.4.4 Results Males were significantly greater in live weight (in g/bird) than females at 2 weeks (530 vs 506), 3 weeks (1074 vs 918), and 4 weeks of age (1534 vs 1452), respectively. The response to enzymes was greater in the barley diet than in the wheat diet for each age of chicken for feed intake (Figure 24), live weight gain (Figure 25), and feed conversion (Figure 26). The AME value of the wheat diet was greater than barley for each age of chicken, and the response to enzymes increased as chickens aged (Figure 27). Hydrogen (114 ppm) and methane (32 ppm) concentrations in breath at the start of each 7-day metabolism experiment did not differ with age of the chickens. However, at the end of each 7-day period hydrogen and methane concentrations in breath (Figure 28 and Figure 29, respectively) were highest in the oldest chickens. Hydrogen concentration in breath at the end of each 7-day experiment was significantly affected by the interaction between age and enzymes. For the youngest chickens, enzymes increased the hydrogen concentration but decreased it in subsequent age groups (Figure 28). In addition, enzymes reduced the concentration of hydrogen in breath of chickens given barley but not in those given wheat (Figure 28). 8.4.5 Discussion These results are consistent with a greater flow of undigested carbohydrate into the caeca as indicated by significant reductions with age in AME (Figure 27). However, there appear to be factors other than increase in hydrogen concentration per se involved in the reduction of AME and dry matter digestibility, judging by the larger increase in hydrogen in 3-week old chickens given wheat compared with barley (Figure 9). Hydrogen in breath prior to the feeding of experimental diets was higher in older chickens but methane content did not change with age of chicken. The observations in this experiment support the conclusion from Experiments 2 and 3 above that remarkably different metabolic activities of gut microflora can occur in birds reared on starter diets with the same nutrient specifications (but not necessarily the same ingredient composition). There were large increases in hydrogen and methane in breath from older chickens after consuming experimental diets for one week which point to an increase in the proportion of carbohydrate escaping digestion in the small intestine to fuel bacterial proliferation in the caeca. 8.4.6 Conclusions Initial colonisation of the gut by microflora soon after hatch may have a significant bearing on the subsequent productivity and health of chickens during the growth period depending on the types and amounts of carbohydrate in the diet, and how that carbohydrate is utilised by the chicken. This aspect is explored further in the following section.

46
12
13
14
15
16
17
2 3 4Age of chicken (in weeks) at start of experiment
AME
(MJ/
kg d
ry m
atte
r)
Barley control diet Barley enzyme diet
Wheat control diet Wheat enzyme diet
Figure 27. Effects of age of chicken, grain type and addition of enzyme to the diet on AME of the
diet.
0
50
100
150
200
250
300
2 3 4Age of chicken (in weeks) at start of experiment
Hyd
roge
n (p
pm)
Barley control dietBarley enzyme dietWheat control dietWheat enzyme diet
Figure 28. Effects of age of chicken, grain type and addition of enzyme to the diet on hydrogen
concentration in breath on day 6.
0
20
40
60
80
2 3 4Age of chicken (in weeks) at start of experiment
Met
hane
(ppm
)
Barley control diet
Barley enzyme diet
Wheat control diet
Wheat enzyme diet
Figure 29. Effects of age of chicken, grain type and addition of enzyme to the diet on methane
concentration in breath on day 6.

47
8.5 Effects of antibiotic in the feed on the site of digestion of carbohydrate (Experiment 5) 8.5.1 Introduction AME and ileal DE values for a selection of samples of barley, oats, sorghum, triticale and wheat were measured in a series of five experiments as part of the GRDC Premium Grains for Livestock Program (Hughes et al., 2001a). The results (Figure 30) indicated a pattern for barley and oat samples in which AME exceeded ileal DE by about 0.4 MJ/kg, whereas for sorghum samples, ileal DE was approximately 0.3 MJ/kg higher than AME. Furthermore, the responses differed between males and females (results not shown). In particular, AME and DE values for barley were generally lower for males than females, whereas for sorghum, only the AME values were lower. These differences resulted in a widening of the gaps between AME and DE for males. There were no obvious patterns for wheat or triticale. Hughes et al. (2001a) concluded that for barley and oats, microbial proliferation in the hindgut utilised energy in the form of non-digestible carbohydrates that reduced the gross energy content of the excreta when volatile fermentation products were lost, as discussed by Choct (1999). In the case of sorghum, there was little loss of energy through microbial proliferation in the hindgut, and the difference between DE and AME represented endogenous energy losses.
Figure 30. Ileal DE (MJ/kg dry matter) and faecal AME (MJ/kg dry matter) values for cereal grains fed to broiler chickens for seven days commencing at 22 days of age. From Hughes et al. (2001a).
If microbial overgrowth of viscous digesta in the small intestine can be avoided by use of feed enzymes in order to reduce variation in energy metabolism, then therapeutic use of antibiotics in the feed should have a similar effect by reducing the population of gut bacteria. This hypothesis was tested in the following experiment. Hydrogen content of breath was measured on days 0 and 6 to gauge the metabolic activity of the gut microflora.
11
12
13
14
15
16
17
1 3 5 7 9 11 13 15 17 19 21 23 25 27 29 31 33 35 37 39Grains
DE
and
AM
E
Ileal DE
AME diet
Barley Sorghum WheatOat Triticale

48
8.5.2 Experimental procedures Ross broiler chickens were obtained from the Bartter Steggles hatchery, Cavan SA 5094 on Thursday 9 March 2000. Chickens were raised from hatch to 22 days of age in two floor pens in a controlled temperature room. Male and female chickens were reared separately. All birds were given commercial starter crumbles (Ridley Agriproducts, diet code #503540, Steg 600 starter). At 22 days of age, chickens were transferred in weighed, single-sex groups of six to 48 metabolism cages located in a controlled-temperature room kept at 25-27oC initially. Chickens had free access to the experimental diets (Table 7) and water throughout the study.
Table 7. Composition of the experimental basal diets Ingredient g/kg Cereal grain (sorghum, barley, triticale or wheat) 773 Casein 152 Dicalcium phosphate 20 Limestone 11 Sodium chloride 3 DL-methionine 7 Vitamin and mineral premix 2 Choline chloride (60%) 2 Digestibility marker (Celite) 30
The grains were barley (control FG96B.3815), sorghum (FG99S.7832; Sorghum 99 ex PPPI)), triticale (frosted FG98T.6805) and wheat (low AME, LS97W.1906). Emtryl (500 ppm) and Lincospectin (44 ppm) were included in the premix of ingredients for the antibiotic treated diets. Each of the eight experimental diets was replicated six times (three groups of female and three groups of male chickens). The AME values of the experimental diets were determined in a conventional energy balance study involving measurements of total feed intake and total excreta output and subsequent measurement of gross energy values of feed and excreta as per the procedures described in previous sections. One chicken in each cage was selected at random and tagged for repeated breath testing on days 0 and 6 of the 7-day study. A breath sample was taken 30 seconds after a prototype helmet was placed over the head of the chicken and held firmly against the shoulders as per the procedures described in previous sections. At the end of the 7-day metabolism study, three chickens from each cage were weighed then killed by intravenous injection of pentobarbitone. The ileum (from 1 cm below Meckel's diverticulum to 4 cm above the ileo-caecal junction) was dissected from each bird. lleal digesta were pooled and stored on ice. Ileal digesta was centrifuged for viscosity measurement of fresh supernatant. Then samples were re-constituted, frozen and stored at -20oC pending analyses to determine GE, starch and acid-insoluble ash digestibility marker for calculation of ileal DE and starch digestibility. 8.5.3 Results The data were re-analysed with a simpler linear statistical model (results shown in Table 8) because the 2-way interaction between antibiotic treatment and sex, and the 3-way interaction between grain, antibiotic and sex were not significant at the 5% level.

49
Table 8. Reduced model analysis of variance of data
Variable Mean Grain (G) Antibiotic (A) Sex (S) G x A G x S FBD 98.7 *** *** 0.10 AVEBWTGN 336 *** *** ** 0.09 * GAINRATE 0.360 *** *** ** FCR 2.108 *** *** *** *** *** ME2_DIET 12.70 *** *** *** ME2_INGR 12.61 *** *** *** DIG_DM 0.617 *** *** *** ILEALDE 13.48 *** AME_GE 0.690 *** *** *** DE_GE 0.731 *** DE_AME 1.064 * 0.10 LNVISLN 87.2 *** EXMOIST 73.6 *** * H2D6LN 3.40 *** ** DELH2LN 8.83 ** *
* P<0.05, ** P<0.01, *** P<0.001 -- numerical values are shown where 0.10>P>0.05
Table 9. Description of variables in summary of analysis of variance in Table 8
Variable Units Description FBD g feed/bird/day Feed intake AVEBWTGN g/bird Average live weight gain of chickens in 7 days GAINRATE g/kg Rate of gain of live weight of chickens FCR g feed: g gain Feed conversion ratio ME2_DIET MJ/kg Apparent metabolisable energy (AME) of diet ME2_INGR MJ/kg Apparent metabolisable energy (AME) of grain DIG_DM Dry matter digestibility coefficient ILEALDE MJ/kg Ileal digestible energy (DE) of diet AME_GE AME to gross energy ratio DE_GE Ileal DE to gross energy ratio DE_AME DE to AME ratio LNVISLN log e (100 * log e cP) Log e transformation of (100 x log e ileal viscosity) EXMOIST % Moisture content of excreta voided in 24-hour period H2D6LN Log e (H2D6+1) Log e of breath hydrogen concentration at day 6 DELH2LN Log e (DELH2+200) Log e of change in breath hydrogen from days 0 to 6

50
10
11
12
13
14
15
16
17
18
No Yes No Yes No Yes No Yes
Sorghum Sorghum Barley Barley Wheat Wheat Triticale Triticale
Ener
gy v
alue
(MJ/
kg D
M) AME DE
Grain x antibiotic, P > 0.05
Figure 31. Effects of grain and antibiotic on AME and ileal DE expressed as a proportion of gross
energy (GE) (means ± standard deviations).
200
250
300
350
400
450
500
No Yes No Yes No Yes No Yes
Sorghum Sorghum Barley Barley Wheat Wheat Triticale Triticale
Wei
ght g
ain
(g/b
ird)
No = No antibiotic Yes = Antibiotic
P = 0.051
P < 0.001
P = 0.10NS
Grain x antibiotic, P = 0.09
Figure 32. Effects of grain and antibiotic on live weight gain (means ± standard deviations).
1.00
1.40
1.80
2.20
2.60
3.00
No Yes No Yes No Yes No Yes
Sorghum Sorghum Barley Barley Wheat Wheat Triticale Triticale
FCR
(fee
d to
gai
n ra
tio)
No = No antibiotic Yes = Antibiotic
P < 0.01P < 0.001
P < 0.05 P = 0.10 0.10
Grain x antibiotic, P < 0.001
Figure 33. Effects of grain and antibiotic on feed conversion ratio (means ± standard deviations).

51
The inclusion of antibiotics in the feed did not significantly affect AME values for the diet or the cereal grain, ileal DE, or AME and DE as fractions of gross energy (GE) of the diets (Table 8 and Figure 31). However, antibiotic treatment significantly affected live weight gain and feed conversion, but not feed intake (Table 8). Antibiotic treatment improved weight gain for each cereal type except triticale (Figure 32) and feed conversion for each cereal type (Figure 33). The effects of antibiotic treatment on metabolic activity of the microflora as indicated by breath hydrogen measurements differed across grain types (Table 8). Antibiotic treatment resulted in an increase in hydrogen production in chickens given sorghum but a decrease in chickens given barley (Figure 34) compared with the respective control diets. Feed conversion, live weight gain and energy uptake on different cereal grains were significantly influenced by the sex of the chicken (Table 8). As might be expected, males ate more feed and grew faster than females on the same grain type, but converted less efficiently than females when given sorghum, barley or wheat diets (Figure 35). Male chickens had significantly lower AME values than females when given barley and wheat diets (0). Ileal DE values for wheat tended (P=0.07) to be lower for males than females (0). 8.5.4 Discussion The lack of a significant difference (at the 5% level) in the DE:GE ratio between males and females on sorghum, barley, wheat and triticale diets (0) implies that digestive and absorptive processes in the small intestine were unaffected by the sex of the chicken, at least in this experiment. On the other hand, male chickens had significantly lower AME values than females when given barley and wheat diets (0). However, the differing effects of sex on DE and AME values of these grains strongly imply that post-intestinal processes and events associated with gut microflora were affected by the sex of the chicken. This poses questions as to what occurs at an organ or cellular level that enables the gut microflora to change so radically in terms of numbers, species or activities according to the nature of the feed consumed and the sex of the host animal. Antibiotic treatment resulted in an increase in hydrogen concentration in breath of chickens given sorghum but a decrease in chickens given barley (Figure 34) compared with the respective control diets. Differences in the amounts of hydrogen produced are indicative of changes in the numbers and/or species of bacteria in the gut population, and/or changes in the metabolic activities of those bacteria. Furthermore, these changes in hydrogen concentration in response to antibiotics were also dependent on the type of grain used in the diet. Presumably, the differential flow of undigested nutrients into the hindgut created different growth media for those hydrogen-producing species of bacteria surviving antibiotic treatment. It is also evident from these results that antibiotics did not bridge the gap between AME and DE values. 8.5.5 Conclusions The influence of gut microflora on the nutritive value of different cereal grains is at least partially dependent on the sex of the chicken. That is, there is circumstantial evidence of “communication” between the host and gut microflora that has a differential effect on metabolic activity of the bacteria, and possibly the host tissue, also. Alteration of the balance between the host and resident microflora (by feeding different grains, enzymes, antibiotics, prebiotics, probiotics and other feed additives) is likely to result in outcomes that are difficult to predict. A fuller understanding of the role of the gut microflora is required. This is a necessary step towards being able to control the colonisation of the gut in newly hatched chicks and to maintain an ideal microflora for the life of the bird, which will be beneficial for the health, welfare and performance of commercial flocks.

52
Figure 34. Effects of grain and antibiotic on change in hydrogen concentration in breath from day 0 to day 6 of the 7-day metabolism study (means ± standard deviations).
Figure 35. Effects of grain and sex of chicken feed conversion ratio (means ± standard deviations).
Figure 36. Effects of grain and sex of chicken on AME and ileal DE (means ± standard deviations).
1.00
1.40
1.80
2.20
2.60
3.00
F M F M F M F M
Sorghum Sorghum Barley Barley Wheat Wheat Triticale Triticale
FCR
(fee
d to
gai
n ra
tio)
P < 0.01
P < 0.001
P < 0.05 NS
F = Female M = MaleGrain x sex, P < 0.001
-80
-40
0
40
80
No Yes No Yes No Yes No Yes
Sorghum Sorghum Barley Barley Wheat Wheat Triticale Triticale
Log
e (hy
drog
en +
200
) in
ppm
No = No antibiotic Yes = Antibiotic
Grain x antibiotic, P < 0.01
P = 0.08 P < 0.05 NS NS
10
11
12
13
14
15
16
17
18
AME DE AME DE AME DE AME DE
Sorghum Sorghum Barley Barley Wheat Wheat Triticale Triticale
Ener
gy v
alue
(MJ/
kg D
M) Female Male
P < 0.001
P < 0.001
P = 0.07
Grain x sex, P < 0.001 for AMEand P > 0.05 for DE

53
9. General discussion A diet for broiler chickens that provides the nutrients essential for maintenance and growth of the flock as a whole may also have other chemical and physical properties that are detrimental to the processes of ingestion, digestion, absorption, transport and utilisation of nutrients (Hughes and Choct, 1999). The Australian chicken meat industry is highly dependent on supply of energy from cereals such as wheat and barley that are known to vary widely in apparent metabolisable energy (Choct, 1999). In contrast, sorghum is generally assumed to be a relatively consistent source of energy. To date, triticale has proven to be a relatively reliable source of energy not subject to the low AME phenomenon observed in some samples of wheat (Hughes and Cooper, 2002). Cereal grains are a major source of anti-nutritive components that are likely to have a significant bearing on how effectively all dietary components are utilised by poultry. Of the known causes of variation in energy value of grains, soluble NSP stands out as a major determinant of the availability of energy and other nutrients (Hughes and Choct, 1999). One of the modes of action of soluble NSP is to form a viscous gel in the gut, which in turn affects the rates of digestion and absorption of nutrients. Also, rates of gastric emptying and transit time of digesta are thought to be influenced by increased digesta viscosity, thereby providing hind-gut microflora with an opportunity to colonise the small intestine to the detriment of the host in terms of diminished use of nutrients and reduced ability to ward off ingested pathogens (Choct, 1999). Exogenous glycanases are able to depolymerise NSP thereby reducing the deleterious effects resulting from increased viscosity of digesta (Choct et al., 1996). Feed enzymes have proven to be a very effective tool for not only increasing the energy values of grains for poultry but also for improving the uniformity of growth and feed efficiency of broiler flocks. Despite the global success of feed enzyme technology, questions remain about the specific modes of actions of enzymes (Smits and Annison, 1996; Williams, 1997), and why enzymes can reduce but do not eliminate variation in energy values for grains (Bedford, 1996; Kocher et al., 1997). The broad objective of this project was to develop a clearer understanding of the physiological limitations to digestive function of broiler chickens particularly in relation to energy metabolism. The general hypothesis examined in this project was that feed-related factors such as NSP induce variable responses among individual chickens within the flock in the usage of carbohydrate from cereal grains as a source of energy. The work carried out during the course of this project is described in five chapters. The first of these (Chapter 4) established that individual broiler chickens, which were hatched, reared and treated in an apparently identical manner, could exhibit wide variation in usage of carbohydrate from wheat and barley. Furthermore, the results pointed to a fundamental difference between males and females in overall energy metabolism, irrespective of the breed, possibly associated with differences in energy costs to repair and maintain the gut, endogenous losses, or responses to inflammatory effects of microflora. The relative importance of the structure of the small intestines of chickens as a potential source of variation in energy metabolism was examined in Chapter 5. Gross morphology of the small intestine and the finer structure of the intestinal mucosa differed between male and female chickens. However, between-bird variation in AME could not be fully explained by differences in the weights of duodenum, jejunum and ileum relative to metabolic body weight, or by changes in villus height or crypt depth in these sections of the small intestine. It was concluded that factors other than gut morphology were responsible for up to 67% of the variation observed in AME. A specific objective in this project was the adaptation of breath tests used for clinical diagnosis of intestinal disorders in humans for use as non-invasive methods for assessing digestive functions in chickens (Chapter 6). It was expected that breath tests would provide more insight than the usual

54
snapshot view obtained in conventional nutrient balance studies, and that these non-invasive tools would allow the study of the dynamic interplay between various factors affecting energy uptake in broilers. With breath tests, it was possible to identify certain characteristics of individual chickens prior to experimentation with soluble NSP and endogenous enzymes in order to follow the resulting changes in gastro-intestinal functions such as digesta transit time, and microbial proliferation in the small intestine. Hydrogen breath tests and conventional methods were used to determine the relative importance of time of residence of ingesta in the small intestine (Chapter 7) and the role of gut microflora (Chapter 8) on energy metabolism. There was good agreement between oro-caecal transit time determined by a rise in breath hydrogen and whole tract transit time measured by appearance of ferric oxide marker in excreta, although whole tract transit times were generally shorter than oro-caecal transit times (Chapter 7). There was no difference between males and females in either of the two measures of rate of passage of digesta. Other results obtained in Chapter 7 were inconclusive, probably because the concentration of NSP in the wheat used in this experiment was too low to produce a viscous digesta. Despite the wheat having a very high AME value overall, some chickens with longer transit times seemed able to extract more energy from the diet than those with shorter transit times. In Chapter 8, hydrogen and methane breath tests were used as indicators of the metabolic activity of the gut microflora in a series of five experiments. Responses to low AME wheat by individual chickens were highly variable in terms of acetic acid and butyric acid concentrations in freshly voided excreta in one experiment, and in hydrogen and methane concentrations in breath in two subsequent experiments with different batches of chickens. Feed enzymes significantly improved growth and feed conversion in males and females, improved AME for males only, but had no effect on composition of the breath from either sex in this experiment. These observations provide strong evidence of remarkably different metabolic activities of gut microflora in birds reared on starter diets with the same nutrient specifications (but not necessarily the same ingredient composition). The fourth experiment in Chapter 8 examined the effect of age of chickens on responses to enzyme addition to wheat and barley diets. Enzymes improved growth, feed conversion and AME for each age of chickens. Hydrogen in breath prior to the feeding of experimental diets was higher in older chickens but methane content did not change with age of chicken. Large increases in hydrogen and methane in breath from older chickens point to an increase in carbohydrate escaping digestion in the small intestine leading to increased metabolic activity of the gut microflora. The influence of gut microflora on the nutritive value of different types of cereal grains was studied in the fifth experiment described in Chapter 8. Antibiotics were added to the feed in an attempt to reduce the population of gut bacteria in the hindgut and thereby promote more uniform usage of carbohydrate from the grains. The effects of antibiotic treatment on metabolic activity of the microflora as indicated by breath hydrogen measurements differed across grain types. Antibiotic treatment resulted in an increase in hydrogen production in chickens given sorghum but a decrease in chickens given barley. On the other hand, antibiotic treatment failed to affect either ileal DE or AME. The influence of gut microflora on the site of digestion of carbohydrate differed between male and female chickens, and according to type of grain used in the diet. Ileal digestible energy (DE) values for wheat and barley were unaffected by sex, whereas AME values were lower in male chickens compared with females. These contrasting effects strongly imply that post-intestinal processes and events associated with gut microflora were critically influenced by the sex of the host chicken.

55
Differences in the amounts of hydrogen produced are indicative of changes in the numbers and/or species of bacteria in the gut population, and/or changes in the metabolic activities of those bacteria. Furthermore, these changes in hydrogen concentration in response to antibiotics were also dependent on the type of grain used in the diet. It is also evident from these results that antibiotics did not bridge the gap between AME and DE values. Presumably, the differential flow of undigested nutrients into the hindgut created different growth media for those hydrogen-producing species of bacteria surviving antibiotic treatment. In conclusion, the influence of gut microflora on the digestive function of the chicken was partially dependent on the composition of the diet. Inherent characteristics of grains induced different responses in energy metabolism in male and female chickens. The likelihood that requirements for nutrients other than energy are also sex-dependent warrants investigation. Further work is needed to determine the fundamental reasons why bacterial colonisation of the gut is variable and why it differs substantially between male and female chickens. Then it may be possible to control the initial colonisation of newly hatched chicks and to maintain a health-promoting profile throughout the life of chickens in order to enhance efficient production, and product quality and safety.

56
10. Implications of the findings i. The results indicate that gut structure and bacterial colonisation of the gut are important
determinants of digestive capacity, and that both are partially dependent on the sex of the chicken.
ii. The possibility that variation in AME was associated with differences in gut epithelial function not detectable by the histological methods used in these studies warrants further investigation. Previous work by others using more sophisticated biochemical procedures to study functionality of the gut has not allowed for the possibility that males and females differ in this regard.
iii. The influence of gut microflora on the digestive function of the chicken was partially dependent on the composition of the diet. Inherent characteristics of grains induced different responses in energy metabolism in male and female chickens.
iv. Within-flock and between-flock variation as a result of uncontrolled colonisation of the gut soon after hatch could reduce flock uniformity for processing purposes, and increase product safety risks.
v. The likelihood that requirements for nutrients other than energy are also sex-dependent warrants investigation. It may be economically worthwhile to feed and manage commercial broilers in single sex flocks rather than jointly as is the current trend.
vi. Alteration of the balance between the host chicken and its resident microflora (by feeding different grains, enzymes, antibiotics, prebiotics, probiotics and other feed additives) is likely to result in outcomes which are difficult to predict given the complicated inter-relationships between various key factors contributing to the digestive capacity of the chicken.
vii. A clearer understanding of the role of the gut microflora is required. This is a necessary step towards achieving controlled colonisation of the gut in newly hatched chicks and maintenance of a ‘healthy gut microflora’ throughout the life of the bird for optimum productivity and subsequent quality of processed chicken meat.

57
11. Recommendations
A key conclusion reached in this investigation is that the sex of the chicken strongly influences digestive physiology and metabolism. Several practical recommendations can be made as a result:-
• For all intents and purposes, male and female chickens should be regarded as if they are entirely different “strains” and hence should be fed and managed differently, as is the usual practice for commercial strains such as Cobb and Ross chickens, which are known to differ substantially in growth rate and carcass yield.
• Placement of males and females in separate sheds in order that sex-specific feeding and management programs can be applied, in order to optimise growth, carcass yield, and composition within each sex.
• Undertake segregated rearing on a trial basis on commercial farms to validate the experimental findings observed in this study.
• During large-scale commercial trials, it is recommended that records be kept on any sex-dependent differences in environmental control settings needed for flock comfort, susceptibility to disease, behavioural changes, water consumption, litter condition, hock burn and breast blisters, uniformity of live weight with age, uniformity of carcass yield, and incidence of condemnations.
The importance of sex on gut structure and function and bacterial colonisation of the gut in otherwise healthy, high performing chickens observed in this study leads to the following recommendation for further research:-
• The relative importance of gut epithelial function needs to be established more clearly in experimental work in which other key determinants of digestive capacity such as digesta transit time and gut microflora size and activity are measured simultaneously.
During this study, all experimental work was done with feather-sexable strains of chickens. Clearly, a differential rate of feather growth in ovo implies that male and female embryos utilise the same egg nutrients differently. Furthermore, differential feather growth persists long after hatch. It follows that males and females utilise feed differently, and that the flow of specific undigested nutrients into the hindgut will differ between males and females. This may be a feasible explanation for why males and females hosted gut microflora with the widely differing metabolic activities observed in this study. Similar work to that described in this report should be undertaken to:-
• Determine whether sex-dependent differentiation occurs in the gut microflora in non-feather sexable strains or crosses of broiler chickens in order to better understand the relative importance of the gut microflora in the productivity and health of chickens. Such a study should include a feather sexable strain as a control, and should include simultaneous measurements of other key determinants of the digestive capacity of chickens.
Preliminary experiments using simple PVC helmets to collect breath from individual birds provided proof of the concept of using breath tests as non-invasive tools for study of the gastroenterology of broiler chickens. Breath testing of chickens prior to use in experiments highlighted the fact that colonisation of the gut with commensal bacteria differed substantially from batch to batch, and that the gut microflora had a big impact on subsequent productivity of chickens in experimental flocks. These observations lead to two avenues for further research. The first involves:-
• Characterisation of the gut microflora of chickens and its changes in relation to feed composition and gut health, and study of the nature of interactions between microbes and the mucosal immune system. Further work in this area should take into account recent advances made in our understanding of cytokines and it will require development of DNA-based tools for

58
identification and quantification of anaerobic organisms that are difficult to enumerate using conventional microbiological techniques.
• Investigation of the factors that influence how the gut of newly hatched chickens is colonised initially and how early nutrition influences this process.
The other avenue of approach involves exploitation of breath testing techniques for experimental and commercial use. However, it is likely that breath testing will have most use as a research tool initially. Further research is needed to:-
• Develop breath tests for detection of specific gastrointestinal disorders such as pancreatic insufficiency, maldigestion, and malabsorption, and for semi-quantification of gastrointestinal functions such as rate of passage of digest, and bacterial proliferation in the small intestine. Breath tests need to be validated against conventional techniques involving slaughter of animals for collection of tissue and digesta samples.
Breath analysis has potential for commercial applications also:-
• Examine the feasibility of monitoring productivity and health of entire flocks by analysis of air exhausted from the shed. Initially, samples of air can be collected for analysis with specialised laboratory instruments housed offsite. For example, samples could be analysed for hydrogen and methane to indicate gut microbial activity, for stable isotopes to gauge catabolic reactions, or for short chain hydrocarbons to monitor oxidative stress in chickens. In the long term, it is envisaged that in situ probes will be installed in computer hardware for controlling the shed environment
Finally, chickens were raised in “clean” and “dirty” environments in this study in an attempt to magnify differences within and between sexes. The chickens appeared to be unaffected by immuno-suppressive viruses that cause Marek’s disease, infectious bursal disease and chick anaemia, or by bacterial infections. There was, however, clear evidence that chickens reared in a “dirty” environment grew slower and were less uniform in weight than chickens reared in a “clean” environment. Furthermore, male chickens fared far worse than females in terms of uniformity. These observations indicated that there were significant levels of potentially harmful agents in the environment, such as feather scurf and dander, dust from feed, and non-pathogenic microorganisms with antigenic or inflammatory properties. It is recommended that applied research be undertaken to:-
• Compare used versus fresh litter from both an economical and a biological point of view. These investigations should measure effects on the health and welfare of animals and humans who work in the sheds and near surrounds.
• Develop recycling processes that reduce or eliminate potentially harmful properties of re-used litter. These investigations should identify the source and nature of hazardous components of litter materials, and should determine the number of cycles litter can go through before disposal is necessary, and how disposal should be carried out.

59
References Amarri, S. & Weaver, L.T. (1995). 13C-Breath tests to measure fat and carbohydrate digestion in clinical
practice. Clinical Nutrition. 14: 149-154. Annison, G. (1993). The role of wheat non-starch polysaccharides in broiler nutrition. Australian Journal
of Agricultural Research. 44: 405-422. Bedford, M.R. (1996). Interaction between ingested feed and the digestive system in poultry. Journal
of Applied Poultry Research 5: 86-95. Bedford, M.R. & Morgan, A.J. (1996). The use of enzymes in poultry diets. World's Poultry Science
Journal. 52: 61-68. Butler, R.N. (1996). On the breath. Today's Life Science: 36-40. Chicurel, M. (2000). Live and let die. New Scientist. 165: 7. Choct, M. (1999). Soluble non-starch polysaccharides affect net utilisation of energy by chickens. Recent
Advances in Animal Nutrition in Australia. 12: 31-35. Choct, M. & Annison, G. (1992). The inhibition of nutrient digestion by wheat pentosans. British Journal
of Nutrition. 67: 123-132. Choct, M., Hughes, R.J., Wang, J., Bedford, M.R., Morgan, A.J. & Annison, G. (1996). Increased small
intestinal fermentation is partly responsible for the anti-nutritive activity of non-starch polysaccharides in chickens. British Poultry Science. 37: 609-621.
Choct, M. & Kocher, A. (2000). Excreta viscosity as an indicator of microbial enzyme activity in the hindgut and as a predictor of between-bird variation in AME in broilers. Australian Poultry Science Symposium. 12: 211.
Clench, M.H. & Mathias, J.R. (1992). A complex avian intestinal motility response to fasting. American Journal of Physiology. 262: G498-G504.
Corrier, D.E., Hinton, A., Ziprin, R.L., Beier, R.C. & DeLoach, J.R.. (1990). Effect of dietary lactose on cecal pH, bacteriostatic volatile fatty acids, and Salmonella typhimurium colonization of broiler chicks. Avian Diseases. 34: 617-625.
Cox, J. M. & Chung, B.L. (2000). Competitive exclusion: Probiotic preparations for poultry. Australian Poultry Science Symposium. 12: 32-39.
Dunshea, F.R., Brown, W.G., Gough, C.D. & Eason, P.J. (1998). Female pigs better handle weaning than male pigs. Nutrition Society of Australia, Adelaide, pp. 103.
Fedde, M.R. (1976). Respiration. In "Avian Physiology". Third edition. Ed. P.D. Sturkie. Springer-Verlag, New York: pp. 122-145.
Freeman, B.M. (1984). Appendix: biochemical and physiological data. In "Physiology and Biochemistry of the Domestic Fowl". Volume 5, Ed. B.M. Freeman. Academic Press, London: pp. 407-424.
Godwin, I.R. & Russell, W.J. (1997). Reverse peristalsis in the chicken digestive tract. Recent Advances in Animal Nutrition in Australia. 11: 229.
Gohl, B. & Gohl, I. (1977). The effect of viscous substances on the transit time of barley digesta in rats. Journal of the Science of Food and Agriculture. 28: 911-915.
Guirguis, N. (1975). Evaluating poultry feedstuffs in terms of their metabolizable energy content and chemical composition. Australian Journal Experimental Agriculture and Animal Husbandry. 15: 773-779.
Guirguis, N. (1976). Metabolizable energy values of fats and protein concentrates for poultry: effect of sex and inclusion level of feedstuffs. Australian Journal Experimental Agriculture and Animal Husbandry. 16: 691-695.
Hatch, M.D. & Slack, C.R. (1966). Photosynthesis by sugar-cane leaves: a new carboxylation reaction and the pathway of sugar formation. Biochemical Journal. 101: 103-111.

60
Heine, W.E., Berthold, H.K. & Klein, P.D. (1995). A novel stable isotope breath test: 13C-labeled glycosyl ureides used as noninvasive markers of intestinal transit time. American Journal of Gastroenterology. 90: 93-98.
Hiele, M., Ghoos, Y., Rutgeerts, P. & Vantrappen, G.. (1989). Starch digestion in normal subjects and patients with pancreatic disease, using a 13CO2 breath test. Gastroenterology. 96: 503-509.
Hughes, R.J. (2001). Variation in the digestive capacity of the broiler chicken. Recent Advances in Animal Nutrition in Australia. 13: 153-161.
Hughes, R.J. & Choct, M. (1997). Low-ME wheat or low-ME chickens? - Highly variable responses by birds on the same low-ME wheat diet. Australian Poultry Science Symposium. 9: 138-141.
Hughes, R.J. & Choct, M. (1999). Chemical and physical characteristics of grains that are related to variability in energy and amino acid availability in poultry. Australian Journal of Agricultural Research. 50: 689-701.
Hughes, R. J., M. Choct, & van Barneveld, R.J. (2001a). Factors influencing the energy values of Australian cereal grains fed to broilers. Australian Poultry Science Symposium. 13: .30-38.
Hughes, R.J. & Cooper, K.V. (2002). Nutritive value of triticale for broiler chickens is affected by variety, weather conditions and growth site. Australian Poultry Science Symposium. 14: 131-134.
Hughes, R. J., Tivey, D.R. & Butler, R.N. (2001b). Hydrogen and methane breath tests for assessing metabolic activity of gut microflora in broiler chickens. Australian Poultry Science Symposium. 13: 168-171.
Iji, P.A. (1998). Natural development and dietary regulation of body and intestinal growth in broiler chickens. PhD thesis, University of Adelaide, Australia.
Iji, P.A. (1999). The impact of cereal non-starch polysaccharides on intestinal development and function in broiler chickens. World's Poultry Science Journal. 55(4): 375-387.
Iji, P.A. & Tivey, D.R. (1998). Natural and synthetic oligosaccharides in broiler chicken diets. World's Poultry Science Journal. 54: 129-143.
Iskander, S. & Pym, R.A.E. (1987). Study on appetite regulation and nutritional physiology in chickens selected for feed efficiency or its components. Recent Advances in Animal Nutrition in Australia. 6: 252-259.
Itabisashi, T. (1981). Breath-by-breath analysis of expiratory gas concentration in chickens. National Institute of Animal Health Quarterly. 21: 42-51.
Jin, S., Corless, A., Sell, J.L. & Jin, S.H. (1998). Digestive system development in post-hatch poultry. World's Poultry Science Journal. 54: 335-345.
King, R.D. (2000). Linear model of nitrogen balance and examination of the nature of true metabolisable energy and its nitrogen corrected form. British Poultry Science. 39: 70-78.
Klasing, K. (1996). Interactions between nutrition and the immune system. Australian Poultry Science Symposium. 8: 8-13.
Klasing, K.C., Johnstone, B.J. and Benson, B.N. (1999). Implications of an immune response on growth and nutrient requirements of chicks. In: "Recent Developments in Poultry Nutrition 2", pp. 35-47. Eds. P.C. Garnsworthy and J. Wiseman, Nottingham University Press, Nottingham.
Kocher, A., Hughes, R.J. & Barr, A.R. (1997). β-glucanase reduces but does not eliminate variation in AME of barley varieties. Australian Poultry Science Symposium. 9: 142-145.
Langar, P.N., Virk, R.S. & Gill, S.P.S. (1993). Effect of poultry dropping uric acid on nutrient utilization by broiler chick. Indian Journal of Animal Sciences. 63: 339-343.
Langhout, D.J., Schutte, J.B., van Leeuwen, P., Wiebenga, J. & Tamminga, S. (1999). Effect of dietary high- and low-methylated citrus pectin on the activity of the ileal microflora and morphology of the small intestinal wall of broiler chicks. British Poultry Science. 40: 340-347.

61
Lillehoj, H.S. (1997). Gut-associated lymphoid tissues and local immunity to enteric pathogens in chickens. Zootecnica International. 20(12): 48-53.
McLelland, J. & Molony, V. (1983). Respiration. In "Physiology and Biochemistry of the Domestic Fowl". Volume 4, Ed. B.M. Freeman. Academic Press, London: pp. 63-89.
Mollah, Y., Bryden, W.L., Wallis, I.R., Balnave, D. & Annison, E.F. (1983). Studies on low metabolisable energy wheats for poultry using conventional and rapid assay procedures and the effects of processing. British Poultry Science. 24: 81-89.
Moran, E.T.J. (1985). Digestion and absorption of carbohydrates in fowl and events through perinatal development. Journal of Nutrition. 115: 665-674.
Nickels, R., Schummer, A. & Seiferle, E. (1977). Anatomy of the Domestic Birds. Verlag Paul Parey, Berlin.
Nurmi, E. & Rantala, M. (1973). New aspects of Salmonella infection in broiler production. Nature. 241: 210-211.
Parker, D.S. & Armstrong, D.G. (1987). Antibiotic feed additives and livestock production. Proceedings of the Nutrition Society. 46: 415-421.
Ravindran, V., Thomas, D.V., Camden, B.J. & Voon, S.H. (2001). Apparent metabolisable energy content of New Zealand wheats. Australian Poultry Science Symposium. 13: 240.
Robb, T.A. & Davidson, G.P. (1987). Two-hour lactose breath hydrogen test. Journal of Pediatric Gastroenterology and Nutrition. 6: 481-482.
Rogel, A.M., Annison, E.F., Bryden, W.L. & Balnave, D. (1987). The digestion of wheat starch in broiler chickens. Australian Journal of Agricultural Research. 38: 639-649.
Scheid, P. & J. Piiper (1969). Volume, ventilation and compliance of the respiratory system in the domestic fowl. Respiration Physiology. 6: 298-308.
Sklan, D. (2001). Development of the digestive tract of poultry. World's Poultry Science Journal. 57(4): 415-428.
Smits, C.H.M. (1996). Viscosity of dietary fibre in relation to lipid digestibility in broiler chickens. PhD thesis, Wageningen Agricultural University, The Netherlands.
Smits, C.H.M. & Annison, G. (1996). Non-starch plant polysaccharides in broiler nutrition - towards a physiologically valid approach to their determination. World's Poultry Science Journal. 52: 203-221.
Smits, H.M., Veldman, A., Verstegen, M.W.A. & Beynen, A.C. (1997). Dietary carboxymethyl cellulose with high instead of low viscosity reduces macronutrient digestion in broiler chickens. Journal of Nutrition. 127: 483-487.
Steenfeldt, S., Knudsen, K.E.B., Borsting, C.F. & Eggum, B.O. (1995). The nutritive value of decorticated mill fractions of wheat. 2. Evaluation with raw and enzyme treated fractions using adult cockerels. Animal Feed Science and Technology. 54: 249-265.
Sturkie, P.D. (1976). Alimentary canal: anatomy, prehension, deglutition, feeding, drinking passage of ingesta, and motility. In "Avian Physiology". Third edition. P.D. Sturkie. Springer-Verlag, New York: pp. 185-195.
Swart, G.R. & van den Berg, J.W.O. (1998). 13C breath tests in gastroenterological practice. Scandinavian Journal of Gastroenterology. 33: 13-18.
Symonds, E., Omari, T., Butler, R. & Davidson, G. (1998). A novel technique for monitoring breath, applied to assessment of gastric emptying in the mouse. Journal of Gastroenterology and Hepatology. 13 (Supplement): A1111.
Ten Doeschate, R.A.H.M., Schreurs, V.V.A.M., Boekholt, H.A., Scheele, C.W. & Schoonman, A.T. (1995). 14CO
2 breath test measurements in broilers: methodological aspects. Proceedings of
the 7th International Symposium, Portugal, pp. 331-334. Tivey, D. & Butler, R. (1999). Breath analysis - a key to understanding intestinal function. Recent
Advances in Animal Nutrition in Australia. 13: 45-52.

62
Uni, Z., Ganot, S. & Sklan, D. (1998). Posthatch development of mucosal function in the broiler small intestine. Poultry Science. 77: 75-82.
Uni, Z., Noy, Y. & Sklan, D. (1995). Posthatch changes in morphology and function of the small intestines in heavy- and light-strain chicks. Poultry Science. 74: 1622-1629.
Uni, Z., Noy, Y. & Sklan, D. (1996). Development of the small intestine in heavy and light strain chicks before and after hatching. British Poultry Science. 37: 63-71.
Uni, Z., Y. Noy & Sklan, D. (1999). Posthatch development of small intestinal function in the poult. Poultry Science. 78(2): 215-222.
van der Klis, J.D. & van Voorst, A. (1993). The effect of carboxy methyl cellulose(a soluble polysaccharide) on the rate of marker excretion from the gastrointestinal tract of broilers. Poultry Science. 72: 503-512.
Vantrappen, G.R., Rutgeerts, P.J., Ghoos, Y.F. & Hiele, M.I. (1989). Mixed triglyceride breath test: A noninvasive test of pancreatic lipase activity in the duodenum. Gastroenterology. 96: 1124-1134.
Vieira, S.L. & Moran, E.T.J. (1999). Effects of egg of origin and chick post-hatch nutrition on broiler live performance and meat yields. World's Poultry Science Journal. 55: 125-142.
Weaver, L. T., Dibba, B., Sonko, B., Bohane, T.D. & Hoare, S. (1995). Measurement of starch digestion of naturally 13C-enriched weaning foods, before and after partial digestion with amylase-rich flour, using a 13C breath test. British Journal of Nutrition. 74: 531-537.
Williams, P.E.V. (1995). Digestible amino acids for non-ruminant animals: theory and recent advances. Animal Feed Science and Technology. 53: 173-187.
Williams, P.E.V. (1997). Poultry production and science: future directions in nutrition. World's Poultry Science Journal. 53: 33-48.
Wiseman, J., Nicol, N.T. & Norton, G. (2000). Relationship between apparent metabolisable (AME) values and in vivo/in vitro starch digestibility of wheat for broilers. World's Poultry Science Journal. 56: 305-318.
Wutzke, K. D., Heine, W. E., Plath, C., Leitzmann, P., Radke, M., Mohr, C., Richter, I., Gulzow, H.U. & Hobusch, D. (1997). Evaluation of oro-caecal transit time: a comparison of the lactose-[13C, 15N]ureide 13CO2- and the lactulose H2-breath test. European Journal of Clinical Nutrition. 51: 11-19.
Yamauchi, K., Zhou, Z.X., Ibardolaza, E.I., Isshiki, Y. & Nakahiro, Y. (1990). Comparative anatomical observations on each intestinal segment in chickens and waterfowls. Technical Bulletin of the Faculty of Agriculture, Kagawa University. 42: 7-13.