energy management process · energy management system based on: iso 50001 centralized platform for...
TRANSCRIPT
1
ENERGY MANAGEMENT PROCESS
2
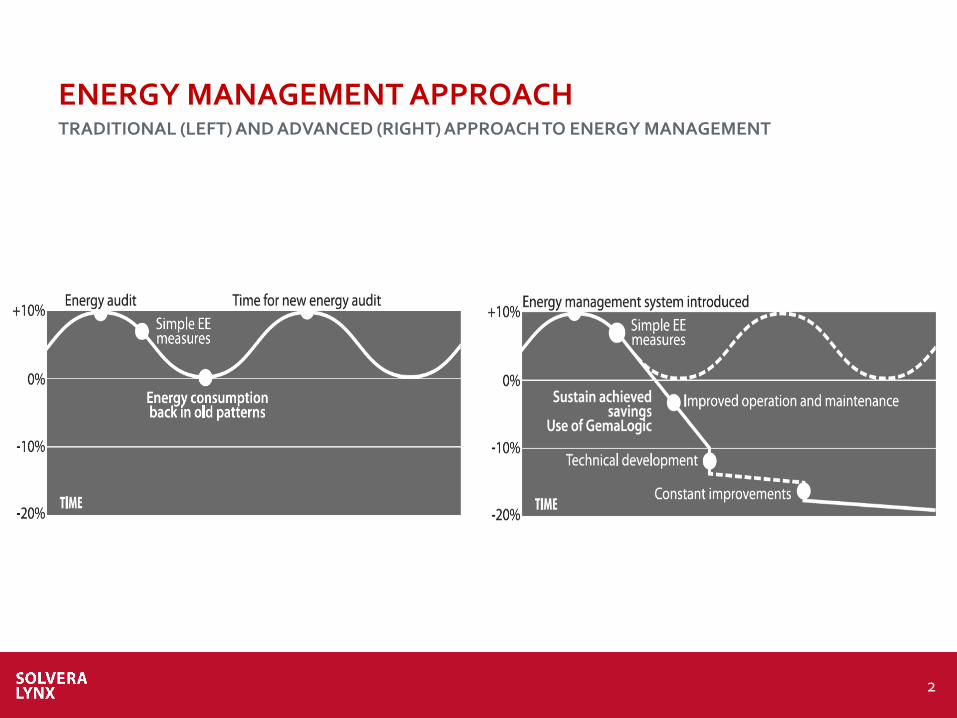
TRADITIONAL (LEFT) AND ADVANCED (RIGHT) APPROACH TO ENERGY MANAGEMENT
ENERGY MANAGEMENT APPROACH
3
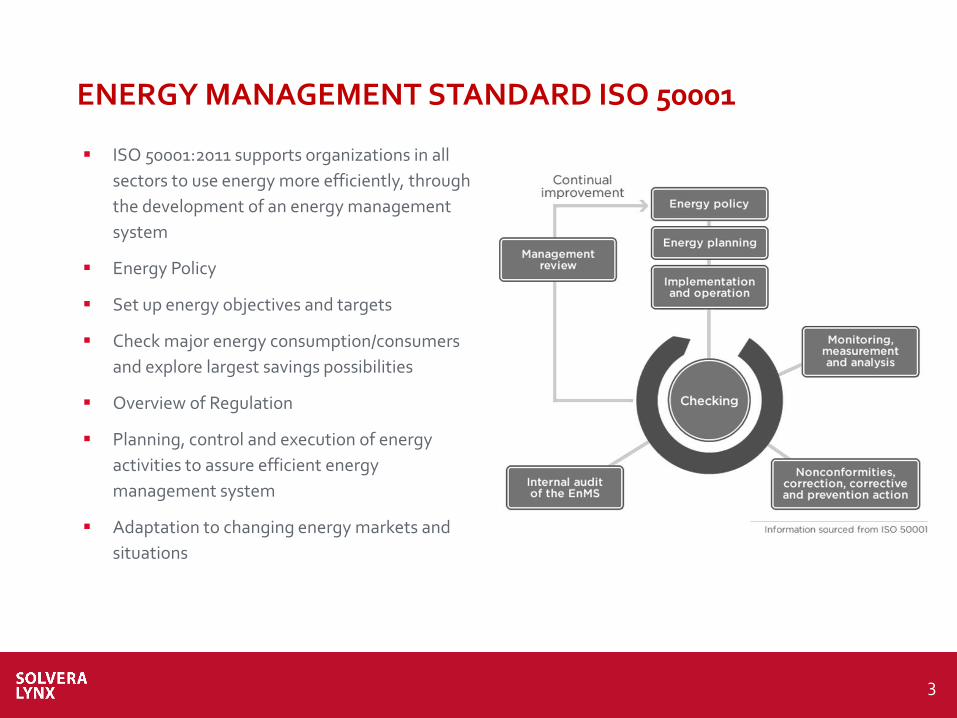
ENERGY MANAGEMENT STANDARD ISO 50001
ISO 50001:2011 supports organizations in all
sectors to use energy more efficiently, through
the development of an energy management
system
Energy Policy
Set up energy objectives and targets
Check major energy consumption/consumers
and explore largest savings possibilities
Overview of Regulation
Planning, control and execution of energy
activities to assure efficient energy
management system
Adaptation to changing energy markets and
situations
4
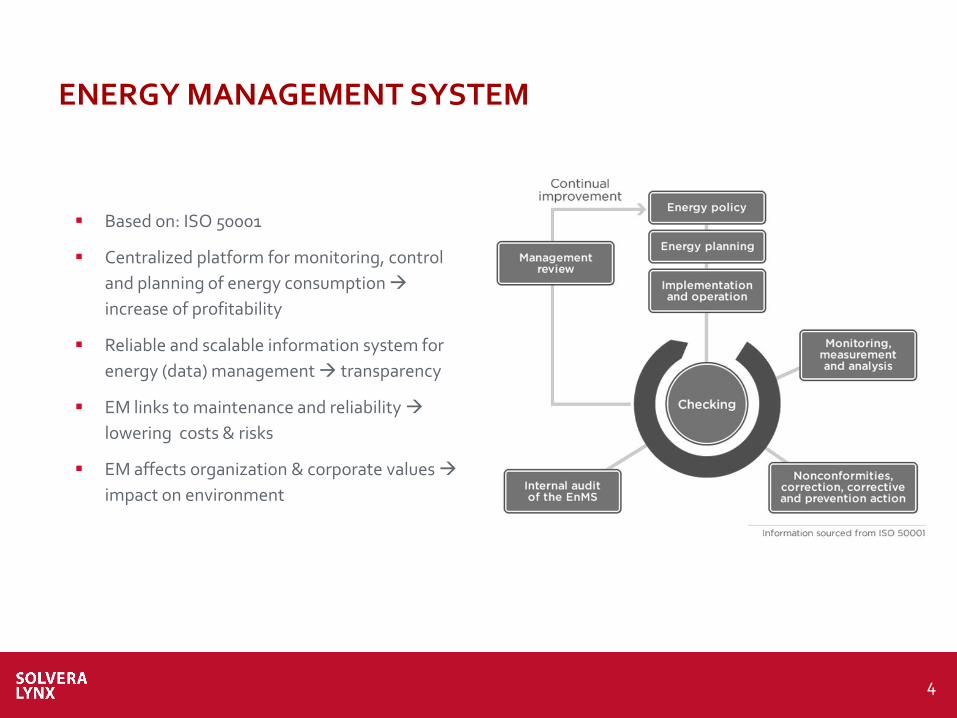
ENERGY MANAGEMENT SYSTEM
Based on: ISO 50001
Centralized platform for monitoring, control
and planning of energy consumption
increase of profitability
Reliable and scalable information system for
energy (data) management transparency
EM links to maintenance and reliability
lowering costs & risks
EM affects organization & corporate values
impact on environment
5
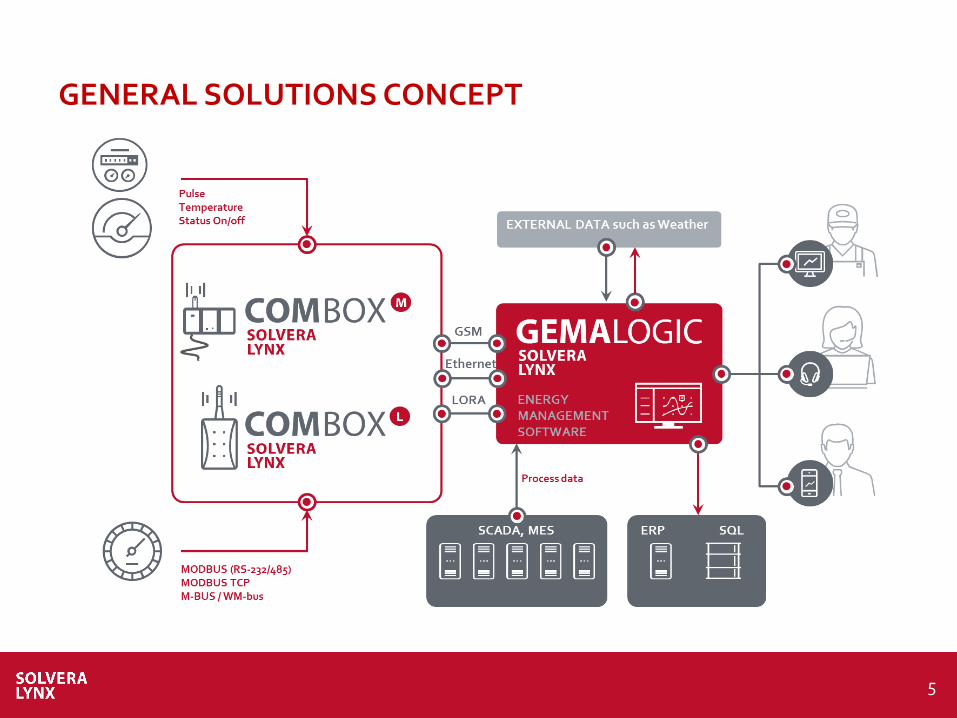
GENERAL SOLUTIONS CONCEPT
6
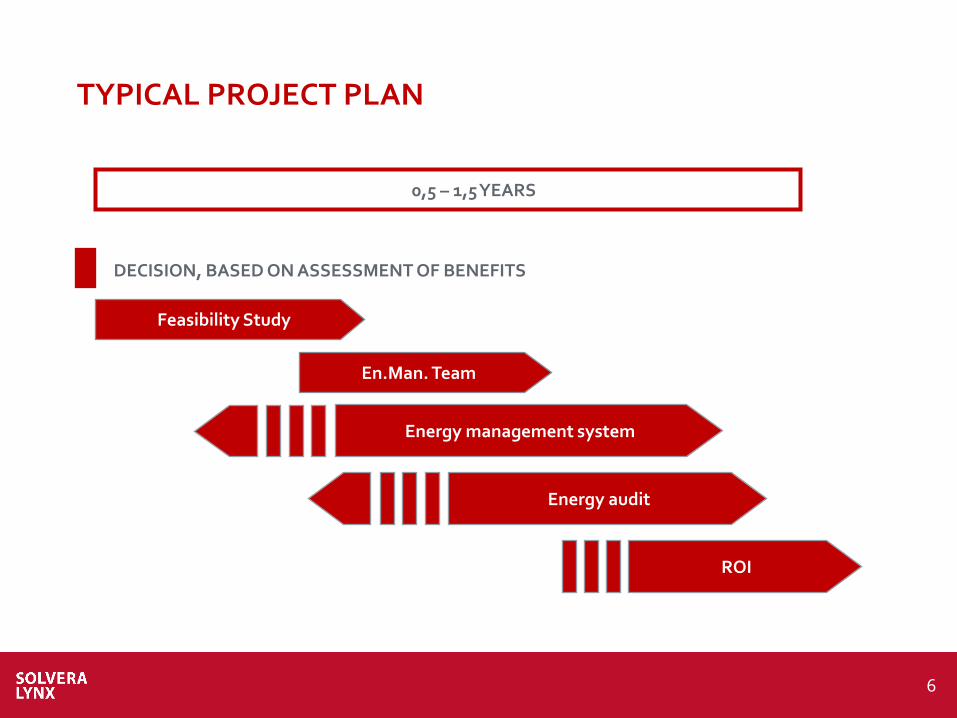
TYPICAL PROJECT PLAN
0,5 – 1,5 YEARS
Feasibility Study
En.Man. Team
Energy management system
DECISION, BASED ON ASSESSMENT OF BENEFITS
Energy audit
ROI
7
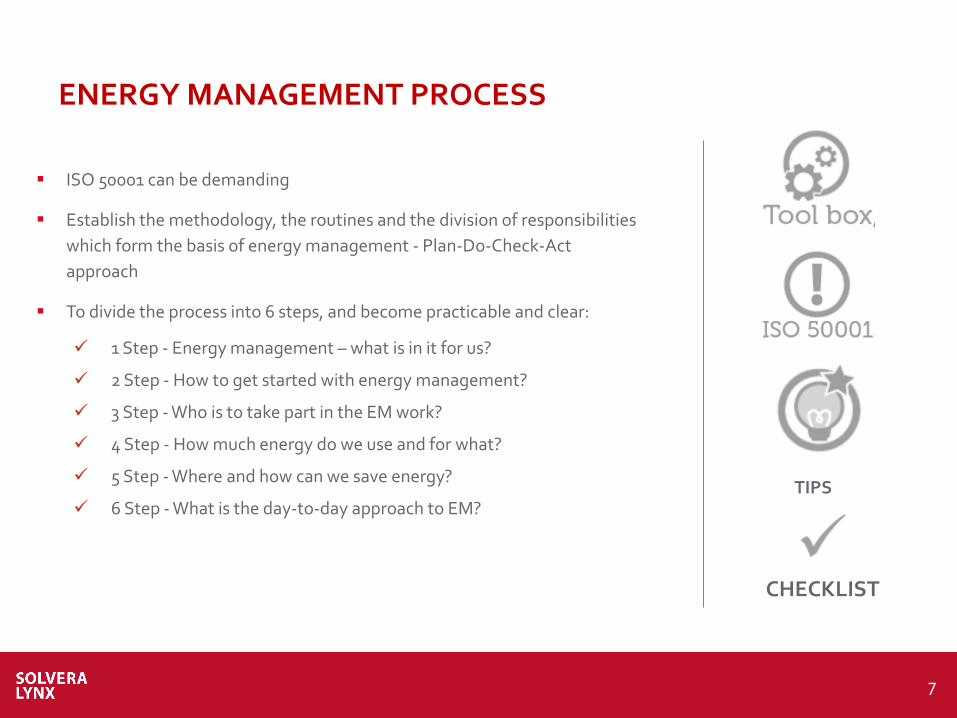
ENERGY MANAGEMENT PROCESS
ISO 50001 can be demanding
Establish the methodology, the routines and the division of responsibilities
which form the basis of energy management - Plan-Do-Check-Act
approach
To divide the process into 6 steps, and become practicable and clear:
1 Step - Energy management – what is in it for us?
2 Step - How to get started with energy management?
3 Step - Who is to take part in the EM work?
4 Step - How much energy do we use and for what?
5 Step - Where and how can we save energy?
6 Step - What is the day-to-day approach to EM? TIPS
CHECKLIST
8
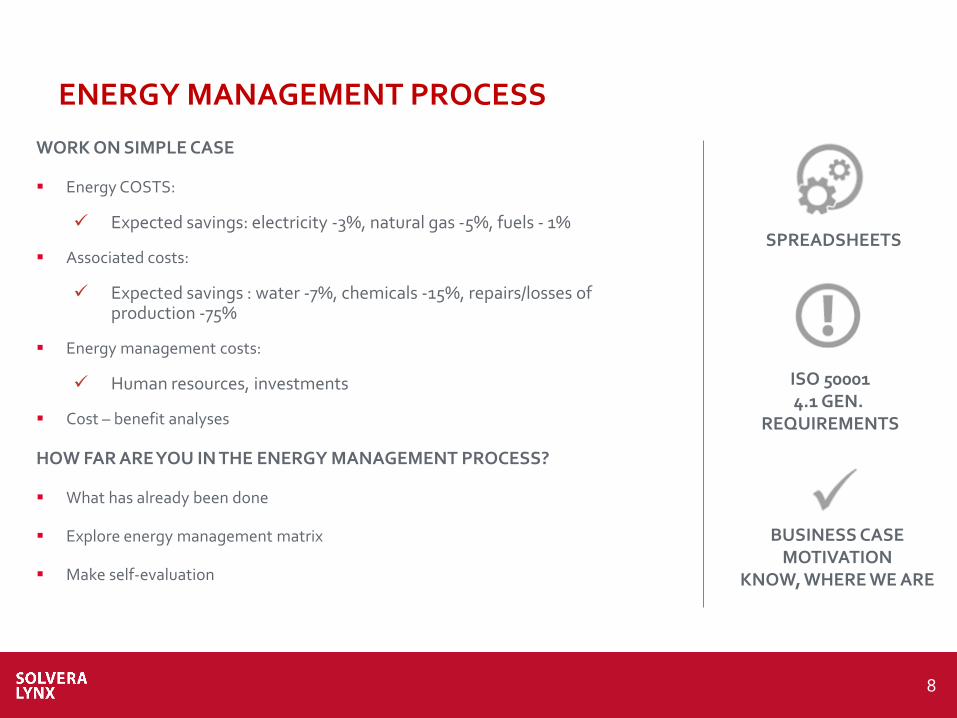
ENERGY MANAGEMENT PROCESS
WORK ON SIMPLE CASE
Energy COSTS:
Expected savings: electricity -3%, natural gas -5%, fuels - 1%
Associated costs:
Expected savings : water -7%, chemicals -15%, repairs/losses of production -75%
Energy management costs:
Human resources, investments
Cost – benefit analyses
HOW FAR ARE YOU IN THE ENERGY MANAGEMENT PROCESS?
What has already been done
Explore energy management matrix
Make self-evaluation
SPREADSHEETS
ISO 50001 4.1 GEN.
REQUIREMENTS
BUSINESS CASE MOTIVATION
KNOW, WHERE WE ARE
9
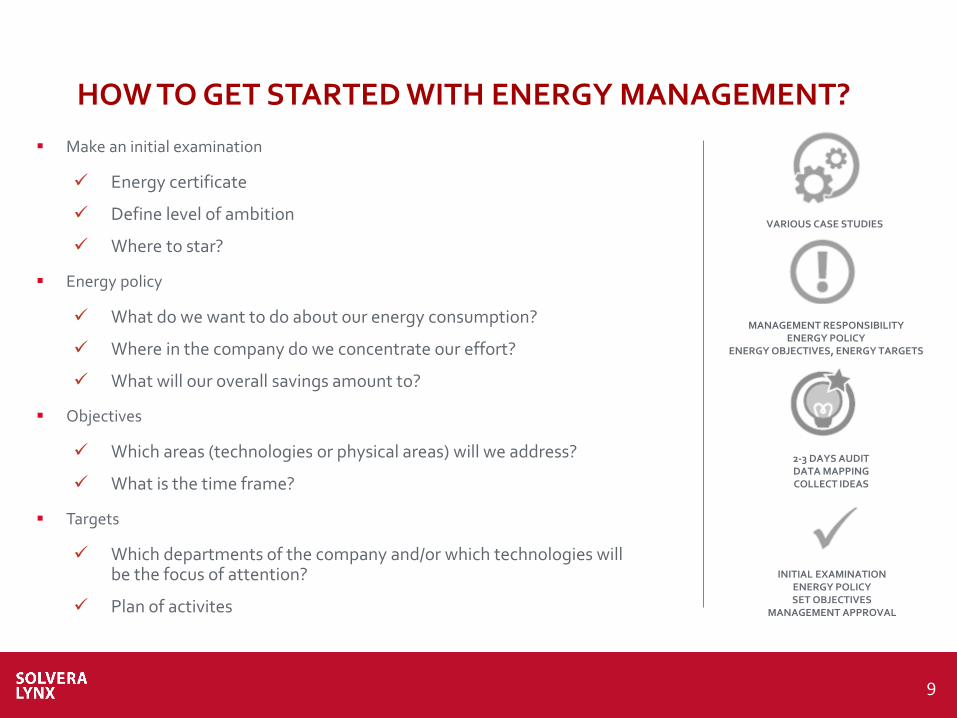
HOW TO GET STARTED WITH ENERGY MANAGEMENT?
Make an initial examination
Energy certificate
Define level of ambition
Where to star?
Energy policy
What do we want to do about our energy consumption?
Where in the company do we concentrate our effort?
What will our overall savings amount to?
Objectives
Which areas (technologies or physical areas) will we address?
What is the time frame?
Targets
Which departments of the company and/or which technologies will be the focus of attention?
Plan of activites
VARIOUS CASE STUDIES
MANAGEMENT RESPONSIBILITY ENERGY POLICY
ENERGY OBJECTIVES, ENERGY TARGETS
INITIAL EXAMINATION ENERGY POLICY SET OBJECTIVES
MANAGEMENT APPROVAL
2-3 DAYS AUDIT DATA MAPPING COLLECT IDEAS
10
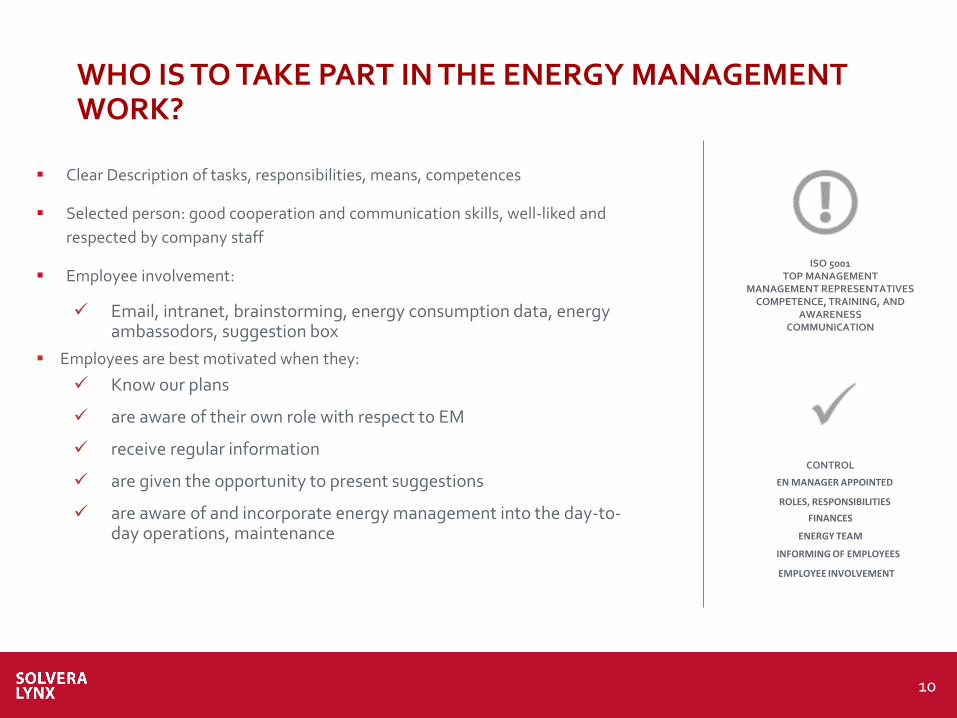
WHO IS TO TAKE PART IN THE ENERGY MANAGEMENT WORK?
Clear Description of tasks, responsibilities, means, competences
Selected person: good cooperation and communication skills, well-liked and
respected by company staff
Employee involvement:
Email, intranet, brainstorming, energy consumption data, energy ambassodors, suggestion box
Employees are best motivated when they:
Know our plans
are aware of their own role with respect to EM
receive regular information
are given the opportunity to present suggestions
are aware of and incorporate energy management into the day-to-day operations, maintenance
ISO 5001 TOP MANAGEMENT
MANAGEMENT REPRESENTATIVES COMPETENCE, TRAINING, AND
AWARENESS COMMUNICATION
CONTROL
EN MANAGER APPOINTED
ROLES, RESPONSIBILITIES
FINANCES
ENERGY TEAM
INFORMING OF EMPLOYEES
EMPLOYEE INVOLVEMENT
11
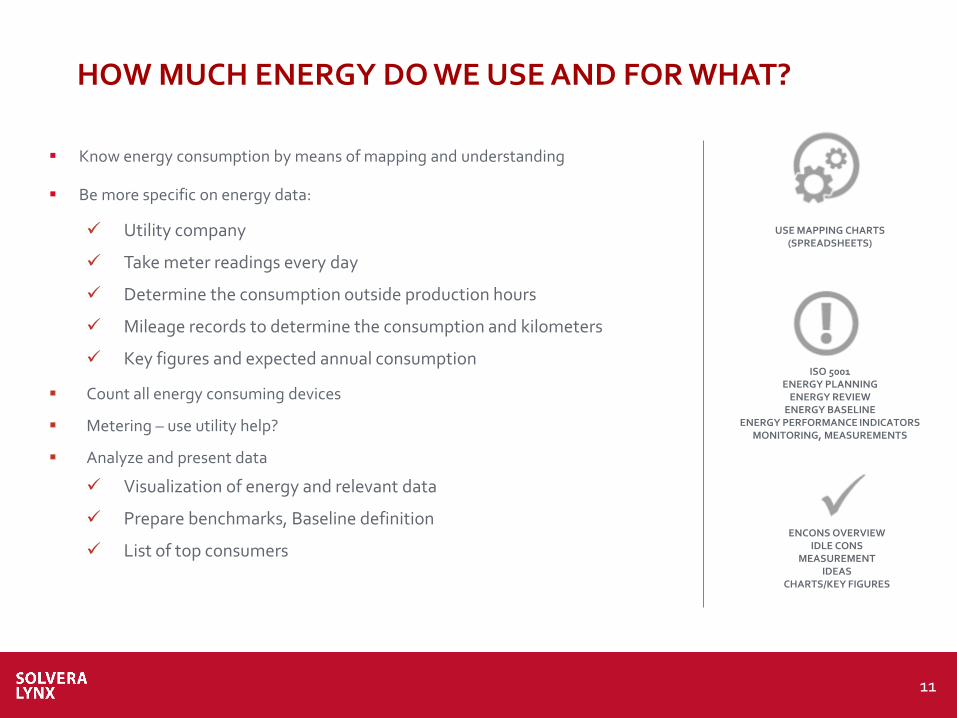
HOW MUCH ENERGY DO WE USE AND FOR WHAT?
Know energy consumption by means of mapping and understanding
Be more specific on energy data:
Utility company
Take meter readings every day
Determine the consumption outside production hours
Mileage records to determine the consumption and kilometers
Key figures and expected annual consumption
Count all energy consuming devices
Metering – use utility help?
Analyze and present data
Visualization of energy and relevant data
Prepare benchmarks, Baseline definition
List of top consumers
USE MAPPING CHARTS (SPREADSHEETS)
ENCONS OVERVIEW IDLE CONS
MEASUREMENT IDEAS
CHARTS/KEY FIGURES
ISO 5001 ENERGY PLANNING
ENERGY REVIEW ENERGY BASELINE
ENERGY PERFORMANCE INDICATORS MONITORING, MEASUREMENTS
12
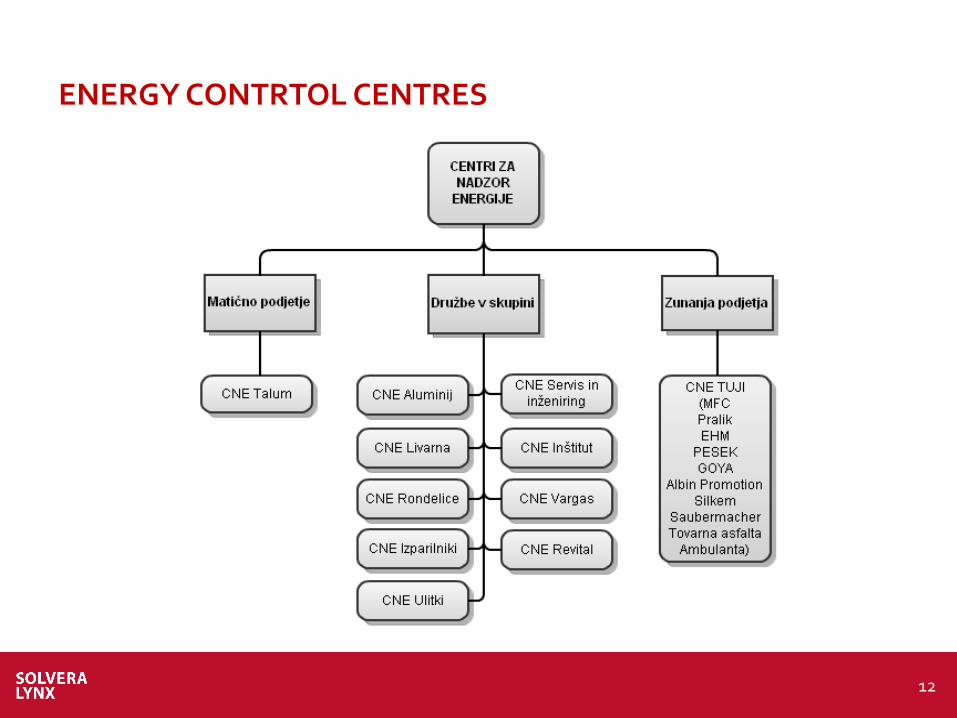
ENERGY CONTRTOL CENTRES
13
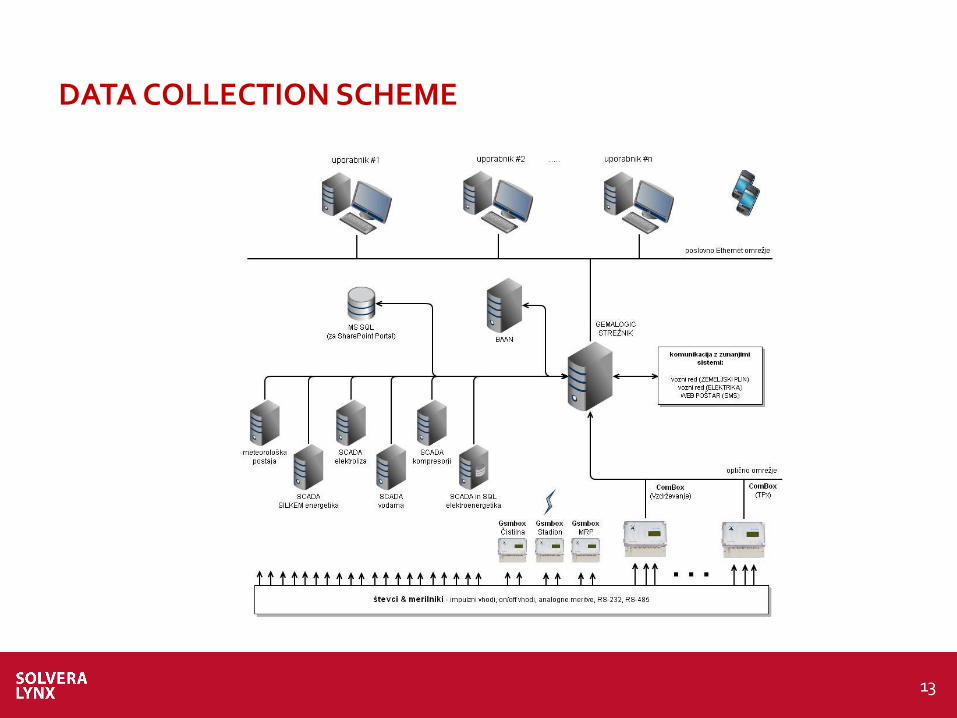
DATA COLLECTION SCHEME
14
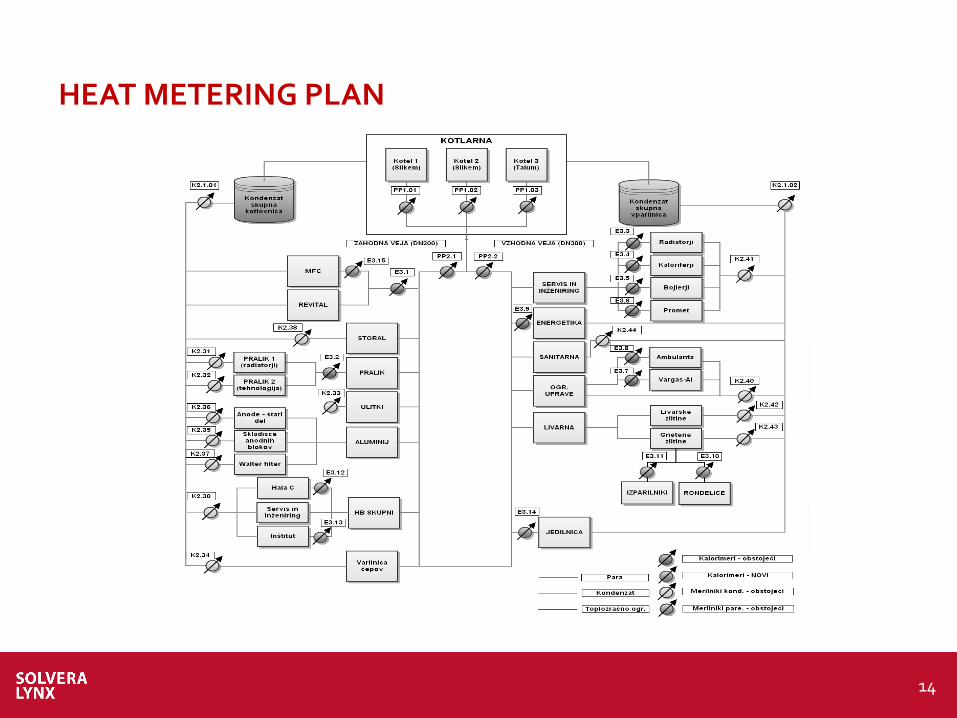
HEAT METERING PLAN
15
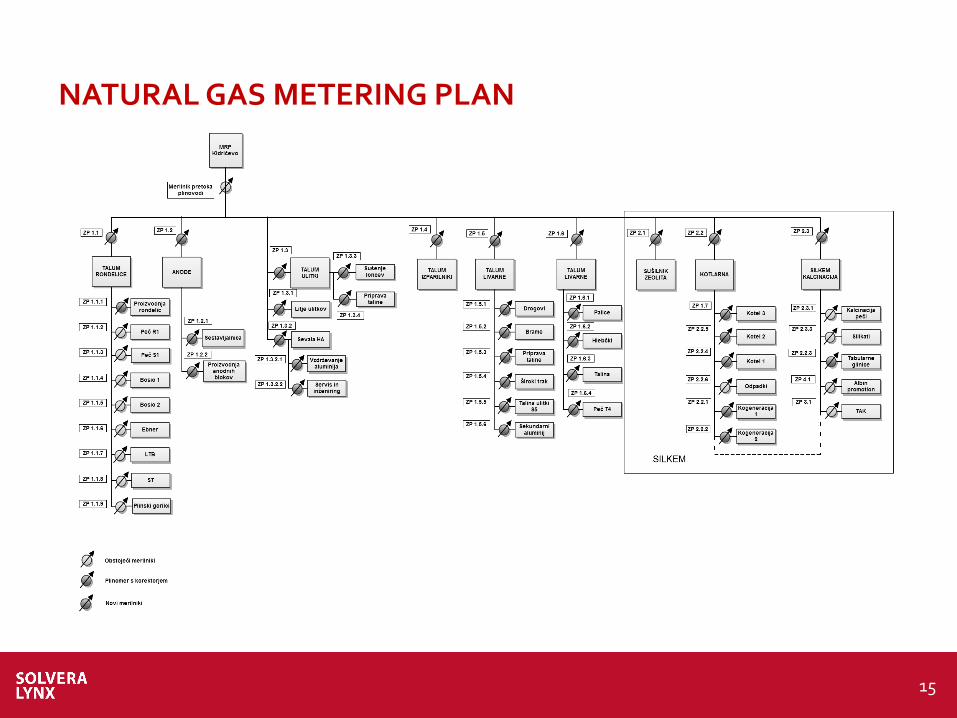
NATURAL GAS METERING PLAN
16
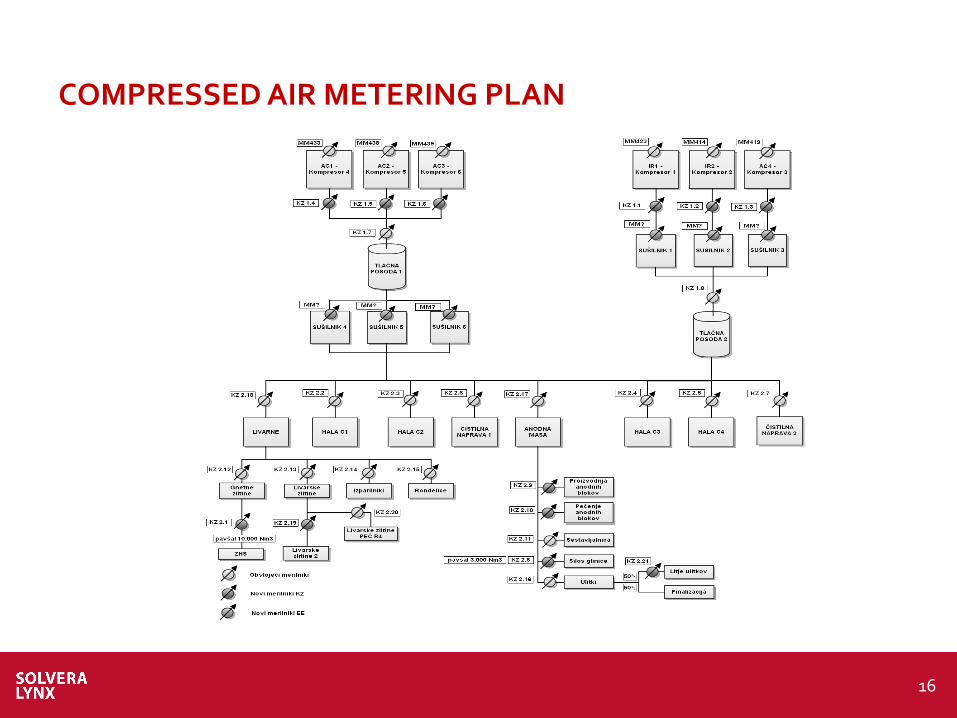
COMPRESSED AIR METERING PLAN
17
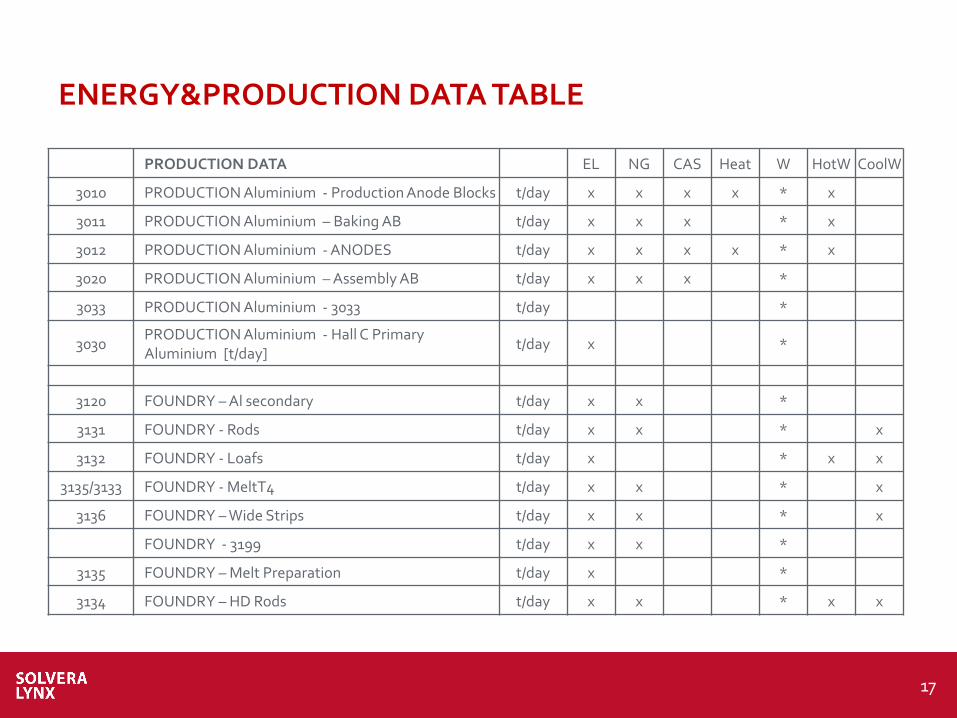
ENERGY&PRODUCTION DATA TABLE
PRODUCTION DATA EL NG CAS Heat W HotW CoolW
3010 PRODUCTION Aluminium - Production Anode Blocks t/day x x x x * x
3011 PRODUCTION Aluminium – Baking AB t/day x x x * x
3012 PRODUCTION Aluminium - ANODES t/day x x x x * x
3020 PRODUCTION Aluminium – Assembly AB t/day x x x *
3033 PRODUCTION Aluminium - 3033 t/day *
3030 PRODUCTION Aluminium - Hall C Primary Aluminium [t/day]
t/day x *
3120 FOUNDRY – Al secondary t/day x x *
3131 FOUNDRY - Rods t/day x x * x
3132 FOUNDRY - Loafs t/day x * x x
3135/3133 FOUNDRY - MeltT4 t/day x x * x
3136 FOUNDRY – Wide Strips t/day x x * x
FOUNDRY - 3199 t/day x x *
3135 FOUNDRY – Melt Preparation t/day x *
3134 FOUNDRY – HD Rods t/day x x * x x
18
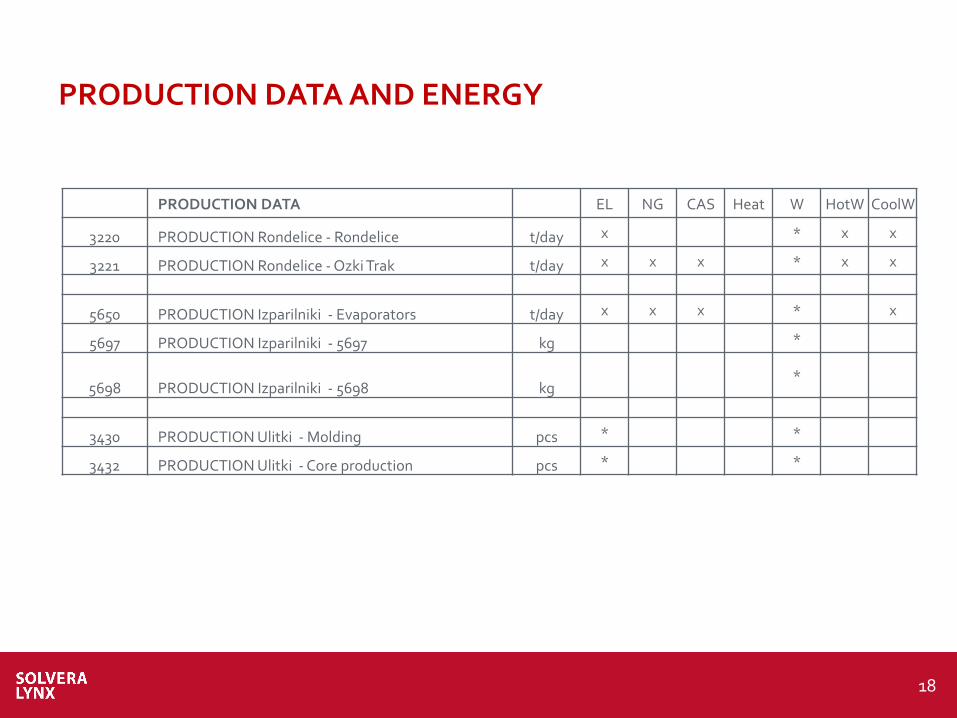
PRODUCTION DATA AND ENERGY
PRODUCTION DATA EL NG CAS Heat W HotW CoolW
3220 PRODUCTION Rondelice - Rondelice t/day x * x x
3221 PRODUCTION Rondelice - Ozki Trak t/day x x x * x x
5650 PRODUCTION Izparilniki - Evaporators t/day x x x * x
5697 PRODUCTION Izparilniki - 5697 kg *
5698 PRODUCTION Izparilniki - 5698 kg *
3430 PRODUCTION Ulitki - Molding pcs * *
3432 PRODUCTION Ulitki - Core production pcs * *
19
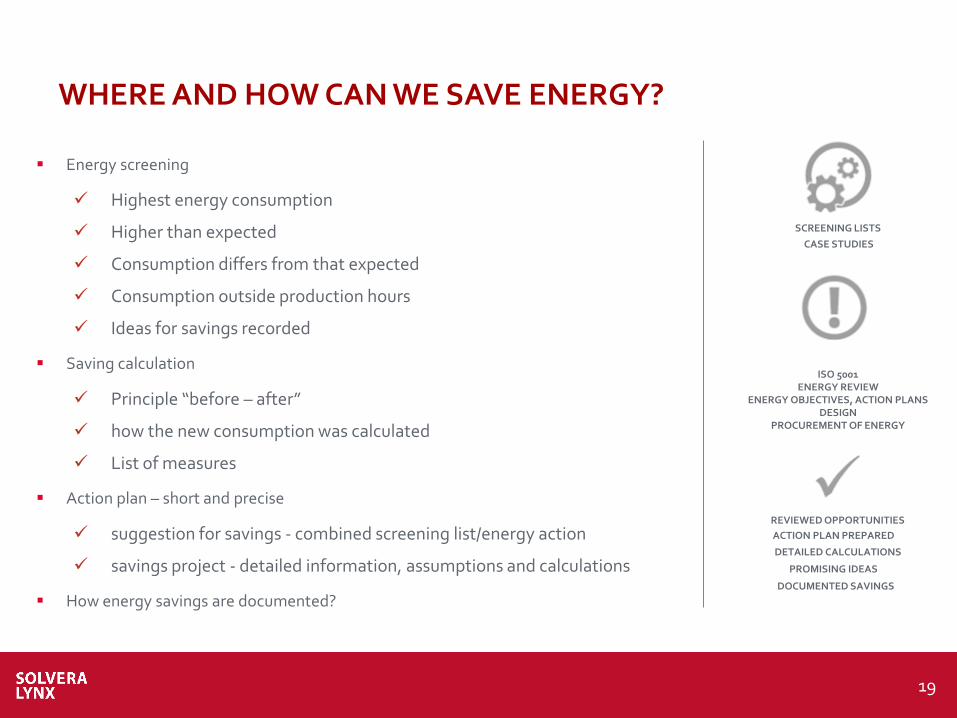
WHERE AND HOW CAN WE SAVE ENERGY?
Energy screening
Highest energy consumption
Higher than expected
Consumption differs from that expected
Consumption outside production hours
Ideas for savings recorded
Saving calculation
Principle “before – after”
how the new consumption was calculated
List of measures
Action plan – short and precise
suggestion for savings - combined screening list/energy action
savings project - detailed information, assumptions and calculations
How energy savings are documented?
SCREENING LISTS
CASE STUDIES
REVIEWED OPPORTUNITIES
ACTION PLAN PREPARED
DETAILED CALCULATIONS
PROMISING IDEAS
DOCUMENTED SAVINGS
ISO 5001 ENERGY REVIEW
ENERGY OBJECTIVES, ACTION PLANS DESIGN
PROCUREMENT OF ENERGY
20
ENERGY AUDITS WITH INFORMATION SYSTEM FOR ENERGY (AND DATA) MANAGEMENT TRADITIONAL (LEFT) AND ADVANCED (RIGHT) APPROACH TO ENERGY MANAGEMENT
Preparation for the energy audit
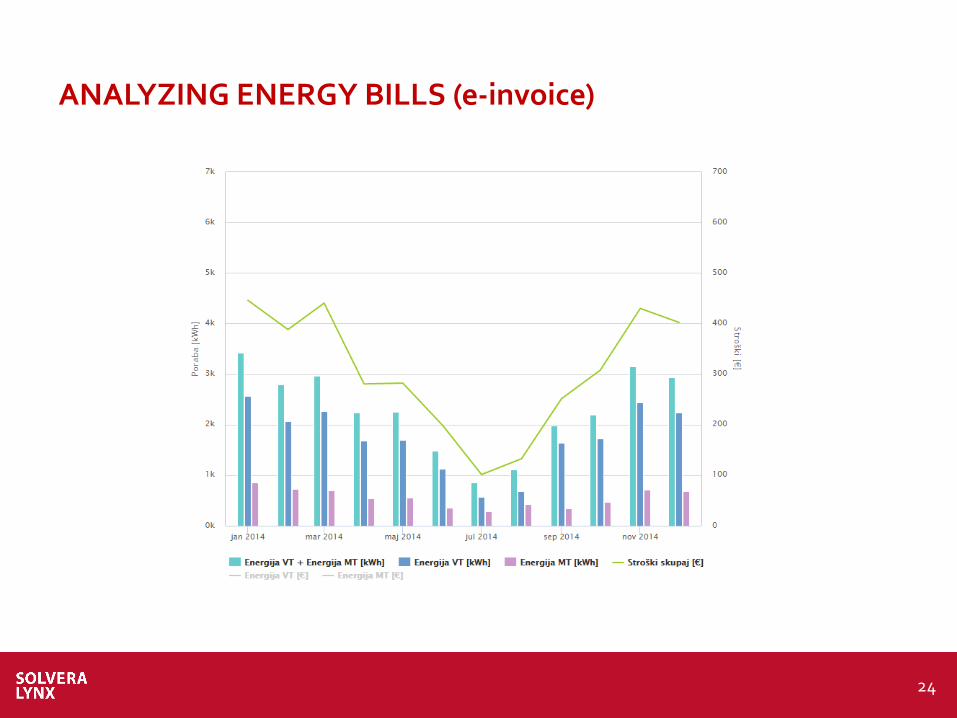
Analyzing energy bills (electricity, natural gas, coal and fuel oil)
Analyzing energy use and production patterns
Benchmarking and comparative energy performance analysis
Identifying energy efficiency and energy cost reduction opportunities
Cost-benefit analysis of energy-efficiency opportunities
Preparing an energy audit report
Post-audit activities
21
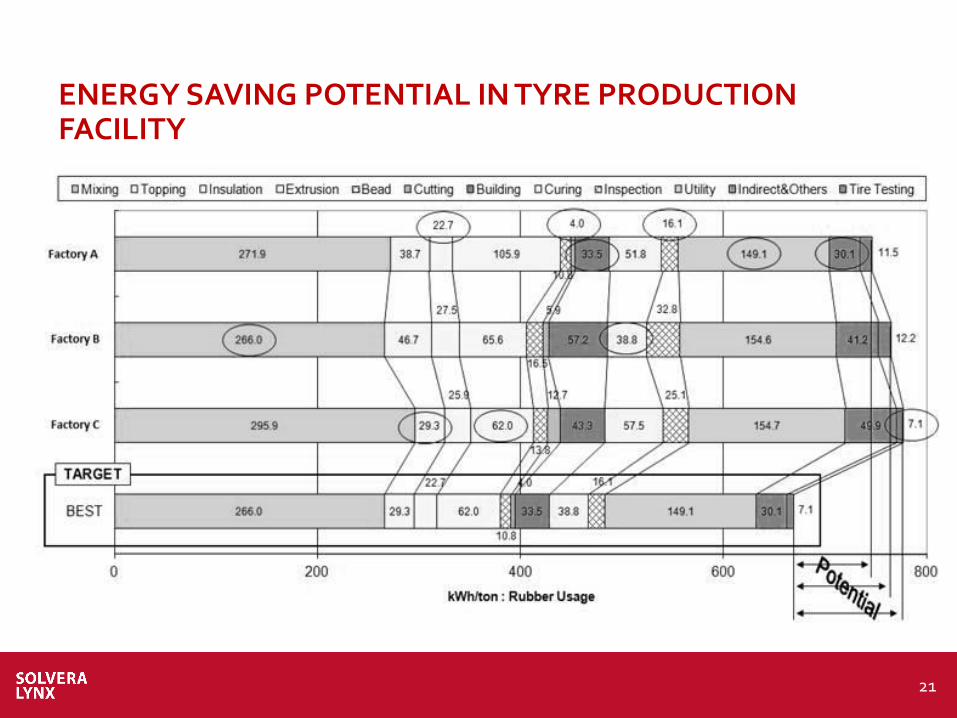
ENERGY SAVING POTENTIAL IN TYRE PRODUCTION FACILITY
22
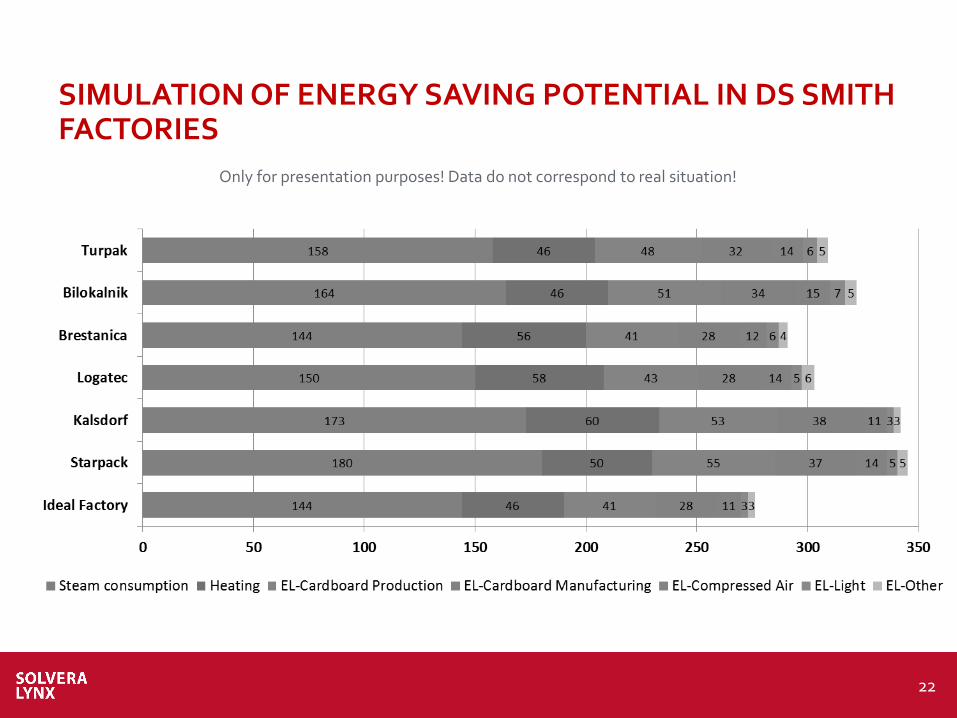
SIMULATION OF ENERGY SAVING POTENTIAL IN DS SMITH FACTORIES
Only for presentation purposes! Data do not correspond to real situation!
23
CONCLUSION
Include all DS Smith factories in region
Prepare key performance indicators (KPI) separated for each factory and each technology consumers:
Steam consumption kWh / kg of cardboard production
Heating consumption kWh / degree day
Gas consumption kWh / kg of cardboard production (degree day corrected)
Electricity consumption CBProd kWh / kg of cardboard production
Electricity consumption CBManuf kWh / kg of cardboard production (m2?)
Electricity consumption CAS kWh / kg of cardboard production
Electricity consumption kWh day/night
Gas costs € / kg of cardboard production
Benefits: control of separate energy consumers according to its efficiency, benchmarking of all factory processes,
energy efficiency and saving estimations.
24
ANALYZING ENERGY BILLS (e-invoice)
25
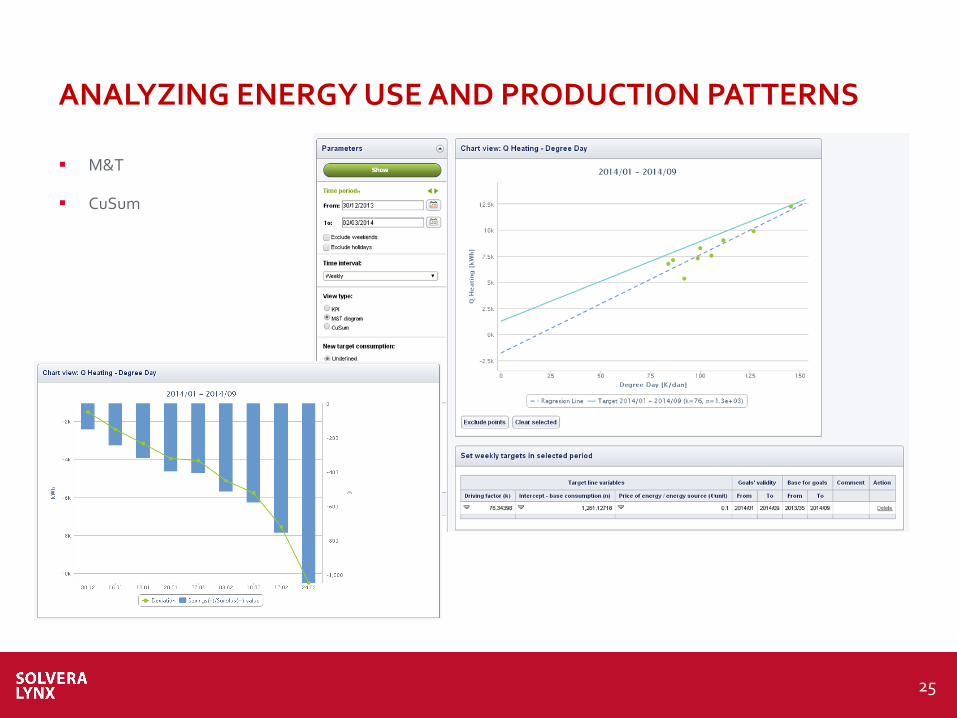
ANALYZING ENERGY USE AND PRODUCTION PATTERNS
M&T
CuSum
26
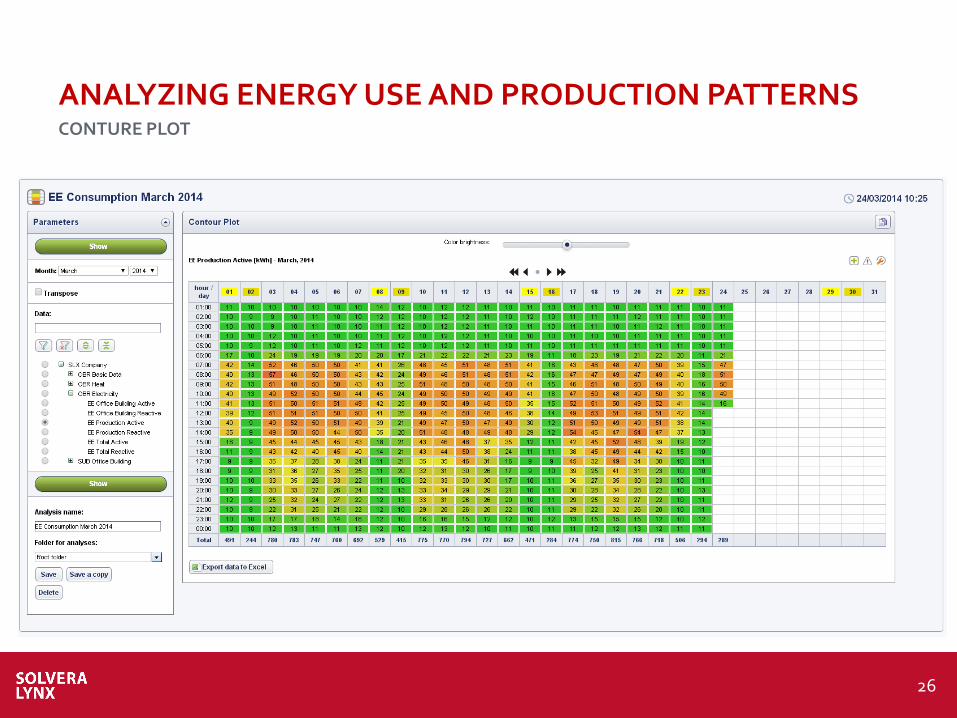
CONTURE PLOT
ANALYZING ENERGY USE AND PRODUCTION PATTERNS
27
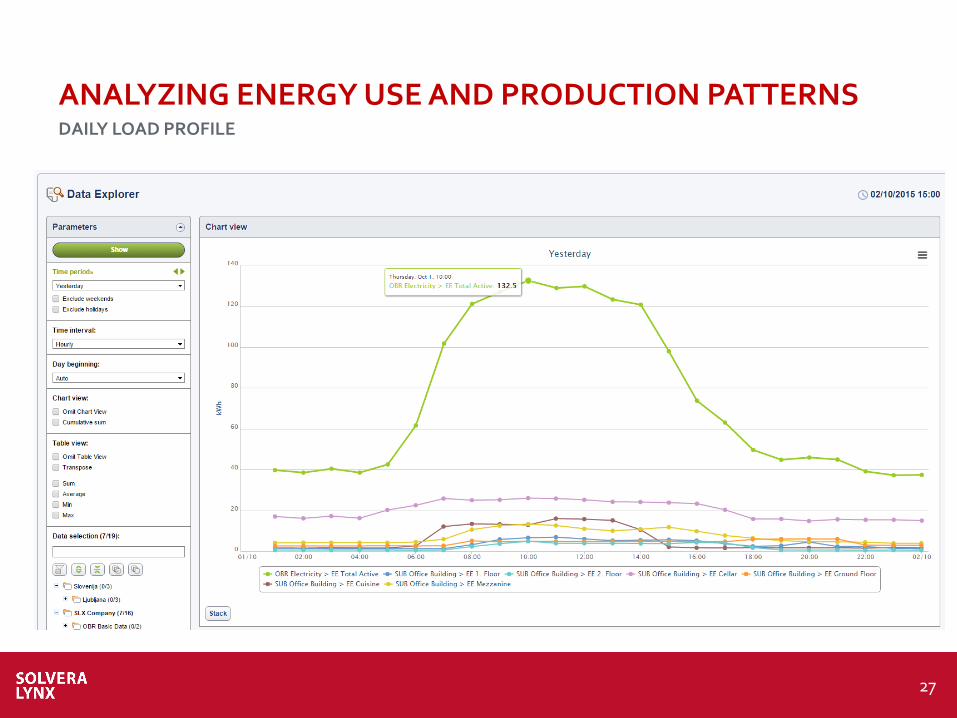
DAILY LOAD PROFILE
ANALYZING ENERGY USE AND PRODUCTION PATTERNS
28
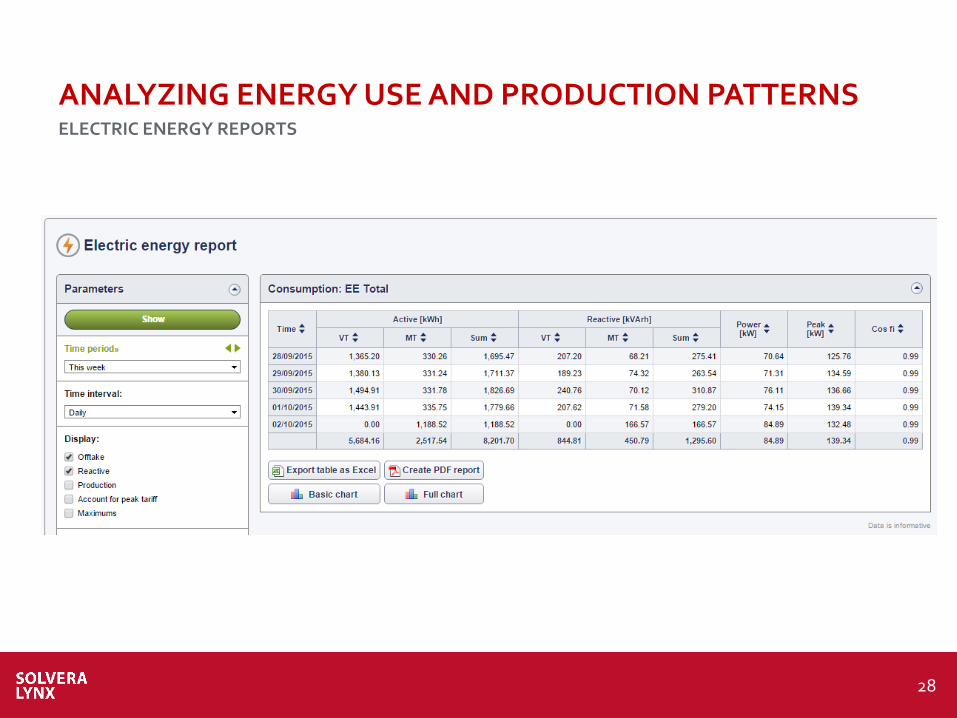
ELECTRIC ENERGY REPORTS
ANALYZING ENERGY USE AND PRODUCTION PATTERNS
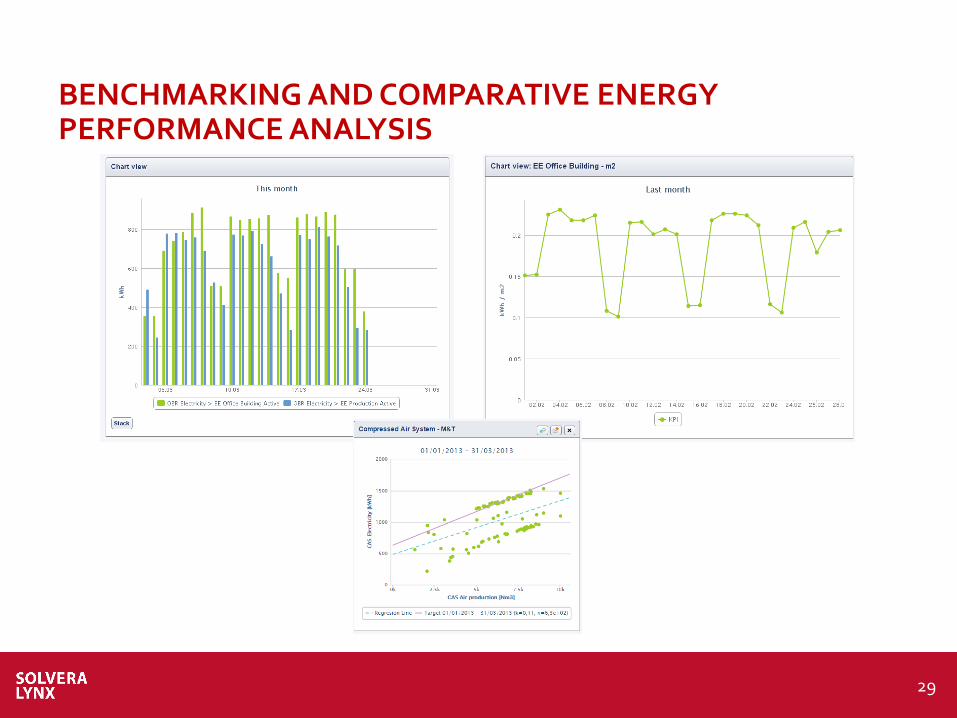
29
BENCHMARKING AND COMPARATIVE ENERGY PERFORMANCE ANALYSIS
30
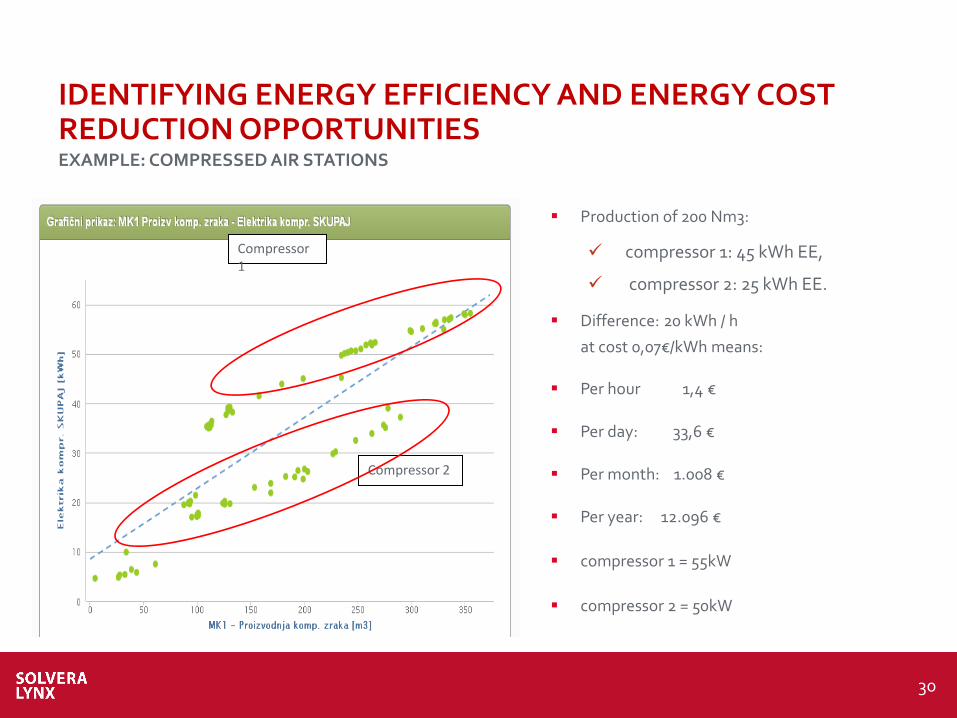
EXAMPLE: COMPRESSED AIR STATIONS
IDENTIFYING ENERGY EFFICIENCY AND ENERGY COST REDUCTION OPPORTUNITIES
Compressor 1
Compressor 2
Production of 200 Nm3:
compressor 1: 45 kWh EE,
compressor 2: 25 kWh EE.
Difference: 20 kWh / h
at cost 0,07€/kWh means:
Per hour 1,4 €
Per day: 33,6 €
Per month: 1.008 €
Per year: 12.096 €
compressor 1 = 55kW
compressor 2 = 50kW
31
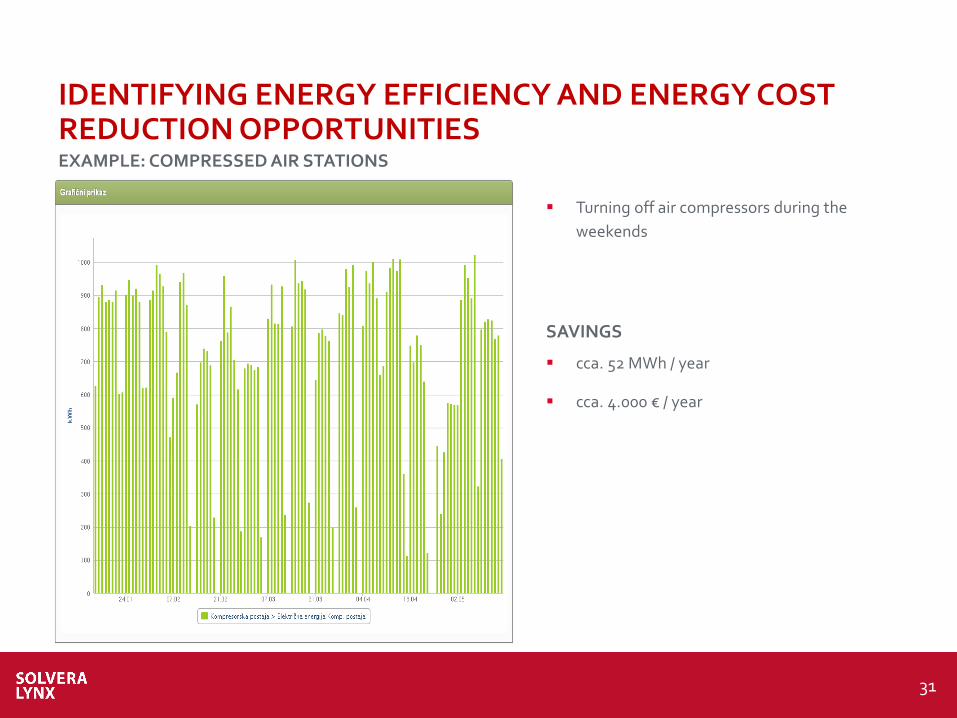
EXAMPLE: COMPRESSED AIR STATIONS
IDENTIFYING ENERGY EFFICIENCY AND ENERGY COST REDUCTION OPPORTUNITIES
Turning off air compressors during the
weekends
SAVINGS
cca. 52 MWh / year
cca. 4.000 € / year
32
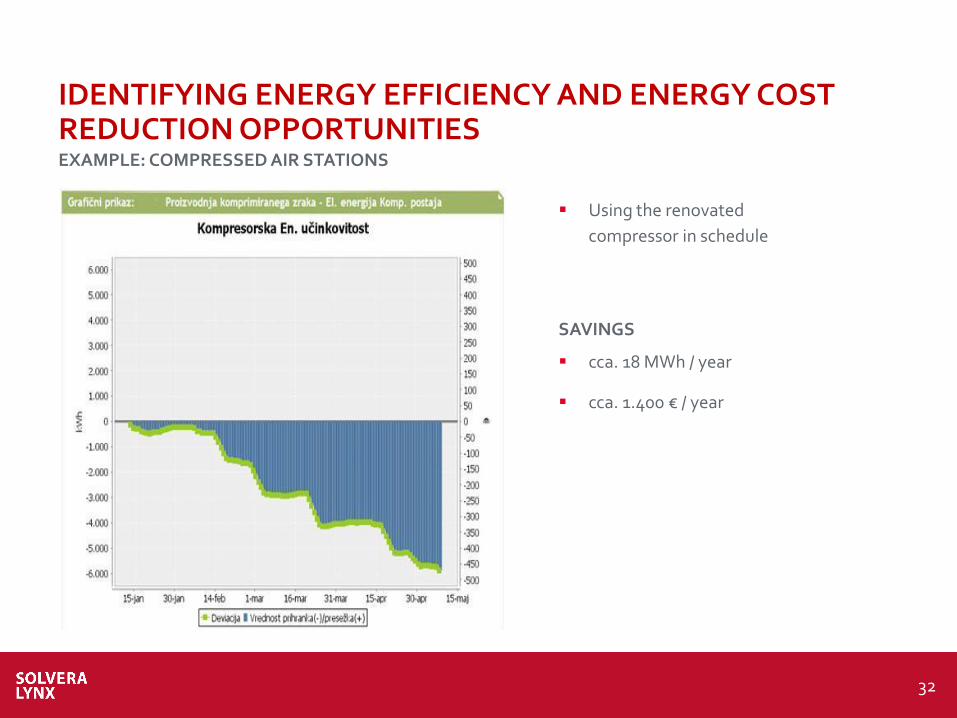
EXAMPLE: COMPRESSED AIR STATIONS
IDENTIFYING ENERGY EFFICIENCY AND ENERGY COST REDUCTION OPPORTUNITIES
Using the renovated
compressor in schedule
SAVINGS
cca. 18 MWh / year
cca. 1.400 € / year
33
WHAT IS THE DAY-TO-DAY APPROACH TO ENERGY MANAGEMENT?
How do we maintain focus on EM in our daily work
Establish a measuring plan to identify
Calculate and assess key figures
Ensure when recording major nonconformities
Setting criteria for efficient operation and maintenance
Maintaining focus on continuous maintenance
Maintaining focus on energy efficient purchasing
Maintaining focus on energy efficient design
Internal review
Fulfilled activities, system maintained, document control, folllow-up
Management review
is the system worth the cost?
do we get what we expect?
is adjustment required?
Input for review is status regarding improvement of energy efficiency
allocation of resources
ISO 5001 OPERATIONAL CONTROL
CHECKING MONITORING, MEASUREMENTS
INTERNAL AUDIT OF THE EM NONCONFORMITIES
CONTROL OF RECORDS MANAGEMENT REVIEW
ENERGY CONS MONITOREED
DAY-TO-DAY OPERATION
NOTRANJI PREGLED
VODSTVENI PREGLED
34
CONCLUSION
Use the parts of Energy Management System that makes sense
Continue the work you have already done Take one or more steps at a time Use the order of steps that works for you Spend the time it takes – progress is the goal Remember the positive influence on other areas in
the company Only in a certification process all the demands has
to be addressed!
TOOL BOX
ISO 50001
CHECKLIST
TIPS
35
THANK YOU!
Stegne 23A, 1000 Ljubljana
+ 386 1 40 12 860 / +386 1 40 12 861
http://www.solvera-lynx.com
Follow us on LinkedIN and Facebook