energy management control for multimode microgrid
TRANSCRIPT

Graduate Theses, Dissertations, and Problem Reports
2013
Energy Management Control for Multimode Microgrid Renewable Energy Management Control for Multimode Microgrid Renewable
Integration Integration
Roopa Ramachandran West Virginia University
Follow this and additional works at: https://researchrepository.wvu.edu/etd
Recommended Citation Recommended Citation Ramachandran, Roopa, "Energy Management Control for Multimode Microgrid Renewable Integration" (2013). Graduate Theses, Dissertations, and Problem Reports. 674. https://researchrepository.wvu.edu/etd/674
This Thesis is protected by copyright and/or related rights. It has been brought to you by the The Research Repository @ WVU with permission from the rights-holder(s). You are free to use this Thesis in any way that is permitted by the copyright and related rights legislation that applies to your use. For other uses you must obtain permission from the rights-holder(s) directly, unless additional rights are indicated by a Creative Commons license in the record and/ or on the work itself. This Thesis has been accepted for inclusion in WVU Graduate Theses, Dissertations, and Problem Reports collection by an authorized administrator of The Research Repository @ WVU. For more information, please contact [email protected].

Energy Management Control for Multimode Microgrid Renewable
Integration
By
Roopa Ramachandran
Thesis submitted to the
Benjamin M. Statler College of Engineering and Mineral Resources
at West Virginia University
in partial fulfillment of the requirements
for the degree of
Master of Science
in
Electrical Engineering
Parviz Famouri, Ph.D., Chair
Yaser P. Fallah, Ph.D.,
Muhammad A. Chouhdry, Ph.D.,
Lane Department of Computer Science and Electrical Engineering
Morgantown, WV
2013
Keywords: Battery Energy Management Control, Renewable Integration, Optimization in
PSCAD
Copyright 2013 Roopa Ramachandran

ABSTRACT
Energy Management Control for Multimode Microgrid Renewable Integration
Roopa Ramachandran
The need for storing energy has grown in correlation with the need for renewable and distributed
energy resources. Designing a storage unit system which complements the distributed generation
is required for increased efficiency and reducing the burden on the utility grid. The energy
storage model used in this thesis is the Li-ion battery which is efficient, has high energy density
and has applications in field of electronics, transportation and electric power industry. The wind
turbine generator, photovoltaic (PV) and the energy storage unit modeled in this work share a
symbiotic relationship even though they are completely separate entities which can be connected
at separate locations. This study contributes better control as well as ease of connection to the
system. To show the effect of storage unit on microgrid distribution system two test systems
were considered, standalone system and standard IEEE 13 node feeder system with wind turbine
generator and photovoltaic panel. The integration and control of energy storage system is
achieved using a battery energy management control (BEMC) at the upper level and a
real/reactive power controlled voltage source converter at the lower level. To enhance the
control, optimization is performed where the proportional gain and the integral time constant of
the PI controller are optimized using genetic algorithm which reduces the losses and increases
the efficiency of the system. The results show that the battery energy management control
system is effective in controlling the modes of operation of energy storage module based on the
wind and solar conditions and is able to completely balance the power produced by the wind
generator and PV modules. In this thesis all the test systems and the control were implemented in
PSCAD as it is emerging as the new industry standard for transient power applications research.

iii
ACKNOWLEDGEMENTS
I would like to sincerely thank my advisor Dr. Parviz Famouri for his guidance and
encouragement during the course of my study. This thesis would not be possible without his
support and advice. I would like to thank my committee members, Dr. Yaser Fallah and Dr.
Muhammad Choudhry for their invaluable insights and suggestions.
I would like to thank the PSCAD support team of Manitoba International for providing me with
the generic battery model and answering my doubts. I would also like to specially thank my
labmates Neda Nasirani and Kaveh Rahimi.
I would like to extend my gratitude to my husband for his patience and care shown during my
studies and to my Father, Mother, Brother, Father-in-Law, and Mother-in-Law for their prayers
and support.
iv
TABLE OF CONTENTS
Chapter 1 INTRODUCTION .......................................................................................................... 1
1.1 Background ........................................................................................................................... 1
1.2 Need for this work ................................................................................................................. 2
1.3 CONTRIBUTIONS AND Outline of the thesis .................................................................... 6
Chapter 2 LITERATURE REVIEW ............................................................................................... 7
2.1 Battery Models and Controls ................................................................................................ 8
2.2 Sizing and Cost-Analysis .................................................................................................... 11
2.3 Distribution System Applications ....................................................................................... 16
2.4 Wind Power Smoothing Applications ................................................................................. 18
2.5 Frequency Control Applications ......................................................................................... 20
2.6 Electric Vehicles Applications ............................................................................................ 21
2.7 Summary and contribution of current research work .......................................................... 23
Chapter 3 IEEE 13 BUS NETWORK MODEL ........................................................................... 24
3.1 Simulation Models and Tools ............................................................................................. 24
3.1.1 PSCAD ......................................................................................................................... 24
3.1.2 SimPowerSystems ........................................................................................................ 25
3.1.3 Power World Simulator ................................................................................................ 25
3.1.4 WindMil........................................................................................................................ 26
3.1.5 ETAP ............................................................................................................................ 26
3.1.6 ASPEN.......................................................................................................................... 27
3.1.7 Power Factory ............................................................................................................... 27
3.1.8 HOMER ........................................................................................................................ 28
3.2 Modeling IEEE 13 Node Test Feeder in PSCAD ............................................................... 29
3.2.1 3-PH and 2-PH and 1-PH Transmission Line Model ................................................... 30
3.2.2 Step Voltage Regulator Model ..................................................................................... 32
3.2.3 Load Model................................................................................................................... 37
3.2.4 Transformer Model ....................................................................................................... 39
3.2.5 Wind Turbine Generator Model ................................................................................... 40
3.2.6 Battery Model ............................................................................................................... 44
3.2.7 Converters and Control Model ..................................................................................... 50

v
Chapter 4 APPROACH AND IMPLEMENTATION .................................................................. 55
4.1 Overall System .................................................................................................................... 55
4.1.1 Standalone network ...................................................................................................... 56
4.1.2 IEEE 13 Node Test Feeder Network ............................................................................ 57
4.1.3 Building the model in PSCAD ..................................................................................... 58
4.2 Battery Energy Management CONTROL (BEMC) ............................................................ 60
4.3 Optimization power loss using Genetic Algorithm ............................................................. 62
Chapter 5 SIMULATION RUNS AND ANALYSIS ................................................................... 67
5.1 IEEE 13 Node Feeder Results ............................................................................................. 67
5.2 Li-ion Battery Model Results .............................................................................................. 73
5.2.1 Battery Discharging Mode Simulation Output Parameters .......................................... 75
5.2.2 Battery Charging Mode Simulation Output Parameters ............................................... 78
5.3 Multi-mode Battery Energy Management Control (BEMC) operation .............................. 82
5.3.1 Standalone Network ..................................................................................................... 82
5.3.2 IEEE 13 Node Feeder Distribution System Analysis with Wind Turbine Generator .. 89
5.3.3 IEEE 13 Node Feeder Distribution System Analysis with Photovoltaic Panel ............ 90
5.3.4 Microgrid Hybrid System Analysis .............................................................................. 92
5.4 Power Loss Optimization .................................................................................................... 94
5.4.1 Standalone network ...................................................................................................... 94
5.4.2 IEEE 13 Node Distribution Feeder Network ................................................................ 97
Chapter 6 CONCLUSION AND FUTURE RESEARCH .......................................................... 103
6.1 CONCLUSIONS ............................................................................................................... 103
6.2 DIRECTIONS FOR FUTURE RESEARCH .................................................................... 104
REFERENCES ........................................................................................................................... 105

vi
LIST OF FIGURES
Figure 3-1 IEEE 13 Node Feeder [30] .......................................................................................... 30
Figure 3-2 Single-phase view of Transmission Line .................................................................... 30
Figure 3-3 Three-phase view of Transmission Line ..................................................................... 31
Figure 3-4 Transmission Line Dialog Box ................................................................................... 32
Figure 3-5 Step Voltage Regulator Module .................................................................................. 33
Figure 3-6 Type B Step Voltage Regulator [61] ........................................................................... 33
Figure 3-7 Step voltage regulator in PSCAD ............................................................................... 35
Figure 3-8 Line drop compensator circuit [61] ............................................................................. 36
Figure 3-9 Spot load component ................................................................................................... 37
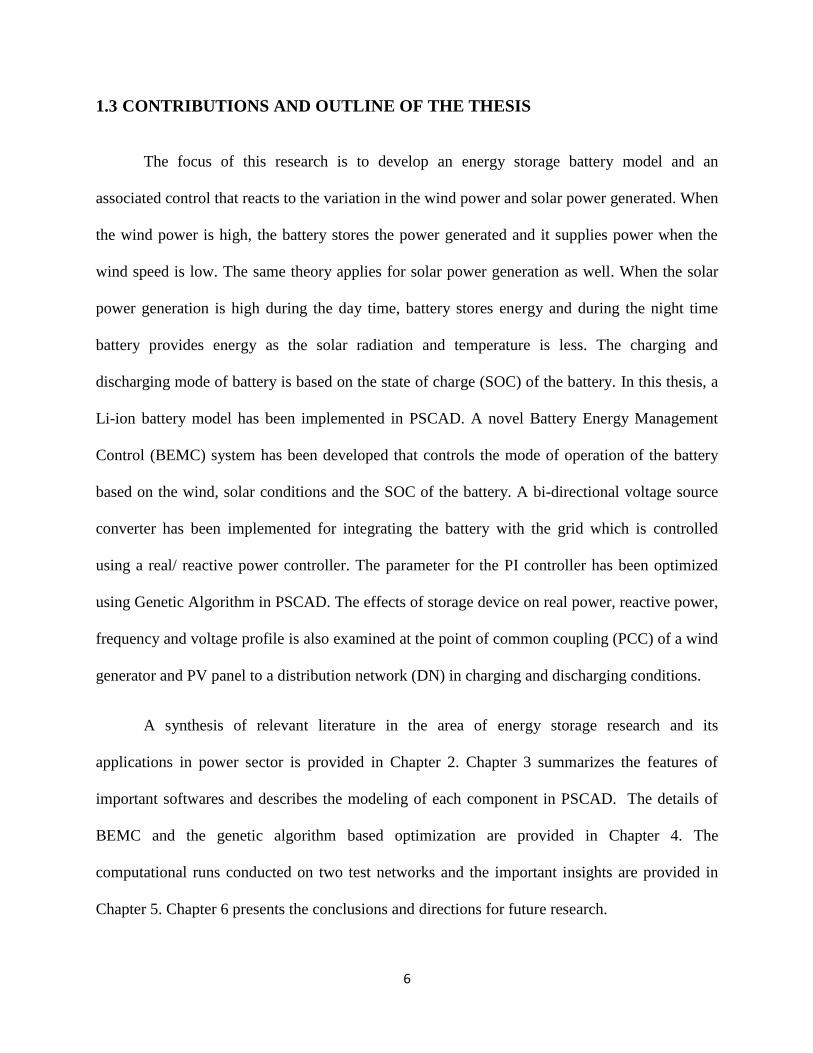
Figure 3-10 Phase to phase load module ...................................................................................... 39
Figure 3-11 Three-phase two winding transformer component ................................................... 39
Figure 3-12 Transformer dialog box ............................................................................................. 40
Figure 3-13 Wind turbine generator module ................................................................................ 41
Figure 3-14 Wind source component ............................................................................................ 41
Figure 3-15 Wind turbine and governor components ................................................................... 42
Figure 3-16: Induction machine component ................................................................................. 43
Figure 3-17 Battery Circuit Model ............................................................................................... 44
Figure 3-18 Discharge Characteristics [44] .................................................................................. 44
Figure 3-19 Li-ion battery module in PSCAD .............................................................................. 46
Figure 3-20 Battery module dialog box ........................................................................................ 46
Figure 3-21 Battery discharge control component........................................................................ 49
Figure 3-22 Battery charge control component ............................................................................ 49
Figure 3-23 Voltage Source Converter Model.............................................................................. 51
Figure 3-24 VSC in PSCAD ......................................................................................................... 51
Figure 3-25 Real/Reactive Power Controller ................................................................................ 52
Figure 4-1 Microgrid..................................................................................................................... 56
Figure 4-2 Standalone Network .................................................................................................... 57
Figure 4-3 IEEE Distribution Network ......................................................................................... 58
Figure 4-4 Flowchart for Battery Control ..................................................................................... 61
Figure 4-5 PSCAD control components for BEMC ..................................................................... 62
Figure 4-6 Flowchart..................................................................................................................... 66
Figure 5-1 Generic battery output parameters .............................................................................. 73
Figure 5-2 Li-ion battery output parameters ................................................................................. 74
Figure 5-3 Real and reactive power variation of storage/wind turbine module ........................... 75
Figure 5-4 Frequency and voltage variation of storage/wind turbine module in p.u .................... 76
Figure 5-5 Converter output voltage three phase waveform and rms value ................................. 76
Figure 5-6 Voltage and current across the dc link capacitor ........................................................ 77
Figure 5-7 Magnitude and angle variation of the reference signal ............................................... 77

vii
Figure 5-8 Modulation signals and battery discharging current ................................................... 77
Figure 5-9 Output voltage and SOC of battery ............................................................................. 78
Figure 5-10 Output speed and current of the induction generator ................................................ 78
Figure 5-11 Real and reactive power variation of storage/wind turbine module ......................... 79
Figure 5-12 Frequency and voltage variation of storage/wind turbine module in p.u .................. 79
Figure 5-13 Converter output voltage three phase waveform and rms value ............................... 79
Figure 5-14 Voltage and current across the dc link capacitor ...................................................... 80
Figure 5-15 Magnitude and angle variation of the reference signal ............................................. 80
Figure 5-16 Modulation signals and battery charging current ...................................................... 80
Figure 5-17 Output voltage and SOC of battery ........................................................................... 81
Figure 5-18 Output speed and current of the induction generator ................................................ 81
Figure 5-19 SOC Variation and Wind/Battery Power for Initial SOC 0.9 ................................... 83
Figure 5-20 SOC Variation and Wind/Battery Power for Initial SOC 0.1 ................................... 83
Figure 5-21 SOC Variation and Wind/Battery Power for Initial SOC 0.9 ................................... 84
Figure 5-22 SOC Variation and Wind/Battery Power for Initial SOC 0.1 ................................... 84
Figure 5-23 SOC Variation and Wind/Battery Power for Initial SOC 0.9 ................................... 85
Figure 5-24 SOC Variation and Wind/Battery Power for Initial SOC 0.1 ................................... 86
Figure 5-25 Variable wind speed .................................................................................................. 86
Figure 5-26 SOC Variation and Wind/Battery Power for Initial SOC 0.9 ................................... 87
Figure 5-27 SOC Variation and Wind/Battery Power for Initial SOC 0.1 ................................... 87
Figure 5-28 SOC upper charging limit variation and Wind/Battery power variation .................. 88
Figure 5-29 SOC lower discharging limit variation and Wind/Battery power variation .............. 88
Figure 5-30 SOC Variation and Wind/Battery Power for Initial SOC 0.9 ................................... 89
Figure 5-31 SOC Variation and Wind/Battery Power for Initial SOC 0.1 ................................... 90
Figure 5-32 SOC Variation and PV/Battery Power for Initial SOC 0.9 ....................................... 91
Figure 5-33 SOC Variation and PV/Battery Power for Initial SOC 0.1 ....................................... 91
Figure 5-34 Hybrid system with wind turbine generator and solar panel..................................... 92
Figure 5-35 Real power output of battery without PV module .................................................... 93
Figure 5-36 Real power output of battery with PV module.......................................................... 93
Figure 5-37 SOC of battery without PV module .......................................................................... 93
Figure 5-38 SOC of battery with PV module ............................................................................... 93
Figure 5-39 Power waveforms and total Pdiff for 10s run time ................................................... 95
Figure 5-40 Optimized power waveforms and total Pdiff for 10s run time.................................. 95
Figure 5-41 Power waveforms and total Pdiff for 60s run time ................................................... 96
Figure 5-42 Optimized power waveforms and total Pdiff for 60s run time.................................. 96
Figure 5-43 Power output to grid without battery ........................................................................ 97
Figure 5-44 Power output with battery ......................................................................................... 97
Figure 5-45 Power waveforms and total Pdiff for 10s run time ................................................... 98
Figure 5-46 Optimized power waveforms and total Pdiff for 10s run time.................................. 98
Figure 5-47 Power waveforms and total Pdiff for 60s run time ................................................... 99

viii
Figure 5-48 Optimized power waveforms and total Pdiff for 60s run time.................................. 99
Figure 5-49 Power output to grid without battery ...................................................................... 100
Figure 5-50 Power output with battery ....................................................................................... 100
Figure 5-51 Total transmission loss before optimization ........................................................... 101
Figure 5-52 Total transmission loss after optimization .............................................................. 101
LIST OF TABLES
Table 5-1 Power flow results comparison in each phase .............................................................. 68
Table 5-2 Comparison of total power flow ................................................................................... 68
Table 5-3 Load flow results .......................................................................................................... 69
Table 5-4 Comparison of regulator tap position ........................................................................... 69
Table 5-5 Power flow at each node............................................................................................... 70
Table 5-6 Comparison of node voltages ....................................................................................... 71
Table 5-7 Comparison of regulator tap position with wind generator .......................................... 71
Table 5-8 Comparison of node voltages with optimized parameters ......................................... 102

1
Chapter 1 INTRODUCTION
1.1 BACKGROUND
Conserving for the future has always been a positive notion for mankind. Power and
energy savings is the need of the hour because of the limited supply of functional resources.
Saving electrical energy can be realized in many different forms like gravitational energy in
reservoirs, kinetic energy in flywheels, electrochemical energy in batteries etc. Due to the
advancement in technology, energy storage devices have become one of the essentials of saving
energy. Its application has increased the efficiency of operation of renewable resources like wind
and solar. Hence studying, modeling, application, and analysis of Battery Energy Storage
Systems (BESS) have become a hot topic in power and energy fields of research. Studies
comprising storage technologies have been carried out for more than 100 years. Recently they
have gained popularity in the electronics, transportation and power industry. Toyota Prius,
Nissan Leaf, plug-in GM Volt and hybrid busses are only some of the examples that have taken
advantage of batteries in the transportation field. These energy storage devices are also gaining
momentum in utility sector for supplying reliable energy since it is reported that approximately
80 billion dollars is lost in short power interruptions in U.S. power market. Many countries have
already installed batteries for consistent management of power supply. In U.S, a 40-MW Ni-Cd
battery is employed in Fairbanks, AK as a backup in case of power failure. A 1-MW sodium-
sulphur battery is used in Long Island, NY as a provider of peak power. An 8 MW Li-ion battery
is deployed in Binghamton, NY for smoothing grid power [39] [10]. In West Virginia, Belington,
a 32 MW Laurel Mountain energy storage project is assimilated with the Laurel Mountain wind

2
farm to provide frequency regulation and to limit the rapid rate of change of wind power
oscillations [33].
1.2 NEED FOR THIS WORK
Due to the growing demands for energy and other socio-political and environmental
pressures, there is an increasing need to use renewable energy sources to complement the
traditional power sources. Wind turbine generators and Photovoltaic panels are the most
commonly employed sources of renewable energy. However integrating the renewable energy
sources into the power grid will entail overcoming significant technological challenges and
issues. Wind power generation is an unstable power source and the energy generated is
intermittent. Since 1990s, the annual growth of wind power in the world is more than 26%. Solar
energy shares the same property of variability and uncertainty like wind energy. Some of the
main challenges in integration of wind power and solar power are:
Management of uncertain and intermittent wind and solar power generation for
transmission: High level integration of renewable energy will result in increased
variability and intermittency leading to inaccurate load forecasting. Also transmission
constraints significantly reduce the actual contribution of solar power [26] [67] [17] [57].
Managing off-peak and peak periods: When the wind energy is high during the off-peak
period, there will be potential for over generation which can only be resolved either by
reducing wind power or the power output from baseline generation. When the generation
using renewable energy drops, additional conventional resources are required as standby
reserves to meet the variable generation and load conditions which results in inefficient
load points. There is more burden on the conventional resources during the morning and

3
evening in the case of solar power generation as solar power is low at that time. Also
there is increased burden due to keeping more generators on standby thus not meeting the
primary goal of integration of alternative energy which focusses on complementing the
existing system. High level penetration of PV resources causes reduction in power quality
due to voltage fluctuations and frequency variation. [26] [21] [17] [20] [57].
Voltage profile variation: Receding voltage profile due to reactive power absorption by
induction generators. Variation in voltage profile is also caused due to the injection of
harmonics by power electronic as well as other non-linear devices. Harmonic distortion
due to power electronic converters affects the voltage quality. [26] [17] [34].
Managing contingency conditions: Contingency conditions leads to potential overloading
of transmission lines, hence there is a need to analyze both normal and contingency
conditions in steady-state power flow studies. Continuous evaluation and infrastructure
improvement is required to check short circuit currents [17].
Stability: Dynamic simulations are required for stability assessments [17] [35].
High infrastructure costs: Wind energy harnessing sites are usually located in remote
areas, so to deliver power to the load centers large wind power transmission technology
and substantial infrastructure improvement is required and this increases the cost of the
system. For smooth operation, addition of complicated components is required since
electrical characteristics of wind generated energy and power quality are different from
the traditional plant generated energy [67] [17] [20].
System modification challenges: To integrate wind energy into the existing system,
modification to the system configuration and changes in current operating conditions are
required. The conditions for synchronizing like frequency, voltage phase and phase

4
sequence matching should be met by the power generated by alternative energy resources
[17] [36] [19] [20].
Regulation challenges: On the transmission side, grid system needs to be more flexible to
accommodate combined fluctuations of both load variation and renewable generation.
This issue can be resolved only through accurate regulation, close load following and
fast-ramping services [20] [57].
Predicting future wind speeds and solar radiation: Wind climate assessment and
forecasting methodologies are also required for reliable operation of the grid. Like wind
energy systems, weather forecasting is required for efficient operation. Seasonal and
geographic variation impact the solar power production. Even the moving clouds can
impact the voltage in power networks by producing fast and short irradiance fluctuations
[26] [21] [67] [57].
Addressing these concerns has become the main focus for numerous research efforts in the
domain of using renewable energy for meeting power load requirements. Some of the above
mentioned issues can be accounted for by integrating BESS along with renewable energy
resources [10].
Smoothing of wind power and solar power fluctuations: BESS technologies can be used
for stabilizing the output wind power as well as solar power. Storage devices act as buffer
systems and manage the intermittent nature of wind and solar energy. These devices
should have high ramp rate and must be able to charge and discharge quickly. They
should also be provided with power flow converters that can be used for either injecting
power into the system or absorbing power from the system. In the case of solar power,

5
energy storage devices can reduce the burden on the grid specifically at night time. [65]
[14] [55].
Frequency regulation: BESS can be employed for damping the oscillations shaped due to
the variable nature of wind speed and variation of solar radiation during a day. Frequency
domain analysis is done for studying the stability of the system. Storage devices with
high ramp rate and reasonable response time are favored for this application [9] [52].
Voltage and reactive power assistance: Power conditioning converters integrated in
batteries are used to improve the voltage profile and control the reactive power in a weak
grid. They can also protect the dc-link from over voltage. Batteries with high ramp rate
and fast power modulation are the main features required [8] [53].
Monetary benefit: Large storage devices can be used as spinning or stand-by reserves.
They are also useful in peak shaving and load following. Huge amount of money can be
saved by distributed generation (DG) owners by engaging the storage devices to absorb
power during off-peak hours when the spilled energy is more than 10% and by supplying
power at peak demand periods. Different market models are studied for cost-analysis.
Proper dimensioning or sizing to obtain optimized capacity plays a big role in managing
the expense and making profit [37] [16] [23].
Transmission loss and infrastructure reduction: In remote areas where wind generators
and solar panels are employed for power generation, connecting them to utility grid
requires long transmission lines. For continuous supply of power in these areas storage
devices can be used along with wind generators and solar panels. This reduces
transmission loss as well as saves money [28] [6].
6
1.3 CONTRIBUTIONS AND OUTLINE OF THE THESIS
The focus of this research is to develop an energy storage battery model and an
associated control that reacts to the variation in the wind power and solar power generated. When
the wind power is high, the battery stores the power generated and it supplies power when the
wind speed is low. The same theory applies for solar power generation as well. When the solar
power generation is high during the day time, battery stores energy and during the night time
battery provides energy as the solar radiation and temperature is less. The charging and
discharging mode of battery is based on the state of charge (SOC) of the battery. In this thesis, a
Li-ion battery model has been implemented in PSCAD. A novel Battery Energy Management
Control (BEMC) system has been developed that controls the mode of operation of the battery
based on the wind, solar conditions and the SOC of the battery. A bi-directional voltage source
converter has been implemented for integrating the battery with the grid which is controlled
using a real/ reactive power controller. The parameter for the PI controller has been optimized
using Genetic Algorithm in PSCAD. The effects of storage device on real power, reactive power,
frequency and voltage profile is also examined at the point of common coupling (PCC) of a wind
generator and PV panel to a distribution network (DN) in charging and discharging conditions.
A synthesis of relevant literature in the area of energy storage research and its
applications in power sector is provided in Chapter 2. Chapter 3 summarizes the features of
important softwares and describes the modeling of each component in PSCAD. The details of
BEMC and the genetic algorithm based optimization are provided in Chapter 4. The
computational runs conducted on two test networks and the important insights are provided in
Chapter 5. Chapter 6 presents the conclusions and directions for future research.

7
Chapter 2 LITERATURE REVIEW
This chapter describes past research relevant to the work conducted in this thesis in the
domain of different energy storage battery models, power electronic converters and controls that
are used for interfacing the storage devices to the utility grid, its effect on distribution network,
dimensioning the storage devices and applying them in different areas/locations of power and
energy sector. The general trends in energy storage devices and applications are given in papers
[63] [39] [10] [64]. In [63] the authors have reviewed current relevant works in the domain of
optimum sizing of standalone hybrid generation systems. Optimum sizing is important for better
economic returns and also is related to the reliability of the system. The authors have segregated
the spheres of optimization into four main categories - the graphical construction method,
probabilistic approach, iterative method, and artificial intelligence method. The authors also look
into works for statistical and time series generation of meteorological data as well as the papers
which are connected to the modeling of photovoltaic arrays, wind turbine system and energy
storage system. The authors have identified power reliability analysis and system cost analysis as
the main criteria for the hybrid system optimization.
In [39] the author studies the past, present and future developments of energy storage
system focusing more on Lithium based batteries and their cell chemistry. The author briefly
discusses about the needs of energy storage in electronic industry, transportation industry and
utility grid. The author discusses the general advantages of renewable energy which are reduced
cost, power output stability, and peak shaving capability. He proposes his vision for the next
twenty five years for energy storage devices pointing out a cost effective scenario with low cost
flow batteries built in each home and cars with electrical drives and thermal storage system. Low

8
cost metal oxygen or metal sulphur will be more popular and due to limited supply of lithium in
the world, non-lithium based battery technology will gain momentum. However currently and in
the near term future lithium based batteries will be used widely.
2.1 BATTERY MODELS AND CONTROLS
There are different models of battery and power conditioning units that are used in the
research [44] [7] [8] [53]. The authors have listed three types of battery models –
electrochemical, experimental and electric circuit based and used the electric circuit based model
as it can represent the state of charge (SOC) of the battery as a state variable in [44]. Their model
has a control voltage source in series with a constant internal resistance. The authors point out
that a disadvantage in the Shepherds model [18] is the algebraic loop problem in the closed loop
simulation of the battery model. They derive equations for extracting approximate values of
internal resistance based on efficiencies of batteries. The battery model parameters are estimated
for common types such as lead acid, nickel cadmium, lithium ion, and nickel metal hydride from
the discharge curves of the batteries. These parameters are based on voltage at full charge,
exponential zone end and nominal zone end. The models were validated using MATLAB
SIMULINK Simpower systems and were compared with the manufacturer’s data sheet. The
model was also implemented in Toyota Prius THS II vehicle. The authors concluded that
accuracy in battery model is important for better control and management of energy. Battery
lifetime, efficiency and the control applied in the Power Conditioning System (PCS) are also
important factors for better performance. Application of super capacitors increases the battery
lifetime in a small wind farm hybrid system (less than 10 KW) [7]. The authors develop a control
algorithm to move the high frequency component of current in charging and discharging towards
the super capacitor in real time. They employ a hysteresis current controlled DC/DC converter

9
for controlling the inductor current and a voltage control loop is implemented for keeping the
super capacitor voltage greater than the battery voltage. They have tested their theory in a
prototype in a 12 V 75 AH lead acid battery series with 24 V DC nominal voltage. They used 22
super capacitors each with 2.7 V DC 1800 F capacity. The system was simulated in MATLAB
SIMULINK. The authors concluded that by using battery super capacitor hybrid system the
reversal of polarities are less and hence the SOC of battery undergoes lesser number of charge
and discharge cycles. Rain flow counting algorithm was used to determine the battery cycle for a
period of 7 days. They have also mentioned that the battery lifetime increases approximately
19% by using a super capacitor. In addition they have noticed the reduction in peak current
which reduced the battery stress. The losses are more in the hybrid system; approximately 4.1 %
compared to the system without super capacitor.
Different controls for the power conditioning system (PCS) are discussed in [8] [53] [51]
and [1]. The authors look into two different scenarios – one when a unidirectional power flow
controller acts as an interface between the DC side and the AC side in [8]. This controller is
responsible for voltage regulation on the DC side. The second scenario is the fully controlled bi-
directional AC-DC and DC-AC converter system which controls the bidirectional flow of power.
In the paper they illustrate both the scenarios using mathematical modeling and circuits. They
support their argument by comparing simulation and experimental in transient as well as steady
state conditions. The authors conclude that the vector decoupling technique is effective in power
sharing between DC and AC microgrids.
The authors investigate the single phase bi-directional DC/AC converter in [53] which is
connected to an AC microgrid. In the inverter mode for the power flow controller three different
types of switching schemes are considered – hysteresis current control, predictive control, and

10
the ramp comparison control. For the charging mode, the authors used the trickle charging
method keeping the duty cycle constant and found that this method was not the best way. The
system was implemented in MATLAB/SIMULINK and output wave form for hysteresis and
ramp comparison switching control scheme in inverter mode were studied.
In [51], the authors study the supervisory control strategy on a hybrid system with wind
turbine generator, photovoltaic cells, and energy storage unit – connected to a common DC bus
interfaced with power electronics converters. The authors look into three different modes of
control for the grid inverter at the supervisory control level. The first is the normal operation
where the wind and the PV arrays act as complementary sources to provide maximum power
output and no storage is connected to the system. The common bus voltage is maintained by the
grid inverter. The second is the dispatch operation mode. Here the wind photovoltaic array and
the battery output power are controlled to reach a desired set power. This is useful in peak load
shaving, active load control etc. The third mode is the averaging operation mode. Here the output
power as well as the voltage and current harmonic variations are stabilized with power averaging
control. Its successful implementation requires prediction of average output power of wind,
photovoltaic and battery system. In addition to the supervisory control each source has its own
local control. The wind turbine has the variable speed control to regulate the active reactive
power. Maximum Power Point Tracking (MPPT) control provides maximum power output for
photovoltaic arrays. Modified hysteresis control is implemented for battery charging and
discharging to maintain a common DC bus voltage. They performed the simulation studies in
PSCAD/ EMTDC as well as deployed the control on a 30 KW prototype of the hybrid system.
They concluded that the control strategy is effective and efficient in all modes of operation. They
were also able to stabilize the output power current harmonic and excursions.

11
A back to back converter interfaces a Permanent Magnet Synchronous Generator
(PMSG) to grid in a wind storage hybrid system [1]. The storage is connected across the
common DC link through a DC/DC buck boost converter and a dump resistance. The wind
turbine generator speed follows the wind speed for maximum power output. The error along with
the real power output is used as a reference to generate gate pulses using space vector pulse
width modulation (SVPWM) technique for the generator side converter. The grid side converter
is fired using gate pulses generated by the difference in reference DC voltage and the actual DC
voltage. It is also used in regulating the reactive power output. The authors study two modes of
operation – one with constant wind and variable load and the other with constant load and
variable wind. They were able to show how the storage bridges the gap between the generator
current and the load current. These modes are implemented in PSIM software. The control is
found to be effective in regulating the output power and voltage in spite of the variations in wind
power.
2.2 SIZING AND COST-ANALYSIS
There are numerous papers which focus on dimensioning the storage devices and the
benefit of procuring an income from optimum sizing. In [37] , the system mainly consists of
photovoltaic panels, Valve Regulated Lead Acid (VRLA) battery and ultracapacitor banks as the
sources in isolated Hybrid Energy Storage Systems (HESS). Different scenarios like constant,
peak, pulse and domestic load conditions were used to study the undersized, oversized and
optimized system. Initially the authors calculated the number of solar panels required to meet the
average load considering the solar radiation and temperature. Then they computed the number of
battery cells in series and parallel to supply the total load for a certain period of time and the
number of ultracapacitors required to meet the peak load demand. The system performance was

12
evaluated and the number of solar panels, batteries and ultracapacitors are adjusted based on the
lifetime system cost and the Loss of Power Supply Probability (LPSP) in a MATLAB Simulink
model. The authors rationalize the optimization by stating that undersized and oversized batteries
results in overcharging and sulphation and stratification respectively when compared to the size
of solar panel. Increased number of ultracapacitor will also increase the capital cost.
Energy Management Systems (EMS) minimizes the storage size and hence the cost of
hybrid winds energy systems. When the wind penetration increases, some of the main issues
emerging are power imbalance, voltage excursions and low voltage ride through (LVRT)
capability [16]. The authors suggest that energy storage systems (ESS) together with power
electronic interface can smooth out the power fluctuations created due to wind generation and
will also have the capability for low voltage ride through (LVRT) by serving as a power sink
during low system voltage events. They have also listed some of the short term (Supercapacitors,
Superconducting Magnetic Energy storage Systems (SMES) etc.) and long term (Batteries,
Hydro pump storage etc.) energy storage devices and their properties. The authors indicated
different configurations of back-to-back voltage source converters (VSC) connected to the DFIG.
The energy storage system was connected to the DC grid interfaced with bidirectional two
quadrant DC/DC converters. The authors provided a fuzzy rule based EMS which was based on
wind speed data, ESS device status and AC voltage measurements. The EMS adopts a reference
grid power based on these rules which helps in stabilizing the output power. The authors also
suggest that the EMS can be implemented on a higher level using SCADA systems. Then the
authors discuss the system in two different operating scenarios, one with the normal operating
conditions in islanded mode and the other is the case with a faulted transmission network. In

13
normal operating condition ESS stabilizes the output power and in faulted system scenario ESS
is better than the active crow bar case in voltage magnitude response characteristic.
The authors have tried to achieve the optimized solution for the sizing of solar wind
hybrid system in order to minimize the loss of power supply probability (LPSP) to improve
power reliability and minimum annualized cost of the system (ACS) in [23]. Genetic algorithm
was used to obtain the solution for the optimization problem for a remote telecommunication
relay station. The authors developed models for PV array, wind turbine generator, and battery
units. They have particularly focused on SOC, floating charge voltage, and lifetime of the battery
system and considered these variables as the constraints for the optimization. This minimizes the
total system cost by meeting the LPSP criteria. A lead- acid battery with 1000 ampere hour
rating and 24 V nominal voltage was used. The authors concluded that with only one of the
source the same LPSP is achieved at higher cost. Energy storage life of 3 to 5 days has been
found suitable for power reliability and system configuration of hybrid system and system
configuration in 1% and 2% LPSP case.
Several studies have exclusively advocated energy storage as a solution to reduce the
operating cost of large scale wind integrated systems [58] [56] [11] [5] [54] [66]. According to
[58], energy storage will reduce the burden on hydro and fossil fuel energy generators. Here
power flow control approach is used to determine the dimensions of the zinc-bromide flow
battery system. The simulations are implemented in MATLAB. Initially the actual wind farm
data is used to forecast the combined power output of wind farm and the energy storage system
allowing only ±4% error, 90% of the time. This forecast model is based on one-hour ahead
persistence model. The authors come up with a technique to determine the desired energy storage
power output command for the power flow controllers which determines its charging (negative

14
command) and discharging (positive command) course. This technique is based on a set of rules
centered on the SOC of the battery, forecasted wind power output and actual wind power output.
These rules are implemented using simple, fuzzy, artificial neural networks (ANN) and advanced
ANN logic algorithms to obtain an optimized cost-effective energy storage system. The authors
conclude that simple and fuzzy control logics have much less error occurrence than the ANN
based control logics. But the advanced ANN produced the best results in terms of cost.
In [56], the authors discuss the ability of sodium sulphur (NAS) battery to shift the wind
generation from light load to heavy load condition and limit the ramp rate of the wind farm
output. They also consider the battery as a separate entity and present the cost and market
analysis for employing the battery as a source. The battery they considered is a 1 MW 7.2 MWH
85% efficient NAS battery. The depth of discharge (DOD) of the battery is 90%. They show how
an optimally employed battery is able to shift the wind generating and its successful six hour
discharge at peak load and ramp up period. They discuss the implications for the total revenue
obtained by using battery for each application over a period of time. They conclude that the
benefit is maximized when the battery is used as an operative reserve with longer battery lifetime
greater than 20 years.
A new optimization technique based on forecasting of export power, minimizing the
variability of wind power, maximizing the total output energy and hence maximizing the total
revenue is proposed in [11]. The authors also develop a computationally efficient linear program
based on buffer based smoothing problem where the battery capacity is used as the buffer to
stabilize the export power. Losses occurring due to excess energy and battery charging and
discharging are modeled. The authors conclude by showing how the method was used to

15
maximize revenue by maximizing the energy export and draw comparisons between wind power
output smoothing and video smoothing.
The authors have focused on economic factors like capital cost, replacement cost,
operational maintenance cost in minimizing the overall system cost using genetic algorithms in
[5]. The objective function aims to reduce the system cost and total diesel fuel consumption cost
subjected to power and voltage constraints. Simulation results show the optimized number of
batteries, PV cells, wind generators and diesel power requires reducing the system cost for two
different cases of annual wind speed and solar radiation.
Reducing the power fluctuations and charge discharge cycle of a wind BESS hybrid
system reduces the total system cost [54]. This system also includes a capacitor in parallel with
the battery which reduces the charge discharge cycle for the battery by reducing the current
drawn from the battery. A 1.5 MW wind turbine generator connected to a DFIG and 25 KW
battery capacity is used. In this work to smooth out the power fluctuations, the authors have
separated the frequency into two regions by a high pass filter and a low pass filter. One region
which is used to increase the BESS capacity to stabilize the output power variation lies between
0.01 Hz and 1 Hz and the other frequency window above 1 Hz is discarded. The authors have
implemented the system in MATLAB and demonstrated how their controller is able to smooth
power output excursions in addition to decreasing the BESS capacity.
A DG owner can maximize his profit by storing all the spilled wind energy into an
Energy Storage System (ESS) [66]. A cost-benefit analysis was also performed by the authors to
verify their notion. The size of ESS was calculated based on the power and energy rating of the
spilled wind energy. The total annual cost of the system includes the capital cost, maintenance

16
cost and replacement cost. The multi-objective optimization problem formulation (OPF) is to
minimize the total annual cost with optimum size and location of ESS. The ESS acts as a load
during the off-peak periods and as a source during the peak demand time. The authors used a
27.6 kV rural distribution network with peak load of 18.2 MVA and maximum feeder capacity of
300A for the case study. Also connected to the system are three distribution generators. ARMA
model was used to generate the wind speed data in MATLAB and demand profile was obtained
from IEEE-RTS. The authors found that maximum amount of energy were spilled during the
winter nights which were used as the main factor for determining the size of ESS. In conclusion,
Zn/Br ESS was found as the most economical for the distribution system as it was the least
expensive ESS technology.
2.3 DISTRIBUTION SYSTEM APPLICATIONS
Connecting the storage devices to a distribution network and analyzing its implications
on the network is important to study the reliability of the system. To date relatively few papers
have focused on this area [4] [3] [28] [6]. In [4] and [3], the authors develop a flexible battery
management system (FBMS) for active reactive optimal power flow (A-R-OPF) in distribution
systems. The solution for A-R-OPF problem is to minimize the transmission energy loss and
expand the voltage profile. They have used a mixed integer nonlinear program to optimize the
charge and discharge time periods of battery for each day [4]. This program is implemented in
two stages. The integer variables like the charge discharge periods are optimized in the upper
stage and the continuous variables are optimized by the nonlinear program (NLP) in the lower
stage. The battery charging and discharging have been restricted to one cycle per day. The
authors have studied three different energy price models and recommended a two-tariff price

17
model in which the spilled energy from the wind generator during the off-peak hours can be
stored at lower tariff and this energy can be released during peak hours at higher tariff for
economic benefit [3]. The model of Energy storage System (BSS) along with the Power
Conversion System (PCS) generates both active and reactive power. The demand profile for the
simulation is obtained from IEEE-RTS winter days. The A-R-OPF optimization problem is to
maximize the profit and minimize the loss with wind power and demand curve as the inputs. The
decision variables are active power, reactive power and wind power curtailment factor. One-day
and multi-day time slices were considered for optimization. The authors tested their theories on a
27.6 kV, 41 bus radial distribution network with maximum feeder capacity 14.3 MVA. Three
embedded wind generators and five BSS were also connected to the network. The authors found
that 12% energy loss reduction and 90% reactive energy supply can be achieved through their
optimization strategy. It is also economically beneficial in addition to the curbing of output
power fluctuations.
A linear lossless DC OPF in IEEE 30 bus and IEEE 118 bus system with and without
location constraints on storage devices is used in [28] for maximum economic benefit as well as
reduced transmission and generation losses. Linear function of rated power and energy is applied
in network reduction method for proper deployment of storage devices in order to increase the
system efficiency. The authors concluded that for an optimally dispatched renewable generation,
fewer number of storage devices are needed and hence prove more economical.
The technical and economic aspect of connecting a distributed generator (DG) to a
distribution network is described in [6]. The technical aspect is studied by focusing on the
transient stability of the system with DG, storage devices, and ultra-capacitors subjected to
different types of fault and penetration levels. Rotor speed and angle, oscillations and terminal

18
voltage are taken as the transient stability indicators. The economic aspect is studied by taking
into account the cost of the system with distributed generators, storage devices, and
ultracapacitors. This analysis is carried out using a simulation tool called “hybrid optimization
model for electric renewables (HOMER)” developed by National Renewable Energy Laboratory.
The transient stability was studied in an eight bus system with three DG’s and storage devices
which were modeled in MATLAB SIMULINK. The authors concluded that the net present cost
of diesel generator decreases when storage device is added. Diesel battery system cost was less
compared to the diesel ultra-capacitor system cost due to higher cost for ultra-capacitors. In
addition, the storage devices also enhance the transient stability of the system.
2.4 WIND POWER SMOOTHING APPLICATIONS
Numerous works have been conducted for wind power smoothing for both stand-alone
and grid connected applications of storage devices [65] [14] [55] [47]. In [65], the authors
propose the BESS as a buffer power source that complements the stochastic wind power source
in order to deliver a steady power to the grid. The hybrid system mainly consists of a PMSG-
turbine with Lead-acid BESS and a capacitor connected across back-to-back converter which is
tied to the main grid. The difference between the varying wind power and the fixed power
supplied to the grid gives the battery power and energy. The battery capacity is designed based
on the maximum deviance value. These values are then used to determine the optimal value of
constant power delivered to the grid which proves the most cost-effective. The authors also
estimate and numerically derive the value of shunt capacitance needed to maintain the dc-link
voltage within limits. The capacitor acts as harmonic filters and in addition intersects the
transient voltage violations. The authors simulate the system using PSCAD/EMTDC and
MATLAB simulation software and exemplify the proposed scheme using an example.

19
In [14], the authors study the effect of BESS integrated with a STATCOM for wind
power applications. For BESS modeling the authors propose two different types of equivalent
circuits and control strategy. The first is based on open circuit voltage of battery and the second
is the current based method which varies with battery SOC. A third order lead acid battery model
which is validated through experimental and simulation based studies is used by the authors. The
battery parameters are obtained by optimization. The size and performance of battery with
converter and control is evaluated to obtain the complete system. The authors conclude that this
system along with the STATCOM can stabilize the wind power output. The authors also suggest
that with higher nominal current of battery, higher charging and discharging cycles will occur
and hence the size of the batter is a significant factor in designing the system.
The authors focus on optimizing the use of BESS for large wind farms [55]. BESS is
designed to balance the error between wind power output and the reference wind power
forecasted from the average power output for the next one hour. The authors also mention the
importance of state of charge (SOC) and depth of discharge (DOD) in the context of battery
lifetime. For BESS optimal control, the controllability of a state space model is checked. The
performance index (PI) of the control is specified using a quadratic cost function along with the
constraints and limits. The solution to the optimal control problem is obtained using two
methods. Initially they implement the open loop control optimal control (OLOC) for signal
control periods of 100 seconds, 5, 15 and 30 minutes. OLOC was not able to meet the limits
when the control period was more than 15 minutes. This issue was solved using the model
predictive control algorithm (MPC). The simulations were performed in PSCAD/EMTDC and
the optimal control problem was solved using DIDO version 7.3. From the PI measured, the
authors concluded that the best performance was obtained when the prediction window was

20
longer since it reduces the occurrence of big variations. The authors also concluded that 15-25%
of the size of the wind farm is required for BESS capacity to smooth out the wind power output
effectively.
In [47], the authors have focused on reducing the wind power fluctuations at two
different time scales. In one the maximum power fluctuation restrictions (MPFRs) of wind and
BESS output is limited for one minute time window and in the other the MPFRs is limited for 30
minute time window. To attain dynamic stability and operation economy both the operations are
performed simultaneously. The authors develop a discrete first order low pass filter (FLF)
configuration to smooth the output power of wind with variable time constant (Tf). Particle
swarm optimization (PSO) is used to determine the optimization variable associated with Tf. The
authors propose a procedure for coordinating the two timescale controls in restricting the power
fluctuations. A MATLAB SIMULINK simulation of a 750 V Lithium Ion battery connected to a
6 MW wind farm was performed. The authors have also derived the capacity and power rating of
the storage and concluded that the FLF algorithm is efficient in reducing the wind power
fluctuations.
2.5 FREQUENCY CONTROL APPLICATIONS
The frequency impacts of BESS have been researched by several authors [9] [52]. BESS
is used for primary frequency control in [9]. The authors compare four different types of battery
energy storage system (BESS) technologies and conclude that Lead-Acid BESS is the most cost-
effective for a 10MW unit. The authors also discuss pricing and market for the primary
frequency control reserves in central European countries. They propose solutions for power
balance by limiting the non-critical frequency window to ±20 mHz using optimized capacity for

21
BESS units. They suggest that maximum profit will be obtained by using dynamically varying
SOC limits, recharge power, sell power as main constraints and using emergency resistors as
budget constraints in case of extreme frequency digression where the SOC is at maximum for the
BESS unit.
The effects of frequency fluctuation damping due to a disturbance in the power output of
a microgrid is analyzed in [52]. A multi-agent concept was used for this study along with user
datagram protocol/internet protocol (UDPIP) for communication. The authors have employed the
battery only when transients occur in the output power hence reducing the battery ampere hour
rating. They have obtained the gains for the controllers using bacterial foraging optimization
(BFO) technique which is successful in damping the oscillations of frequency. Their models of
microgrid have wind power, solar power, diesel generator, fuel cell, aqua electrolizer, and a
battery. Microgrid central controller is employed to control the generation by appropriately
connecting or disconnecting the sources through circuit breakers for proper generation. All
commands are communicated via UDP/IP. They have studied different cases of microgrid in
MATLAB/SIMULINK and concluded that BFO is successful in tuning the controller parameter
for damping the output oscillations following a disturbance.
2.6 ELECTRIC VEHICLES APPLICATIONS
Energy storage devices have also found a huge application in the transportation industry
[62] [38]. Steady state optimal operation of plug in electric vehicles (PEVs) in reducing the
energy cost for both spot and regulation markets is described in [62]. The authors also show the
advantage of PEVs in minimizing the wind power deviations. Initially the authors derive a model
for PEVs and formulate an optimization problem for minimizing the energy cost subject to the
constraints. The sequential quadratic programming is used for solving the optimization problem.

22
A winter weekday and summer weekday were used to study the energy cost for spot price market
and regulation price market. For the spot price market 91.6% of energy saving was found for the
winter weekday. The same was the case for the summer weekday even though the percentage of
energy saving was less compared to the winter weekday. For the regulation price market study,
the simulations were performed using DIgSILENT power factor software and the authors found
that better regulation is obtained for power exchange between West Denmark and Union for the
Coordination of Electricity Transmission (UCTE) control area by using PEVs for both summer
and winter weekdays. The authors considered operating the PEVs on both spot and regulation
market simultaneously and concluded that it not only minimizes optimal costs in spot markets
but also provides regulation power for all cases.
In [38], the relation between storage capacity of electric vehicles (EV) and variability
nature of wind power is analyzed. Genetic algorithm along with real time communication
system, smart meter and home area networks (HAN) were used for employing an energy
management system (EMS) to minimize the cost and maximize the utilization of renewable
energy. Initially the authors consider a Lithium Ion Chevy Volt 2011 model for PHEV and
propose an optimization problem for maximum utilization of wind generation by coordinating
the charge and discharge periods of electrical vehicles. The authors study the different scenarios
with fixed charge instants; fixed percentage of EV’s and optimizes the decision variable. These
variables are the mean charging period, percentage of EV connected in each period, and the
conventional power generated. The authors found that the third scenario with the optimized
decision variable is the most economically viable scenario and provides more flexibility in
generation.

23
The significant majority of this chapter has reviewed literature which focuses on the
different aspects of using storage devices to enhance the grid. In [22], the authors caution about
absolute need of employing energy storage devices in the utility grid. They point out that all
applications of storage can also be achieved otherwise and discuss the expenses and limitations
of storage devices in power energy applications. They differentiate the storage applications into
power application where more MW is needed compared to MWh and energy application where
MWh should be higher than MW capacity of battery. They particularly look into the economic
aspects of generation capacity, equipment capacity, line congestion, wind and solar power
smoothing and frequency regulation. They suggest that for wind and solar power smoothing,
power rating of the storage device should be more than the energy capacity to reduce the ramp
rates of wind and solar power. They conclude the paper by weighing the options between storage
and alternate solutions for different power energy applications.
2.7 SUMMARY AND CONTRIBUTION OF CURRENT RESEARCH WORK
In this chapter, existing work on different battery models, their sizing and control along
with some of their applications in wind power stabilization, frequency regulation and electric
vehicle application have been reviewed. In this research, a bi-directional converter with novel
control and mode selection technique for a Li-ion battery model as a separate element of power
system network is developed. Its operation to smooth wind power fluctuations in a distribution
system is studied using power system simulation software PSCAD. The effects of storage device
on real power, reactive power, frequency and voltage profile was also examined at the point of
common coupling (PCC) of a wind generator to a distribution network (DN).

24
Chapter 3 IEEE 13 BUS NETWORK MODEL
This chapter first reviews the various simulation softwares used in the industry and
academic for designing, simulating and analyzing power system components which increases the
reliability, efficiency and revenue of the system. The various components are modeled in
PSCAD to study the interfacing effects of distributed generation along with storage and
converters on a distribution network. The IEEE 13-Node feeder is simulated in PSCAD as the
test case. Wind turbine generator and energy storage modules are also modeled in PSCAD and
added to the test case to study its influence on distribution.
3.1 SIMULATION MODELS AND TOOLS
There are many standard types of software that are available in the market for designing,
modeling, simulating and analyzing the different aspects of power system. These softwares play
an important role in effective use of resources and for asset management which results in
favorable investments. The available softwares are mainly differentiated based on the type of
application, mathematics behind modeling, simulation and analysis methods and user-
friendliness. These softwares are designed in accordance with IEEE, NEC (NFPA), NESC and
IEC industry standards [32].
3.1.1 PSCAD
Power Systems Computer Aided Design (PSCAD) [40] developed by Manitoba HVDC
Research Centre is a powerful transient simulation tool for power systems where EMTDC
solution engine is interfaced through graphical user interface. Some of the main features of
PSCAD are:

25
i. A well-defined state of the art library and standard real world examples for building,
simulating, modifying and analyzing any electrical network.
ii. Ability to control variables during simulation with online plotting functions for studying
the effects of change in the network.
iii. Creating user-defined components and modules which help to customize and program
different cases according to the researcher’s requirement.
iv. Capability to integrate with other softwares like MATLAB, C and to export import data
for detailed analysis of the system.
3.1.2 SimPowerSystems
SimPowerSystem [60] was created by Hydro-Québec of Montreal and marketed by
MathWorks. It has a detailed library with all components of power system including machines,
drives, FACTS devices, renewable energy systems etc. SimPowerSystem also has a library for
control system components for state-space analysis to determine the system performance. One
can also build custom models using MATLAB/SIMULINK multi-domain environment. Similar
to PSCAD, SimPowerSystem co-ordinates with other simulation softwares and hardwares. It has
discretization and phasor simulation modes for faster model execution and supports C-code
generation.
3.1.3 Power World Simulator
Power World simulator [46] is powerful simulation software which is highly efficient in
solving a 100000 bus power flow network. The software is equipped with full-color animated
one-line diagram with zooming and panning capability. It has graphical interactive features with

26
a library collection consisting of devices like buses, loads, generators, transformers etc.
Transmission and generation components can be easily added or removed. In addition to solving
power flow, it can execute integrated economic dispatch, area transaction economic analysis,
power transfer distribution factor (PTDF) computation, short circuit analysis and contingency
analysis. Its optimal power flow (OPF) algorithm uses sequential linear programming based on
simplex codes. The main products include the Simulator for high voltage power system
operation, Retriever for system visualization tools using real-time data, Trainer as a multi-user
platform, TransLineCalc to determine transmission line parameters and Viewer for viewing the
animated power flow solution graphically.
3.1.4 WindMil
WindMil [42] is a software tool designed for electric distribution system planning,
protection and operational analysis. It was developed by Milsoft Utility Solutions. It can be used
to represent radial and loop electric power networks connected to individual customers, inline
and endpoint devices and also to distributed generators. Modeling and analyzing power flow,
voltage drop, reliability, contingencies, short-circuit and fault current, protective device co-
ordination and arc flash hazard are some of the applications of WindMil software. It also has full
geographic representation feature. This software can also be integrated with CIS, SCADA,
AMR/AMI data sources.
3.1.5 ETAP
ETAP [45] developed by Operational Technologies Inc., is a power system analysis
software focusing on planning, design, analysis, operation, control, optimization, training,

27
simulation and automation of generation, transmission and distribution networks. ETAP delivers
software solutions for arc flash, load flow, short-circuit, transient stability, relay co-ordination
and optimal power flow. It is applied in intelligent power monitoring, energy management,
system optimization, advanced automation and real-time prediction. This software can be
customized due to its modular nature and has the potential to manage, control, visualize,
optimize and automate power networks in real time.
3.1.6 ASPEN
ASPEN [13] is a user friendly and efficient software tool for power industry. It has
embedded programs like One Liner and Relay Database for short-circuit and relay co-ordination
study, DistriView for load flow harmonic and reliability analysis in addition to short-circuit and
relay co-ordination for the distribution network, Breaker Rating Module for circuit breaker
studies, Power Flow Program for studying power flow in transmission network and Line
Constants Programs and Line Database for electric parameter calculation of lines and cables. It
applies sparse-vector computational methods and graphical user machine interfaces for power
system applications.
3.1.7 Power Factory
DigSILENT [24] is a stand-alone software that models and analyses generation,
transmission, distribution and industrial grids. It is an efficient tool in analyzing renewable
energy resources and large power systems. It also has the capability to co-ordinate with GIS,
DMS and EMS supporting open system standards. Some of the basic features of the software are
data management, network and graphic diagrams and external data format support. Distribution

28
network optimization, optimal power flow, harmonic and reliability analysis, state estimation and
protection are some of the advanced functions of Power Factory in addition to the basic functions
like load flow analysis, fault analysis, distribution network analysis etc. This software is also
furnished with examples and videos of real-world power applications.
3.1.8 HOMER
Hybrid Optimization Model for Electric Renewables (HOMER) [29] software marketed
by HOMER Energy LLC is an analysis and optimization tool specifically designed for
distribution system and systems with high penetration of renewable energy resources . HOMER
was developed by the National Renewable Energy Lab, a division of the U. S. Department of
Energy. This software is used for sensitivity analysis and optimization of distributed generation
(DG) both on and off-grid. They estimate operational and technical cost and feasibility for
renewable energy applications. They specialize in chronological modeling and simulation for
modeling solar, wind and combined heat and power energy sources. In addition, they can also
model conventional energy sources.
There are also other power system analysis softwares like GE PSLF from GE’s power
system analysis program [27], Easy Power from ESA [25] , NEPLAN by BCP Inc. in
collaboration with ABB utilities GmbH and Swiss Federal Institute of Technology [15] ,
SynerGEE Electric of Advantica Stoner [59], IPSA software from IPSA Power Limited [31] ,
HYBRID2 by Renewable Energy Research Laboratory of University of Massachusetts [50],
HOGA by Electric Engineering Department of University of Zaragoza (Spain) [48] etc. Among
these softwares PSCAD is gaining popularity due to the high speed EMTDC electromagnetic
transient simulation engine which is employed by engineers, scientists, academic institutions,

29
manufacturers as well as consultants likewise. In [43] it was proved by authors that PSCAD is
the most favorable power system analysis tool in terms of accuracy and speed for complicated
power flow networks. The user-friendly nature of PSCAD in addition to the convenience in
adjusting generation and load both on-line and off-line was preferred by many researchers. The
authors modeled the IEEE 30 bus system in MATLAB and PSCAD and compared the results.
They found that even though the results from MATLAB iteration method and PSCAD
simulation method match, the computation time required for PSCAD is smaller with better
accuracy. Hence they concluded that PSCAD is the ideal software solution for power flow
studies in industry as well as academia.
3.2 MODELING IEEE 13 NODE TEST FEEDER IN PSCAD
The IEEE 13 node test feeder [30] is considered as a prototype of real world radial
distribution network as it is unbalanced and has most components of a distribution system like 3-
phase, 2-phase and single phase distribution lines, underground cables, distributed loads,
regulator and breaker system. In this thesis, the IEEE 13 node test feeder is modeled in PSCAD
X4 (Version 4.4.1.0) is shown in Figure 3-1. Models of overhead transmission and distribution
lines, underground lines, transformers, capacitors, regulator and loads including spot load and
distributed load were designed using PSCAD master library components and components
available in the examples. The regulator was modeled using a single-phase two winding
autotransformer with online tap changer and its appropriate control circuits modeled using the
ANSI standards. Spot loads like PQ, Z and I load were modeled using the standard library
components and the appropriate values for each parameter were entered. After modeling each
component, the whole system was integrated and the simulation was done to obtain the required

30
results. The model was simulated and the power flow results were compared with the standard
IEEE test system results.
Figure 3-1 IEEE 13 Node Feeder [30]
3.2.1 3-PH and 2-PH and 1-PH Transmission Line Model
The single phase and 3-phase view of transmission line are shown in Figure 3-2 and Figure
3-3 below:
Figure 3-2 Single-phase view of Transmission Line
602

31
Figure 3-3 Three-phase view of Transmission Line
The transmission or distribution system can be modeled using the Tline components and
modules from the master library. But since the transmission lines are really short (less than 80
km), equivalent coupled pi section lines were employed. For more accuracy instead of using
transmission line and cable data, the impedance (Z) matrix and susceptance (B) matrix
parameters of the transmission line which is available in the IEEE 13 Node Test Feeder data
sheet are entered into the required areas in the dialog boxes of the unbalanced short line
component. Overhead line configurations 601, 602 and underground line configurations 606 are
3-phase distribution lines. Configurations 603 and 604 are 2-phase distribution lines, and 605
and underground line 607 are single-phase distribution lines. By changing the script of the Tline
component, two-phase transmission line can be easily derived from the three-phase transmission
line component and for single phase, the values of resistance and reactance are modeled directly
using resistors, inductors and capacitors. The impedance (Z) matrix and susceptance (B) matrix
are given in the form:
[
]
[
]
where off-diagonal elements , and are mutual impedances and , and are
self-impedances. The impedance Z of the transmission line is also given by the equation:
606

32
where is the resistance and is the reactance. Using the above equations and the parameters of
transmission line given in the data sheet, we can enter all the values in dialog box as shown
below:
Figure 3-4 Transmission Line Dialog Box
3.2.2 Step Voltage Regulator Model
A step voltage regulator shown in Figure 3-5 is modeled in PSCAD. It is a tap-changing
auto transformer employed to maintain the voltage at every end points at all situations of load
within a certain range defined by the ANSI standards. The two most common methods of
maintaining a desired voltage range are the switched shunt capacitor method and step voltage
regulator method. Step voltage regulator is applied in this thesis for voltage regulation in
distribution network. The model is obtained from the paper [61]. Also a compensator circuit is
used to determine the instance of tap change to maintain the voltage within a specified
bandwidth at the “regulation point” at the given R and X setting. The goal is to design a voltage

33
regulator where the maximum voltage imbalance should be within 3% according to ANSI
standard.
Figure 3-5 Step Voltage Regulator Module
The voltage imbalance is given as:
The model for a step voltage regulator mainly has an auto transformer with a load tap-
changing control circuit. Type A and type B are the two classes of step voltage regulators found
in literature. In this thesis type B step voltage regulator is employed. The model of type B step
voltage regulator is shown in Figure 3-6 below:
Figure 3-6 Type B Step Voltage Regulator [61]
Regulator

34
To change the voltage, the number of turns on the series winding ( ) of the preventive
autotransformer is changed with each tap equal to 5/8 % or 0.00626 p.u of the base voltage.
Standard step voltage regulator has % regulation range. Position of the tap is determined by
the compensator circuit. The input output voltage and current equations are given as:
where the effective regulator ratio is,
‘-’when the regulator is in the raise position and‘+’ when the regulator is in the lower position.
and are the input voltage and current respectively. and are the output voltage and
current respectively. The effective regulator ratio can also be given as:

35
Figure 3-7 Step voltage regulator in PSCAD
In the above regulator model, three single-phase two-winding transformers are connected
in wye. The single phase transformer has low leakage reactance and zero losses. The equations
of voltages and currents for the three phase grounded wye are:
[
] [
] [
]
or [ ] [ ] [ ]
[
]
[
]
[
]
or [ ] [ ] [ ]
where [ ] are the phase to ground voltage and [ ] are the line currents.

36
Figure 3-8 Line drop compensator circuit [61]
The line drop compensator model consists of a current transformer and a potential
transformer as shown in Figure 3-8. A compensator control circuit requires set voltage, initial tap
setting, R-X settings, voltage level to maintain regulation, bandwidth adjusted around the desired
voltage level, out of band detections, control time delay required to change the tap if the voltage
is not within limits, tap position calculator, time reset control and line compensator. The
compensator circuit impedance is given by:
where is the equivalent line impedance in ohms, is the primary rating of current
transformer and is the potential transformer ratio.
The potential transformer ratio is
where is the line to neutral rated voltage.

37
3.2.3 Load Model
Spot loads like phase loads and phase to phase loads are connected to the distribution
network. Distributed loads are also connected at interface points in this network. These loads are
mainly classified as constant PQ, constant I and constant Z phase loads. The distributed load is
modeled as two fractional loads, where two-third of the load is placed at the one-fourth distance
from source and the rest one-third is placed at the end.
Figure 3-9 Spot load component
The model for the phase load to ground load is derived from the equations:
(
)
(
)
The frequency variability is not considered. Hence
(
)
(
)
P+jQ

38
For constant power PQ load Therefore:
For constant impedance Z load Therefore:
(
)
(
)
For constant current I load Therefore:
(
)
(
)
where and are steady state values of real power, reactive power and voltage
respectively. are load parameters and are frequency sensitivity
constants.
The phase to phase loads are modeled as variable resistors whose value depend on the
real power demand and variable inductors whose value depend on the reactive power demand as
shown in Figure 3-10. The quantities are updated after every time step according to the variation
in voltage.
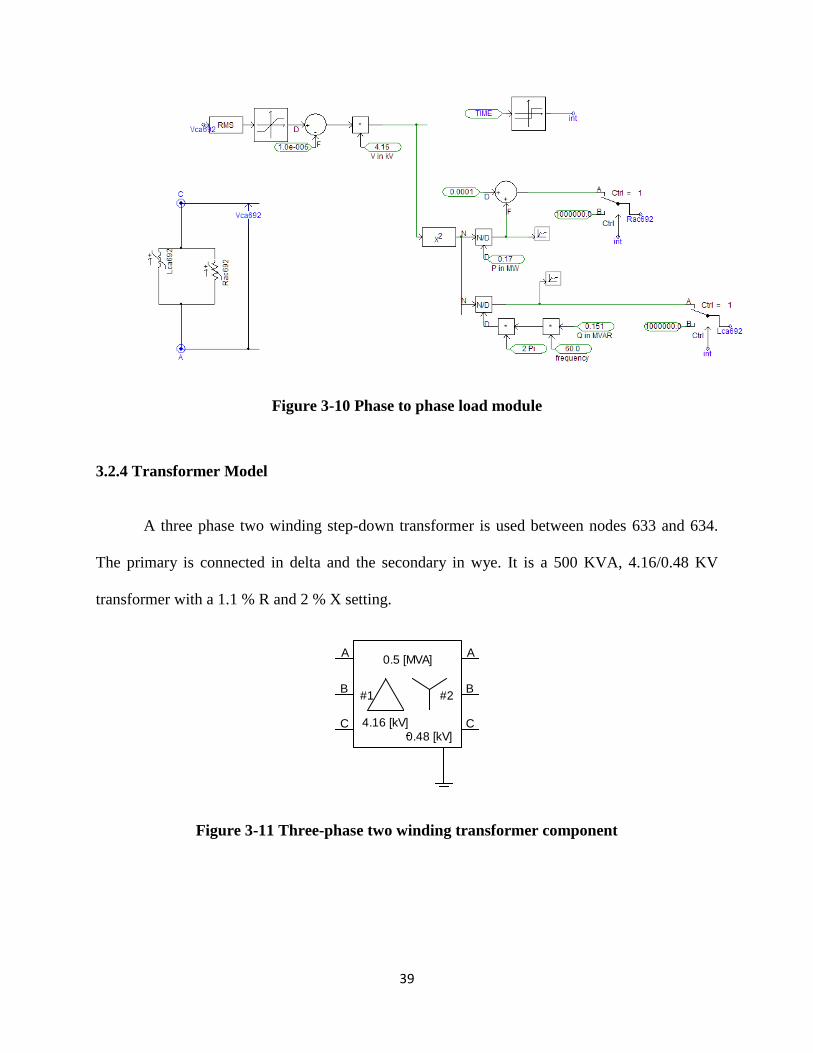
39
Figure 3-10 Phase to phase load module
3.2.4 Transformer Model
A three phase two winding step-down transformer is used between nodes 633 and 634.
The primary is connected in delta and the secondary in wye. It is a 500 KVA, 4.16/0.48 KV
transformer with a 1.1 % R and 2 % X setting.
Figure 3-11 Three-phase two winding transformer component
A
B
C
A
B
C0.48 [kV]
#2#1
4.16 [kV]
0.5 [MVA]
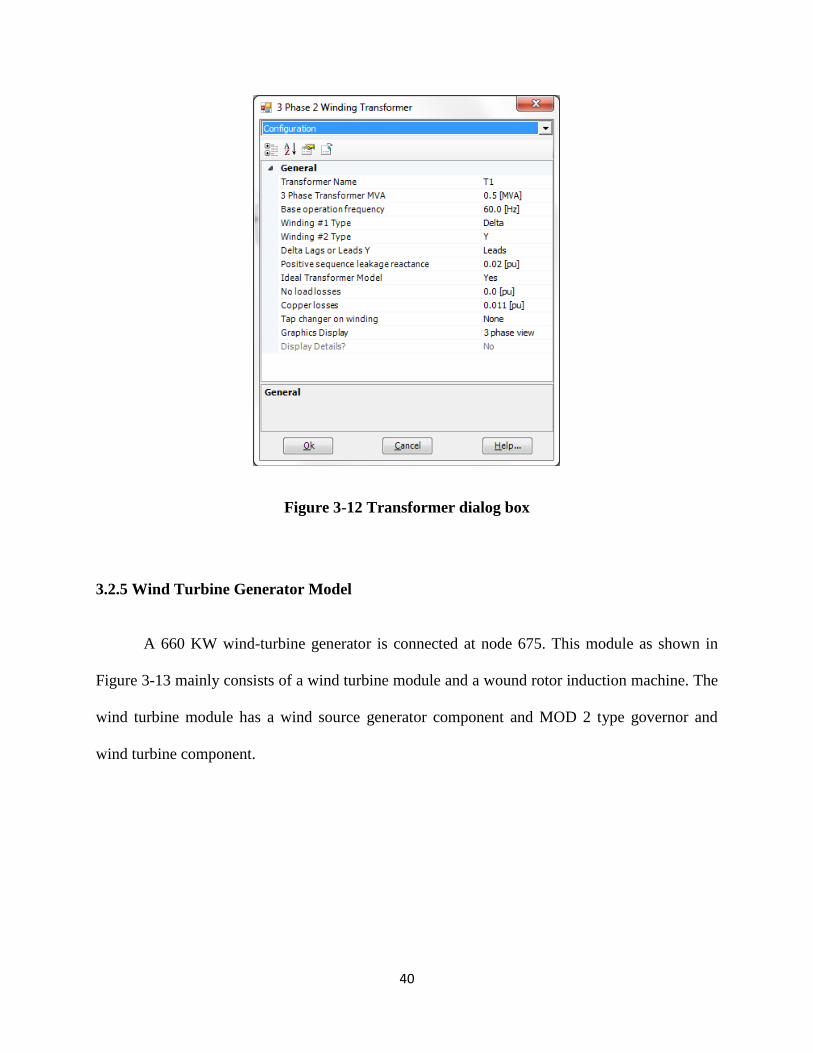
40
Figure 3-12 Transformer dialog box
3.2.5 Wind Turbine Generator Model
A 660 KW wind-turbine generator is connected at node 675. This module as shown in
Figure 3-13 mainly consists of a wind turbine module and a wound rotor induction machine. The
wind turbine module has a wind source generator component and MOD 2 type governor and
wind turbine component.
41
Figure 3-13 Wind turbine generator module
The wind source component models the base wind speed, gust wind, ramp wind and
noise wind data as input parameters. One can also give a constant input wind speed or import
actual wind pattern recording from real field data to wind turbine component.
Figure 3-14 Wind source component
A MOD 2 type wind turbine governor component shown in Figure 3-15 models the pitch
angle regulator where the mechanical speed of the machine and the power output of machine
are given as inputs. The governor component provides the pitch angle in degrees to the
MOD 2 type (3 blades) wind turbine component. The pitch angle along with blade configuration
parameters like sweep area and radius, tip speed ratio, coefficient of power, wind speed and
mechanical speed of machine, determines the output torque and power in p.u based on the
machine rating.
VwES
Wind Source
GustMean
RampNoise

42
Figure 3-15 Wind turbine and governor components
The important wind turbine equations are:
Angular hub speed in rad/s is,
Turbine power in MW is,

43
Tip Speed Ratio is,
Coefficient of power is,
(
)
where is the rotational speed of the machine, is the gearbox ratio, is the wind speed in
m/s, is the air density in kg/m3, is the rotor area in m
2, is the gearbox efficiency in p.u
and is the pitch angle in degrees.
A 660 KW wound rotor induction generator component in Figure 3-16 was connected to
the wind turbine module. It is modeled using induction machine state space equations.
Figure 3-16: Induction machine component
S
TL
I M
W

44
3.2.6 Battery Model
The most commonly used battery model for simulation studies is the modified
Shepherd’s model. The equations for these generic battery models are basically derived from
Shepherd’s equation for circuit based model [18]. The generic battery model circuit diagram is
shown in Figure 3-17 and the discharge characteristic is shown in Figure 3-18 .
Typical discharge characteristic of a generic battery is shown below:
Figure 3-18 Discharge Characteristics [44]
± 𝐸𝑏𝑎𝑡 𝑓 𝑖𝑡 𝑖∗ 𝑖
+
-
𝐸𝑏𝑎𝑡
𝑅𝑏𝑎𝑡 𝐼𝑏𝑎𝑡
𝑉𝑏𝑎𝑡
Figure 3-17 Battery Circuit Model

45
As mentioned earlier Li-ion batteries have numerous applications in electronics industry,
transport industry as well as utility grid. Its battery module in PSCAD is shown in Figure 3-19.
The equations for discharge and charge for a Li-ion battery model are [41]:
Discharge Equation ( ∗ )
∗
∗
Charge Equation ( ∗ )
∗
∗
where is the constant voltage V
is the polarization constant
∗ is the low frequency current A
is the battery current A
is the extracted capacity
is the maximum battery capacity
is the exponential voltage V
is the exponential capacity

46
Figure 3-19 Li-ion battery module in PSCAD
Figure 3-20 Battery module dialog box

47
Each input parameter to the battery is defined below:
Rated Capacity (Ah): It is the minimum effective battery capacity denoted as .
Reserved Battery (Ah): It is the reserved battery capacity denoted as .
Nominal Capacity (Ah): It is the battery capacity when the voltage drops under nominal
voltage and denoted as .
Maximum Voltage (V): It is the voltage of the battery at fully charged condition for a
given discharge current. It is denoted as .
Voltage at exponential point (V): It is the voltage of the battery representing the end of
the exponential zone. This voltage value lies between nominal voltage and maximum
voltage denoted as .
Charge current (A): It is the constant charge current required to charge the battery
denoted as .
Nominal Voltage (V): It is the voltage of the battery corresponding to the end of the
linear zone of the discharge characteristics denoted as .
State of Charge (SOC): State of charge of battery is defined as the available capacity
expressed as the percentage of its rated capacity.
SOC of the battery is given as,
(
∫
)
Where ∫
denoted as ‘ ’ the actual extracted battery capacity.

48
Therefore,
The battery internal resistance is given by the equation,
∗
Exponential zone amplitude in volts is,
Exponential zone time constant inverse in (Ah)-1
is,
The polarization voltage is,
( ) (
)
The battery constant voltage is,
The battery voltage in terms of SOC is given as,
(
) ( )
Battery output voltage is

49
Battery control is the component shown in Figure 3-21 and Figure 3-22 are used to
control the battery charging and discharging mode based on the SOC of the battery. If SOC is
greater than 80%, the battery will discharge and if SOC is less than 30%, battery will charge.
Normally the inverse of SOC is given by the parameter Depth of Discharge (DOD) of battery.
DOD is always chosen more than 0% to increase the life expectance of battery. The SOC of the
battery is not allowed to go beyond 100% to prevent over charging of the battery.
Figure 3-21 Battery discharge control component
Figure 3-22 Battery charge control component
Number of cells in series and parallel
To determine the number of cells in series and parallel for the energy storage device we
should know its capacity and voltage of the system. For reliable operation of the hybrid system it
is important to have battery capacity to be at least 10% of wind capacity. The wind generator
used in this system is 660kW; hence the battery should be at least 66kW. The number of cells in
series and parallel are determined using the following equations.
Battery
controlSOC out_sig
discharging
Battery
controlSOC out_sig
charging

50
The required battery capacity
Where and are system voltage and current respectively. is the discharge time of
battery which is equal to 2 hours for the modeled Li-ion battery. Therefore
Number of cells in parallel is
Number of cells in series is
3.2.7 Converters and Control Model
Power electronic converters have become an integral part of power system. The power
flow conversion system used in the thesis shown in Figure 3-24 consists of six IGBT switches
with 6 diodes in parallel. Two sets of parallel IGBT and diode are connected in series across
three legs of the six pulse converter. An LC filter circuit is also connected to the grid side of the
converter which filters the harmonics. The power conditioning unit designed in this thesis is a
bidirectional current controlled voltage source converter (VSC). It acts both as a rectifier for

51
charging the battery by absorbing power from the grid and as an inverter by supplying power to
the grid from the battery. The DC side of the VSC is connected to the battery. The firing of the
gates is realized using sinusoidal pulse width modulation (SPWM) technique where the
switching frequency is selected higher than the system frequency. For each switching period the
carrier reference signal can be assumed as a step function.
Figure 3-23 Voltage Source Converter Model
Figure 3-24 VSC in PSCAD
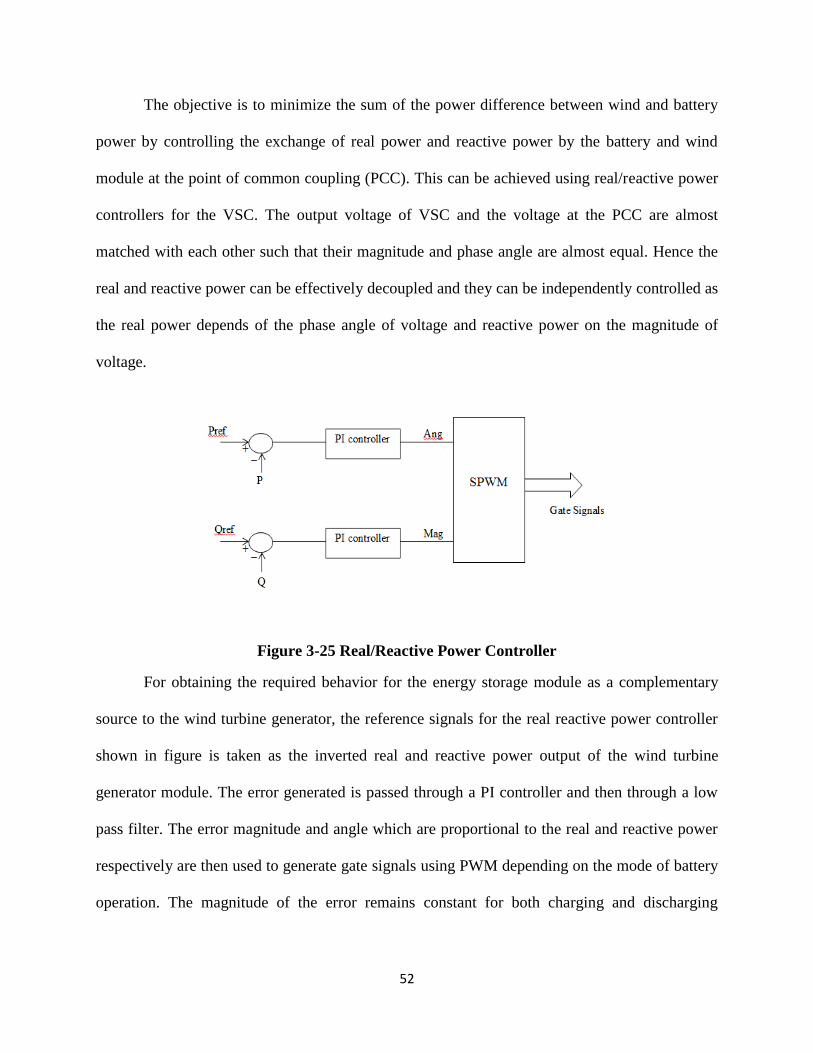
52
The objective is to minimize the sum of the power difference between wind and battery
power by controlling the exchange of real power and reactive power by the battery and wind
module at the point of common coupling (PCC). This can be achieved using real/reactive power
controllers for the VSC. The output voltage of VSC and the voltage at the PCC are almost
matched with each other such that their magnitude and phase angle are almost equal. Hence the
real and reactive power can be effectively decoupled and they can be independently controlled as
the real power depends of the phase angle of voltage and reactive power on the magnitude of
voltage.
Figure 3-25 Real/Reactive Power Controller
For obtaining the required behavior for the energy storage module as a complementary
source to the wind turbine generator, the reference signals for the real reactive power controller
shown in figure is taken as the inverted real and reactive power output of the wind turbine
generator module. The error generated is passed through a PI controller and then through a low
pass filter. The error magnitude and angle which are proportional to the real and reactive power
respectively are then used to generate gate signals using PWM depending on the mode of battery
operation. The magnitude of the error remains constant for both charging and discharging

53
operation whereas the angle varies between 0 and -90 degrees for charging and 0 to +90 degrees
for discharging. This also changes the direction of flow of battery charging current.
Mathematical model of Voltage Source Converter
Assuming a stiff three phase AC system, the equations of voltage and current are given as: [2],
[49], [12]
(
)
(
)
(
)
(
)
where and are the peak value of voltage and current respectively and is the angle
between them. The equations for a VSC are given as:
Where and is the switching function. Its complimentary function is such that
which prevents short circuiting in each leg of VSC. gives the switching losses in

54
each thyristor. If and gives the resistance and reactance of the power transformer in series
the voltage equation at each phase is given as:
Substituting for from previous equation gives:
(
)
Let , therefore
(
)
Using KCL, the total DC current is given as:
(
)
In state space form the above system can be given as:
[ ̇ ̇ ̇ ̇ ̇ ]
[
⁄
∑
⁄
∑
⁄
⁄
⁄
∑
⁄
⁄]
[
]
[
⁄
⁄
⁄
⁄ ]
[
]

55
Chapter 4 APPROACH AND IMPLEMENTATION
4.1 OVERALL SYSTEM
In this thesis two different test systems are considered and modeled in PSCAD. The first
system is a standalone hybrid system where only the wind turbine generator module and energy
storage module are connected to the mains. The second network is the IEEE distribution system
where the wind turbine generator module and energy storage modules are connected to the feeder
675 of the distribution network. The second case focusses on studying the effects of wind
generation and battery operations on a distribution system. A battery energy management control
system is also programmed to control the different modes of operation of battery based on wind
conditions. A genetic algorithm based optimization is applied to determine the optimal value of
proportional gain and the integral time constants of the PI controller which is used in controlling
the firing angle of the power flow converter to minimize the power difference between battery
and wind power. For IEEE 13 node test feeder an additional objective was analyzed which was
to minimize the transmission loss. Transmission loss reduction is significant in the case of
distribution systems as it reduces heating of the system. The optimized parameters are applied to
both the network cases and it was found that a better performance of the controllers is achieved
with optimized parameters. The schematic diagram of a Microgrid is shown in Figure 4-1. The
main grid is connected to the IEEE 13 node test feeder in distribution system case and to an ideal
source in standalone system case. The communication between various modules is assumed
ideal.

56
Figure 4-1 Microgrid
4.1.1 Standalone network
In the standalone network or the microgrid as mentioned earlier only two main
components are used, the wind-turbine generator module and the battery-storage module. The
wind generator module functions both as a source and a load. If the wind generator module
operates as source then the energy storage will be in the charge mode and if the wind generator
module runs as a load, the battery will either be in the discharge mode or the inactive mode
based on state of charge of battery. This concept is explained in detail in the battery energy
management section. The PSCAD standalone simulation network is shown in the figure below.

57
Figure 4-2 Standalone Network
4.1.2 IEEE 13 Node Test Feeder Network
The IEEE 13 node test feeder was also modeled in PSCAD using the components that are
explained in chapter 3 of this thesis. To study the effects of distributed generation and storage on
distribution network, a wind turbine generator module and an energy storage module is
connected at the farthest point in the IEEE distribution system since the wind generators are
normally in the remote areas in real scenarios. The battery has been modeled as a separate entity
so that it can be connected anywhere in the system. But in this thesis work, it is connected at the
same feeder node as the turbine to reduce the transmission losses. The model network is given in
figures below.

58
Figure 4-3 IEEE Distribution Network
4.1.3 Building the model in PSCAD
PSCAD is a powerful time-domain transient simulation software tool specifically designed
for power systems. It uses graphical user interface for electrical components to build models
which automatically creates subroutine assembly that are inserted into the EMTDC simulation
engine. The users need not program their own subroutine. PSCAD employs the nodal analysis
technique together with trapezoidal integration rule to obtain the output. The integration time-
step is fixed. In this project the solution time step and the channel plot time is taken as 100 micro
seconds. Another advantage of PSCAD is that it allows user to create his/her own component

59
using FORTRAN coding language or using the master library. To build a new model the
following steps are useful:
I. Create a new case by using the Menu at the top of the toolbar. Save the case with a name.
II. Go to the master library and copy the components that are required to build the model
and paste the components in the newly created case project canvas.
III. New components or modules can be created by right clicking the mouse button or by
clicking on the component wizard tab. Right clicking the mouse button and selecting the
edit definition tab will allow users to edit the graphics, to add or remove parameters and
to modify or enter FORTRAN codes for each component.
IV. The data for each component parameters can be entered by double clicking on the
component which pops a window for the component.
V. In the main window connect the components together using a wire which is activated or
deactivated by clicking on the wire tab.
VI. After building the model, the whole system is compiled using the compile button on the
toolbar. Once the compilation is done, we can see the warning and errors in the messages
window.
VII. If there are no errors we can run the simulation by clicking on the run button.
VIII. The output is obtained by connecting an output channel to the required signal label before
running the simulation. The output can be viewed by the user by using either a graph or a
meter component from the master library. The output channel component is linked to the
graph by right clicking the mouse button and selecting “add as a curve” tab and pasting
the curve on the graph plane by right clicking on it.
IX. Save the project case.

60
4.2 BATTERY ENERGY MANAGEMENT CONTROL (BEMC)
Battery energy management control (BEMC) was programmed as a supervisory control
for controlling the battery output power based on wind power generated and SOC of battery. The
storage module is designed to store excess energy generated by the wind source. But due to the
intermittent nature of wind speed, the wind turbine becomes a load when wind speed is low and
starts generating when wind speed is high. When the wind generator operates as a load, the
necessary power is drawn from the grid which leads to transmission losses and also affects the
reliability of the system. Hence in order to reduce the transmission loss, an energy storage
module is connected to the system which can store excess energy generated by the wind
generator and also provides necessary power when the wind generator becomes a load. This
reduces the burden on the transmission line as well as the need to absorb or supply power from
the mains. Also the battery converter module is designed as a separate element in the system for
better control and ease of connecting it to the system even though its output power and operation
is heavily depended on wind generator.
For discharging or charging of battery, the state of charge (SOC) of battery plays an
important role. The battery will discharge only if the SOC of the battery is greater than the SOC
discharge limit irrespective of the wind conditions. So even if the wind speed is low, the battery
will not discharge unless its SOC is greater than the SOC discharge limit. Also to prevent from
overcharging, the extreme upper limit SOCmax is also defined. Once the battery reaches this
limit, it automatically disconnects from the system. The same happens when it reaches the lower
limit SOCmin too. This is done in order to increase the battery lifetime by preventing excess
discharging. Hence three main modes of the battery operation is defined- the charging mode, the
discharging mode and the inactive mode where the battery module is disconnected from the

61
system. The different modes of battery operation are decided by the BEMC based on the wind
power output. Initially the output powers and the SOC of battery are measured and
communicated to the BEMC module. Inside the module it checks whether the wind power is
greater or less than the threshold value. Then the BEMC sends the required signals to activate the
charge mode, the discharge mode or the inactive mode. These rules are explained in the flow
chart shown below.
Figure 4-4 Flowchart for Battery Control
Measure PW, Pref,
SOC
𝐼𝑠 ≤ 𝑆𝑂𝐶
≤ 99?
I PW
Pr f?
I SOC
≤ SOC𝑐h𝑔?
Charge Mode
Inactive Mode
I SOC
SOC𝑑𝑖𝑠?
Discharge Mode
Yes
Yes
Yes Yes
No
No
No No
To prevent battery from
overcharging or
undercharging
Discharging Battery Conditions
Charging Battery Conditions
A A
A

62
The application of the above algorithm is shown in Figure 4-5. The control component
compares the wind power and the reference power. In this thesis the battery power is taken as the
reference value or the threshold value. The control component sends signals either to the battery
charging control component or the discharging control component which in turn activates the
breaker control. The BEMC ensures that the battery module completely supplements the wind
turbine module by sending appropriate signals to the converter firing controls in the storage
module. In this thesis ideal communication is assumed and it is realized using a radio link.
Figure 4-5 PSCAD control components for BEMC
4.3 OPTIMIZATION POWER LOSS USING GENETIC ALGORITHM
Genetic algorithm (GA) is a global search heuristic technique used to find exact or
approximate solutions to optimization and search problems. Genetic algorithms (GA) mimic the
natural evolution process to solve complex optimization and search problems. GA's use
selection, recombination and mutation to iteratively improve a solution until it attains the final
value. Essentially GA solves optimization problems by repeatedly modifying a population using

63
rules modeled on gene combinations in biological reproduction. Due to its random nature, the
genetic algorithm improves the chances of finding a global solution.
Genetic algorithms are implemented as a computer simulation. The set of feasible
candidate solutions are represented as chromosomes or genotype or genomes. Traditionally,
solutions are represented in binary as strings of 0's and 1's, but other encodings are also possible.
The evolution usually starts from a population of randomly generated individuals. In each
iteration, commonly referred to as generation in GA literature, GA attempts to improve the set
of candidate solutions by generating better solution. In each generation, the fitness of every
individual in the population is evaluated, multiple individuals are stochastically selected from the
current population (based on their fitness), and modified (recombined and possibly randomly
mutated) to form a new population. The new population is then used in the next iteration of the
algorithm. Commonly the algorithm terminates when either a maximum number of generations
has been produced, or a satisfactory fitness level has been reached for the population. If the
algorithm has terminated due to a maximum number of generations, a satisfactory solution may
or may not have reached. Genetic algorithms have the following advantages:
Domain Independence: Genetic Algorithms can be applied to solve problems in a number
of domains as long as the feasible region for the search process and the fitness function
can be evaluated. Genetic algorithms have been proven to work to solve complex
problems in a wide variety of engineering and science disciplines.
Global Optimal: Traditional Newton style of descent based non- linear optimization
solution methods can get trapped in local optima and may not be able to find the global
optimal for complex objective functions and feasible regions. Genetic algorithms avoid
falling into the trap of local optima due to the way the search process is defined. Mutation

64
ensures that genetic algorithm solutions are not trapped in local optimality. However,
care should be taken to ensure that mutation probability is low as otherwise the GA
search becomes a random search.
Complex Models: The GA search process is independent of the model structure. The GA
can model complex non-convex feasible regions and objective functions. GA can also be
used as a search process for problems with objective functions which are not analytically
defined and can be evaluated only using simulation.
Genetic algorithms are particularly suitable for simulation based optimization as it is not
possible to define gradients of objective function for such problems. The mathematical
programming formulation for the nonlinear simulation based optimization is first provided.
The main objective is to minimize the integral of the power difference between wind and
battery power. Let and represent the wind and battery power at time instant
respectively and [ ] denote the simulation interval. The decision variables are and
which represent the proportional gain constant and integral time constant for the PI controller.
∫ [ ]
Subject to:
| | [ ]
≤ ≤
≤ ≤
For IEEE 13 node test feeder an additional objective was analyzed which was to
minimize the transmission loss. The objective function is given as:

65
∫ [ ]
Subject to:
( ) [ ]
≤ ≤
≤ ≤
Where
and represent the total generation and load power at time instant
respectively. is power drawn from the mains.
are lower and
upper bounds for the proportional gain and integral time constant. Note that these lower and
upper bounds are chosen by sensitivity analysis. They serve two main purposes. When there are
no constraints on the decision variables the GA can generate any value for these variables,
especially in the population in the first generation. PSCAD simulation is highly sensitive and
becomes unstable easily. Therefore there is a high likelihood of a large percentage of the initial
population corresponding to unstable systems. Also intelligently restricting the feasible region
helps the genetic algorithm in convergence as it will have to search in a small search space.
The procedure for applying genetic algorithm to optimize the system is shown below in
flowchart. The genetic algorithm generates the initial population which consists of a number of
possible values for the proportional gain constant and integral time constant. The PSCAD system
performs the simulation and evaluates the objective function for each member of the population.
The GA then checks for convergence based on the values of the objective function. If GA has

66
converged the process stops. If the GA has not converged then GA generates a new set of
population based on the old population and the process continues.
Figure 4-6 Flowchart
Initialize GA
Current Solution Pool
Initialize PSCAD
DSDYN
Electrical Network Solution
DSOUT
Write to output channels
Is
t<=T?
Multiple
Run? Stop
t= t+∆t
Improve Current
Solution Set through
GA Manipulation
Yes
No
Yes
No

67
Chapter 5 SIMULATION RUNS AND ANALYSIS
This chapter describes the computational runs conducted in this thesis and presents the
important results and insights. First the power and voltages at each node for the IEEE 13 node
feeder network is compared against standard published results. The output voltage, state of
charge (SOC), battery charging current for the Li-Ion battery simulation model is validated. The
performance of the Multi-mode Battery Energy Management (BEM) operation for different
cases is presented for two networks. The results of optimization of the PI controller gains using
Genetic Algorithm is shown.
5.1 IEEE 13 NODE FEEDER RESULTS
The IEEE 13 node test feeder was modeled in PSCAD and the simulated results were
authenticated against the standard published results. The total power, real power, reactive power
and the power factor are compared for both cases in Table 5-1 and Table 5-2 respectively. The
maximum error in real power was approximately 2.1% in phase C. For reactive power the
maximum error was less than 1.7% and the maximum total power error was approximately 2%.
The maximum error in power factor was 0.7%. For the total system all the errors were found to
be less than 1.5%.

68
Table 5-1 Power flow results comparison in each phase
Phase A Phase B Phase C
IEEE PSCAD Error IEEE PSCAD Error IEEE PSCAD Error
kW 1251.389 1,228.85 1.801119 977.332 972.806 0.463097 1348.461 1377.2 2.131244
kVAr 681.57 690.06 1.246094 373.418 379.663 1.672389 669.784 680.11 1.541691
kVA 1424.968 1,409.35 1.096228 1046.241 1,044.27 0.188587 1505.642 1,535.98 2.014844
PF 0.8782 0.87 0.714124 0.9341 0.93 0.271123 0.8956 0.90 0.114697
Table 5-2 Comparison of total power flow
Total
IEEE PSCAD Error
kW 3577.191 3578.856 0.046545
kVAr 1724.772 1749.836 1.453178
kVA 3971.289 3983.734 0.313373
PF 0.9008 0.898367 0.270069
The voltage at each node were compared and tabulated in Table 5-3. The maximum
deviation in voltage from the standard results was found to be 2.6% for phase B at node 634. The
real and reactive power at each node is given in Table 5-5. Here we can see that nodes connected
to capacitor banks have negative reactive power flow since capacitors supply reactive power to
the system. Table 5-4 compares the regulator tap position of the simulated network with the
standard IEEE results. The regulator tap positions are found to be similar.

69
Table 5-3 Load flow results
A-N B-N C-N
NODE IEEE PSCAD Error IEEE PSCAD Error IEEE PSCAD Error
650 1.0000 1.0000 0.0014 1.0000 1.0000 0.0013 1.0000 1.0000 0.0014
RG60 1.0625 1.0562 0.5948 1.0500 1.0437 0.5990 1.0687 1.0562 1.1715
632 1.0210 1.0110 0.9755 1.0420 1.0325 0.9136 1.0174 1.0080 0.9200
633 1.0180 1.0083 0.9509 1.0401 1.0299 0.9788 1.0148 1.0057 0.8987
634 0.9940 0.9833 1.0738 1.0218 0.9948 2.6472 0.9960 1.0052 0.9187
645
1.0329 1.0231 0.9468 1.0155 1.0060 0.9365
646
1.0311 1.0214 0.9417 1.0134 1.0040 0.9325
671 0.9900 0.9764 1.3782 1.0529 1.0417 1.0599 0.9778 0.9703 0.7703
680 0.9900 0.9762 1.3905 1.0529 1.0416 1.0723 0.9778 0.9701 0.7827
684 0.9881 0.9743 1.3935
0.9758 0.9681 0.7876
611
0.9738 0.9661 0.7907
652 0.9825 0.9688 1.3911
692 0.9900 0.9759 1.4258 1.0529 1.0417 1.0656 0.9777 0.9699 0.7985
675 0.9835 0.9739 0.9746 1.0553 1.0472 0.7723 0.9758 0.9657 1.0334
Table 5-4 Comparison of regulator tap position
Voltage Regulator
RG60
Phase IEEE PSCAD
A 10 9
B 8 7
C 11 9

70
Table 5-5 Power flow at each node
Power Flow KW/kVR
P Q P Q P Q
NODE A A B B C C
650 1,228.85 690.06 972.806 379.663 1377.2 680.11
RG60 1265 607 911.9 367.3 1433 704.7
632 143.9 105 112.3 94.75 153.6 93.13
633 143.6 104.8 112.1 94.51 153.3 92.91
634 173 111.6 116.3 91.77 114 87.83
645
150.2 1.961 78.84 134.8
646
150 0.5935 78.58 134.5
671 941.2 296.7 432.7 79.18 829 270.5
684 121.7 80.24
165.8 -16.17
611
165.4 -16.13
652 121 79.78
692 492.8 3.03 69.04 -159.1 307.1 25.33
675 -12.2 -187.8 7.484 -217.6 7.334 -184.9
680 0 0 0 0 0 0
Table 5-6 tabulates the voltage at each node when the wind turbine component is
connected to the system at node 675. We can note that the steady state voltage error is drastically
reduced when a distribution generator is connected to this node. So we can conclude that
distributed generators can be used to improve the voltage profiles in remote areas of a weak grid.

71
Table 5-7 shows the voltage regulator tap positions when wind generator module is
connected. Here also we can observe that the values are closer to the IEEE standard values.
Table 5-6 Comparison of node voltages
NODE IEEE w_Wind Error IEEE w_Wind Error IEEE w_Wind Error
650 1.0000 0.999985 0.0015 1.0000 0.999985 0.0015 1.0000 0.999987 0.0013
RG60 1.0625 1.06243 0.0066 1.0500 1.0562 0.5905 1.0687 1.06868 0.0019
632 1.0210 1.01952 0.1450 1.0420 1.0376 0.4223 1.0174 1.02383 0.6320
633 1.0180 1.01682 0.1159 1.0401 1.03507 0.4836 1.0148 1.02149 0.6592
634 0.9940 0.993545 0.0458 1.0218 1.0041 1.7322 0.9960 1.01567 1.9749
645
1.0329 1.02825 0.4502 1.0155 1.02173 0.6135
646
1.0311 1.02651 0.4452 1.0134 1.01966 0.6177
671 0.9900 0.985957 0.4084 1.0529 1.03929 1.2926 0.9778 0.988999 1.1453
680 0.9900 0.985834 0.4208 1.0529 1.03916 1.3050 0.9778 0.988876 1.1327
684 0.9881 0.983906 0.4245
0.9758 0.986855 1.1329
611
0.9738 0.984863 1.1361
652 0.9825 0.978353 0.4221
692 0.9900 0.985638 0.4406 1.0529 1.03932 1.2898 0.9777 0.988752 1.1304
675 0.9835 0.983772 0.0277 1.0553 1.04267 1.1968 0.9758 0.985324 0.9760
Table 5-7 Comparison of regulator tap position with wind generator
Voltage Regulator
RG60
Phase IEEE PSCAD
A 10 10
B 8 9
C 11 11

72
The IEEE 13 bus network model PSCAD simulation results were found to be very similar
to the standard IEEE results with minimal errors. The next section presents the analysis of the
battery model used in this thesis.

73
5.2 LI-ION BATTERY MODEL RESULTS
The output simulation parameters of the generic battery model provided by the PSCAD
support team are shown in Figure 5-1 below. The simulation time is 50000 seconds. The SOC
discharge and charge limits are 0.3 and 0.8 respectively. gives the battery output voltage for
a single cell, is the constant dc voltage obtained across a resistor, is the charging
current which is kept constant at 0.5A and is the constant dc output current flowing through
the load. In the generic battery model, the charge and discharge cycle have approximately the
same time period.
Figure 5-1 Generic battery output parameters

74
Li-ion battery was programmed in PSCAD and simulated keeping the load conditions
same as the generic battery circuit. The model output simulation parameters are shown in Figure
5-2 below. The simulation time and the SOC are the same as before. The initial SOC of battery is
more than 0.95; the battery is free to discharge. The SOC of battery varies between 0.8 and 0.3 in
consecutive cycles. Here we can see that the discharge time is longer than the charge time which
is favorable since the number of charging and discharging cycles are reduced. This increases the
battery life. Also faster charging yields better response. The discharge period is approximately 2
hours and the charge period is only 1 hour. Constant output dc voltage and current are obtained
and the battery charging current is maintained constant at 0.5A.
Figure 5-2 Li-ion battery output parameters
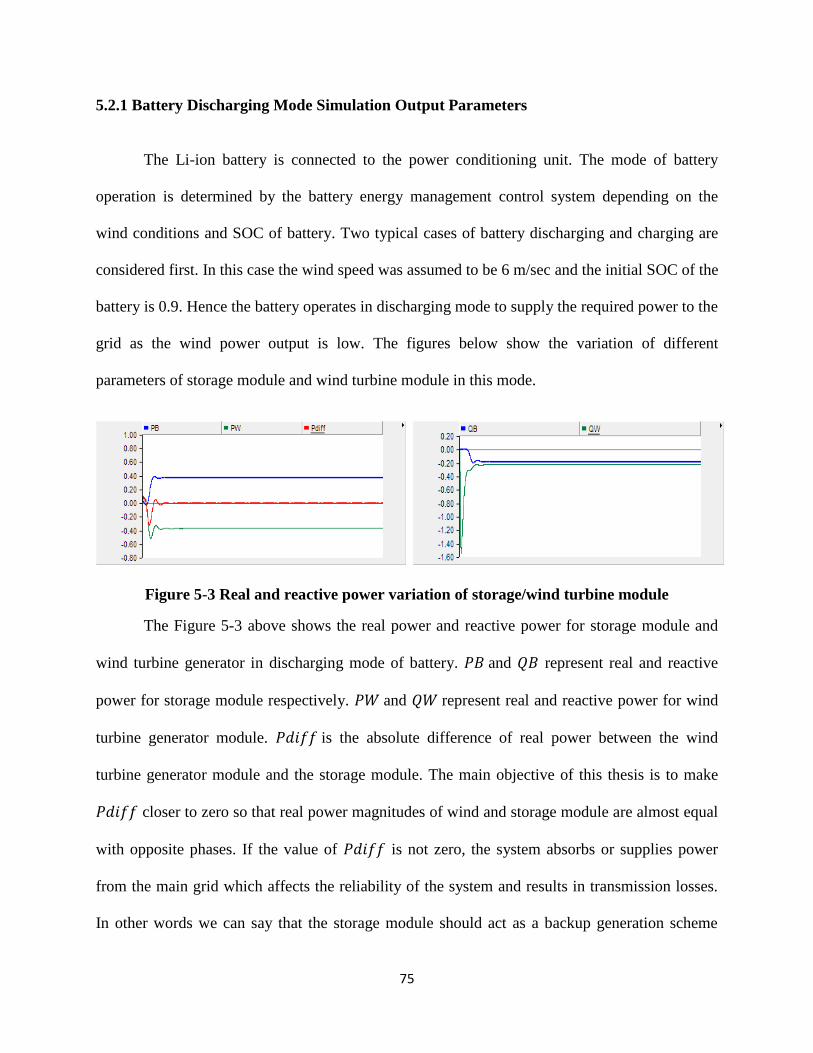
75
5.2.1 Battery Discharging Mode Simulation Output Parameters
The Li-ion battery is connected to the power conditioning unit. The mode of battery
operation is determined by the battery energy management control system depending on the
wind conditions and SOC of battery. Two typical cases of battery discharging and charging are
considered first. In this case the wind speed was assumed to be 6 m/sec and the initial SOC of the
battery is 0.9. Hence the battery operates in discharging mode to supply the required power to the
grid as the wind power output is low. The figures below show the variation of different
parameters of storage module and wind turbine module in this mode.
Figure 5-3 Real and reactive power variation of storage/wind turbine module
The Figure 5-3 above shows the real power and reactive power for storage module and
wind turbine generator in discharging mode of battery. and represent real and reactive
power for storage module respectively. and represent real and reactive power for wind
turbine generator module. is the absolute difference of real power between the wind
turbine generator module and the storage module. The main objective of this thesis is to make
closer to zero so that real power magnitudes of wind and storage module are almost equal
with opposite phases. If the value of is not zero, the system absorbs or supplies power
from the main grid which affects the reliability of the system and results in transmission losses.
In other words we can say that the storage module should act as a backup generation scheme

76
where the wind power and battery power complement each other. In Figure 5-3 we can see that
since the wind speed is low, the wind module act as a load which is compensated by battery by
going into the discharge mode and supplying the required power to balance the system.
Figure 5-4 Frequency and voltage variation of storage/wind turbine module in p.u
In Figure 5-4, the frequency and voltage at the point of common coupling is shown in per
units. The frequency and voltage were found to be 1 p.u in the steady state. Figure 5-5 shows the
inverted output voltage for each phase and its RMS value in p.u for the storage module. The
RMS voltage is maintained at 1 p.u in steady state.
Figure 5-5 Converter output voltage three phase waveform and rms value
Figure 5-6 shows the constant dc voltage across the dc link capacitor and the dc current flowing
into the power conditioning unit. In the discharging mode the dc current output varies between 0
and 0.1 kA in the steady state region. Figure 5-7 gives the magnitude and angle of the reference
signal. In discharging mode the angle is varied from 0 to 90 degrees to control the output power
while keeping the magnitude constant at 1 p.u.
-0.50
0.00
0.50
1.00
1.50
2.00
2.50
y
Vrms

77
Figure 5-6 Voltage and current across the dc link capacitor
Figure 5-7 Magnitude and angle variation of the reference signal
Figure 5-8 shows the modulating reference signals for all phases and the battery charging current
whose maximum value is kept constant at 0.5kA in steady state. Figure 5-9 gives the battery
output voltage and the SOC. In discharging mode both battery voltage and SOC are decreasing
steadily.
Figure 5-8 Modulation signals and battery discharging current
-1.50
-1.00
-0.50
0.00
0.50
1.00
1.50 Ibatt

78
Figure 5-9 Output voltage and SOC of battery
Figure 5-10 gives the speed in p.u and output current of the induction generator for the wind
turbine generator module. Since the wind turbine acts as a load due to low wind speed, in the
discharging mode the speed of the generator goes less than 1 p.u.
Figure 5-10 Output speed and current of the induction generator
5.2.2 Battery Charging Mode Simulation Output Parameters
In this case the battery operates in charging mode. The wind speed was assumed to be 18
m/sec and the initial SOC of the battery is 0.1. The storage module absorbs the required power
from the grid as the wind power output is high. The figures below show the variation of different
parameters of storage module and wind turbine module in this mode.

79
Figure 5-11 Real and reactive power variation of storage/wind turbine module
Figure 5-11 above shows the real and reactive power for storage module and wind turbine
generator in charging mode of battery. Here we can see that since the wind speed is high, the
wind module act as a source which supplies power to the battery which is in the discharge mode.
Figure 5-12 Frequency and voltage variation of storage/wind turbine module in p.u
Figure 5-13 Converter output voltage three phase waveform and rms value
In Figure 5-12, the frequency and voltage at the point of common coupling is shown in per units.
The frequency and voltage were found to be 1 p.u in the steady state. Figure 5-13 shows the
output voltage for each phase and its RMS value in p.u for the storage module.

80
Figure 5-14 Voltage and current across the dc link capacitor
Figure 5-15 Magnitude and angle variation of the reference signal
Figure 5-14 shows the constant dc voltage across the dc link capacitor and the dc current flowing
into the power conditioning unit. In the charging mode the dc current output varies between 0
and -0.1 kA in the steady state region. Figure 5-15 gives the magnitude and angle of the
reference signal. In charging mode the angle is varied from 0 to -90 degrees to absorb power
while keeping the magnitude constant at 1 p.u.
Figure 5-16 Modulation signals and battery charging current

81
Figure 5-16 shows the modulating reference signals for all phases and the battery charging
current whose minimum value is kept constant at -0.5kA in steady state. Figure 5-17 gives the
battery output voltage and the SOC. In charging mode both battery voltage and SOC are
increasing steadily.
Figure 5-17 Output voltage and SOC of battery
Figure 5-18 gives the speed in p.u and output current of the induction generator for the wind
turbine generator module. Since the wind turbine acts as a source at high wind speeds, the speed
of the generator goes more than 1 p.u.
Figure 5-18 Output speed and current of the induction generator

82
5.3 MULTI-MODE BATTERY ENERGY MANAGEMENT CONTROL (BEMC)
OPERATION
The focus of the following simulations is to demonstrate the performance of the battery
energy management control systems under a variety of battery operation modes. The simulations
are conducted on a standalone network and a network with IEEE 13 node, battery, and wind
generator.
5.3.1 Standalone Network
Four cases of wind speed are considered: (i) Case 1: constant low wind speed, (ii) Case 2:
constant high wind speed, (iii) Case 3: step change in wind speed, and (iv) Case 4: variable wind
speed. The SOC limits for discharging and charging of the battery are normally 0.3 and 0.95 for
Li-ion batteries. For each of the wind speed cases, battery conditions corresponding to an initial
state of charge of 0.9 and 0.1 are considered. The mode of operation of battery depends on the
wind conditions and the SOC of the battery. To prevent overcharging SOC maximum is taken as
0.99. To improve the lifetime of the battery the minimum value of the SOC is taken as 0.01. If
the battery reaches these limits then it is automatically disconnected. The variation in SOC and
the power variation in battery and wind generator are shown for the above mentioned cases. The
simulation is conducted for a period of 10 minutes. However for clarity of presentation of the
trends, the parameters are shown for a period of 10 seconds.
Case 1: Constant Low Wind Speed
In this case the wind speed was assumed to be a low constant value of 6 m/sec. The
figures below show the variation in SOC and battery and wind generation power variation for
three SOC initial conditions.

83
Figure 5-19 SOC Variation and Wind/Battery Power for Initial SOC 0.9
In the above case since the wind speed is low and the battery SOC is more than the SOC
discharging limit, the battery goes into discharging mode and supplies the required power to
compensate for the wind load. The difference of real power between the wind and the storage
module is zero in the steady state region.
Figure 5-20 SOC Variation and Wind/Battery Power for Initial SOC 0.1
In Figure 5-20, the battery SOC is in the charging limit but since the wind speed is low
the battery cannot charge. Hence in this case also the battery goes into inactive mode where it is
disconnected from the system and the required power to compensate for the wind load is
supplied by the mains. The difference of real power between the wind and the storage module
P is equal to the wind power since the battery power is also zero in this case.

84
Case 2: Constant High Wind Speed
In this case the wind speed was assumed to be 18 m/sec. The figures below show the
variation in SOC and battery and wind generation power variation for three SOC initial
conditions. Based on the SOC conditions the battery discharges, charges or goes into inactive
mode.
Figure 5-21 SOC Variation and Wind/Battery Power for Initial SOC 0.9
In the above case since the wind speed is high. Even though the battery SOC is more than
the SOC discharging limit, it is not fully charged and hence the battery goes into charging mode
until the SOC of battery reaches the maximum SOC limit of 0.99. The wind turbine module
generates power which is stored in the battery module. The difference of real power between the
wind and the storage module is zero in the steady state region.
Figure 5-22 SOC Variation and Wind/Battery Power for Initial SOC 0.1

85
In Figure 5-22, the wind speed is high and the initial battery SOC is 0.1 which is in the
charging range. So the battery goes into charging mode until the SOC of battery reaches the
maximum SOC limit of 0.99. The power generated by wind turbine module is stored in the
battery module. The difference of real power between the wind and the storage module is zero in
the steady state region and hence no power is absorbed from the mains.
Case 3: Step Change Wind Speed (Low 6m/s to High 18m/s Wind Speed)
In this case the wind speed is stepped up from 6 m/s to 18 m/sec at threshold value of
5seconds. The figures below show the variation in SOC and battery and wind generation power
variation for three SOC initial conditions.
Figure 5-23 SOC Variation and Wind/Battery Power for Initial SOC 0.9
In the above case, initially the wind speed is low and the battery SOC is at 0.9. During
this time period the battery discharges to meet the wind power demand since its initial SOC is
greater than the SOC discharge limit. But as the wind speed goes up, the wind turbine generator
produces power and this power is again used to charge the energy storage module. The
maximum SOC limit for battery charging is given as 0.99. The power difference is maintained at
zero except at the transition point in both time periods. Hence we can see that battery power
characteristics and wind turbine module characteristics supplement each other

86
Figure 5-24 SOC Variation and Wind/Battery Power for Initial SOC 0.1
In Figure 5-24 also we can observe the same conditions as the previous case. Initially the
wind speed is low and the battery SOC is at 0.1. During this time the battery goes into the
inactive mode even though its initial SOC is in the SOC charging limit as the wind speed is low.
But as the wind speed goes up, the wind turbine generator produces power and this power is
again used to charge the energy storage module. Power difference curve behaves in the same
way as the previous scenario.
Case 4: Variable Wind Speed
In this case the wind speed is varied stochastically. The wind is generated using the
PSCAD wind source component. The base wind speed is taken as 14 m/s in addition to the gust,
ramp and noise parameters. The figures below show the variation in SOC and battery and wind
generation power variation for three initial conditions of state of charge of battery.
Figure 5-25 Variable wind speed

87
Figure 5-26 SOC Variation and Wind/Battery Power for Initial SOC 0.9
In the above case, the initial SOC of battery is taken as 0.9 and hence it is free to
discharge. But as mentioned earlier discharging or charging of battery depends on the wind
conditions. When the wind speed is high the battery goes into charging mode as its SOC has not
reached its upper extreme limit. But when the wind speed decreases, the wind power output
reduces and now the battery goes into the discharging mode to supply the required power until it
reaches its discharging limit of 0.3. As the intermittency of wind increases as shown in Figure
5-25, the battery goes into different cycles of charging and discharging. The power difference
curve and the SOC of the battery also vary accordingly.
Figure 5-27 SOC Variation and Wind/Battery Power for Initial SOC 0.1
In the above case, the initial SOC of battery is taken as 0.1 which is in the battery
charging limit. So when the wind turbine generator produces positive power, the battery goes
into charging mode and when the wind power becomes negative the battery goes into inactive
mode. The SOC curve and the power difference curve vary according to the battery modes.

88
SOC Limits Simulations
The next set of runs study the behavior of the standalone system when the SOC of battery
reaches the upper extreme limit of 0.99 and lower extreme limit of 0.01
Case 1: SOC extreme limit 0.99
The initial SOC of battery is assumed to be 0.98999 with high wind speed of 18 m/s. The
variation of SOC and wind generator and battery power along with their difference is shown
below. When SOC reaches a value of 0.99, the storage module disconnects and the battery
becomes inactive as shown by the SOC and power graphs in Figure 5-28.
Figure 5-28 SOC upper charging limit variation and Wind/Battery power variation
Case 2: SOC extreme limit 0.01
The initial SOC of battery is assumed to be 0.001 which is lower than SOC minimum
limit. Hence the battery operates in inactive mode as shown in Figure 5-29 below.
Figure 5-29 SOC lower discharging limit variation and Wind/Battery power variation

89
In this section we demonstrated the performance of the BEMC for various operating conditions
and show that it responds appropriately to changes in wind conditions. The next section focuses
on the larger network with the IEEE 13 node feeder distribution analysis.
5.3.2 IEEE 13 Node Feeder Distribution System Analysis with Wind Turbine Generator
The IEEE 13 node distribution system feeder is connected to a wind turbine generator
component, an energy storage unit with a power conditioning system and a supervisory battery
energy management control system to control the modes of operation of battery depending on the
wind conditions. In this case the wind speed is variable which is closer to the real scenario as the
intermittent nature of wind speed is taken into account. The wind source component is
connected to a wind turbine generator. The base wind speed is maintained 14 m/s in addition to
the gust, ramp and noise parameters. The figures below show the variation in SOC and battery
and wind generation power variation for three SOC initial conditions.
Figure 5-30 SOC Variation and Wind/Battery Power for Initial SOC 0.9
When the initial SOC of battery is 0.9, it is free to discharge. Depending on the wind
conditions, when the wind speed is high the battery goes into charging mode until its SOC
reaches the upper extreme limit. But when the wind power output decreases, the battery goes into
the discharging mode to supply the required power until it reaches its discharging limit of 0.3.

90
The storage module output power varies according to the wind power. The power difference
curve and the SOC of the battery also vary accordingly as shown in Figure 5-30.
Figure 5-31 SOC Variation and Wind/Battery Power for Initial SOC 0.1
The initial SOC of battery is taken as 0.1 which is lower than the battery charging limit.
So when the wind turbine generator produces positive power, the battery goes into charging
mode and when the wind power becomes negative the battery goes into inactive mode as the
SOC is less than the discharge limit of 0.3. The SOC curve and the power difference curve vary
according to the battery modes which are shown in Figure 5-31.
5.3.3 IEEE 13 Node Feeder Distribution System Analysis with Photovoltaic Panel
To study the effects of different types of distributed generation and storage on
distribution network, a photovoltaic panel module from the master library and an energy storage
module is connected at node 675 of the IEEE 13 node feeder system. The battery has been
modeled as a separate entity so that it can be connected anywhere in the system. But in this thesis
work, it is connected at the same feeder node as the PV panel to reduce the transmission losses
since the output of a PV panel is very low compared to other sources. Two different cases of
battery discharging with initial SOC 0.9 and battery charging with initial SOC 0.1 were studied.
Initially the solar radiation is set at 607.407 and the temperature is set at 50° C to simulate the
day time conditions. At 5 seconds the solar radiation is reduced to zero and the temperature to

91
25° C to simulate the night time. The steady state results for the battery and PV panel power
output and SOC of battery are shown below.
Figure 5-32 SOC Variation and PV/Battery Power for Initial SOC 0.9
In the above Figure 5-32, we can see that initially the solar power is high, so the battery goes into
charging mode until it reaches its full charge capacity. When the solar power reduces to zero,
since the battery SOC is greater than the discharge limits it provides the required power to the
system by going into the discharge mode. This can be also seen in the SOC curve which is
initially charging and the discharging.
Figure 5-33 SOC Variation and PV/Battery Power for Initial SOC 0.1
For an initial SOC of 0.1, we can see that when the solar power is high, the battery goes into
charging mode. When the solar power reduces to zero, since the battery SOC is less than the
discharge limits of 0.3, it is unable to provide the required power to the system and hence goes
into the inactive mode. This is shown in Figure 5-33. The SOC curve which is initially charging
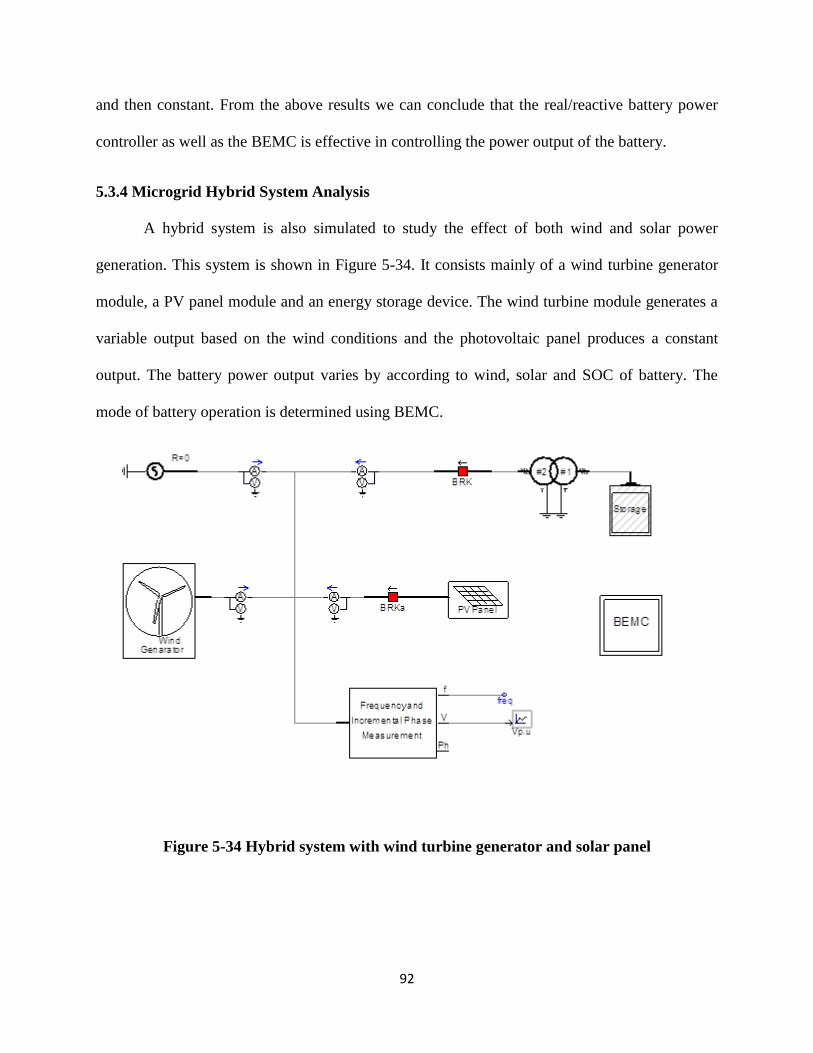
92
and then constant. From the above results we can conclude that the real/reactive battery power
controller as well as the BEMC is effective in controlling the power output of the battery.
5.3.4 Microgrid Hybrid System Analysis
A hybrid system is also simulated to study the effect of both wind and solar power
generation. This system is shown in Figure 5-34. It consists mainly of a wind turbine generator
module, a PV panel module and an energy storage device. The wind turbine module generates a
variable output based on the wind conditions and the photovoltaic panel produces a constant
output. The battery power output varies by according to wind, solar and SOC of battery. The
mode of battery operation is determined using BEMC.
Figure 5-34 Hybrid system with wind turbine generator and solar panel

93
The wind speed is variable and the battery SOC is given as 0.9. Hence the battery is free to
charge and discharge based on the wind and solar conditions. The graphs for battery power
output and SOC with and without PV panel is shown in figures below.
Figure 5-35 Real power output of battery
without PV module
Figure 5-36 Real power output of battery
with PV module
From the above Figure 5-35 and Figure 5-36 for solar and battery power, it can be seen
that when we connect PV panel to the system, the amount of power injected into the grid by the
energy storage module reduces and hence the battery can be used for a longer time period. Also
there is reduction in the number of charge and discharge cycles of battery operation which
increases the battery lifetime.
Figure 5-37 SOC of battery without PV
module
Figure 5-38 SOC of battery with PV module
The effect of solar power on SOC of the battery can be seen in Figure 5-37 and Figure 5-38. It
can be noted that when we include PV panel module to the system, the battery SOC has a higher
ramp rate and is more charged compared to the SOC of the battery without photovoltaic panel.

94
5.4 POWER LOSS OPTIMIZATION
5.4.1 Standalone network
The objective function of the optimization is to minimize the integral of the power
difference between wind and battery power. Both standalone as well as distribution grid
connected cases were optimized under variable wind speed and battery discharge mode condition
to obtain better performance for the controllers. The standalone system was optimized using
genetic algorithm and simplex method. In the case of genetic algorithm, for a proportional gain
( ) value of 0.1 and integral time constant ( ) of 0.001s, the objective function was found to
be 13304.6 for an initial SOC of battery equal to 0.9. The simulation run time was 10 seconds as
shown. Optimization of and parameters were conducted with the same simulation time
using the PSCAD optimum run component with number of runs 50 and the population sizes of
10, 20 and 50. The minimum value of objective function is found to be 6041.386 for a
proportional gain ( ) value of 0.0830 and integral time constant ( ) of 0.00015s for all cases of
initial population. In the case of simplex method, the minimum value of objective function is
found to be 5991.471 for a proportional gain ( ) value of 0.0830 and integral time constant ( )
of 0.00015s for multiple run 50 and initial step size as 0.2. After applying these values to the
system, the objective function was 6002.71 which are closer to both the genetic algorithm and
simplex method optimization results as shown in Figure 5-40.
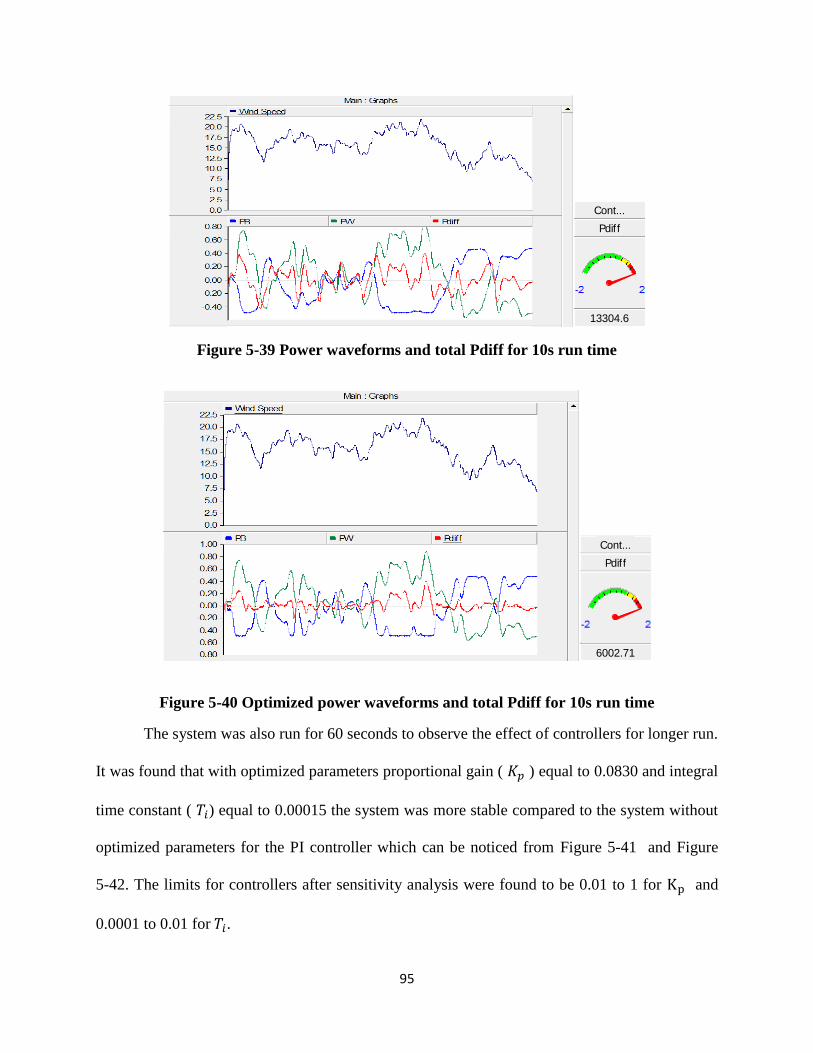
95
Figure 5-39 Power waveforms and total Pdiff for 10s run time
Figure 5-40 Optimized power waveforms and total Pdiff for 10s run time
The system was also run for 60 seconds to observe the effect of controllers for longer run.
It was found that with optimized parameters proportional gain ( ) equal to 0.0830 and integral
time constant ( ) equal to 0.00015 the system was more stable compared to the system without
optimized parameters for the PI controller which can be noticed from Figure 5-41 and Figure
5-42. The limits for controllers after sensitivity analysis were found to be 0.01 to 1 for and
0.0001 to 0.01 for .
Cont...
Pdiff
13304.6
Cont...
Pdiff
6002.71

96
Figure 5-41 Power waveforms and total Pdiff for 60s run time
Figure 5-42 Optimized power waveforms and total Pdiff for 60s run time
Figure 5-43 and Figure 5-44 shows the effect of the power absorbed and injected by the
wind generator into the grid with and without the energy storage module. It describes how the
battery is successful in storing the wind power and releasing it when need, thus reducing the
amount of power obtained from the main supply.
Cont...
Pdiff
77512.7
Cont...
Pdiff
33026.9

97
Figure 5-43 Power output to grid without battery
Figure 5-44 Power output with battery
5.4.2 IEEE 13 Node Distribution Feeder Network
The same procedure for optimization to minimize the integral of the power difference
between wind and battery power was conducted for the IEEE distribution network with wind and
storage modules. For a value of 0.1 and of 0.001s, the objective function was found to be
7357.52 for an initial SOC of battery equal to 0.9. The simulation run time for optimization was
taken only as 5 seconds because the system was not able to write into the output file for higher
values of simulation time. The minimum value of objective function was found to be 7072.026

98
for a proportional gain ( ) value of 0.098 and integral time constant ( ) of 0.0009s for initial
population of 10, 20 and 50. After applying these values to the system, the objective function
was 7053.3 which is closer to the optimization results. The limits for the PI controller gains after
sensitivity analysis were found to be 0.09 to 0.2 for and 0.0009 to 0.002 for .
From the waveforms for the power difference and the value for total power output we can
see that a larger value of Pdiff is attained when the proportional gain ( ) value is 0.1 and
integral time constant ( ) value is 0.001s. This power difference value is either absorbed from
the grid or supplied to it which increases the transmission loss and reduces the efficiency of the
system. This can be seen from Figure 5-45 and Figure 5-46 and for simulation time 60 seconds
and 10 seconds.
Figure 5-45 Power waveforms and total Pdiff for 10s run time
Figure 5-46 Optimized power waveforms and total Pdiff for 10s run time
Cont...
Pdiff
13591.3
Cont...
Pdiff
13096.6

99
When the same system is controlled using optimized parameters for PI controller gains,
the power difference curve is closer to zero which can be seen from the Figure 5-47 and Figure
5-48.The total sum of the Pdiff curve is reduced for both run time.
Figure 5-47 Power waveforms and total Pdiff for 60s run time
Figure 5-48 Optimized power waveforms and total Pdiff for 60s run time
It can be observed that more accuracy is obtained for smaller systems than larger
networks. Almost 120% reduction is obtained for standalone system with optimized parameters,
but for the distribution network only 4% reduction is noticed. As the complexity of the system
increases it becomes difficult to optimize the system. The optimized parameters were also
checked for different values of SOC and the results were found favorable. Hence it can be
Cont...
Pdiff
78719.7
Cont...
Pdiff
76080.1

100
concluded that the optimized controllers reduces the burden on the main grid and increases the
efficiency of the system.
Figure 5-49 and Figure 5-50 shows the effect of the power absorbed and injected by the
wind generator into the distribution grid with and without the energy storage module. It describes
how the battery is able to store the wind power and provide the required power when wind power
output decreases, thus reducing the amount of power absorbed or injected into the main supply.
Figure 5-49 Power output to grid without battery
Figure 5-50 Power output with battery

101
Optimization to minimize the total transmission loss with wind and battery power was
conducted for the IEEE distribution network with wind and storage modules. For a value of
0.1 and of 0.001s, the objective function was found to be 11952.7 for an initial SOC of battery
equal to 0.9 as shown in Figure 5-51. The minimum value of objective function was found to be
11311.3 shown in Figure 5-52 for a proportional gain ( ) value of 0.3737 and integral time
constant ( ) of 0.0966s for initial population of 6 and multiple run of 20. The limits for the PI
controller gains after sensitivity analysis were found to be 0.01 to 1 for and 0.0001 to 0.1 for
. The transmission loss reduced more than 5% after optimization. The node voltages with
optimized parameters for the PI controller are given in Table 5-8. The node voltage variation is
maintained between ±5 percent. The maximum voltage deviation is in phase B for node 634
which is about 3.1%. Thus we can note that after optimization transmission loss is reduced as
well as voltages at all nodes are maintained within limits
Figure 5-51 Total transmission loss before optimization
Figure 5-52 Total transmission loss after optimization
Main ...
TTL
11952.7
Main ...
TTL
11311.3
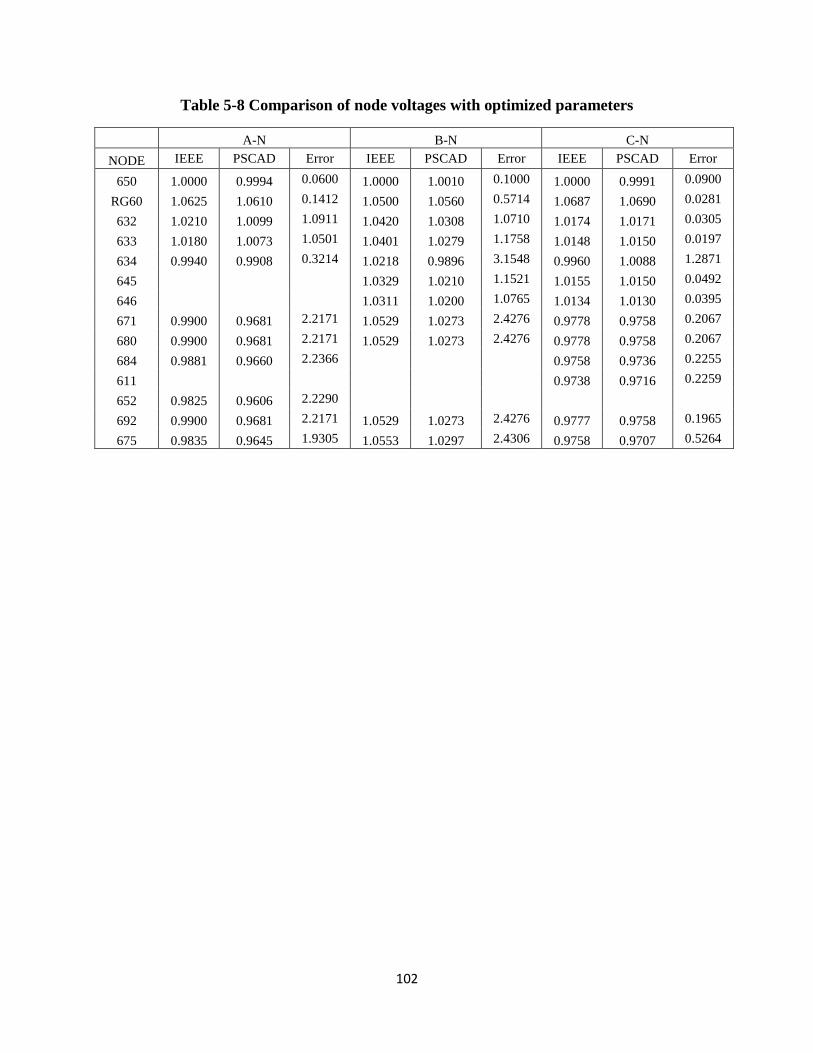
102
Table 5-8 Comparison of node voltages with optimized parameters
A-N B-N C-N
NODE IEEE PSCAD Error IEEE PSCAD Error IEEE PSCAD Error
650 1.0000 0.9994 0.0600 1.0000 1.0010 0.1000 1.0000 0.9991 0.0900
RG60 1.0625 1.0610 0.1412 1.0500 1.0560 0.5714 1.0687 1.0690 0.0281
632 1.0210 1.0099 1.0911 1.0420 1.0308 1.0710 1.0174 1.0171 0.0305
633 1.0180 1.0073 1.0501 1.0401 1.0279 1.1758 1.0148 1.0150 0.0197
634 0.9940 0.9908 0.3214 1.0218 0.9896 3.1548 0.9960 1.0088 1.2871
645 1.0329 1.0210 1.1521 1.0155 1.0150 0.0492
646 1.0311 1.0200 1.0765 1.0134 1.0130 0.0395
671 0.9900 0.9681 2.2171 1.0529 1.0273 2.4276 0.9778 0.9758 0.2067
680 0.9900 0.9681 2.2171 1.0529 1.0273 2.4276 0.9778 0.9758 0.2067
684 0.9881 0.9660 2.2366 0.9758 0.9736 0.2255
611 0.9738 0.9716 0.2259
652 0.9825 0.9606 2.2290
692 0.9900 0.9681 2.2171 1.0529 1.0273 2.4276 0.9777 0.9758 0.1965
675 0.9835 0.9645 1.9305 1.0553 1.0297 2.4306 0.9758 0.9707 0.5264

103
Chapter 6 CONCLUSION AND FUTURE RESEARCH
6.1 CONCLUSIONS
Electrical energy storage is becoming an integral part of power systems. This work primarily
focusses on designing a storage unit whose capacity matches with the distributed generation and
has its power characteristics in inverse variation with the distributed generation power
characteristic. The latest developments and the applications of energy storage in power sector are
reviewed initially followed by the detailed description of building the test system in PSCAD.
The battery model used in this thesis is the Li-ion battery which has high energy density and
efficiency. Standalone system and IEEE 13 node feeder distribution system with wind turbine
generator and photovoltaic panel were the two test systems considered to show the effect of
energy storage unit on distribution system. The integration and control of energy storage system
is achieved using a battery energy management control system at the upper level and a
real/reactive power controlled VSC at the lower level. To enhance the control optimization based
on genetic algorithm is also performed where the proportional gain and the integral time constant
of the PI controller are optimized which reduces the losses and decreases the burden on the main
grid. From the results it can be conclude that the battery energy management control is effective
in controlling the modes of operation of energy storage module based on the wind and solar
conditions and is able to completely balance the power produced by the wind generator module
and PV panel module. In this thesis all the test systems and the control were implemented in
PSCAD as it is emerging as the new industry standard for power applications research.

104
6.2 DIRECTIONS FOR FUTURE RESEARCH
The technologies for storing electrical energy are emerging fast. The control phase needs regular
updating. Security and protection attributes from over voltage and overcurrent can also be
included with the system. This system can also be tested with other battery models as well as
with other distributed generators with intermittent nature. Control and optimization based on
wind speed and solar radiation forecasted data can be also included in the model. Different
power system scenarios like demand management, peak shaving, stability analysis, fault analysis
etc. can also be performed to test the reliability and efficiency of the system. Our research team
is also developing a communication module which will be included in future studies to analyze
the effects of communication on control.

105
REFERENCES
[1] A. Abedini and H. Nikkhajoei, “Dynamic model and control of a wind turbine generator with
energy storage,” IET Trans. Renewable Power Generation, vol. 5, pp. 67-78, Jan. 2011.
[2] A. Esmaieli, S. A. N. Niaki, A. Tajfar and H. Nademi, “Unified Modeling of UPFC-SMES in
Power System Application,” in Proc. 2008 IEEE Conference on Industrial Electronics and
Applications, pp. 2051-2056, June 2008.
[3] A. Gabash and P. Li, “Active-Reactive Optimal Power Flow in Distribution Networks with
Embedded Generation and Energy storage,” IEEE Trans. Power Systems, Volume 27, pp.
2026 – 2035, 2012.
[4] A. Gabash and P. Li, “Flexible Optimal operation of Energy storage System for Energy
Supply Networks,” IEEE Trans. Power Systems, Volume 99, pp. 1 – 10, 2012.
[5] A. H. Shahirina, S. M. M. Tafreshi and A. H. Gastaj, “Optimal Sizing of Hybrid Power
System using Genetic Algorithms,” International Conference on Future Power Systems, pp. 6
– 12, 2005
[6] A. K. Srivastava, A. A. Kumar and N. N. Schulz, “Impact of Distribution Generators with
Energy Storage Devices on the Electric Grid,” IEEE Systems Journal, Volume 6, pp. 110 -
117, 2012.
[7] A. M. Gee, F. V. P. Robinson and R. W Dunn, “Analysis of Battery Lifetime Extension in a
Small-Scale Wind-Energy System Using Supercapacitors,” IEEE Trans. Energy Conversion,
vol. 28, pp. 24-33, March. 2013.

106
[8] A. Mohamed, M. Elshaer and O. Mohammed, "Bi-Directional AC-DC/ DC- AC Converter
for Power Sharing of Hybrid AC/DC Systems," in Proc. 2011 IEEE Power and Energy
Society General Meeting, pp. 1-8.
[9] A. Oudalov, D. Chartouni, and C. Ohler, "Optimizing a Battery Energy Storage System for
Primary Frequency Control," IEEE Trans. Power Systems, vol. 22, pp. 1259-1266, Aug.
2007.
[10] A. Rabiee, H. Khorramdel, J. Aghaei, “A review of energy storage systems in microgrids
with wind turbines,” Renewable and Sustainable Energy Reviews, Volume 18, 316 – 326,
2013.
[11] A. Vijay, P. Dutta and S. Kalyanaramn, “On mitigating Wind Energy Variability with
Storage,” Fifth International Conference on Communication Systems and Networks, pp. 1-9,
2013.
[12] A. Yazdani, and R. Iravani, “Voltage-Sourced Converters in Power System: Modeling,
Control and Applications,” IEEE Press, John Wiley and Sons, 2010.
[13] Advanced Systems for Power Engineering, ASPEN,
http://www.aspeninc.com/aspen/index.php
[14] B. Parkhideh, J. Zeng, S. Baek, S. Bhattacharya, M. Baran, A. Q. Huang, " Improved
Wind Farm's Power Availability by Battery Energy storage Systems Modeling and Control,"
in Proc. 2008 IECON 34th
Annual Industrial Electronics, pp. 784-789.
[15] BCP Inc., Neplan, http://www.neplan.ch/html/e/e_home.htm
[16] C. Abbey and G. Joos, "Energy Management Strategies for Optimization of Energy
Storage in Wind Power Hybrid System," in Proc. 2005 IEEE Power Electronics Specialists
Conference, pp. 2066-2072.
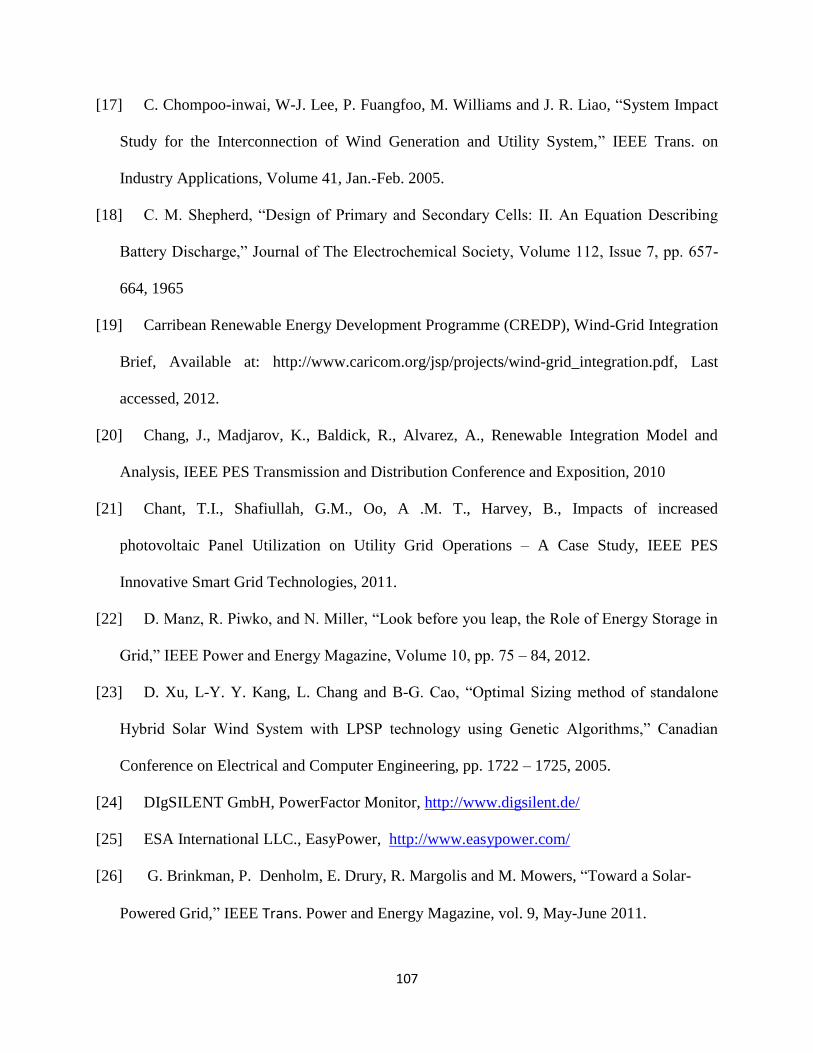
107
[17] C. Chompoo-inwai, W-J. Lee, P. Fuangfoo, M. Williams and J. R. Liao, “System Impact
Study for the Interconnection of Wind Generation and Utility System,” IEEE Trans. on
Industry Applications, Volume 41, Jan.-Feb. 2005.
[18] C. M. Shepherd, “Design of Primary and Secondary Cells: II. An Equation Describing
Battery Discharge,” Journal of The Electrochemical Society, Volume 112, Issue 7, pp. 657-
664, 1965
[19] Carribean Renewable Energy Development Programme (CREDP), Wind-Grid Integration
Brief, Available at: http://www.caricom.org/jsp/projects/wind-grid_integration.pdf, Last
accessed, 2012.
[20] Chang, J., Madjarov, K., Baldick, R., Alvarez, A., Renewable Integration Model and
Analysis, IEEE PES Transmission and Distribution Conference and Exposition, 2010
[21] Chant, T.I., Shafiullah, G.M., Oo, A .M. T., Harvey, B., Impacts of increased
photovoltaic Panel Utilization on Utility Grid Operations – A Case Study, IEEE PES
Innovative Smart Grid Technologies, 2011.
[22] D. Manz, R. Piwko, and N. Miller, “Look before you leap, the Role of Energy Storage in
Grid,” IEEE Power and Energy Magazine, Volume 10, pp. 75 – 84, 2012.
[23] D. Xu, L-Y. Y. Kang, L. Chang and B-G. Cao, “Optimal Sizing method of standalone
Hybrid Solar Wind System with LPSP technology using Genetic Algorithms,” Canadian
Conference on Electrical and Computer Engineering, pp. 1722 – 1725, 2005.
[24] DIgSILENT GmbH, PowerFactor Monitor, http://www.digsilent.de/
[25] ESA International LLC., EasyPower, http://www.easypower.com/
[26] G. Brinkman, P. Denholm, E. Drury, R. Margolis and M. Mowers, “Toward a Solar-
Powered Grid,” IEEE Trans. Power and Energy Magazine, vol. 9, May-June 2011.
108
[27] General Electric Energy, PSLF, http://www.ge-
nergy.com/products_and_services/products/utility_operations_software/index.jsp
[28] H. Oh, “Optimal Planning to include Storage Devices in Power System,” IEEE Trans.
Power Systems, Volume 26, pp. 1118 – 1128, 2011.
[29] Homer Energy LLC., Homer, http://homerenergy.com/
[30] IEEE 13-Node Test Feeder, Available at:
http://ewh.ieee.org/soc/pes/dsacom/testfeeders/index.html
[31] IPSA Power Ltd., IPSA, http://www.ipsa-power.com/
[32] L. Bam and W. T. Jewell, “Review: Power System Analysis Software Tools”, IEEE
Power Engineering Society General Meeting, Volume 1, pg 139 – 144, 2005.
[33] Laurel Mountain Wind Storage, 2011 [online] Available:
http://www.aesenergystorage.com/projects.html
[34] Linh, N.T., Power Quality Investigation of Grid Connected Wind Turbines, Proceedings
of the 4th IEEE Conference on Industrial Electronics and Applications, 2009.
[35] Lisserre, M., Sauter, T., Hung, J.Y., Future Energy Systems: Integrating Renewable
Energy Sources into the Smart Power Grid through Industrial Electronics, IEEE Industrial
Electronics Magazine, Volume 4 (1), 2010.
[36] Lu, M.S., Chang, C-L., Lee W-J, Impact of Wind Generation on Transmission Systems,
39th North American Power Symposium, 2007.
[37] M. E. Glavin, P. K. W. Chan and W. G. Hurley, "Optimization of Autonomous Hybrid
Energy Storage System for Photovoltaic Applications," in Proc. 2009 IEEE Energy
Conversion Congress and Exposition, pp. 1417-1424.

109
[38] M. Ghofrani, A. Arabali and M. Etezadi- Amoli, “Electric Drive Vehicle to Grid
Synergies with Large scale Wind Resources,” IEEE Power and Energy Society General
Meeting, pp. 1 – 6, 2012.
[39] M. S. Whittingham, “History, Evolution and Future status of Energy Storage,” Issue:
Special Centennial Issue Proceedings of the IEEE, Volume 100, pp. 1518 – 1534, 2012.
[40] Manitoba Hydro International Ltd., PSCAD, https://hvdc.ca/pscad/
[41] Mathworks, SIMULINK generic battery model,
http://www.mathworks.com/help/physmod/powersys/ref/battery.html
[42] Milsoft Utility Solutions, Windmil, http://milsoft.com/products/windmil
[43] N. H. Ishak, I. S. Isa, S. B. Abdullah, S. Masri and F. M. T. Tawi, “Performance
Comparison of Electric Power Flow Solutions Using PSCAD,” International Conference on
Science and Social Research (CSSR), pg 542-547, 2010.
[44] O. Tremblay, L. A. Dessaint and A. I. Dekkiche, “A Generic Battery Model for the
Dynamic Simulation of Hybrid Electric Vehicles,” in Proc. 2007 IEEE Vehicle Power and
Propulsion, pp. 284-289.
[45] Operational Technology, Inc., http://etap.com/Index.htm
[46] PowerWorld Corporation, PowerWorld, http://www.powerworld.com/
[47] Q. Jiang and H. Wang, “Two time-scale coordination control for a Battery Energy
Storage System to mitigate wind power fluctuations,” IEEE Trans. Energy Conversion, vol.
28, pp. 52 – 61, 2013.
[48] R. D. Lopez and J. L. B. Augustin, HOGA: Hybrid Renewable Optimization by Genetic
Algorithms, Available at: http://www.hoga-renewable.es.tl/

110
[49] R. Wu, S. B. Dewan, and G. R. Slemon, "Analysis of an ac-to-dc Voltage Source
Converter Using PWM with Phase and Amplitude Control," IEEE Trans. On Industrial
Applications, vol. 27, pp. 355-364, Mar/Apr. 1991.
[50] Renewable Energy Research Laboratory, Hybrid2,
http://www.umass.edu/windenergy/research.topics.tools.software.hybrid2.php
[51] S. Kim, J. Jeon, C. Cho, J. Ahn and S. Kwon, “Dynamic Modeling and Control of a Grid-
Connected Hybrid Generation System With Versatile Power Transfer,” IEEE Trans.
Industrial Electronics, vol. 55, pp. 1677-1688, April 2008.
[52] S. Mishra, G. Mallesham and A. N. Jha, “Design of Controller and Communication for
Frequency Regulation of a Smart Microgrid,” IET Renewable Power Generation, Volume 6,
pp. 248 – 258, 2012.
[53] S. Mohan, E. P. Cheriyan, “Bilateral Converter to Interface Small Battery Energy Storage
System with Micro-grid,” in Proc. 2012 IEEE Students’ Conference on Electrical,
Electronics and Computer Science, pp. 1-4
[54] S. Shajari and R. K. Pour, “Reduction of Battery Size and Charge-Discharge for Active
Power Smoothing of DFIG,” 11th
International Conference on Environment and Electrical
Engineering, pp. 112 -114, 2012.
[55] S. Teleke, M. E. Baran, S. Bhattacharya and A. Q. Huang, “Optimal Control of Battery
Energy Storage for Wind Farm Dispatching,” IEEE Trans. Energy Conversion, vol. 25, pp.
787-794, Sept. 2010.
[56] S. Tewari and N. Mohan “Value of NAS Energy Storage Toward Integrating Wind:
Results From the Wind to Battery Project,” IEEE Trans. Power Systems, vol. 28, pp. 532-
541, Feb. 2013.

111
[57] Shafiullah, G.M., Oo, A .M. T., Jarvis, D., Shawkat Ali, A.B.M., Wolfs, P., Potential
Challenges: Integrating Renewable Energy with the Smart Grid, 20th Australasian
Universities Power Engineering Conference , 2010
[58] T. K. A. Brekken, A. Yokochi, A. von Jouanne, Z. Z. Yen, H. M. Hapke and D. A.
Halamay, "Optimal Energy Storage Sizing and Control for Wind Power Applications," IEEE
Trans. Sustainable Energy, vol. 2, pp. 69-77, Jan. 2011.
[59] The GL Group, SynerGEE Electric,
http://www.gl-group.com/en/powergeneration/SynerGEE_Electric.php
[60] The Mathworks Inc., SimPowerSystems,
http://www.mathworks.com/products/simpower/
[61] W. H. Kersting, “Distribution Feeder Voltage Regulation Control,” IEEE Trans. Industry
Applications, vol. 46, pp. 620-626, March-April 2010.
[62] W. Hu, C. Su, Z. Chen and B. B. Jensen, “Optimal operation of Plug-In Electric Vehicles
in Power Systems with High Wind Power Penetrations,” IEEE Trans. Sustainable Energy,
vol. PP, pp. 1-9, 2013.
[63] W. Zhou, C. Lou, Z. Li, L. Lu and H. Yang, “Current status of research on Optimum
Sizing of Standalone Hybrid Solar Wind Power Generation Systems,” Applied Energy, vol.
87, pp. 380 – 389, 2010.
[64] X. Tan, Q. Li, H. Wang, “Advances and Trends of energy storage technology in
microgrid,” Electrical Power and Energy Systems, Volume 44, 179 – 191, 2013.
[65] X. Y. Wang, D. Mahinda, and S. S. Choi, "Determination of a Energy storage Capacity in
Energy Buffer for Wind Farm," IEEE Trans. Energy Conversion, vol. 23, pp. 868-878, Sept.
2008.

112
[66] Y. M. Atwa and E. F. El-Saadany, “Optimal allocation of ESS in Distribution Systems
with a high penetration of Wind Energy,” IEEE Trans. Power Systems, Volume 25, pp. 1815
– 1822, 2010.
[67] Yao, M., Yao, L., Integration of Large Scale Wind Farm into the Electrical Grid, China
International Conference on Electricity Distribution, 2010.