energy management at a mineral-processing plantthe existing mineral-processing plant produces...
TRANSCRIPT

IEEE
In
du
str
y A
pp
lIc
AtI
on
s M
Ag
AzI
nE
• s
Ept|
oc
t 20
14 •
ww
w.I
EEE.
or
g/I
As
14
any mineral-processing plants across
the globe have been operational for years and are filled
with legacy electrical systems of multiple vintages with
disparate control and monitoring components. the pur-
pose of this article is to present a case study of one such plant that has
been operating for over 80 years. as the original plant was built before
the latest innovations in metering and monitoring devices, the
The latest innovations in metering and monitoring
1077-2618/14©2014IEEE
M
EnErgy ManagEMEnt at a MinEral-
ProcEssing Plant
By HurcHEl r . young, BrucE nEwEll , & dAVId B . durocHEr
Digital Object Identifier 10.1109/MIAS.2013.2288401
Date of publication: 8 July 2014
Ima
ge
lIc
en
se
d b
y In
gr
am
Pu
blI
sh
Ing
15
IEEE Ind
ustr
y A
pp
lIcA
tIon
s MA
gA
zInE •
sEpt|
oc
t 2014 • w
ww
.IEEE.or
g/IA
s
plant made a decision to purchase and self-install meter-ing to create a facility-wide monitoring and energy-man-agement system. the project was funded by a corporate program that granted capital funding for projects focused on saving energy. the energy-monitoring devices were integrated with the plant distributed control sys-tem (Dcs) so that the energy usage throughout the plant is visible to the operators. as a result, the plant operators are making informed decisions based on optimized energy usage. today, the plant is running more effi-ciently, as energy usage is measured and visible at all lev-els across the plant organization.
Cement Industry Across the United Statesthere are many challenges in the U.s. cement industry. in 2010, there were 102 clinker-producing plants, with 154 cement kilns. these plants operated at a collective capacity of 58.3%, producing 103.6 million t of clinker to support the U.s. market [1]. at this low production level, many older, inefficient plants have long since been closed or shuttered, yielding way for newer, more efficient produc-tion. several facilities have been idled for months at a time, opting for “market-related downtime” in lieu of pro-ducing cement beyond the market demand. although the economic cycle is expected to recover, at the time of this writing, key drivers for the industry, such as new housing starts, continue to remain at depressed levels. in addition to the business challenges for the industry, new regula-tions enacted by the U.s. environmental protection agency (epa) now require cement plants to reduce emis-sions of some airborne contaminants by over 90%, with new environmental regulations legislated in June 2013. these new laws, the national emission standards for Haz-ardous air polutants (nesHap), have effectively diverted most industry investment toward meeting the new emis-sion standards by adding scrubbers and bag houses. it is a challenging time to add cost in a market with weak demand and continuous pressure on prices.
in this environment, it is clear that continuing to pro-duce without making fundamental changes to the opera-tion is simply not an option. Both business leaders and facility operators need to be committed to continuous improvement, finding new ways to optimize the manufac-turing process, or they run the risk of permanent closure. in 2007, a U.s.-based cement company developed an energy initiative for its mineral-processing facilities to address power usage, fuel usage, and environmental responsibility. the company policy states that the enter-prise is committed to acquiring and using energy in the most efficient, cost-effective, and environmentally respon-sible manner possible, minimizing its carbon footprint. the policy also states that it will improve energy effi-ciency by establishing and implementing effective energy-management programs that support all operations, customer satisfaction, and minimize greenhouse gas emis-sions while providing a safe work environment.
this article presents a case study of one of the company plants, located in the U.s. pacific northwest, and its quest for improvement via optimizing energy use. We discuss a unique energy-management program available at the enter-prise level that was used to financially support the decision
to install a state-of-the-art energy-monitoring system. in-plant resources were effectively used to specify, procure, install, and integrate new energy meters during a scheduled market-related outage, delivering the new system at an optimal cost. Because it was created by in-plant resources, the new energy-management system was embraced by oper-ations and was well understood from the beginning. it is an inspiring story of a plant that decided to do something rather than nothing—with impressive results!
The Case for Improved Energy Managementthe existing mineral-processing plant produces 750,000 t/year of cement and was originally built in 1927. the facility was rebuilt in 1991, when the cement-making process was converted from wet to dry. as a result of this change, much of the site electrical systems related to the kiln operation were upgraded, while the systems and process post clinker production remained fundamentally unchanged. the pri-mary kiln fuels are either coal or natural gas, a choice made by operations based on the cost and availability of these two sources. the facility also burns tires as an alternative fuel source. the total electrical load at the plant is 13 mW, and the monthly electrical energy bills frequently exceed Us$400,000—a significant component of the total operat-ing cost for the facility. the incoming utility service at the plant is distributed at 4,160 V, and most of the larger elec-trical motor loads operate at this voltage. in-plant transfor-mation converts the 4,160-V systems to 480 V, the potential where the balance of plant load is supported. Because of the age of the facility, standard dial-type amme-ters, voltmeters, and kilowatt-hour (kWh) meters were installed at the incoming utility point of service and also at the primary and secondary substations. Historic energy-management procedures in the plant included manual meter reading and recording of energy at each substation, which took place on the last operating day of the month. Kilowatt-hour readings were transferred to a spreadsheet and distributed to accounting, where the information was used by operations to determine the electrical energy effi-ciency in kWh per metric ton produced by each operational department. in this way, “energy owners” of each individual process, such as the raw mill, the kiln, and the finish mill, could be aware of the energy usage based on the previous month’s production. although the recorded energy metrics offered visibility to the total electrical energy consumed, the legacy system had many drawbacks: ▪ operators were unaware of real-time energy usage
and were notified the following month of the prior-month performance data.
▪ operations had no real mechanism to evaluate and respond to changes in monthly energy usage.
▪ Departments were energy owners but had no way to use data/respond with operational changes.
▪ there was an inability to respond to peak power usage events that would trigger a utility demand charge.
▪ there was no clear method to track electrical system efficiency.
▪ there was no real-time method to identify and the manage electrical loads with the largest demand.
▪ there was no immediate means to alert an operator of a potential energy savings.

IEEE
In
du
str
y A
pp
lIc
AtI
on
s M
Ag
AzI
nE
• s
Ept|
oc
t 20
14 •
ww
w.I
EEE.
or
g/I
As
16
Because of multiple deficiencies in the way energy information was gath-ered and used across the plant, the decision was made to investigate alter-native methods and new technology that could be deployed to improve the management of electrical energy.
in evaluating the alternatives, the staff recognized that, at this facility, nearly every piece of equipment needed to be running to produce cement. the existing systems were sized with little extra capacity, leaving little room for peak-demand and on-peak energy man-agement. one operational exception to this is when the kiln is shut down. in this operational scenario, the finish mill can be operated during off-peak hours. another identified operational exception was when the kiln is running primarily on natural gas, and there is reduced need for pulverized coal, so this equipment can be run during off-peak hours. the utility rate structure includes an attractive cost alternative for off-peak electricity so moving large loads to off-peak operations was desired.
Enterprise Energy-Management Programthe company in this case study owns and operates sev-eral plants across the United states. the corporate initia-tive across the company was to adopt an enterprise-wide energy-management program. this initiative offers cor-porate funding to operating plants based on a formal submission request. the company actively manages expectations for each plant in terms of improvement of production energy efficiency. if a plant submission meets operating improvement metrics and return-on-invest-ment (roi) hurdles, the plant is eligible to receive cor-porate funding for an energy improvement project. one element of the enterprise-wide program is that each plant is expected to address the issue of metering and submetering for energy systems. submetering was defined as necessary metering so that each operating department had clear real-time visibility of energy usage. the thinking behind this requirement is “if you cannot measure it, you cannot manage it.” as such, accurate real-time metering was identified as a required first step before other energy-saving process changes, such as retro-fitting motor-driven systems with variable-speed drives, could be considered or funded.
The Path Forward for a New Energy-Management Systemthe local plant assembled a multidisciplinary team to inves-tigate alternatives for a new electrical energy-management system that could be used in real time for the multiple energy users across the facility. the group completed a fairly detailed work scope for the project. the intent was to essen-tially duplicate the functionality of the dial-type metering at each 4,160- and 480-V substation and low-voltage motor control center (mcc). the plan was to upgrade the meter-ing with new technology that would offer energy readings
in real time and would also communi-cate across the existing facility-wide Dcs so that operators would have the real-time information necessary to make informed energy decisions. the defined scope also included a requirement for power-quality data to be available in real time. parameters such as power factor, harmonics, power sags and swells, and momentary utility outages were included as the group recognized that most new electronic-based metering sys-tems include this functionality.
Project Justification and Fundingthis plant’s multidisciplinary team believed that a new energy-manage-ment system was the first necessary step toward improved process optimi-zation via accurate monitoring and uti-
lization of energy data. the plant personnel felt that the increased operator awareness, electrical diagnostic capabil-ity, and potential for integration of energy management with existing process controls would make the new power-monitoring system a significant asset to the plant. this was the primary justification for the energy-management system project. it was ultimately supported by the com-pany corporate leadership, and funding was approved via the enterprise-wide energy-management program.
accurately estimating the roi for the new energy-man-agement system proved to be a difficult task. to minimize the financial impact, the plant gained corporate approval based on project completion in two phases. the first phase would include the two main point-of-service power meters/power-quality analyzers and also new power meters at five of the plant’s 4,160-V feeders for the newer half of the plant. phase 2 would cover all of the rest of the plant equipment: seven new meters connected at the remaining main feeders for the old half of the plant, plus 28 meters for individual mccs and large motors, and network integra-tion of all new devices.
Hiring a Contractor or Self-Managed and Installed?to get started, the local plant team decided to complete the written scope document and sent a request for pro-posal out to multiple contractors. the company required that three bids be submitted, so bids were solicited from local reputable contracting firms as a first step. the review of the bids was the first major stumbling block for the project team. it was determined that although the outside firms were well qualified to do the work, the total pro-posed price was close to double the budget outlined for the project. For the project to stay within budget, the work scope needed to be drastically reduced. this resulted in significantly fewer metering points being updated with new meters and integrated into the site-wide energy-man-agement system. the group discussed the idea of perhaps ending up with a “hybrid” energy-management system, where some of the existing meters would be left in service, and a combination of real-time metering and end-of-month metering via manual meter reading would be used.
The corporaTe iniTiaTive
across The coMpAny wAs To adopT an
EntErprIsE-wIdE EnErgy-
ManageMenT progrAM.
17
IEEE Ind
ustr
y A
pp
lIcA
tIon
s MA
gA
zInE •
sEpt|
oc
t 2014 • w
ww
.IEEE.or
g/IA
s
this approach was rejected as this type of system would not deliver the real-time data to operations that was a functional requirement for the new system. more impor-tantly, this approach would not fulfill the prerequisites of the enterprise-wide energy-management program that required submetering for all “energy users” as a first step of energy-management implementation.
the team realized that one positive feature of this plant was the advantage of a very progressive, visionary plant engineering staff, anxious to try new things, and unafraid of new technology. the programming of in-house pro-grammable logic controllers (plcs) was performed on a routine basis, and the integration of the plc system data into the existing plant-wide Dcs system was already a common practice. these in-plant resources were confident that they could self-install a new energy-management sys-tem. Furthermore, there was a planned market-related outage in the coming months when the plant electrical systems would be down, a perfect time to use existing resources to start installing the new energy-management system. the group decided to proceed with a self-installed system based on a two-phase approach. phase 1 would include the upgrading of the primary point-of-service metering and would take place during one two-month scheduled outage during the winter of 2009, and phase 2 would be scheduled during a planned outage the follow-ing winter, including the installation of the remaining submetering devices. spreading the entire project over two scheduled outages would help ensure that the work could be completed in a timely manner without disrupt-ing production, and this would also spread the installed cost over a two-year period, reducing the financial impact to the plant.
Technology Advancementsthe plant set forth with a plan to review the available tech-nologies in metering and submetering and select the most current and cost-effective solution. the work scope included replacing/upgrading the protection relaying at the incom-ing 4,160-V plant service and integrating these new protec-tive devices with point-of-service energy/power-quality metering, combined with submetering at the downstream substations so that real-time energy data would be available and visible to all energy users across the plant.
Point-of-Service Meters and Protective Relays the plant wanted metering at the point of incoming ser-vice to deliver the greatest accuracy and diagnostic capa-bilities. the electrical distribution system began at the utility service with two main transformers that feed the plant. one transformer served the newer dry-process sys-tems built in the early 1990s, and the other supported the balance of existing equipment from the original plant back when the operation was a wet process. the team de-cided to install two main energy meters, which, when to-talized, would provide accurate energy measurement. this allowed the plant accounting department to use kWh monthly totals from the new meters and compare them with the existing utility metering. the accuracy class of the new meters was “revenue grade,” in accordance with american national standards institute c12.20 [2]. the
new meters included a current accuracy of 0.05% of read-ing ±0.025% of full scale, a voltage accuracy of 0.1% reading ±0.025% of full scale, and an energy/demand power accuracy of 0.2% full scale. exceeding the require-ments of this standard was important as the utility serving the plant would recognize the energy readings from the new metering devices as being valid/accurate.
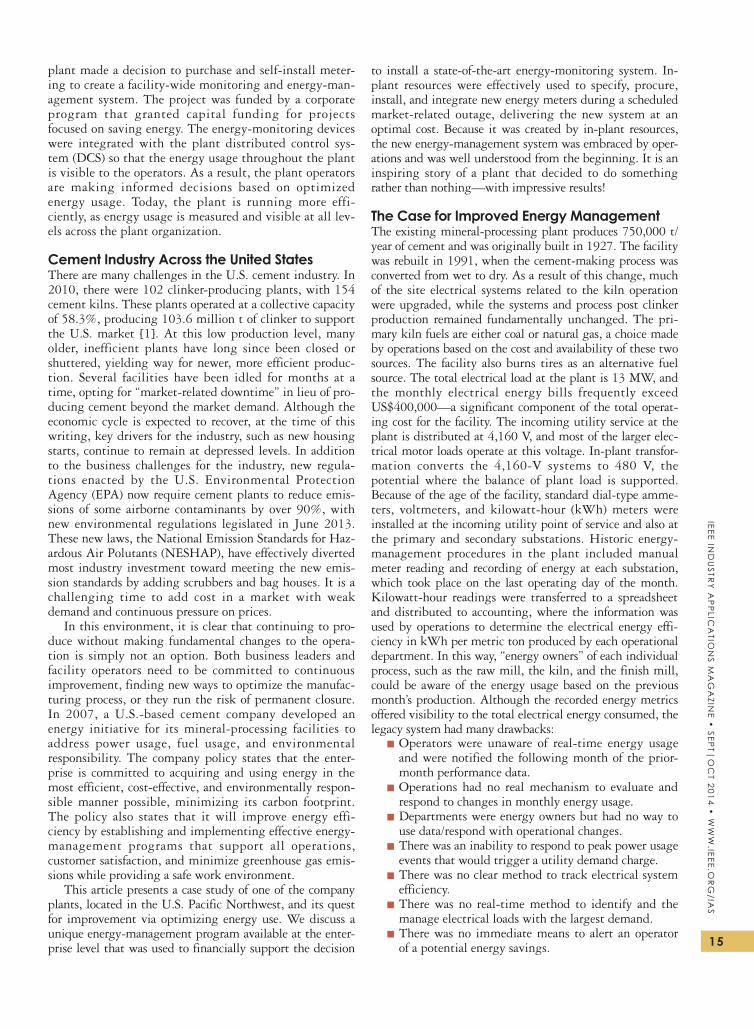
the selected meters also included the capability to measure power-quality parameters. this included measur-ing system harmonics up to 127 times the fundamental frequency, system sags, swells, and transients. these could be captured via user-selected triggers and used for power systems analysis. the high-end portable power-quality metering that was historically used by power-systems engineers to measure and analyze system problems was essentially replaced by an online meter with similar func-tionality, including the measurement and graphing of sub-cycle disturbances with a resolution over 4,000 samples per cycle. Finally, the meters selected included a unique embedded Web server. each meter is assigned its unique internet protocol (ip) address so that any meter could be interrogated from the plant and the enterprise wide area network (Wan). the engineering staff at the plant were interested in this capability as trending and event record-ing, including captured waveforms, could be easily accessed via the network without impacting operations/
(b)
(a)
1(a) The new energy/power quality meter devices installed at the plant point of service and (b) the current waveform anal-ysis capability available from the meter-embedded Web server. (Photo courtesy of Eaton Corporation.)
IEEE
In
du
str
y A
pp
lIc
AtI
on
s M
Ag
AzI
nE
• s
Ept|
oc
t 20
14 •
ww
w.I
EEE.
or
g/I
As
18
production. Figure 1 shows one of the meters used at the point of service and also a sample of a user interface screen displaying a captured waveform event, accessible from the plant network via the device Web server.
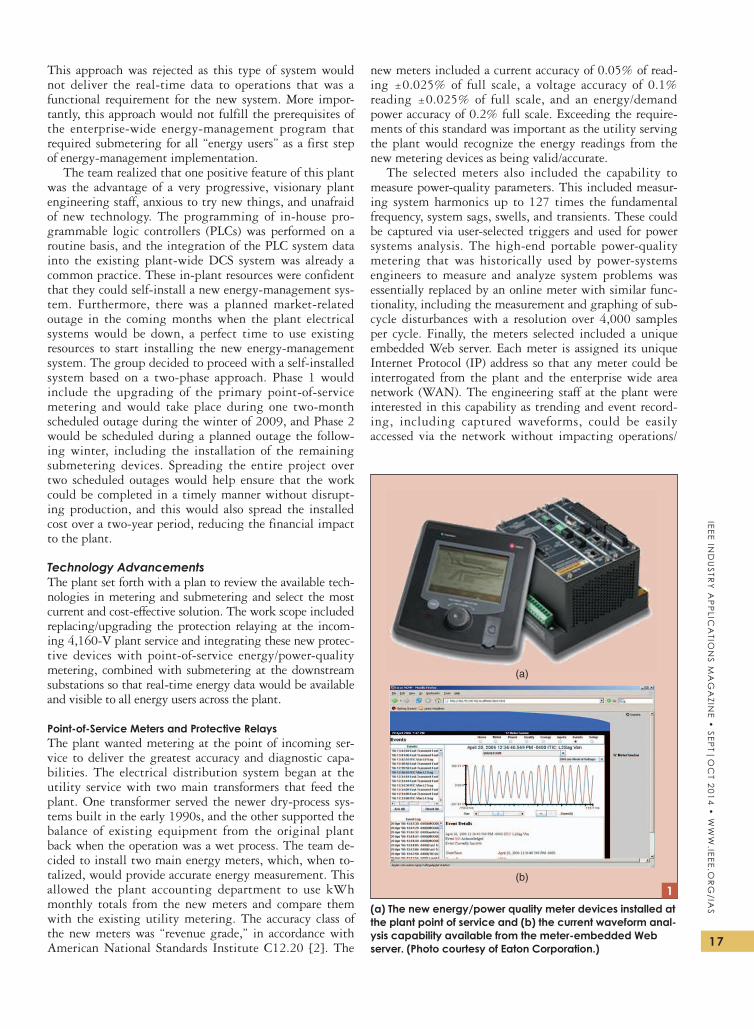
the existing overcurrent protective relays at the incom-ing plant switchgear were of the old induction-disk variety, manufactured in the 1950s and 1960s. these relays were used to trip the plant incoming 4,160-V circuit breakers in the event of a fault at the plant incoming feeders. as the protective relays had reached their end of life and parts were no longer available, the project included replacing incoming relays with new solid-state microprocessor designs. the relay installation was accomplished by a retro-fit of the existing 4,160-V medium-voltage switchgear doors. all existing electromechanical relays were removed, and a large opening was cut into the existing panel door. a local steel fabricator delivered a painted panel that filled in the door cut-out, replacing the antiquated group of relays supporting functions including phase and ground overcur-
rent, over-/undervoltage, and over-/under frequency with a single multifunction protective relay, as shown in Figure 2. one advantage of the multifunction relay selected was that it included full metering capabilities. the multifunction relay also included the capability of network communica-tions. therefore, the panel-mounted device could be used for protective functions plus local and network monitoring of energy data.
Submeteringthe concept of submetering was well understood by the project team. legacy dial-type energy meters had been installed for many years at almost every low-voltage mcc load. energy readings were recorded at the end of each month so accounting could determine the cost by operat-ing department in terms of kWh per metric ton of miner-als processed. the new system also needed to include this functionality. this approach allowed for accurate measure-ment across the plant and established energy users in each department that were ultimately responsible for improv-ing efficiency for their portion of the process.
at this facility, the plan was to install a new energy meter at almost every mcc, major large motor, and some of the individual facility buildings. although the majority of plant equipment from each of the main pro-cess departments was already naturally separated by its own dedicated mcc, there were a few exceptions. some equipment and the associated electrical loads were shared between multiple plant processes. it was necessary to be able to accurately account for power usage by depart-ment. this meant it was necessary to ensure the new sys-tem had the capability to break out percentages of power usage for equipment that operated under a shared meter.
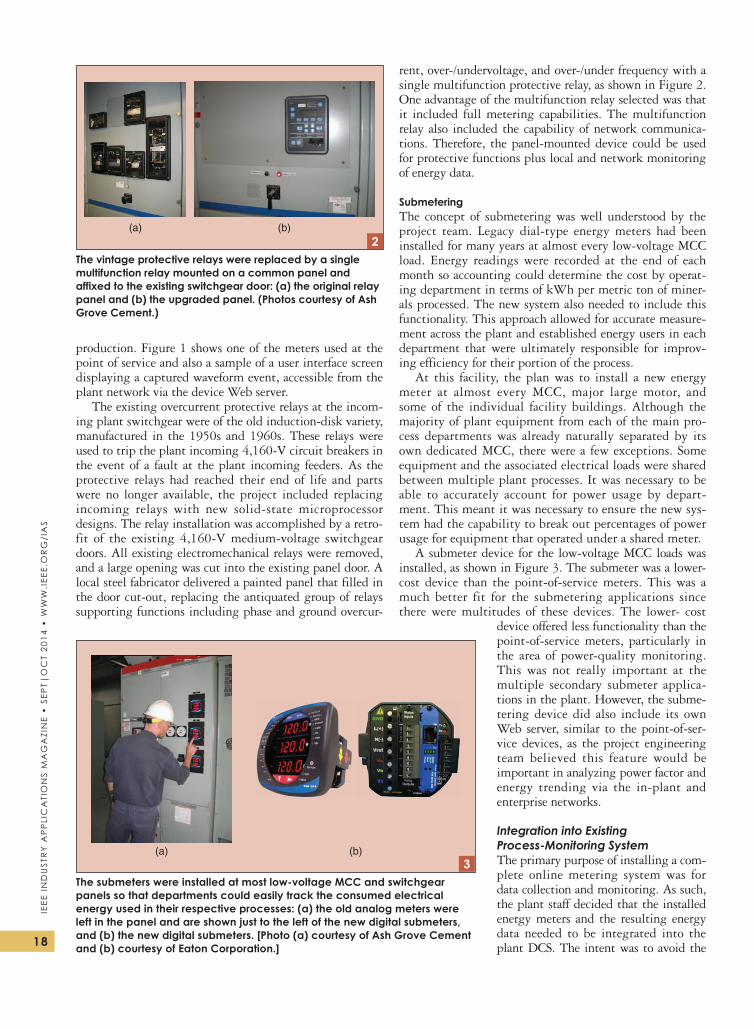
a submeter device for the low-voltage mcc loads was installed, as shown in Figure 3. the submeter was a lower-cost device than the point-of-service meters. this was a much better fit for the submetering applications since there were multitudes of these devices. the lower- cost
device offered less functionality than the point-of-service meters, particularly in the area of power-quality monitoring. this was not really important at the multiple secondary submeter applica-tions in the plant. However, the subme-tering device did also include its own Web server, similar to the point-of-ser-vice devices, as the project engineering team believed this feature would be important in analyzing power factor and energy trending via the in-plant and enterprise networks.
Integration into Existing Process-Monitoring Systemthe primary purpose of installing a com-plete online metering system was for data collection and monitoring. as such, the plant staff decided that the installed energy meters and the resulting energy data needed to be integrated into the plant Dcs. the intent was to avoid the
(a) (b)2
The vintage protective relays were replaced by a single multifunction relay mounted on a common panel and affixed to the existing switchgear door: (a) the original relay panel and (b) the upgraded panel. (Photos courtesy of Ash Grove Cement.)
(b)(a)3
The submeters were installed at most low-voltage MCC and switchgear panels so that departments could easily track the consumed electrical energy used in their respective processes: (a) the old analog meters were left in the panel and are shown just to the left of the new digital submeters, and (b) the new digital submeters. [Photo (a) courtesy of Ash Grove Cement and (b) courtesy of Eaton Corporation.]
19
IEEE Ind
ustr
y A
pp
lIcA
tIon
s MA
gA
zInE •
sEpt|
oc
t 2014 • w
ww
.IEEE.or
g/IA
s
mistake of installing a new isolated monitoring system that would only be used by a few people in the plant. if the system could be integrated into the plant Dcs, plant operators would be able to use the additional energy infor-mation to improve operational efficiency on a real-time basis. this would also open the door to new ways of using the energy information to operate the plant more efficiently and validate the roi associated with future energy projects.
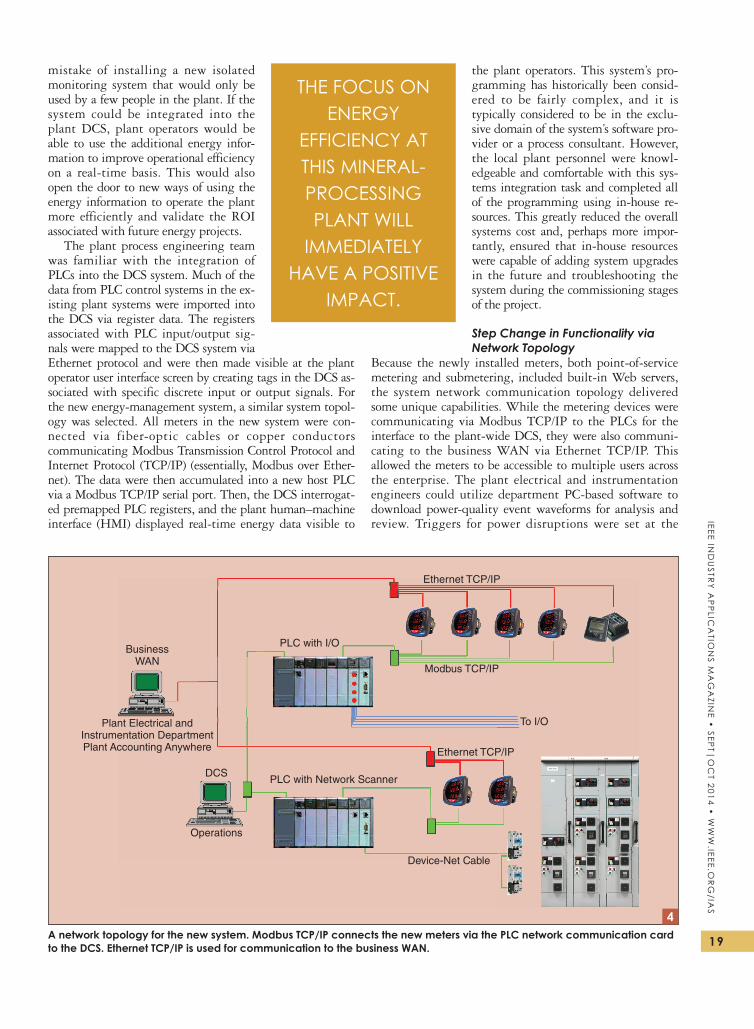
the plant process engineering team was familiar with the integration of plcs into the Dcs system. much of the data from plc control systems in the ex-isting plant systems were imported into the Dcs via register data. the registers associated with plc input/output sig-nals were mapped to the Dcs system via ethernet protocol and were then made visible at the plant operator user interface screen by creating tags in the Dcs as-sociated with specific discrete input or output signals. For the new energy-management system, a similar system topol-ogy was selected. all meters in the new system were con-nected via fiber-optic cables or copper conductors communicating modbus transmission control protocol and internet protocol (tcp/ip) (essentially, modbus over ether-net). the data were then accumulated into a new host plc via a modbus tcp/ip serial port. then, the Dcs interrogat-ed premapped plc registers, and the plant human–machine interface (Hmi) displayed real-time energy data visible to
the plant operators. this system’s pro-gramming has historically been consid-ered to be fairly complex, and it is typically considered to be in the exclu-sive domain of the system’s software pro-vider or a process consultant. However, the local plant personnel were knowl-edgeable and comfortable with this sys-tems integration task and completed all of the programming using in-house re-sources. this greatly reduced the overall systems cost and, perhaps more impor-tantly, ensured that in-house resources were capable of adding system upgrades in the future and troubleshooting the system during the commissioning stages of the project.
Step Change in Functionality via Network Topology
Because the newly installed meters, both point-of-service metering and submetering, included built-in Web servers, the system network communication topology delivered some unique capabilities. While the metering devices were communicating via modbus tcp/ip to the plcs for the interface to the plant-wide Dcs, they were also communi-cating to the business Wan via ethernet tcp/ip. this allowed the meters to be accessible to multiple users across the enterprise. the plant electrical and instrumentation engineers could utilize department pc-based software to download power-quality event waveforms for analysis and review. triggers for power disruptions were set at the
BusinessWAN
Modbus TCP/IP
To I/O
Ethernet TCP/IP
PLC with I/O
PLC with Network Scanner
Device-Net Cable
Operations
DCS
Ethernet TCP/IP
Plant Electrical andInstrumentation DepartmentPlant Accounting Anywhere
4A network topology for the new system. Modbus TCP/IP connects the new meters via the PLC network communication card to the DCS. Ethernet TCP/IP is used for communication to the business WAN.
The focus on energy
efficiency aT tHIs MInErAl-processing plAnt wIll
iMMediaTely have a posiTive
IMpAct.
IEEE
In
du
str
y A
pp
lIc
AtI
on
s M
Ag
AzI
nE
• s
Ept|
oc
t 20
14 •
ww
w.I
EEE.
or
g/I
As
20
point-of-service meters to record waveforms based on power system excursions, such as during system transients, sags, and swells. the waveform data are recorded and stored at the meter, and then system analysis can be performed fol-lowing an event to determine root cause of the disruption and fix the issue to prevent a reoccurrence. the meters were also accessible by the plant accounting department.
the trending of a meter linked to a specified process would often reveal significant changes in energy based on plant operations. Finally, since the information across the Wan was available across the company, engineers or opera-tional managers at headquarters could also interrogate the systems and access energy data in real time from a single meter or a designated group of meters that were linked to a specific process in the plant. Figure 4 shows a diagram of the system topology. note that although the modbus tcp/ip and the ethernet tcp/ip are shown as different commu-nications media, this is only shown to identify the different networks. in actual practice, the same copper communica-tion cable or fiber-optic cable is used to transmit both pro-tocols across a single media or communication conductor.
Overall Change in the Plant Operations from an Energy PerspectiveWith the new system in place, the plant personnel set their sights on developing ways to use the new visible energy information. integration into the Dcs system and how the energy information was displayed were important factors in improving operations. the project team took the approach that all plant personnel should be able to make use of the new information. the best way to ensure the
energy information was meaningful, and therefore rele-vant, was to stay away from screens filled with miscella-neous electrical data. electrical personnel could access each meter via the Web browser feature when they needed that type of data. the information presented at the Dcs needed to be easy to understand, and each Hmi screen was designed to be directed at a particular issue.
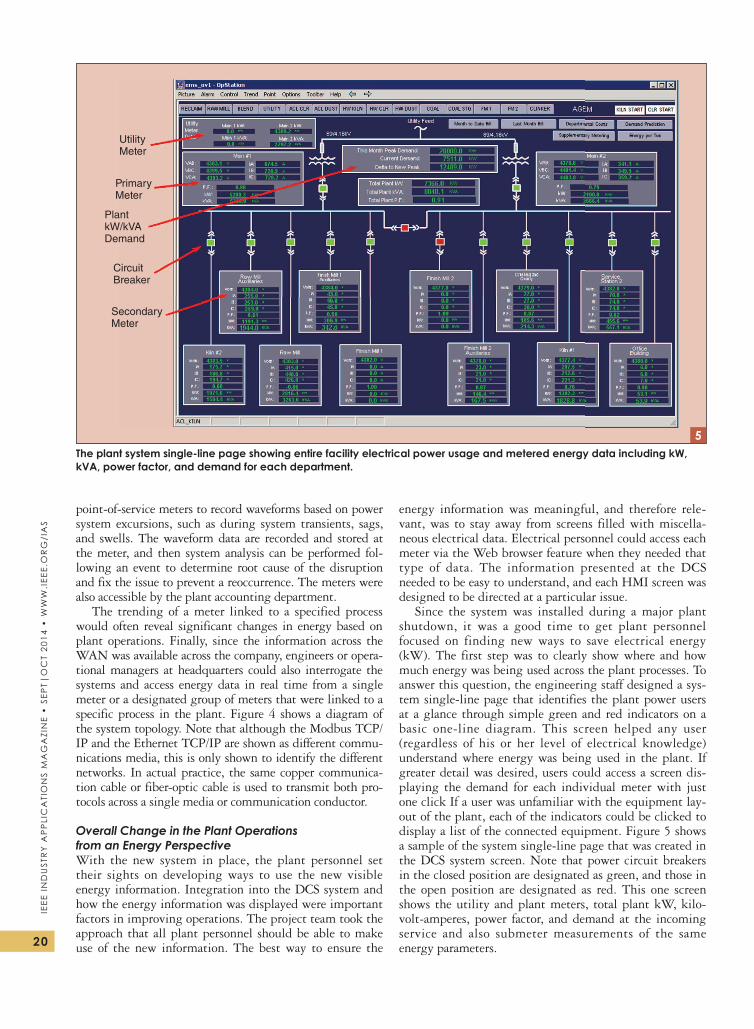
since the system was installed during a major plant shutdown, it was a good time to get plant personnel focused on finding new ways to save electrical energy (kW). the first step was to clearly show where and how much energy was being used across the plant processes. to answer this question, the engineering staff designed a sys-tem single-line page that identifies the plant power users at a glance through simple green and red indicators on a basic one-line diagram. this screen helped any user (regardless of his or her level of electrical knowledge) understand where energy was being used in the plant. if greater detail was desired, users could access a screen dis-playing the demand for each individual meter with just one click if a user was unfamiliar with the equipment lay-out of the plant, each of the indicators could be clicked to display a list of the connected equipment. Figure 5 shows a sample of the system single-line page that was created in the Dcs system screen. note that power circuit breakers in the closed position are designated as green, and those in the open position are designated as red. this one screen shows the utility and plant meters, total plant kW, kilo-volt-amperes, power factor, and demand at the incoming service and also submeter measurements of the same energy parameters.
UtilityMeter
PrimaryMeter
PlantkW/kVADemand
CircuitBreaker
SecondaryMeter
5The plant system single-line page showing entire facility electrical power usage and metered energy data including kW, kVA, power factor, and demand for each department.
21
IEEE Ind
ustr
y A
pp
lIcA
tIon
s MA
gA
zInE •
sEpt|
oc
t 2014 • w
ww
.IEEE.or
g/IA
s
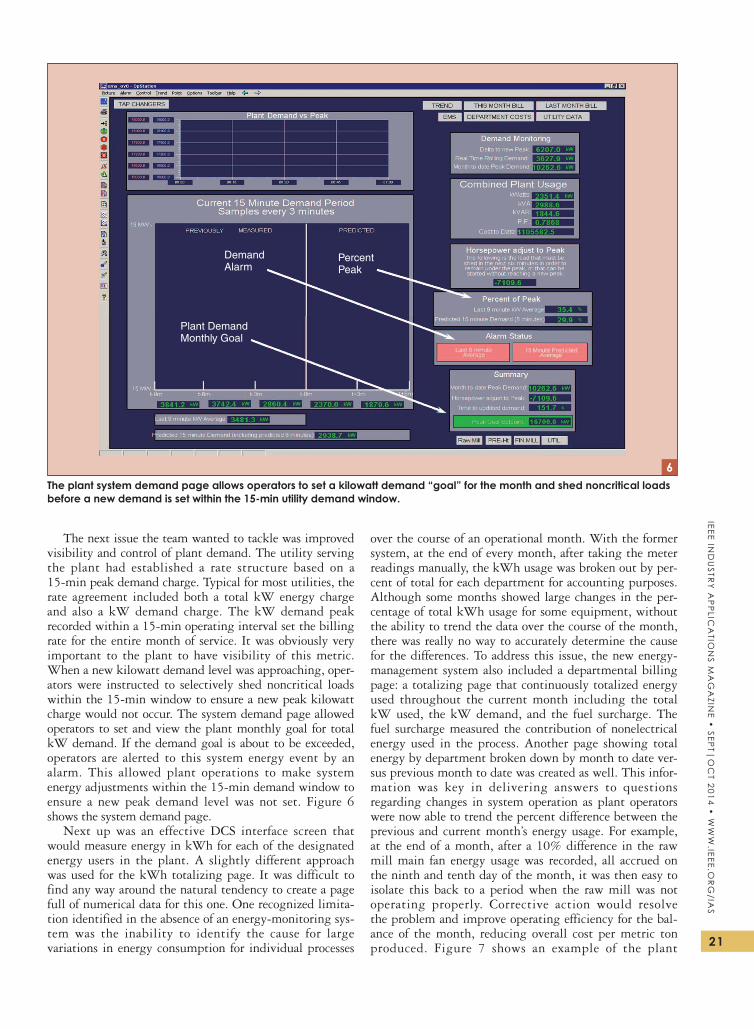
the next issue the team wanted to tackle was improved visibility and control of plant demand. the utility serving the plant had established a rate structure based on a 15-min peak demand charge. typical for most utilities, the rate agreement included both a total kW energy charge and also a kW demand charge. the kW demand peak recorded within a 15-min operating interval set the billing rate for the entire month of service. it was obviously very important to the plant to have visibility of this metric. When a new kilowatt demand level was approaching, oper-ators were instructed to selectively shed noncritical loads within the 15-min window to ensure a new peak kilowatt charge would not occur. the system demand page allowed operators to set and view the plant monthly goal for total kW demand. if the demand goal is about to be exceeded, operators are alerted to this system energy event by an alarm. this allowed plant operations to make system energy adjustments within the 15-min demand window to ensure a new peak demand level was not set. Figure 6 shows the system demand page.
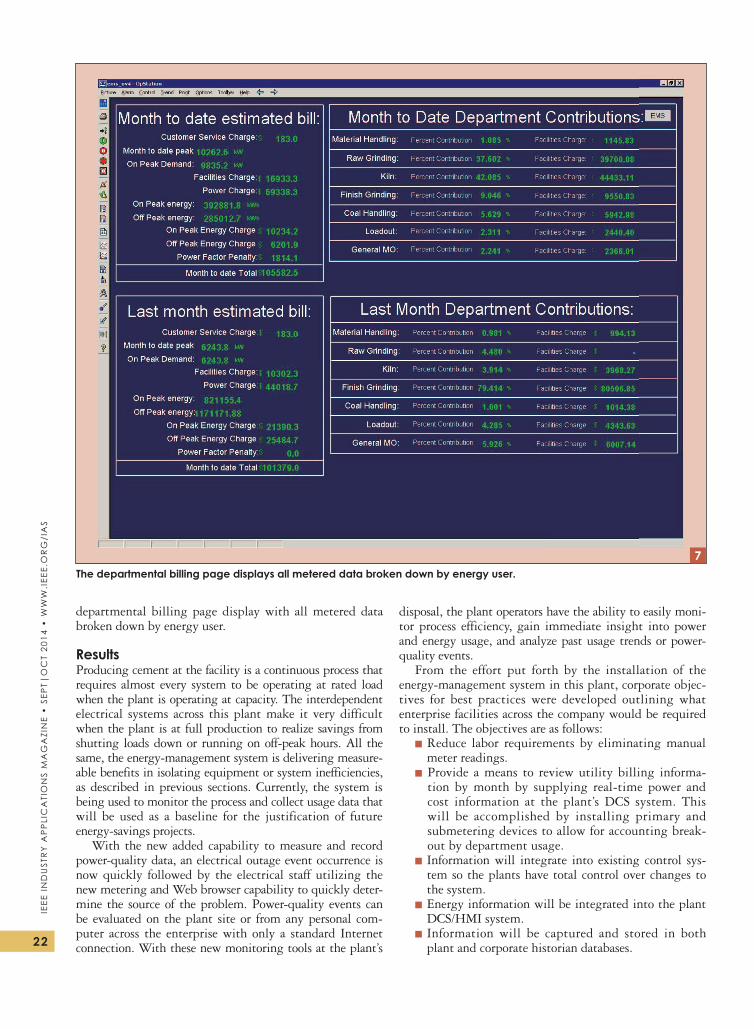
next up was an effective Dcs interface screen that would measure energy in kWh for each of the designated energy users in the plant. a slightly different approach was used for the kWh totalizing page. it was difficult to find any way around the natural tendency to create a page full of numerical data for this one. one recognized limita-tion identified in the absence of an energy-monitoring sys-tem was the inability to identify the cause for large variations in energy consumption for individual processes
over the course of an operational month. With the former system, at the end of every month, after taking the meter readings manually, the kWh usage was broken out by per-cent of total for each department for accounting purposes. although some months showed large changes in the per-centage of total kWh usage for some equipment, without the ability to trend the data over the course of the month, there was really no way to accurately determine the cause for the differences. to address this issue, the new energy-management system also included a departmental billing page: a totalizing page that continuously totalized energy used throughout the current month including the total kW used, the kW demand, and the fuel surcharge. the fuel surcharge measured the contribution of nonelectrical energy used in the process. another page showing total energy by department broken down by month to date ver-sus previous month to date was created as well. this infor-mation was key in delivering answers to questions regarding changes in system operation as plant operators were now able to trend the percent difference between the previous and current month’s energy usage. For example, at the end of a month, after a 10% difference in the raw mill main fan energy usage was recorded, all accrued on the ninth and tenth day of the month, it was then easy to isolate this back to a period when the raw mill was not operating properly. corrective action would resolve the problem and improve operating efficiency for the bal-ance of the month, reducing overall cost per metric ton produced. Figure 7 shows an example of the plant
DemandAlarm
PercentPeak
Plant DemandMonthly Goal
6The plant system demand page allows operators to set a kilowatt demand “goal” for the month and shed noncritical loads before a new demand is set within the 15-min utility demand window.
IEEE
In
du
str
y A
pp
lIc
AtI
on
s M
Ag
AzI
nE
• s
Ept|
oc
t 20
14 •
ww
w.I
EEE.
or
g/I
As
22
departmental billing page display with all metered data broken down by energy user.
Resultsproducing cement at the facility is a continuous process that requires almost every system to be operating at rated load when the plant is operating at capacity. the interdependent electrical systems across this plant make it very difficult when the plant is at full production to realize savings from shutting loads down or running on off-peak hours. all the same, the energy-management system is delivering measure-able benefits in isolating equipment or system inefficiencies, as described in previous sections. currently, the system is being used to monitor the process and collect usage data that will be used as a baseline for the justification of future energy-savings projects.
With the new added capability to measure and record power-quality data, an electrical outage event occurrence is now quickly followed by the electrical staff utilizing the new metering and Web browser capability to quickly deter-mine the source of the problem. power-quality events can be evaluated on the plant site or from any personal com-puter across the enterprise with only a standard internet connection. With these new monitoring tools at the plant’s
disposal, the plant operators have the ability to easily moni-tor process efficiency, gain immediate insight into power and energy usage, and analyze past usage trends or power-quality events.
From the effort put forth by the installation of the energy-management system in this plant, corporate objec-tives for best practices were developed outlining what enterprise facilities across the company would be required to install. the objectives are as follows:
▪ reduce labor requirements by eliminating manual meter readings.
▪ provide a means to review utility billing informa-tion by month by supplying real-time power and cost information at the plant’s Dcs system. this will be accomplished by installing primary and submetering devices to allow for accounting break-out by department usage.
▪ information will integrate into existing control sys-tem so the plants have total control over changes to the system.
▪ energy information will be integrated into the plant Dcs/Hmi system.
▪ information will be captured and stored in both plant and corporate historian databases.
The departmental billing page displays all metered data broken down by energy user.7
23
IEEE Ind
ustr
y A
pp
lIcA
tIon
s MA
gA
zInE •
sEpt|
oc
t 2014 • w
ww
.IEEE.or
g/IA
s
▪ all departments in the plants will use standardized beginning and ending points for department power comparisons on the corporate level.
▪ systems will be installed so that all power distribu-tion is visible by departments and operators will be able to control department efficiency; demand; on-peak, off-peak operations; and power factor as means to energy savings.
▪ accounting information will be provided as real-time values calculated from power usage and factors in billing for each individual facility.
it is the recommendation of the company to utilize third-party metering software as a separate source of evaluating electrical issues outside of operations. if installed correctly, as it was in the pilot plant, it will prove a useful tool. in this case, information was easily available through an open com-munications protocol and a simple Web server interface so any plant meters can be accessed from any company server. this has allowed for assistance in troubleshooting plant power issues from the corporate level.
Lessons LearnedFrom the perspective of the plant team, after the new sys-tem was installed and fully operational, one best practice in the company is to review the project and identify les-sons learned. the intent of this review is to help another plant of the company, should it make plans to install a similar system.
▪ the following happened according to plan: ■ the system did meet the plant’s energy manage-
ment goals. ■ the project was completed on time and also met
the budget. ■ the system delivers detailed electrical analysis
information for the plant electrical personnel. ■ the system was installed by the plant personnel,
which provided great value to the company by improving system knowledge, lowering installed cost, and increasing “ownership.”
▪ the following took longer than expected: ■ Utilizing plant personnel for installation resulted
in a longer project schedule. the availability of resources depended on the demand to perform their regular duties.
▪ things that the plant personnel would do differently include:
■ add greater network infrastructure—there is no such thing as too many communication cables!
■ even though the plant’s network was easily up to the task of handling the new equipment band-width, there was still a need for the small-scale expansion of network edge equipment. Having edge equipment that is not as capable as core net-work equipment can be an obstacle to future net-work needs.
Conclusionsin the north american mineral-processing industry, busi-ness leaders and plant operators must work together to
create an environment of continuous improvement for existing production assets, constantly focusing on effi-ciency. the case study presented in this article serves as a model, showing the valuable role an energy-management system played in creating an improved efficiency environ-ment via an engaged and talented workforce.
stepping back to look at the bigger picture, energy effi-ciency will become increasingly significant not only for short-term efficiency improvements but also for long-term cement plant viability. today, it is well understood that emerging environmental standards initiated by the U.s. epa are pushing toward further limitation of airborne emission of chemicals such as mercury. new regulations that were recently ratified require that all producing facili-ties conform to the new nesHap standards [3] or face fines and potential closure. Because of this, most commit-ted capital in the industry will be dedicated to the addition of containment systems such as improved bag houses as well as measurement systems to verify compliance. looking forward, the political climate in the United states could follow the path of regulated carbon emissions for indus-tries. new regulations here could have a significant impact on mineral-processing plants. For this process, 1 t of cement produced generally results in nearly 1 t of carbon emissions [4]. since these emissions can be linked to the energy required as a part of the process, improving the energy consumed per metric ton of product produced will also have a direct impact on reducing carbon emissions per metric ton produced. thus, the focus on energy efficiency at this mineral-processing plant will immediately have a positive impact by improving operating costs and, perhaps in the future, reducing the carbon footprint of the facility.
the payback period on investment for the four com-pany facilities that are currently online as of the end of 2011 is 2.5 years, calculated from the plant’s kwh/metric ton cost evaluation. From the time of installation to the end of 2011, the utility billing per kWh at these facilities has increased an average of 15%. With energy costs only increasing in the future, clearly the time to implement an effective energy management program is now!
References[1] portland cement association plant information summary, 2010.
[2] American National Standard for Electricity Meters—0.2 and 0.5 Accuracy
Classes, ansi standard c12.20–2010.[3] United states environmental protection agency. code of federal regu-
lations. cFr part 61 and part 63. [online]. available: http://www.epa.gov/compliance/monitoring/programs/caa/neshaps.html
[4] D. Biello. (2008, aug. 7). cement from co2: a concrete cure for glob-al warming? Sci. Amer. [online]. available: http://www.scientificameri-can.com/article.cfm?id=cement-from-carbon-dioxide
Hurchel R. Young is with Exotic Metals Forming Company in Kent, Washington. Bruce Newell is with Ash Grove Cement in Overland Park, Kansas. David B. Durocher ([email protected]) is with Eaton Corporation in Wilsonville, Oregon. Young is a Member of the IEEE. Durocher is a Senior Member of the IEEE. This article first appeared as “Successful Integration of a Facility Wide Energy Management System in a Cement Plant” at the 2012 IEEE IAS/PCA Cement Industry Conference.