energy investment
TRANSCRIPT

UVCA energy committee Roman Zinchenko / greencubator

Major shifts in energy sector


50% new energy capacities - renewables

33% renewables in German electrical grid

Agora Energiewende | Understanding the Energiewende
38
Germany and the European Union as a whole need to fix their carbon policy, to reverse the coal resurrection wit-nessed recently all over Europe. The German government is pushing for structural reform of the EU emissions trading scheme, together with stronger energy efficiency measures. In parallel to its European engagement,49 the German gov-ernment in July 2015 adopted additional national policies and measures. In a new law that is expected to be decided
49 The modification of the EU emissions trading scheme is a complex process, as it involve all European Member states and institutions.
by parliament in late 2015, 2.7 gigawatts of inefficient old lignite power plants are to be taken off the market by 2020. Once off the market, they would remain for four years in a so-called “climate reserve.” Plants in this reserve would only be called upon to produce if there is the danger of a severe power outage. After four years, the plants will be shut down completely. In order to reach the 2030 targets and beyond, a consensus on the gradual reduction of coal in the German power mix needs to be established, together with power producers, unions, government, and environmental NGOs.
Recent developments in gross electricity generation in Germany, 1990 - 2014 and scenario until 2030 to reach the government’s targets Figure 21
AGEB (2015)
2000 2005 2010 2020 20252014 2030
700
600
500
400
300
200
100
0
[TW
h]
38
170
148
143
4973
134
154
163
63
89
117
146
141
105
60
118
156
97
161
54
6245
44147
119
63
282254
4732
113
314
LigniteNuclear Hard Coal Natural Gas OthersRenewables

⅔China, India, Brasil
new renewables capacity
25%of Chinese generation will be renewables by 2030


$ 3,2divestment from fossil assets
trillion

<< Contents
| 04
Source: Clean Energy Pipeline
Venture Capital and Private EquityEuropean Venture Capital and Private Equity investment: Q2.13 to Q2.15 ($ million)
Q2.14Q1.14Q4.13Q3.13Q2.13
Dea
l val
ue (
$ m
illion
)
Num
ber of deals
Q3.14 Q1.15Q4.14 Q2.150
5
10
15
20
25
30
35
40
45
50
0
100
200
300
400
500
600
700
800 n Private equity (Development capital)
n Venture capital - Late stage (Series D+)
n Venture capital - Early growth (Series A to C)
— Number of deals
Average quarterly VC/PE investment Q2.13 to Q2.15 ($ million)
Venture Capital (early-stage) 150.7
Venture Capital (late-stage) 67.6
Private Equity (development capital) 158.4
Average deal size Q2.13 to Q2.15 ($ million)
Venture Capital (early-stage) 5.2
Venture Capital (late-stage) 34.7
Private Equity (development capital) 50.3

<< Contents
| 09
Source: Clean Energy Pipeline
Mergers and AcquisitionsEuropean M&A activity: Q2.13 to Q2.15
Q2.14Q1.14Q4.13Q3.13Q2.13
Dea
l val
ue (
$ bi
llion) N
umber of deals
Q3.14 Q1.15Q4.14 Q2.150
20
40
60
80
100
120
140
160
180
0.0
2.0
4.0
6.0
8.0
10.0
12.0
n Deals of over $500 million
n Deals of under $500 million
— Number of deals
Clean Energy Pipeline calculates M&A activity based on announced transactions within each quarter.
Average M&A investment: Q2.13 to Q2.15
Average quarterly M&A deal volume ($ billion) 6.3
Average number of deals per quarter 130
Average M&A transaction value ($ million) 48.5

<< Contents
| 08
Source: Clean Energy Pipeline
Venture Capital and Private EquityEuropean Venture Capital investment by sector
European Venture Capital investment by country
0 50 100 150 250
France
Switzerland
UK
Germany
Deal value ($ million)
200
0
Advanced Materials & Technologies
Biofuels
Green Transportation
Solar
Deal value ($ million)
50 100 150 200 250 300
Energy Efficiency
n Q2.15
n Q1.15
n Q2.14
n Q2.15
n Q1.15
n Q2.14

Best financial investors2015
2014
2013
2012
2011

Best corporate investors2015
2014
2013
2012
2011


Market cap of some US-based success stories


Web 1.0 > Web 2.0 > Internet of Everything

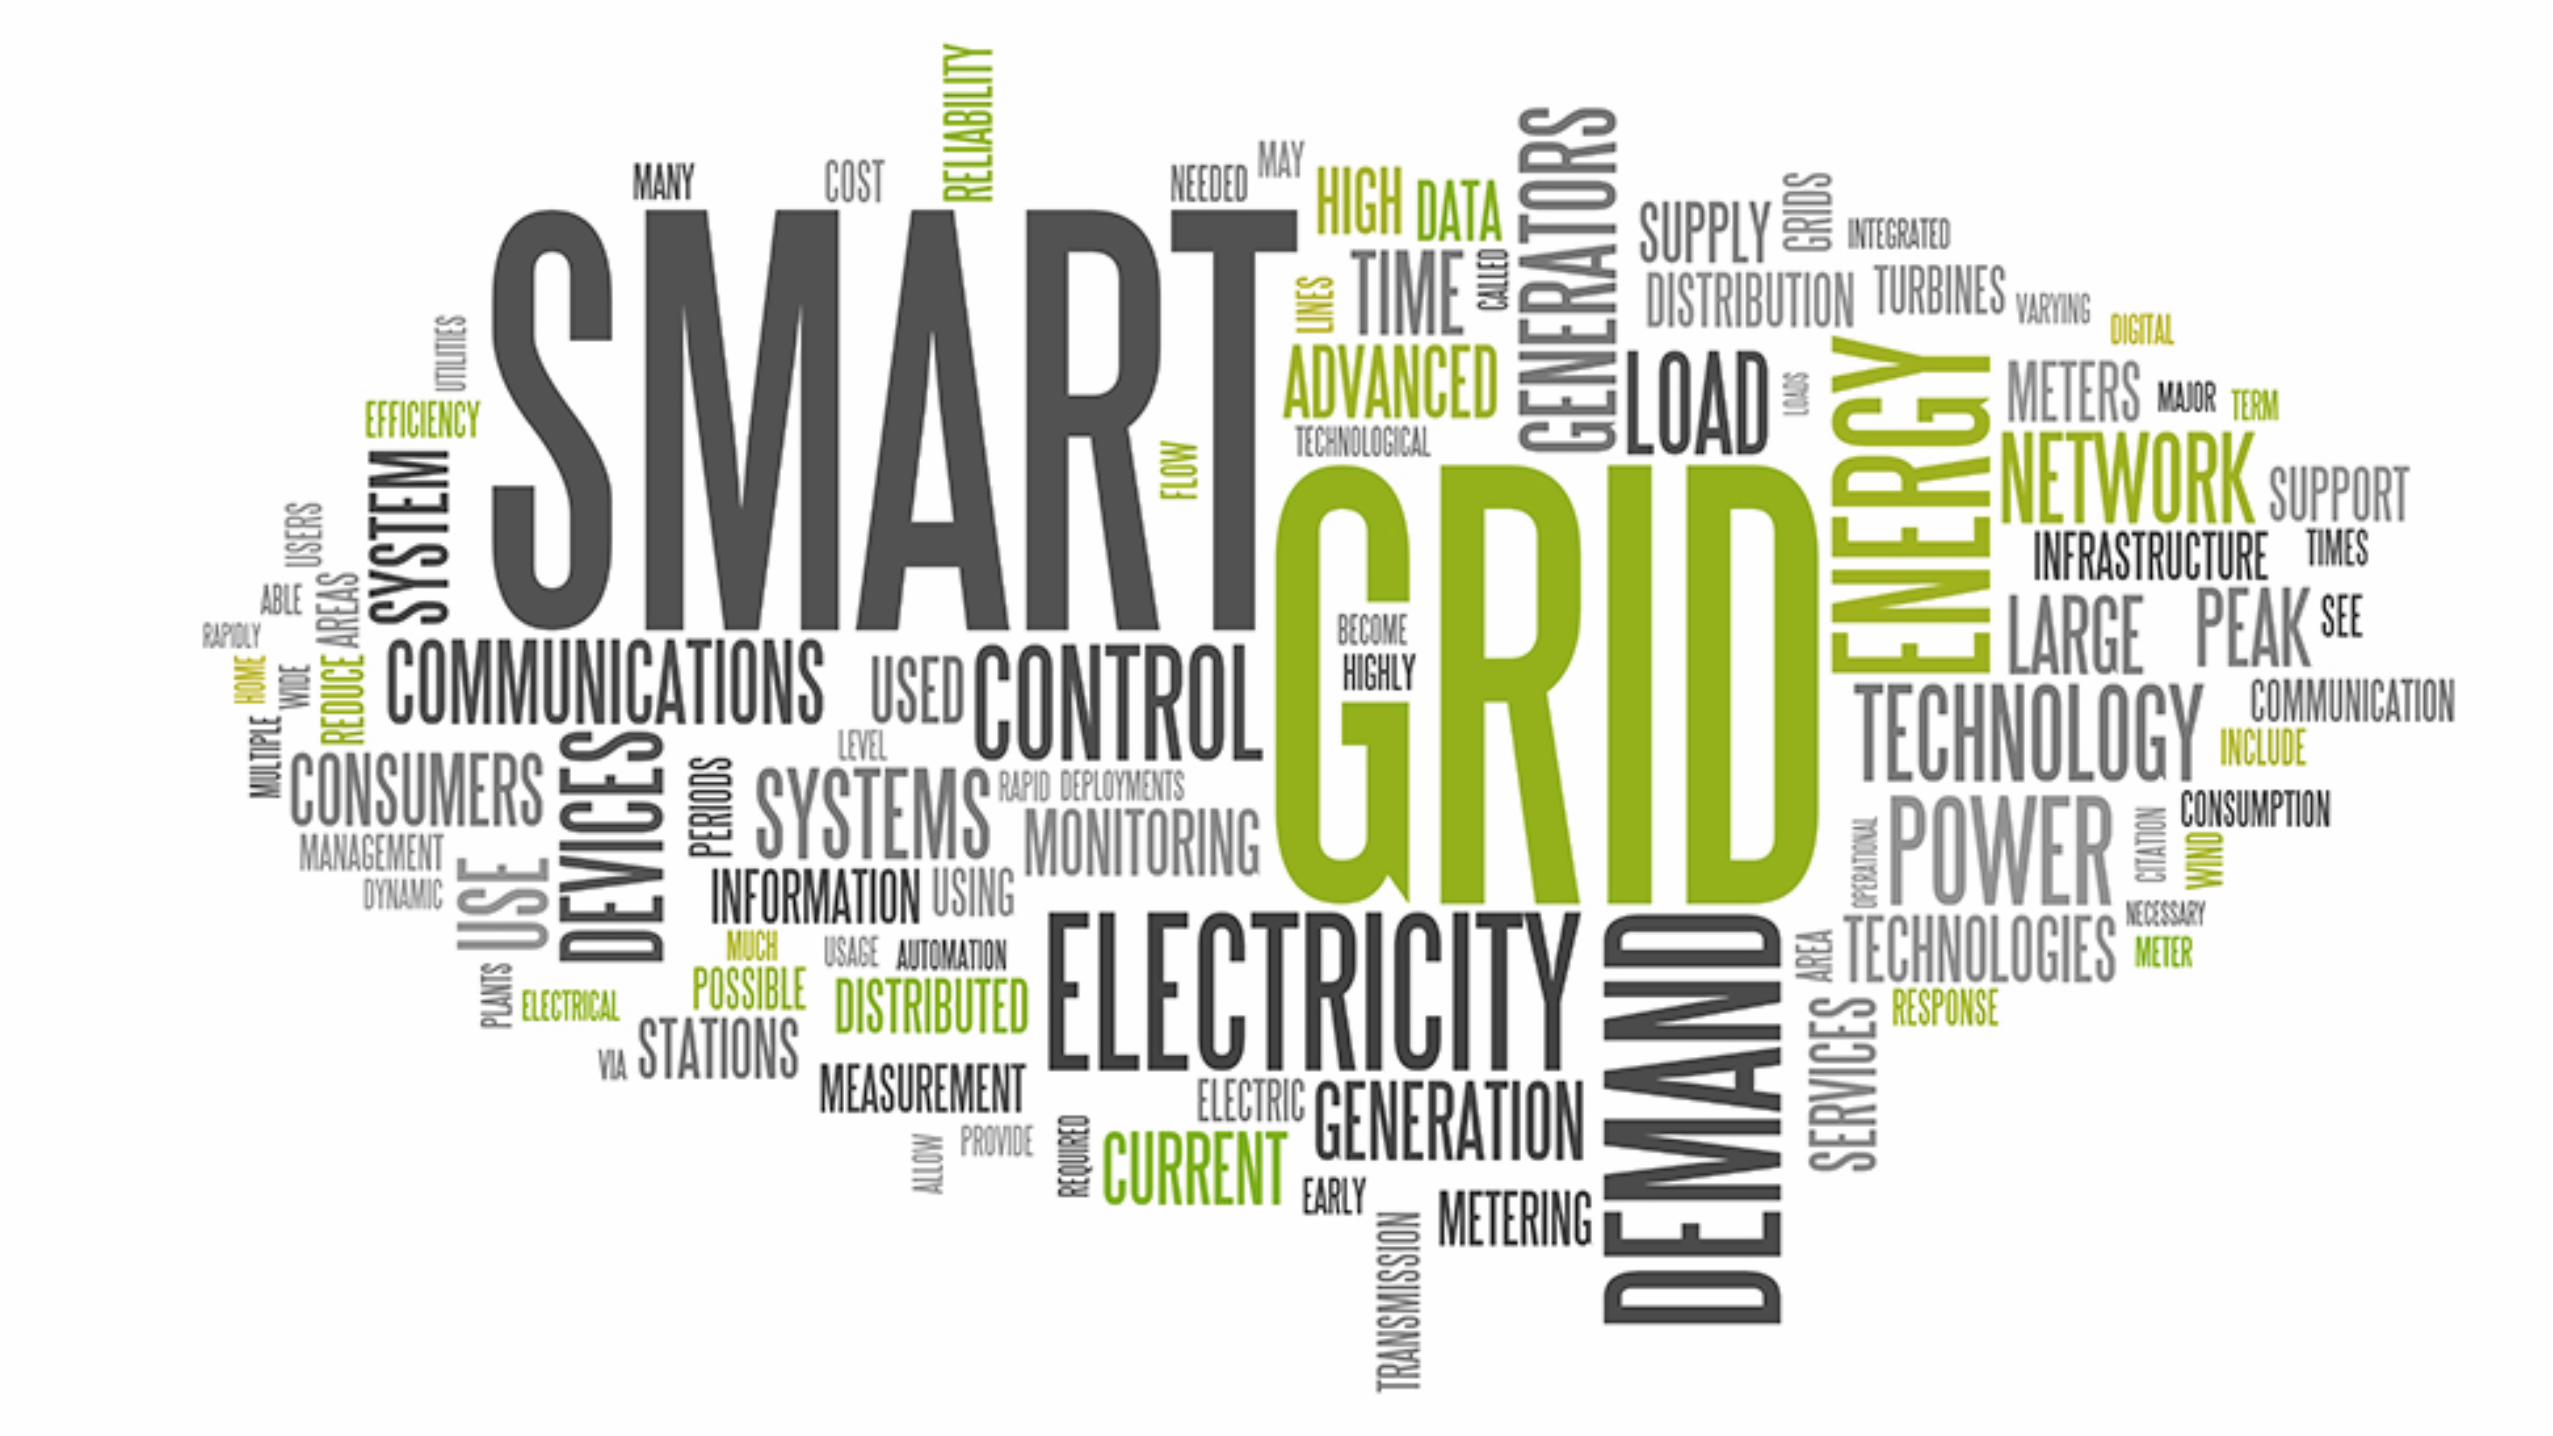
Enter Smart Grid…


Utilities hate it, but still invest

Program your power plant!


Nest is not a device

Nest is interface sensor
algorithm cloud API …

What is Google?

Nest is Data

3 500 000 000 $Google paid for Nest


