energy innovations small grant program: …€¦ · energy innovations small grant program, ... 2.5...
TRANSCRIPT
E n e r g y R e s e a r c h a n d D e v e l o p m e n t D i v i s i o n F I N A L P R O J E C T R E P O R T
ENERGY INNOVATIONS SMALL GRANT PROGRAM: 2013 INDEPENDENT ASSESSMENT REPORTS
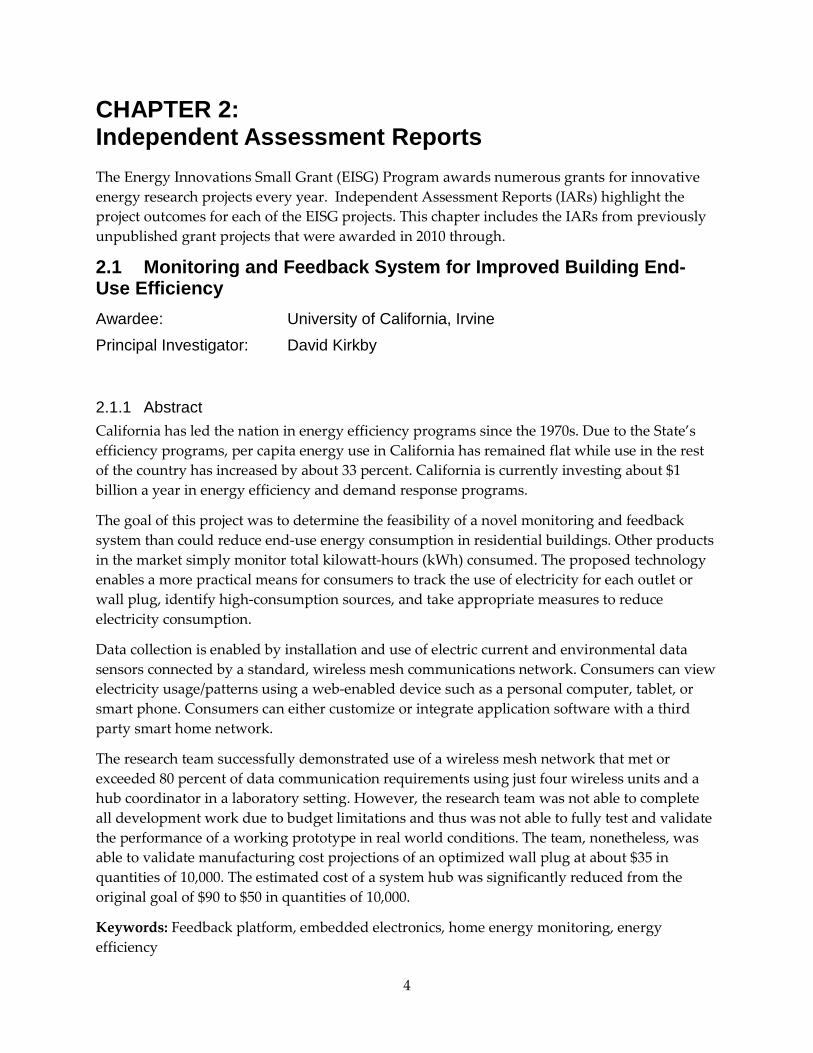
OCTOBE R 2015 CE C-500-2015-083
Prepared for: California Energy Commission Prepared by: San Diego State University Research Foundation

Prepared by: Primary Author: Rob Queen, Program Administrator San Diego State Research Foundation 5250 Campanile Drive, San Diego, CA 92182-1858 (619) 594-1900 Contract Number: 500-98-014 Prepared for: California Energy Commission James Lee Program Manager Erik Stokes Manager Energy Development & Market Facilitation Office Laurie ten Hope Deputy Director RESEARCH AND DEVELOPMENT DIVISION Robert P. Oglesby Executive Director
DISCLAIMER This report was prepared as the result of work sponsored by the California Energy Commission. It does not necessarily represent the views of the Energy Commission, its employees or the State of California. The Energy Commission, the State of California, its employees, contractors and subcontractors make no warrant, express or implied, and assume no legal liability for the information in this report; nor does any party represent that the uses of this information will not infringe upon privately owned rights. This report has not been approved or disapproved by the California Energy Commission nor has the California Energy Commission passed upon the accuracy or adequacy of the information in this report.

PREFACE
The California Energy Commission Energy Research and Development Division supports public interest energy research and development that will help improve the quality of life in California by bringing environmentally safe, affordable, and reliable energy services and products to the marketplace.
The Energy Research and Development Division conducts public interest research, development, and demonstration (RD&D) projects to benefit California.
The Energy Research and Development Division strives to conduct the most promising public interest energy research by partnering with RD&D entities, including individuals, businesses, utilities, and public or private research institutions.
Energy Research and Development Division funding efforts are focused on the following RD&D program areas:
• Buildings End-Use Energy Efficiency
• Energy Innovations Small Grants
• Energy-Related Environmental Research
• Energy Systems Integration
• Environmentally Preferred Advanced Generation
• Industrial/Agricultural/Water End-Use Energy Efficiency
• Renewable Energy Technologies
• Transportation
Energy Innovations Small Grant Program: 2013 Independent Assessment Reports is the interim report for the Energy Innovations Small Grant Program (contract number 500-98-014) conducted by San Diego State University Research Foundation. The information from this project contributes to all of the Energy Research and Development Division’s Programs.
When the source of a table, figure or photo is not otherwise credited, it is the work of the author of the report.
For more information about the Energy Research and Development Division, please visit the Energy Commission’s website at www.energy.ca.gov/research/ or contact the Energy Commission at 916-327-1551.
i

ABSTRACT
The California Energy Commission has directly benefited California ratepayers since 1997 through the efforts of the Public Interest Energy Research Program, which accepts competitive solicitations seeking to advance scientific findings and technology. In addition, the Energy Commission has funded and managed the Energy Innovations Small Grant Program since 1998; this program seeks to further research for innovative energy concepts and technologies that are not yet able to meet traditional research and development funding requirements.
Unlike the Public Interest Energy Program, which only supports general solicitations that focus on the development of previously established concepts, the Energy Innovations Small Grant Program provides funding for new energy technology concepts that are still in the early stages of development. Qualifying Energy Innovations Small Grant projects address one of the seven defined research areas within the Public Interest Energy Program Research, Development, and Demonstration Division. If an innovative energy concept is proven feasible according to the Energy Innovations Small Grant Program, traditional research and development funding may become available to further develop the project.
Independent assessment reports are written on completion of every Energy Innovations Small Grant project. These reports outline the objectives of each project, discuss the successes and failures, and offer recommendations for future work. This report presents a collection of 26 previously unpublished independent assessment reports for Energy Innovations Small Grant projects, awarded in 2010 through 2013.
Keywords: Ratepayer, California Energy Commission, Energy Innovations Small Grant, EISG, Independent Assessment Report, IAR, Public Interest Energy Research, PIER RD&D, electricity, natural gas, transportation, research, energy technology concepts, project, market, outcomes, conclusions, benefits
Please use the following citation for this report:
Queen, Robert. San Diego State University Research Foundation. 2013. Energy Innovations Small Grant Program: 2013 Independent Assessment Reports. California Energy Commission. Publication number: CEC-500-2015-083
ii
TABLE OF CONTENTS
PREFACE ..................................................................................................................................................... i
ABSTRACT ............................................................................................................................................... ii
TABLE OF CONTENTS ......................................................................................................................... iii
LIST OF FIGURES ................................................................................................................................... xi
LIST OF TABLES ................................................................................................................................... xii
EXECUTIVE SUMMARY ........................................................................................................................ 1
CHAPTER 1: Introduction ....................................................................................................................... 2
CHAPTER 2: Independent Assessment Reports ................................................................................. 4
2.1 Monitoring and Feedback System for Improved Building End-Use Efficiency ................ 4
2.1.1 Abstract ................................................................................................................................ 4
2.1.2 Introduction ........................................................................................................................ 5
2.1.3 Objectives ............................................................................................................................ 7
2.1.4 Outcomes ............................................................................................................................. 8
2.1.5 Conclusions ......................................................................................................................... 8
2.1.6 Recommendations .............................................................................................................. 8
2.1.7 Benefits to California ......................................................................................................... 9
2.1.8 Technology Transition Assessment ............................................................................... 10
2.2 Low Cost MEMS Biogas Fuel Quality Meter for Power Generation ................................ 11
2.2.1 Abstract .............................................................................................................................. 11
2.2.2 Introduction ...................................................................................................................... 12
2.2.3 Objectives .......................................................................................................................... 16
2.2.4 Outcomes ........................................................................................................................... 17
2.2.5 Conclusions ....................................................................................................................... 17
2.2.6 Recommendations ............................................................................................................ 18
2.2.7 Benefits to California ....................................................................................................... 18
2.2.8 Technology Transition Assessment ............................................................................... 19
2.3 Spindrift Energy Device proof of Concept ........................................................................... 21
iii
2.3.1 Abstract .............................................................................................................................. 21
2.3.2 Introduction ...................................................................................................................... 22
2.3.3 Objectives .......................................................................................................................... 24
2.3.4 Outcomes ........................................................................................................................... 24
2.3.5 Conclusions ....................................................................................................................... 24
2.3.6 Recommendations ............................................................................................................ 25
2.3.7 Benefits to California ....................................................................................................... 25
2.3.8 Technology Transition Assessment ............................................................................... 25
2.4 Fast Demand Response and Energy Efficiency Using Duct Pressure Optimization ...... 27
2.4.1 Abstract .............................................................................................................................. 27
2.4.2 Introduction ...................................................................................................................... 29
2.4.3 Objectives .......................................................................................................................... 31
2.4.4 Outcomes ........................................................................................................................... 31
2.4.5 Conclusions ....................................................................................................................... 32
2.4.6 Recommendations ............................................................................................................ 33
2.4.7 Benefits to California ....................................................................................................... 34
2.4.8 Technology Transition Assessment ............................................................................... 35
2.5 Cooling Tower Fouling Prevention Through Surface Modification of Fill Media ......... 36
2.5.1 Abstract .............................................................................................................................. 36
2.5.2 Introduction ...................................................................................................................... 37
2.5.3 Objectives .......................................................................................................................... 37
2.5.4 Outcomes ........................................................................................................................... 38
2.5.5 Conclusions ....................................................................................................................... 40
2.5.6 Recommendations ............................................................................................................ 41
2.5.7 Benefits to California ....................................................................................................... 41
2.5.8 Technology Transition Assessment ............................................................................... 42
2.6 HVAC Management System with Dynamic Energy and Demand Optimization .......... 43
2.6.1 Abstract .............................................................................................................................. 43
iv
2.6.2 Introduction ...................................................................................................................... 44
2.6.3 Objectives .......................................................................................................................... 45
2.6.4 Outcomes ........................................................................................................................... 46
2.6.5 Conclusions ....................................................................................................................... 47
2.6.6 Recommendations ............................................................................................................ 48
2.6.7 Benefits to California ....................................................................................................... 48
2.6.8 Technology Transition Assessment ............................................................................... 49
2.7 Crystallization of Electrodeposited CIS Thin Films on Flexible Foil ................................ 50
2.7.1 Abstract .............................................................................................................................. 50
2.7.2 Introduction ...................................................................................................................... 51
2.7.3 Objectives .......................................................................................................................... 51
2.7.4 Outcomes ........................................................................................................................... 52
2.7.5 Conclusions ....................................................................................................................... 53
2.7.6 Recommendations ............................................................................................................ 54
2.7.7 Benefits to California ....................................................................................................... 54
2.7.8 Technology Transition Assessment ............................................................................... 55
2.8 Optimum Design of Secondary Optical Element for Concentrating Photovoltaics ....... 56
2.8.1 Abstract .............................................................................................................................. 56
2.8.2 Introduction ...................................................................................................................... 57
2.8.3 Objectives .......................................................................................................................... 57
2.8.4 Outcomes ........................................................................................................................... 58
2.8.5 Conclusions ....................................................................................................................... 60
2.8.6 Recommendations ............................................................................................................ 60
2.8.7 Benefits to California ....................................................................................................... 61
2.8.8 Technology Transition Assessment ............................................................................... 61
2.9 Enhanced Light Extraction Of LEDs Through Ultra-Fast Laser Nano-Fabrication ........ 63
2.9.1 Abstract .............................................................................................................................. 63
2.9.2 Introduction ...................................................................................................................... 64
v
2.9.3 Objectives .......................................................................................................................... 65
2.9.4 Outcomes ........................................................................................................................... 65
2.9.5 Conclusions ....................................................................................................................... 66
2.9.6 Recommendations ............................................................................................................ 66
2.9.7 Benefits to California ....................................................................................................... 67
2.9.8 Technology Transition Assessment ............................................................................... 68
2.10 Model Predictive Smart Lighting Commissioning System for Emerging Demand Management ......................................................................................................................................... 69
2.10.1 Abstract .............................................................................................................................. 69
2.10.2 Introduction ...................................................................................................................... 70
2.10.3 Objectives .......................................................................................................................... 71
2.10.4 Outcomes ........................................................................................................................... 72
2.10.5 Conclusions ....................................................................................................................... 73
2.10.6 Recommendations ............................................................................................................ 74
2.10.7 Benefits to California ....................................................................................................... 74
2.10.8 Technology Transition Assessment ............................................................................... 75
2.11 New Electromagnetic Method to Map Geothermal Resources ......................................... 76
2.11.1 Abstract .............................................................................................................................. 76
2.11.2 Introduction ...................................................................................................................... 77
2.11.3 Objectives .......................................................................................................................... 78
2.11.4 Outcomes ........................................................................................................................... 79
2.11.5 Conclusions ....................................................................................................................... 79
2.11.6 Recommendations ............................................................................................................ 80
2.11.7 Benefits to California ....................................................................................................... 81
2.11.8 Technology Transition Assessment ............................................................................... 81
2.12 Silicon Nanowire Solar Cells on Low Cost Substrates ........................................................ 83
2.12.1 Abstract .............................................................................................................................. 83
2.12.2 Introduction ...................................................................................................................... 84
2.12.3 Objectives .......................................................................................................................... 84
vi
2.12.4 Outcomes ........................................................................................................................... 85
2.12.5 Conclusions ....................................................................................................................... 85
2.12.6 Recommendations ............................................................................................................ 86
2.12.7 Benefits to California ....................................................................................................... 87
2.12.8 Technology Transition Assessment ............................................................................... 87
2.13 Measurement of Critical Energy/Mass Balances for Stand-Alone Torrefaction ............. 89
2.13.1 Abstract .............................................................................................................................. 89
2.13.2 Introduction ...................................................................................................................... 90
2.13.3 Objectives .......................................................................................................................... 90
2.13.4 Outcomes ........................................................................................................................... 91
2.13.5 Conclusions ....................................................................................................................... 92
2.13.6 Recommendations ............................................................................................................ 92
2.13.7 Benefits to California ....................................................................................................... 93
2.13.8 Technology Transition Assessment ............................................................................... 94
2.14 Improving Solar Energy Conversion by Incorporating Broadband Absorption Upconversion Materials ...................................................................................................................... 95
2.14.1 Abstract .............................................................................................................................. 95
2.14.2 Introduction ...................................................................................................................... 96
2.14.3 Objectives .......................................................................................................................... 98
2.14.4 Outcomes ........................................................................................................................... 99
2.14.5 Conclusions ..................................................................................................................... 100
2.14.6 Recommendations .......................................................................................................... 100
2.14.7 Benefits to California ..................................................................................................... 101
2.14.8 Technology Transition Assessment ............................................................................. 101
2.15 Adaptive Fan Demand Control for Low-Energy Consumption Cleanrooms ............... 103
2.15.1 Abstract ............................................................................................................................ 103
2.15.2 Introduction .................................................................................................................... 104
2.15.3 Objectives ........................................................................................................................ 104
2.15.4 Outcomes ......................................................................................................................... 104
vii
2.15.5 Conclusions ..................................................................................................................... 106
2.15.6 Recommendations .......................................................................................................... 107
2.15.7 Benefits to California ..................................................................................................... 107
2.15.8 Technology Transition Assessment ............................................................................. 108
2.16 Quantum Protection System for Secure Grid Automation Communications ............... 110
2.16.1 Abstract ............................................................................................................................ 110
2.16.2 Introduction .................................................................................................................... 111
2.16.3 Objectives ........................................................................................................................ 113
2.16.4 Outcomes ......................................................................................................................... 114
2.16.5 Conclusions ..................................................................................................................... 115
2.16.6 Recommendations .......................................................................................................... 115
2.17.7 Benefits to California ..................................................................................................... 115
2.16.8 Technology Transition Assessment ............................................................................. 116
2.17 Low Band Gap Antimony-Based Thermophotovoltaics Grown on Gallium Arsenide Substrates ............................................................................................................................................ 118
2.17.1 Abstract ............................................................................................................................ 118
2.17.2 Introduction .................................................................................................................... 119
2.17.3 Objectives ........................................................................................................................ 120
2.17.4 Outcomes ......................................................................................................................... 120
2.17.5 Conclusions ..................................................................................................................... 120
2.17.6 Recommendations .......................................................................................................... 121
2.17.7 Benefits to California ..................................................................................................... 121
2.17.8 Technology Transition Assessment ............................................................................. 121
2.18 An Ultra-Compact Fiber-Optic Seismic Sensor for Geothermal Applications .............. 123
2.18.1 Abstract ............................................................................................................................ 123
2.18.2 Introduction .................................................................................................................... 124
2.18.3 Objectives ........................................................................................................................ 125
2.18.4 Outcomes ......................................................................................................................... 125
2.18.5 Conclusions ..................................................................................................................... 126
viii
2.18.6 Recommendations .......................................................................................................... 127
2.18.7 Benefits to California ..................................................................................................... 128
2.18.8 Technology Transition Assessment ............................................................................. 128
2.19 Liquid Metal Thermal Energy Storage ................................................................................ 130
2.19.1 Abstract ............................................................................................................................ 130
2.19.2 Introduction .................................................................................................................... 131
2.19.3 Objectives ........................................................................................................................ 132
2.19.4 Outcomes ......................................................................................................................... 133
2.19.5 Conclusions ..................................................................................................................... 134
2.19.6 Recommendations .......................................................................................................... 134
2.19.7 Benefits to California ..................................................................................................... 135
2.19.8 Technology Transition Assessment ............................................................................. 136
2.20 Concentrated Solar Power on Demand Proof of Concept ................................................ 137
2.20.1 Abstract ............................................................................................................................ 137
2.20.2 Introduction .................................................................................................................... 138
2.20.3 Objectives ........................................................................................................................ 139
2.20.4 Outcomes ......................................................................................................................... 139
2.20.5 Conclusions ..................................................................................................................... 141
2.20.6 Recommendations .......................................................................................................... 141
2.20.7 Benefits to California ..................................................................................................... 142
2.20.8 Technology Transition Assessment ............................................................................. 143
2.21 CPV Receiver for Parabolic Troughs ................................................................................... 144
2.21.1 Abstract ............................................................................................................................ 144
2.21.2 Introduction .................................................................................................................... 145
2.21.3 Objectives ........................................................................................................................ 145
2.21.4 Outcomes ......................................................................................................................... 146
2.21.5 Conclusions ..................................................................................................................... 147
2.21.6 Recommendations .......................................................................................................... 147
ix

2.21.7 Benefits to California ..................................................................................................... 148
2.21.8 Technology Transition Assessment ............................................................................. 148
2.22 Unified Power Control for Set-Top Devices ....................................................................... 149
2.22.1 Abstract ............................................................................................................................ 149
2.22.2 Introduction .................................................................................................................... 150
2.22.3 Objectives ........................................................................................................................ 150
2.22.4 Outcomes ......................................................................................................................... 151
2.22.5 Conclusions ..................................................................................................................... 151
2.22.6 Recommendations .......................................................................................................... 152
2.22.7 Benefits to California ..................................................................................................... 152
2.22.8 Technology Transition Assessment ............................................................................. 153
2.23TE Cost-Effective Thermal Management Design for Electric Vehicle Batteries .............. 154
2.23.1TE Abstract ........................................................................................................................ 154
2.23.2TE Introduction ................................................................................................................ 155
2.23.3TE Objectives .................................................................................................................... 156
2.23.4TE Outcomes ..................................................................................................................... 156
2.23.5TE Conclusions ................................................................................................................. 157
2.23.6TE Recommendations ...................................................................................................... 157
2.23.7TE Benefits to California ................................................................................................. 158
2.23.8TE Technology Transition Assessment ......................................................................... 158
2.24TE Intelligent Energy Management for Solar Powered EV Charging Stations ............... 160
2.24.1TE Abstract ........................................................................................................................ 160
2.24.2TE Introduction ................................................................................................................ 161
2.24.3TE Objectives .................................................................................................................... 162
2.24.4TE Outcomes ..................................................................................................................... 163
2.24.5TE Conclusions ................................................................................................................. 163
2.24.6TE Recommendations ...................................................................................................... 164
2.24.7TE Benefits to California ................................................................................................. 164
x

2.24.8TE Technology Transition Assessment ......................................................................... 165
2.25TE Dual Chemistry Battery System ....................................................................................... 167
2.25.1TE Abstract ........................................................................................................................ 167
2.25.2TE Introduction ................................................................................................................ 168
2.25.3TE Objectives .................................................................................................................... 169
2.25.4TE Outcomes ..................................................................................................................... 170
2.25.5TE Conclusions ................................................................................................................. 172
2.25.6TE Recommendations ...................................................................................................... 174
2.25.7TE Benefits to California ................................................................................................. 174
2.25.8TE Technology Transition Assessment ......................................................................... 174
2.26TE PEV-Based Active and Reactive Power Compensation in Distribution Networks: Design Optimization and Technology Demonstration Project ................................................... 176
2.26.1TE Abstract ........................................................................................................................ 176
2.26.2TE Introduction ................................................................................................................ 177
2.26.3TE Objectives .................................................................................................................... 179
2.26.4TE Outcomes ..................................................................................................................... 180
2.26.5TE Conclusions ................................................................................................................. 180
2.26.6TE Recommendations ...................................................................................................... 181
2.26.7TE Benefits to California ................................................................................................. 181
2.26.8TE Technology Transition Assessment ......................................................................... 182
LIST OF FIGURES
Figure 1: Block Diagram for Stages of Leaf End-Device ....................................................................... 6
Figure 2: Raspberry Pi Basic Board Layout ............................................................................................ 6
Figure 3: Fuel Quality Meter Coupled to a Mass Flow Meter via Compact Control Electronics Provide a Low Cost System Suitable for Incorporation into Engine Control Systems .................. 13
Figure 4: Final Design Concept MEMS-Based Fuel Quality Meter with Remote Sensing Head and Display ............................................................................................................................................... 15
Figure 5: Pre-Commercial Working Prototype Fuel Quality Meter/Smart Btu Sensor Assembly 16
Figure 6: Spindrift Energy Device ......................................................................................................... 23
xi
Figure 7: High Level System Architecture Diagram ........................................................................... 30
Figure 8: Effect of Advanced Coating of Cooling Tower Fill Media and Heat Exchanger Surfaces on Performance ........................................................................................................................................ 37
Figure 9: iGrid Single Line Diagram ..................................................................................................... 45
Figure 10: iGrid Prototype Hardware Architecture ............................................................................ 46
Figure 11: Overall Process for Laser Annealing CIS PV Films .......................................................... 51
Figure 12: Trumpet Shaped SOE Device ............................................................................................... 57
Figure 13: System Architecture Showing Hardware and Software Components .......................... 71
Figure 14: Life Cycle Assessment Boundary Conditions .................................................................. 73
Figure 15: Dr. Hibbs Holding the Well Casing During Regular Operation of the DSEM Source 78
Figure 16: Comparison of Reflectance of Base and Textured Cells ................................................... 84
Figure 17: A Simplified Process Flow Diagram for the Biomass Torrefier System ........................ 90
Figure 18: Schematic Diagram of the Anticipated Integration of the Nanocomposite Materials into Solar Devices ..................................................................................................................................... 98
Figure 19: Relative Fan Speed and Particle Concentration for One Case ...................................... 106
Figure 20: Graphical Description of System and Components ....................................................... 113
Figure 21: TEM Scan of Interface Between GaAs and GaSb ............................................................ 119
Figure 22: Machined 1-Inch Diameter Seismic Sensor Pod .............................................................. 124
Figure 23: CSPonD Solar Energy Receivers ........................................................................................ 138
Figure 24: Block Diagram of the EV Charging System ..................................................................... 162
Figure 25: The EDI Dynamometer Installation Showing the 75kW Electric Induction Motor Used for Testing of All Pack Configurations ............................................................................................... 169
Figure 26: PEV-Based Active and Reactive Power Compensation (a) A PEV Battery Pack and Charger Inverter (b) Simple Charging and Simple Discharging Versus P-Q Control ................. 178
Figure 27: Overall Prototype Test System with RTDS Interface ..................................................... 179
LIST OF TABLES
Table 1.1: EISG Projects with IARs Included in this Section ................................................................ 2
Table 1: Effect of NYAG Laser Irradiation on CIS Crystal Size ......................................................... 53
Table 2: Summary of the Performance of the Tested SOEs ................................................................ 59
xii

Table 3: Breakdown of Capital Costs .................................................................................................... 80
Table 4: Summary Results of Nanowire and Baseline Si Cells Using Two Different Dopant Diffusion Protocols .................................................................................................................................. 85
Table 5: Net Energy Flows to/from Tank and Round-Trip Storage Efficiency ............................... 140
Table 6: Test Results Under Hold-on-Axis Series .............................................................................. 146
xiii

EXECUTIVE SUMMARY
The Energy Innovations Small Grant (EISG) Program is a component of the Public Interest Energy Research (PIER) Program managed by the California Energy Commission. The PIER Program benefits California electric and gas ratepayers by funding energy research, development, and demonstration (RD&D) projects that are not adequately provided for by the competitive and regulated energy markets.
The Energy Commission recognizes the need for a program to support the early development of promising new energy technology concepts that are not mature enough to be covered by PIER general solicitations. The Energy Commission has established the EISG Program to meet this need.
This report is a compilation of the Individual Assessment Reports (IARs) for grant projects that were awarded in years 2010 through 2013 and that have not been previously published. This is the final compilation of IARs under the PIER Program, because legislative authority expired in June of 2015 and the EISG electricity program has ceased.
1

CHAPTER 1: Introduction In 2013, the Energy Innovations Small Grant (EISG) program funded 26 grant projects for a total of $2.4 million. This section contains the 26 Independent Assessment Reports (IARs) from 2013 EISG projects that have yet to be published. (See Table 1.1 below)
Table 1.1: EISG Projects with IARs Included in this Section
Project Researcher EISG Funding
Monitoring and Feedback System for Improved Building End-Use Efficiency (2010)
University of California, Irvine $91,410
Low Cost MEMS Biogas Fuel Quality Meter for Power Generation (2010)
Makel Engineering, Inc. $94,157
Spindrift Energy Device Proof of Concept (2011)
Brian Moffat $95,000
Fast Demand Response and Energy Efficiency Using Duct Pressure Optimization (2011)
David S. Watson $94,667
Cooling Tower Fouling Prevention Through Surface Modification of Fill Media (2012)
Nano Hydrophobics, Inc. $95,000
HVAC Management System with Dynamic Energy and Demand Optimization (2012)
NegaWatt Consulting, Inc. $95,000
Crystallization of Electrodeposited CIS Thin Films on Flexible Foil (2012)
InterPhases Solar $95,000
Optimum Design of Secondary Optical Element for Concentrating Photovoltaics (2012)
Butler Sun Solutions $94,900
Enhanced Light Extraction of LEDs Through Ultra-Fast Laser Nano-Fabrication (2012)
Torrey Hills Technologies, LLC $94,954
Model Predictive Smart Lighting Commissioning System for Emerging Demand Management (2012)
University of California, Berkeley
$94,766
New Electromagnetic Method to Map Geothermal Resources (2012)
GroundMetrics, Inc. $94,599
Silicon Nanowire Solar Cells on Low Cost Substrates (2012)
Bandgap Engineering $95,000
Measurement of Critical Energy/Mass Balances for Stand-Alone Torrefaction (2012)
Schatz Energy Research Center
Humboldt State University
$95,000
Improving Solar Energy Conversion by Incorporating Broadband Absorption
University of California, Davis
$95,000
2

Upconversion Materials (2012)
Adaptive Fan Demand Control For Low Energy Consumption Cleanrooms (2012)
Engsys Research, Inc. $95,000
Quantum Protection System for Secure Grid Automation Communications
GridCom Technologies, Inc. $95,000
Low Band Gap Antimony-Based Thermophotovoltaics Grown on Gallium Arsenide Substrates
California Nanosystems Institute, UCLA $81,015
An Ultra-Compact Fiber-Optic Seismic Sensor for Geothermal Applications
Paulsson, Inc. $95,000
Liquid Metal Thermal Energy Storage Thermaphase Energy $95,000
Concentrated Solar Power on Demand (CSPonD) Proof of Concept
Daniel Codd $95,000
CPV Receiver for Parabolic Troughs Clean Energy Research Associates $95,000
Unified Power Control for Set Top Devices AGGIOS, INC. $93,000
Cost Effective Thermal Management Design for Electric Vehicle Batteries
University of California, Merced $95,000
Intelligent Energy Management for Solar Powered EV Charging Stations
University of California, Davis $94,917
Dual Chemistry Battery System DCBPower, Inc. $95,000
PEV-Based Active and Reactive Power Compensation in Distribution Networks: Design Optimization and Technology Demonstration
University of California, Riverside $95,000
3
CHAPTER 2: Independent Assessment Reports The Energy Innovations Small Grant (EISG) Program awards numerous grants for innovative energy research projects every year. Independent Assessment Reports (IARs) highlight the project outcomes for each of the EISG projects. This chapter includes the IARs from previously unpublished grant projects that were awarded in 2010 through.
2.1 Monitoring and Feedback System for Improved Building End-Use Efficiency Awardee: University of California, Irvine Principal Investigator: David Kirkby
2.1.1 Abstract California has led the nation in energy efficiency programs since the 1970s. Due to the State’s efficiency programs, per capita energy use in California has remained flat while use in the rest of the country has increased by about 33 percent. California is currently investing about $1 billion a year in energy efficiency and demand response programs.
The goal of this project was to determine the feasibility of a novel monitoring and feedback system than could reduce end-use energy consumption in residential buildings. Other products in the market simply monitor total kilowatt-hours (kWh) consumed. The proposed technology enables a more practical means for consumers to track the use of electricity for each outlet or wall plug, identify high-consumption sources, and take appropriate measures to reduce electricity consumption.
Data collection is enabled by installation and use of electric current and environmental data sensors connected by a standard, wireless mesh communications network. Consumers can view electricity usage/patterns using a web-enabled device such as a personal computer, tablet, or smart phone. Consumers can either customize or integrate application software with a third party smart home network.
The research team successfully demonstrated use of a wireless mesh network that met or exceeded 80 percent of data communication requirements using just four wireless units and a hub coordinator in a laboratory setting. However, the research team was not able to complete all development work due to budget limitations and thus was not able to fully test and validate the performance of a working prototype in real world conditions. The team, nonetheless, was able to validate manufacturing cost projections of an optimized wall plug at about $35 in quantities of 10,000. The estimated cost of a system hub was significantly reduced from the original goal of $90 to $50 in quantities of 10,000.
Keywords: Feedback platform, embedded electronics, home energy monitoring, energy efficiency
4

2.1.2 Introduction Consumers typically pay their electricity utility bills each month without carefully reviewing the details such as fixed charges, public purpose program fees, or kilowatt-hours (kWh) consumed. They do not fully understand how behavior changes could reduce the use of electricity. The proposed uci@home energy monitoring feedback system solves this dilemma by continuously quantifying plug-load consumption and graphically displaying results so consumers can more easily and quickly pinpoint wasteful energy sources and/or related behavior. Consumers are then able to make adjustments on a daily basis and decrease electricity consumption.
An effective home management system, however, must be simple to use and feature robust data collection and display capabilities at minimal cost. Existing smart grid products (including those manufactured by Tendril, Greenbox, Energy Hub and Zigbee) are generally expensive, complicated to use, and inefficient.
Data collection in this project was enabled by installation and use of electric current and environmental data sensors connected by a standard, wireless mesh communications network, which can be seen in Figure 1. Network nodes are individual power outlets fitted with a smart strip, or leaf. The leaf communicates with a central wireless server, or hub. Each leaf is an embedded, multi-staged device equipped with a sensor, microprocessor, power converter, and actuator. The wireless hub device is a computer server retrofitted with Zigbee wireless communication capabilities.
The researchers chose an Atmel ATmega128RFA1 micro-controller chip with a built-in Zigbee compatible transceiver for the optimal system design. They selected the Raspberry Pi as the preferred processor hub of the pilot study prototype, shown in Figure 2.
5
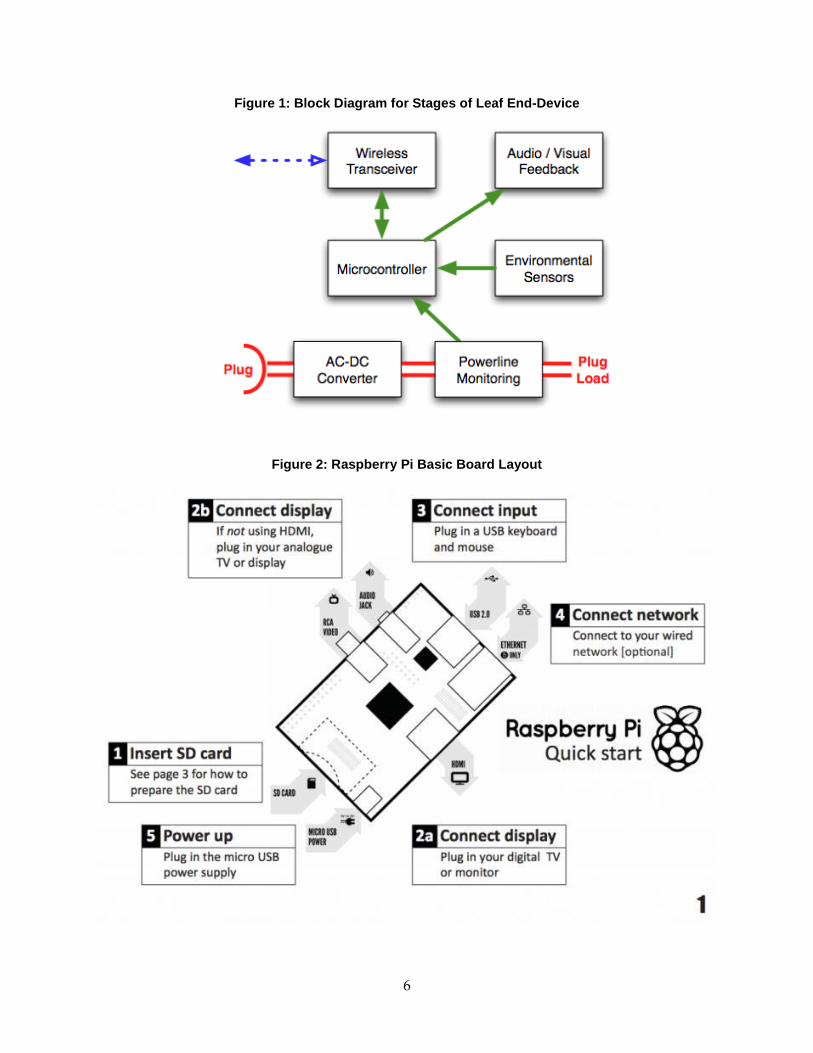
Figure 1: Block Diagram for Stages of Leaf End-Device
Figure 2: Raspberry Pi Basic Board Layout
6

The system design was completed in two stages. The first stage addressed wireless hardware design, while the second stage dealt with wireless software. The research team demonstrated that the use of only four plug-load devices was sufficient for data communication needs in a laboratory facility. Due to budget limitations, the researchers did not demonstrate or validate system performance using seven devices in a typical residential building.
Low volume cost of wireless nodes was approximately $65 to $100 per unit depending on the technology and chipset. The unit price dropped below $35 for batches of 10,000. The hub cost was $50, well below the target unit cost of $90 in batches of 10,000. The primary objective of reducing average household electricity consumption by 60 watts (W) one month after system installation was not achieved since the project did not proceed beyond development and pilot study phase.
Switched-mode power supply development requires in-depth analysis and was completed only following several iterations of both working and non-working prototype boards. Careful attention to the board layouts, components, and path lengths and distances must be taken into account to meet Underwriters Laboratories (UL) safety requirements and to prevent damage to testing equipment as well as the devices. All fabrication thus far has been experimental and has dealt with the development phase. Once the printed circuit board tracings have been finalized for all sensor stages, device assembly will be completed using a third-party service provider.
Although not all research objectives were met, the team was able to optimize system design with Zigbee integration to maximize capability and minimize cost. The projected final product was a low cost energy monitoring system comprised of seven outlet leaves and a single hub which could be purchased for $330 to $600 depending on sales/manufacturing volume. The uci@home system combined the wireless capabilities of a smart home with the plug pass-through devices in a system that could be purchased or rented to consumers by utilities or third party service providers. The market advantages of the proposed uci@home system included low cost, ease of installation and use, load disaggregate information, and remote wireless capability.
2.1.3 Objectives The goal of this project was to determine the feasibility of a novel monitoring and feedback system than could help reduce end-use energy consumption in residential buildings. The researchers established the following project objectives:
1. Create a robust system capable of viable wireless communication from 80 percent of plug outlets in a typical residential building with seven plug devices installed
2. Maintain a total manufacturing cost of $35 per plug device in quantities of 10,000
3. Restrict system hub costs under $90 in quantities of 10,000
4. Reduce average household electricity consumption by 60 W following one month of system testing in a real world environment
7

2.1.4 Outcomes 1. The research team successfully demonstrated a wireless mesh network that met or
exceeded 80 percent wireless communication results using only four wireless units and a hub coordinator in a laboratory setting.
2. The projected manufacturing cost of the optimized design was approximately $35 in quantities of 10,000, precisely what the research team had predicted.
3. System hub costs were significantly reduced from $100 to $50 in quantities of 10,000.
4. The research team was not able to complete all development work and thus was not able to test the performance of a working prototype.
2.1.5 Conclusions 1. A mesh network can be successfully configured to meet the needs of typical residence.
Software and graphical user interface allow residents to view the mesh network in addition to instantaneous temperature, lighting, electrical consumption, and signal strength.
2. The projected cost of plug-load devices matched project goals.
3. The use of the Raspberry Pi hub device resulted in a much lower cost than estimated and is expected to further drop as sales/production value grows. However, wireless interface with the Raspberry Pi device requires further work.
4. Field testing is still needed to validate performance and system design prior to commercialization.
Although the proposed concept is still under development, the final system design is projected to meet original performance targets. Laboratory testing demonstrated that the optimized system is functional and can be further customized to meet individual needs. New advances in technology have lowered power requirements to only 3.3 volts (V), resulting in negligible energy consumption. Incorporation of Zigbee wireless functionality proved successful on an experimental level. The addition of a switched mode power supply based on the flyback converter topology reduced costs. The Raspberry Pi hub device further reduced costs by maintaining the price per unit below $90. The proposed uci@home system could command a competitive advantage due to its much lower price. The system was designed to help consumers embrace and realize the potential benefits of an energy monitoring system. The integration of power monitoring with temperature and lighting control allows consumers to interactively monitor plug-loads, understand how behavior can impact energy efficiency, and provide a means to reduce electricity consumption.
2.1.6 Recommendations Additional development work such as integration of the WSN Monitor code and ATmega128RFA1 chipset is required before the technology can be commercialized. Another key technical obstacle is calibration of the Zigbee mesh network between the leaves and the hub.
8

Furthermore, the interface between the Raspberry Pi hub device and specified radio chips needs improvement. Careful attention to circuit board design, part selection, and path lengths is needed to meet UL safety requirements and prevent damage to electronic components.
The design team must also finalize product design features needed to produce a system that is attractive to consumers. A field demonstration project at several homes would help validate product performance and identify additional modifications needed prior to product launch. Actual cost savings should be documented. Finally, channel partners are needed to help validate, demonstrate, and commercialize the technology.
After taking into consideration (1) research findings in the grant project, (2) overall development status, and (3) relevance of the technology to California and the PIER Program, the program administrator has determined that the proposed technology should be considered for subsequent funding within the PIER Program.
Receiving subsequent funding ultimately depends on (1) availability of funds, (2) submission of a proposal in response to an invitation or solicitation, and (3) successful evaluation of the proposal.
2.1.7 Benefits to California Public benefits derived from PIER research and development projects are assessed within the following context:
• Reduced environmental impacts of the California electricity supply or transmission or distribution system
• Increased public safety of the California electricity system
• Increased reliability of the California electricity system
• Increased affordability of electricity in California
The primary benefits to the ratepayer from this research are reduced environmental impacts of the California electricity supply, transmission, and distribution system. The proposed uci@home concept has the potential to accelerate adoption of smart-home energy efficiency technologies in the residential marketplace. The research team estimated that the commercial product could reduce residential electricity consumption by an average of 8.0 percent; saving consumers $1,614 per year under the Southern California Edison (SCE) tiered rate structure. The research team also estimated that greenhouse gas emissions in California would be reduced by about 520 tons per year.
The researchers’ calculation assumes that the homeowner is paying an electricity bill of about $1,681 per month. This is a very high estimate for average residential electricity bills in California. Actual saving will probably be considerably less than those estimated by the researchers. Without field testing data, it is not possible to estimate potential savings to California ratepayers.
9

The challenge to achieving any savings will be to convince homeowners to not only buy and install this product, but also to have them take actions to change their behaviors.
2.1.8 Technology Transition Assessment As the basis for this assessment, the program administrator reviewed the researchers’ overall development effort, which includes all activities related to a coordinated development effort, not just the work performed with EISG grant funds.
Marketing/Connection to the Market The researchers had not surveyed potential customers nor completed a market analysis at the close of this project. They suggested that the final product could either be sold or leased to consumers using a variety of channel partners.
Engineering/Technical The researchers believe they can finish development and demonstration in about one year of additional work. They did not specify the funding required to complete the work.
Legal/Contractual The research team does not intend to file for patent protection. All work is considered public domain. A lack of protected intellectual property may hamper the deployment of this technology.
Environmental, Safety, Risk Assessments/ Quality Plans There are no obvious environmental or risk issues at this time. Technology risks can be mitigated through additional development work.
Production Readiness/Commercialization The concept is not yet sufficiently developed for commercialization. Additional development work is needed to resolve key technical issues and validate and demonstrate performance. Strategic partnerships are needed for cost reduction, product distribution, and support.
10

2.2 Low Cost MEMS Biogas Fuel Quality Meter for Power Generation Awardee: Darby B. Makel
Principal Investigato Makel Engineering, Inc.
2.2.1 Abstract The goal of this project was to determine the feasibility of using micro-electro-mechanical systems (MEMS) technology to produce a low-cost fuel quality meter for variable- and low-British thermal unit (Btu) biofuels. This technology would enable accurate feed-forward control of power generation systems. The meter continuously measured the varying energy content of biofuels produced at numerous locations including landfills, food waste digesters, dairies, and wastewater treatment plants. Accurate monitoring of energy content is critical to optimize efficiency and maintain low engine emissions.
The research team developed and demonstrated operation of a prototype sensor for biogas where methane is the primary hydrocarbon component. The prototype was based on direct detection of methane with a silicon carbide-based metal insulator semiconductor (MIS) diode sensor element. Methane energy content was measured at an accuracy of plus or minus 1.0 percent using simulated low-Btu biogas mixtures containing methane, carbon dioxide, oxygen, and nitrogen. The sensor also demonstrated a tolerance of hydrogen sulfide (H2S) of up to 50 parts per million. The researchers demonstrated integration of the fuel quality sensor data output with that of a commercial flow meter to correct flow measurement for variable methane content. A production cost analysis based on the high fidelity prototype indicated that a product cost of under $2,000 was possible. This would serve a need for biogas distributed generation systems in the size range of 100 kilowatts to 5 megawatts.
Keywords: Btu sensor, biogas, energy content, MEMS, fuel quality, distributed generation
11
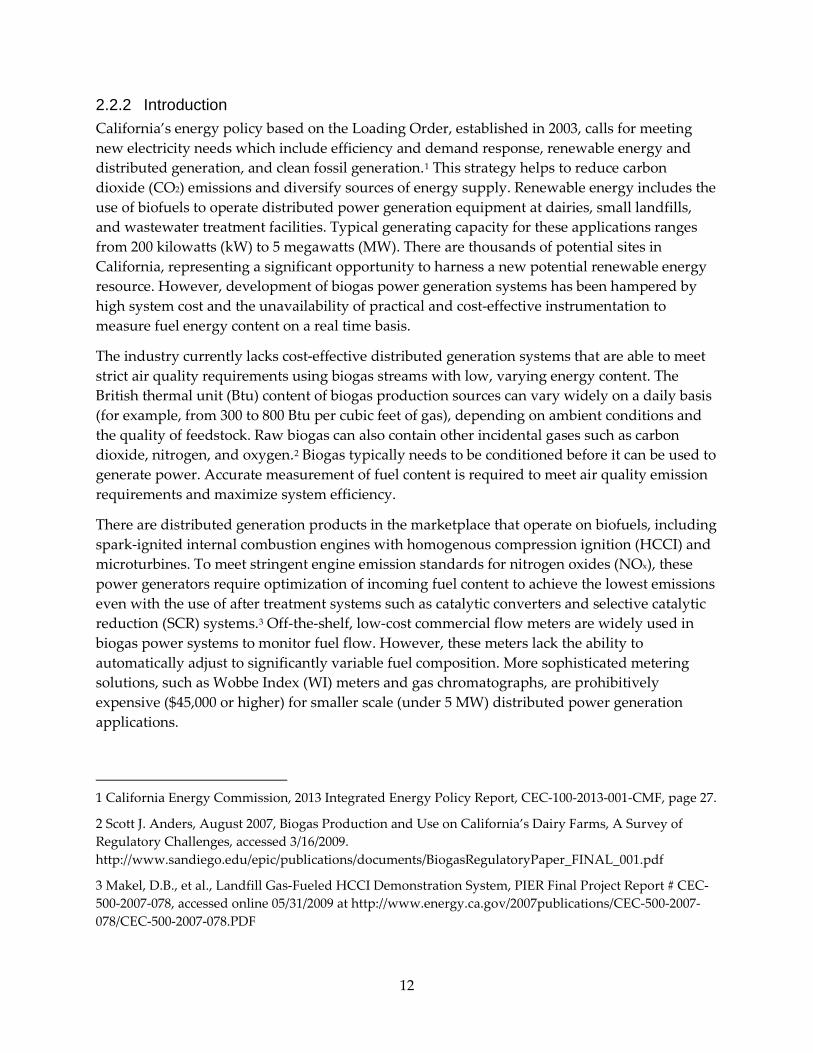
2.2.2 Introduction California’s energy policy based on the Loading Order, established in 2003, calls for meeting new electricity needs which include efficiency and demand response, renewable energy and distributed generation, and clean fossil generation.1 This strategy helps to reduce carbon dioxide (CO2) emissions and diversify sources of energy supply. Renewable energy includes the use of biofuels to operate distributed power generation equipment at dairies, small landfills, and wastewater treatment facilities. Typical generating capacity for these applications ranges from 200 kilowatts (kW) to 5 megawatts (MW). There are thousands of potential sites in California, representing a significant opportunity to harness a new potential renewable energy resource. However, development of biogas power generation systems has been hampered by high system cost and the unavailability of practical and cost-effective instrumentation to measure fuel energy content on a real time basis.
The industry currently lacks cost-effective distributed generation systems that are able to meet strict air quality requirements using biogas streams with low, varying energy content. The British thermal unit (Btu) content of biogas production sources can vary widely on a daily basis (for example, from 300 to 800 Btu per cubic feet of gas), depending on ambient conditions and the quality of feedstock. Raw biogas can also contain other incidental gases such as carbon dioxide, nitrogen, and oxygen.2 Biogas typically needs to be conditioned before it can be used to generate power. Accurate measurement of fuel content is required to meet air quality emission requirements and maximize system efficiency.
There are distributed generation products in the marketplace that operate on biofuels, including spark-ignited internal combustion engines with homogenous compression ignition (HCCI) and microturbines. To meet stringent engine emission standards for nitrogen oxides (NOx), these power generators require optimization of incoming fuel content to achieve the lowest emissions even with the use of after treatment systems such as catalytic converters and selective catalytic reduction (SCR) systems.3 Off-the-shelf, low-cost commercial flow meters are widely used in biogas power systems to monitor fuel flow. However, these meters lack the ability to automatically adjust to significantly variable fuel composition. More sophisticated metering solutions, such as Wobbe Index (WI) meters and gas chromatographs, are prohibitively expensive ($45,000 or higher) for smaller scale (under 5 MW) distributed power generation applications.
1 California Energy Commission, 2013 Integrated Energy Policy Report, CEC-100-2013-001-CMF, page 27.
2 Scott J. Anders, August 2007, Biogas Production and Use on California’s Dairy Farms, A Survey of Regulatory Challenges, accessed 3/16/2009. http://www.sandiego.edu/epic/publications/documents/BiogasRegulatoryPaper_FINAL_001.pdf
3 Makel, D.B., et al., Landfill Gas-Fueled HCCI Demonstration System, PIER Final Project Report # CEC-500-2007-078, accessed online 05/31/2009 at http://www.energy.ca.gov/2007publications/CEC-500-2007-078/CEC-500-2007-078.PDF
12
The goal of this project was to determine the feasibility of using micro-electro-mechanical systems (MEMS) technology to produce a low-cost fuel quality meter for variable- and low-Btu biofuels, enabling accurate feed-forward control of power generation systems. The research revealed that a low-cost (under $2,000) energy measuring device or meter for biogas power generation systems was needed to optimize engine efficiency and to provide accurate accounting of the amount of fuel consumed. The project team attempted to design a product that was compact, rugged, and suitable for installation in the field as either a stand-alone sensor or integrated into a flow meter. The heart of the metering technology was a MEMS-based chemical sensor capable of measuring hydrocarbons and a microfluidic column maintained at uniform temperature. The researchers used a microcontroller to transduce the sensor signal and communicate with the flow meter and/or engine control system.
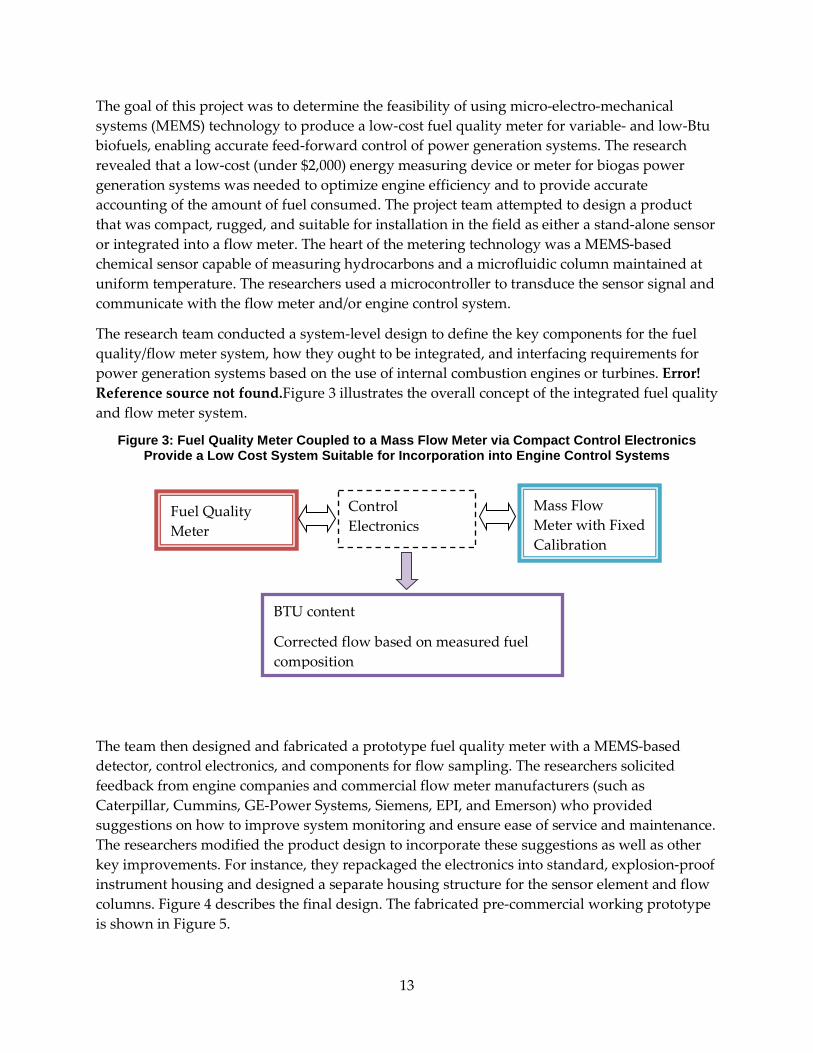
The research team conducted a system-level design to define the key components for the fuel quality/flow meter system, how they ought to be integrated, and interfacing requirements for power generation systems based on the use of internal combustion engines or turbines. Error! Reference source not found.Figure 3 illustrates the overall concept of the integrated fuel quality and flow meter system.
Figure 3: Fuel Quality Meter Coupled to a Mass Flow Meter via Compact Control Electronics Provide a Low Cost System Suitable for Incorporation into Engine Control Systems
The team then designed and fabricated a prototype fuel quality meter with a MEMS-based detector, control electronics, and components for flow sampling. The researchers solicited feedback from engine companies and commercial flow meter manufacturers (such as Caterpillar, Cummins, GE-Power Systems, Siemens, EPI, and Emerson) who provided suggestions on how to improve system monitoring and ensure ease of service and maintenance. The researchers modified the product design to incorporate these suggestions as well as other key improvements. For instance, they repackaged the electronics into standard, explosion-proof instrument housing and designed a separate housing structure for the sensor element and flow columns. Figure 4 describes the final design. The fabricated pre-commercial working prototype is shown in Figure 5.
Fuel Quality Meter
Mass Flow Meter with Fixed Calibration
BTU content
Corrected flow based on measured fuel composition
Control Electronics
13

14
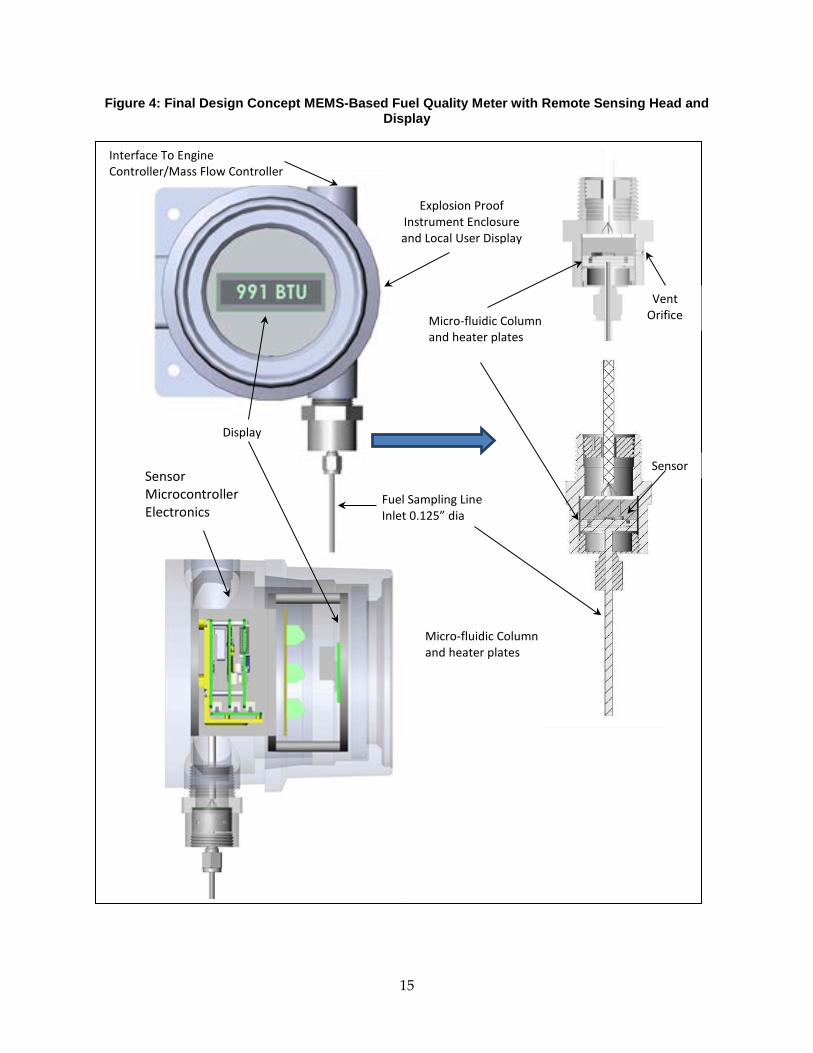
Figure 4: Final Design Concept MEMS-Based Fuel Quality Meter with Remote Sensing Head and Display
Micro-fluidic Column and heater plates
Fuel Sampling Line Inlet 0.125” dia
Explosion Proof Instrument Enclosure and Local User Display
Vent Orifice
Sensor
Micro-fluidic Column and heater plates
Display
Sensor Microcontroller Electronics
Interface To Engine Controller/Mass Flow Controller
15
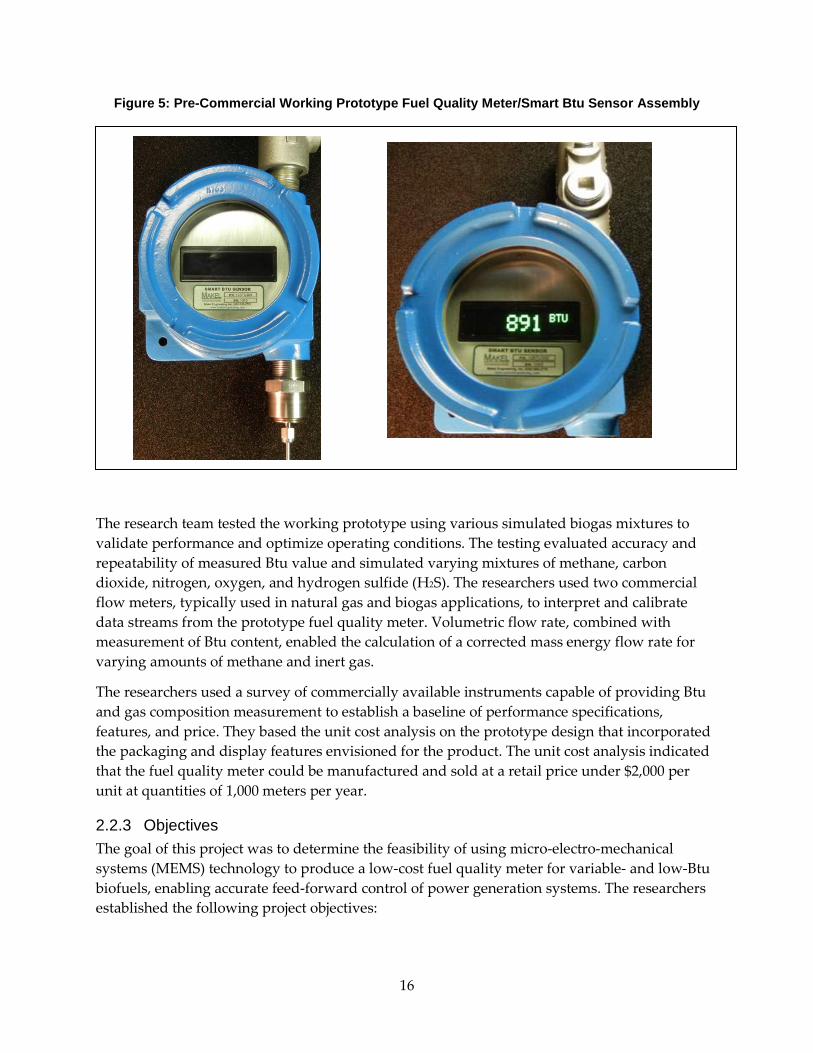
Figure 5: Pre-Commercial Working Prototype Fuel Quality Meter/Smart Btu Sensor Assembly
The research team tested the working prototype using various simulated biogas mixtures to validate performance and optimize operating conditions. The testing evaluated accuracy and repeatability of measured Btu value and simulated varying mixtures of methane, carbon dioxide, nitrogen, oxygen, and hydrogen sulfide (H2S). The researchers used two commercial flow meters, typically used in natural gas and biogas applications, to interpret and calibrate data streams from the prototype fuel quality meter. Volumetric flow rate, combined with measurement of Btu content, enabled the calculation of a corrected mass energy flow rate for varying amounts of methane and inert gas.
The researchers used a survey of commercially available instruments capable of providing Btu and gas composition measurement to establish a baseline of performance specifications, features, and price. They based the unit cost analysis on the prototype design that incorporated the packaging and display features envisioned for the product. The unit cost analysis indicated that the fuel quality meter could be manufactured and sold at a retail price under $2,000 per unit at quantities of 1,000 meters per year.
2.2.3 Objectives The goal of this project was to determine the feasibility of using micro-electro-mechanical systems (MEMS) technology to produce a low-cost fuel quality meter for variable- and low-Btu biofuels, enabling accurate feed-forward control of power generation systems. The researchers established the following project objectives:
16

1. Demonstrate a meter that can determine Btu content of fuel within plus or minus (+/-) 0.1 percent
2. Demonstrate a measurement time that is within 60 seconds
3. Demonstrate that a unit cost of less than $2,000 is achievable
2.2.4 Outcomes 1. Sensor accuracy was within (+/-) 1.0 percent of reading
2. Measured time response was less than 30 seconds
3. The sensor design could be manufactured for under $1,000 in quantities of 1,000 units per year, which suggested that the target retail price of under $2,000 per unit could be achieved
2.2.5 Conclusions 1. The researchers found sensor accuracy to be 10 times that of the original goal of (+/-) 0.1
percent of reading. Ultimately, this may be an acceptable performance specification based on subsequent input received from potential customers and industry stakeholders such as internal combustion engine manufacturers, renewable energy developers, and flow instrumentation manufacturers.
2. Measured response time was lower than the performance target, which could result in a more compelling product for prospective buyers.
3. Manufacturing unit cost estimates were less than $1,000 in quantities of 1,000 per year. Researchers assumed that manufacturing cost was at or near the wholesale cost including parts, labor, profit, and overhead. Retail price is generally assumed to be twice that of the wholesale cost. Therefore the retail price for this product could be assumed to be less than $2,000 at volumes of 1,000 per year.
Although sensor accuracy fell short of expectations, the research team was able to successfully develop and test a working prototype that either met or exceeded all other performance targets. Subsequent feedback from potential customers and stakeholders indicated that measured sensor accuracy of (+/-) 1.0 percent of reading should be acceptable for most biogas applications. Further optimization of flow volumes (dead space) and sampling flow rates for the sensor would likely reduce the response time to less than the 30 seconds demonstrated in laboratory tests. There were mixed results with the component technologies evaluated in the project. The application of a silicon carbide diode sensor element was successful for quantitative methane concentration measurement in the absence of oxygen. This sensor enabled the fuel quality meter prototype to be focused on methane-based biogas applications. The envisioned fuel quality meter would be more broadly applicable with the ability to perform compositional analysis using micro gas chromatograph-type columns; however, evaluation tests with prototype separation columns were not successful. Thus, the proposed meter was limited to energy content measurement based on methane concentration.
17

It appears that the fuel quality meter could be manufactured and sold at a retail price under $2,000 per unit at quantities of 1,000 meters per year. A fully integrated fuel quality and flow meter product would enable a lower cost solution for biogas producers and/or developers of distributed generation systems. However the complexity of redesigning and recertifying existing flow meter designs does not appear to be economically viable until there is major growth in the biogas market. The guidance received from industry stakeholders was to produce a fuel quality meter as a stand-alone instrument that could be digitally interfaced with selected commercial flow meters. This product configuration could either be used to correct the flow meter output or to provide a digital signal to an engine control system so it could perform the correction.
2.2.6 Recommendations The program administrator recommends that the research team:
• Prepare the product for extended duration and field testing at working biogas production sites with specific focus on calibration stability and performance. The unit should be tested over a wide range of methane-based biogas compositions.
• Continue development for the micro-column design so that the product could be used to measure the Btu content of other hydrocarbon fuels and gas fields that contain hydrogen and carbon monoxide.
• Begin the process of UL and CSA certification.
• Establish working relationships with industry stakeholders for product manufacturing, distribution, and support.
• Consider producing a fuel quality meter as a stand-alone instrument that could be digitally interfaced with selected commercial flow meters. This could provide the earliest market opportunity until the micro-column design work is completed.
After taking into consideration (1) research findings in the grant project, (2) overall development status, and (3) relevance of the technology to California and the PIER Program, the program administrator has determined that the proposed technology should be considered for subsequent funding within the PIER Program.
Receiving subsequent funding ultimately depends upon (1) availability of funds, (2) submission of a proposal in response to an invitation or solicitation, and (3) successful evaluation of the proposal.
2.2.7 Benefits to California Public benefits derived from PIER research and development projects are assessed within the following context:
• Reduced environmental impacts of the California electricity supply or transmission or distribution system
18

• Increased public safety of the California electricity system
• Increased reliability of the California electricity system
• Increased affordability of electricity in California
The primary benefit to the ratepayer from this research is reduced environmental impacts of the California electricity supply or transmission or distribution system. The availability of an accurate, reliable, and low-cost fuel quality metering device could help accelerate adoption of renewable distributed generation at several thousand potential biogas production sites that must contend with the complexity of varying gas compositions.
California’s energy policy is based on a loading order established in 2003 calling for meeting new electricity needs first with efficiency and demand response, followed by renewable energy and distributed generation, and then with clean fossil generation. This strategy helps to reduce carbon dioxide (CO2) emissions and diversify sources of energy supply. This project targeted development of a sensor technology that could help accelerate deployment of renewable energy and distributed generation applications using biogas produced by dairies, landfills, and wastewater treatment plants. A 2007 PIER report written in collaboration with the California Biomass Collaborative estimates that biomass resources could provide an additional 2,850 megawatts of electricity (MWe) of technical capacity to the State’s current capacity of 968 MWe.
The proposed technology could also reduce criteria pollutants and increase the efficiency of biogas-fueled distributed power generation systems by more accurately monitoring fuel quality coupled with fuel flow metering. Landfill gas (LFG) is another market opportunity for this product. LFG is generated through the decomposition of organic waste in anaerobic (oxygen-deprived) conditions at municipal solid waste (MSW) disposal facilities, commonly known as landfills. Wastewater treatment biogas is yet another market opportunity; this type of biogas is produced from anaerobic digestion of domestic/industrial wastewater sludge. Wastewater treatment biogas consists of 55 to 65 percent methane, 30 percent CO2, and other inert gases such as nitrogen. This composition results in a heating value of 550 to 650 Btu per cubic feet of gas.
2.2.8 Technology Transition Assessment As the basis for this assessment, the program administrator reviewed the researchers’ overall development effort, which includes all activities related to a coordinated development effort in addition to the work performed with EISG grant funds.
Marketing/Connection to the Market The market is in need of low-cost instrumentation suitable for small-scale biogas applications. Engine and turbine manufacturers have expressed an interest in a low cost fuel sensor that can maintain optimal air/fuel ratios needed to control and maintain low NOx emission levels. The research team is exploring potential partnerships with industry stakeholders to help with development, durability testing, and commercialization efforts.
19

Engineering/Technical The researchers estimated that they could complete field test verification and establish manufacturing supply chain for the product in less than two years. They estimated funding needs at $250,000 for these activities.
Legal/Contractual The research team has not uncovered prior art that would conflict with this technology. At the end of the project, the team was in the process of filing a patent related to the construction and algorithms of the sensor element.
Environmental, Safety, Risk Assessments/ Quality Plans There are no obvious environmental or risk issues; however, these assessments and plans have not been completed yet.
Production Readiness/Commercialization Commercialization efforts for the sensor have already started with a manufacturer of internal combustion engines used for biogas applications and a manufacturer of gas turbine systems. These companies are funding product development specific to their system requirements.
20

2.3 Spindrift Energy Device Proof of Concept Awardee: Brian Moffat
Principal Investigator: Brian Moffat
2.3.1 Abstract Harnessing ocean waves as a source of renewable energy is an exciting field of research. However, practicality and cost issues have impeded further investigation. The goal of this project was to demonstrate that wave energy research and technology merit further exploration. Researchers designed and fabricated a prototype of a new ocean wave energy device (the Spindrift Energy device) and made two attempts to test it.
The Spindrift Energy device was designed with only three moving parts requiring minimal maintenance and repair. The device was intentionally designed to be simple and inexpensive, yet durable enough to withstand rough weather conditions.
Attempts to deploy the device failed, and no power data was collected. Attempts at testing the device were unsuccessful. However, the research team will make additional sea trials in the future.
Keywords: Ocean, wave energy, buoy, point absorber, renewable, venturi tube
21

2.3.2 Introduction Technology for extracting power from ocean waves has not advanced quickly, as harnessing this power economically and efficiently has proven to be difficult.
A Spindrift Energy device is simple in both its design and operation. A buoy floats on the surface of the sea and moves up and down with the waves. Attached to the buoy is a submerged tube, the upper end of which is positioned at a depth of about 20 meters. As the buoy moves up and down with the waves, the submerged tube is driven up and down through water that, because of its depth, is not moving. Wave motion diminishes exponentially with depth, and, at a depth referred to as the wave base, the wave motion at the surface is no longer detectable.
The submerged tube contains a venturi tube. There is a constriction in the tube that causes the flow of the water to speed up at the expense of some of its pressure. As the tube is driven up and down through the still waters below the wave base, water is driven back and forth through the venturi tube. The venturi tube increases the speed of that water. In the throat (interior) of the tube, where the water flows fastest, a simple hydrokinetic turbine extracts power from the flow.
Water leaves the tube at the same speed with which it entered. However, the pressure of the water leaving the tube is lower than the pressure of the water that entered.
The upper and lower portions of the submerged tube are cylindrical. The inertia of the water in these sections resists the rising and falling of the tube. The inertia of the water in the leading section (in other words, the upper section when the tube is rising, the lower section when the tube is falling) causes that water to force its way through the venturi tube and on to the other side. Likewise, the inertia of the water in the trailing section causes the section to resist following the tube’s motion; creating a partial vacuum on the trailing side of the turbine and drawing water through the turbine (see Figure 6).
22
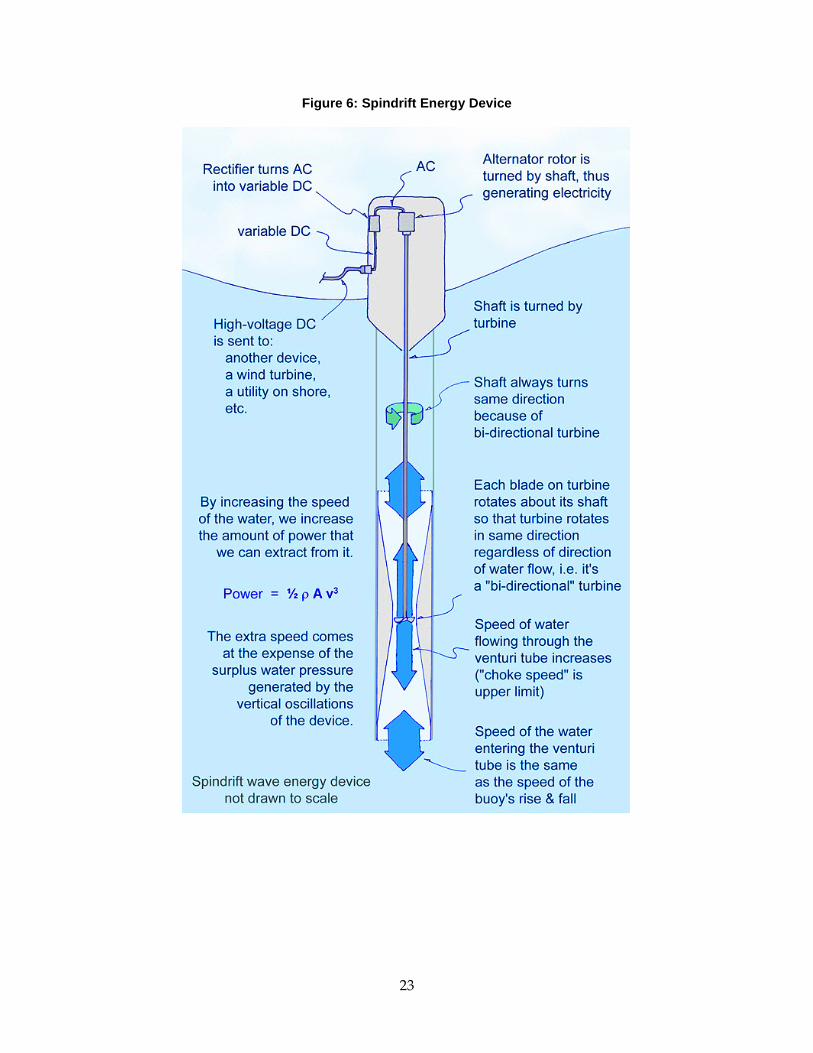
Figure 6: Spindrift Energy Device
23

2.3.3 Objectives The goal of this project was to determine the feasibility of generating electrical power from a wave-driven hydrokinetic turbine embedded in a submerged venturi tube.
The researchers established the following project objectives:
1. Confirm that components match specifications in CAD drawings within specified tolerances
2. Confirm that all items are received and match expected specifications/tolerances
3. Confirm that sufficient data will be gathered, that data analysis procedure can generate a plot of average device power, and that approximate prevailing wave height and period is measured with an accuracy of +/- 10 percent along each axis
4. Demonstrate that all sensors are accurate to better than +/-5 percent
5. Demonstrate that manual turning of demonstrator shaft results in the generation of a detectable level of electrical power
6. Gather sufficient test data to permit the calculation of average power and approximate significant wave height and period
7. Determine average power and approximate significant wave height and period and margins of error for all values
2.3.4 Outcomes 1. Prototype dimensions were checked and verified.
2. Items and parts were received and matched specifications to fabricate the Spindrift Energy device prototype.
3. The researchers developed a sea trial data acquisition strategy and validated the strategy with sample data and analysis. The accuracy was not reported.
4. The researchers reported that they calibrated sensors and tested them by identifying voltages of various assemblies of batteries, but they did not provide the accuracy percentage.
5. The researchers assembled and manually tested the prototype out of water. The sensors detected generation of voltage.
6. Field testing did not occur; therefore test data of the prototype were not collected.
7. Due to the lack of test data, the researchers were unable to calculate average power, wave height and period, and margins of error.
2.3.5 Conclusions 1. The researchers designed, fabricated, and minimally tested the Spindrift Energy device
prototype above water.
24

2. The researchers attempted a sea trial, but the prototype was damaged prior to data collection. A multitude of factors, including wave conditions and procuring a boat with necessary capabilities, precluded further trials.
3. The researchers intend to deploy and test the prototype in the future.
The researchers did not prove feasibility of the concept.
2.3.6 Recommendations The program administrator recommends that the researchers perform the necessary sea trials to demonstrate the feasibility of the Spindrift Energy device.
2.3.7 Benefits to California Public benefits derived from PIER research and development projects are assessed within the following context:
• Reduced environmental impacts of the California electricity supply or transmission or distribution system
• Increased public safety of the California electricity system
• Increased reliability of the California electricity system
• Increased affordability of electricity in California
The primary benefit to the ratepayer from this research is reduced environmental impacts of the California electricity supply. If proven successful, the Spindrift Energy device could be a low-cost and low-maintenance source of baseload renewable energy for California ratepayers.
2.3.8 Technology Transition Assessment As the basis for this assessment, the program administrator reviewed the researchers’ overall development effort, which includes all activities related to a coordinated development effort in addition to the work performed with EISG grant funds.
Marketing/Connection to the Market The researchers have not yet completed a marketing plan but would like to partner with local coastal utilities.
Engineering/Technical Researchers intend to produce a commercial prototype after preliminary sea trials are successfully completed.
Legal/Contractual United States and international patents are pending.
Environmental, Safety, Risk Assessments/ Quality Plans These plans and assessments were not completed in this project. They can only be accomplished once the product design is finalized.
25

Production Readiness/Commercialization The product concept is not yet ready for production or commercialization.
26
2.4 Fast Demand Response and Energy Efficiency Using Duct Pressure Optimization Awardee: David S. Watson
Principal Investigator: David S. Watson
2.4.1 Abstract Commercial buildings with variable air volume (VAV) distribution systems typically use duct static pressure control set points with fixed values to satisfy maximum design load conditions. This approach wastes considerable energy since most buildings operate at partial load the vast majority of the year. The goal of this project was to determine the feasibility of using a wireless pressure optimization device in medium to large commercial building duct systems to reduce electric demand, increase energy efficiency, and either maintain or improve occupancy comfort.
The research team successfully designed, produced, programmed, installed, and tested a new technology that deploys the use of multiple duct pressure sensors to dynamically optimize fan speeds that lead to energy savings and greater occupancy comfort. The tested concept directly measured duct static pressure near inlets to all VAV terminal boxes and continuously adjusted supply air volume required to meet the cooling load for each zone. The technology could be quickly deployed as a stand-alone application, reducing cost and minimizing disruptions associated with traditional mechanical retrofit measures. Test results from the pilot demonstration site indicated that the concept could reduce fan energy consumption by approximately 32 percent during the warmest months of the year with even greater potential savings during moderate and cooler seasons. Duct static pressure could also be quickly adjusted up or down in near real-time, making this technology suitable as a fast demand response (Fast DR) resource for grid balancing programs and related ancillary services.
Keywords: Energy efficiency, demand response, Fast DR, variable air volume, VAV, fan pressure reset, duct static pressure reset, optimization, real time control, machine to machine, M2M, grid balancing, CAISO, ancillary services
27

28
2.4.2 Introduction California’s energy policy is based on a loading order established in 2003 requiring new electricity needs such as efficiency and demand response, renewable energy and distributed generation, and clean fossil generation. Commercial buildings consume about one third of electricity used in California and they use an even larger portion of peak demand. Commercial building heating and cooling fan systems are not optimized for energy efficiency and contribute 10 to25 percent of a building’s total annual energy use.
Variable air volume (VAV) air distribution systems are commonly used for air conditioning and heating in medium and large commercial buildings. VAV systems offer the ability of modulating the amount of air supplied to each zone depending on the time of day and season. The total amount of supply air needed for the system during any part of the day is typically less than the sum total of all zones operating at their respective peak load conditions. Therefore, a smaller supply air fan can be specified and the amount of air delivered to the system can vary depending on the instantaneous cooling and heating load conditions of the various zones. The VAV system is capable of operating efficiently throughout the day with only the minimum amount of supply air delivered as necessary at any given time. However, a single fixed duct static pressure (DSP) set point is commonly used to balance system airflow during peak air conditioning design conditions. A substantial amount of energy is, therefore, wasted due to unnecessary over-pressurization of the fan duct system during most of the year when the system is operating at partial load conditions.
The goal of this project was to determine the feasibility of using a wireless pressure optimization device in medium to large commercial building duct systems to reduce electric demand, increase energy efficiency, and either maintain or improve occupancy comfort. Prior attempts at solving energy waste due to VAV duct over-pressurization have not been supported by the market. For instance, the trim and respond technique gradually resets the duct static pressure (DSP) set point value higher if any of the VAV box damper positions are greater than 90 percent open. This method requires near real-time monitoring of all VAV box damper positions, which is expensive or impossible, especially for existing building retrofit applications. In addition, the system is subject to failure whenever a single VAV box is overloaded, undersized, out of calibration, or in need of maintenance. This condition can drive the dynamic DSP set point adjustment permanently to maximum design conditions that unnecessarily increases fan speed and wastes energy. Another less popular method is the required monitoring of existing airflow at each VAV terminal box. This technique is expensive and limited to facilities using controls systems based on open standard communication protocols.
The research team elected to develop an innovative and scalable retrofit solution for VAV fan pressure reset control known as the Slice Persimmon Air Solution (Slice PAS). The core concept uses multiple duct pressure sensors that effectively optimize fan speeds and energy efficiency while retaining occupant comfort. The concept measures the DSP near the inlet to each of the VAV terminal boxes so that airflow can be adjusted continuously, rather than manually adjusting damper positions (another common industry practice). The proposed concept also gathers simple fault detection and diagnostic (FDD) data to identify faulty VAV terminal units,
29
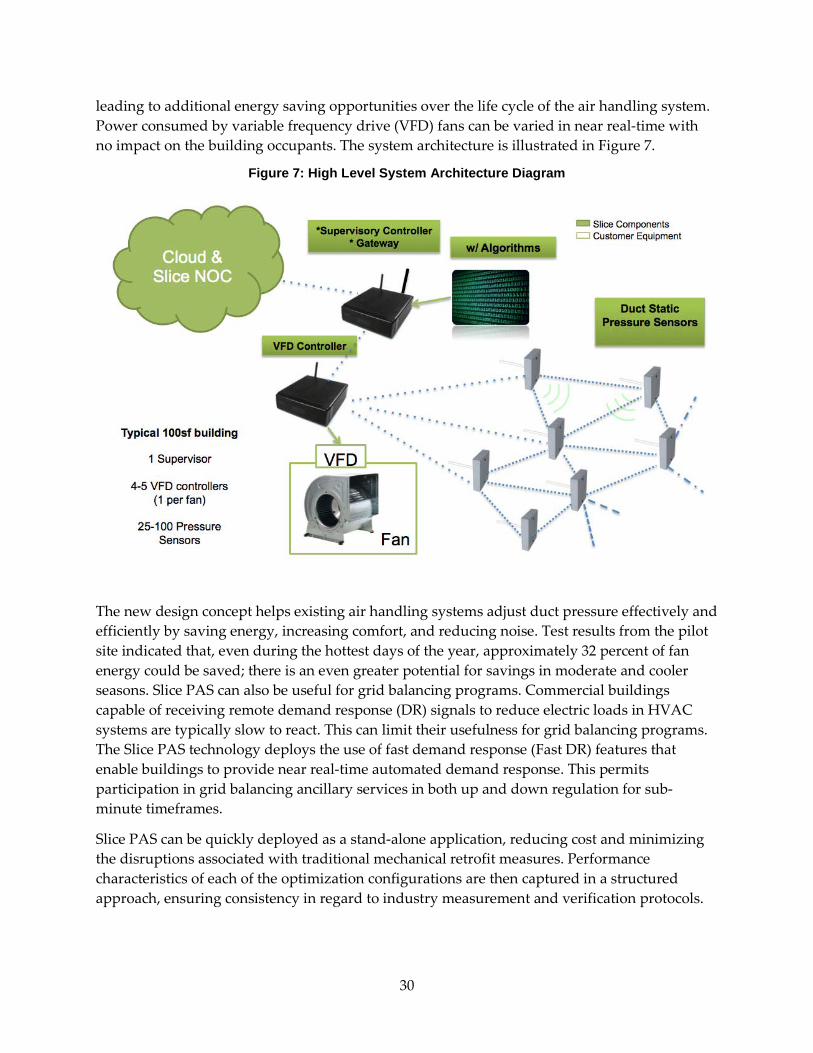
leading to additional energy saving opportunities over the life cycle of the air handling system. Power consumed by variable frequency drive (VFD) fans can be varied in near real-time with no impact on the building occupants. The system architecture is illustrated in Figure 7.
Figure 7: High Level System Architecture Diagram
The new design concept helps existing air handling systems adjust duct pressure effectively and efficiently by saving energy, increasing comfort, and reducing noise. Test results from the pilot site indicated that, even during the hottest days of the year, approximately 32 percent of fan energy could be saved; there is an even greater potential for savings in moderate and cooler seasons. Slice PAS can also be useful for grid balancing programs. Commercial buildings capable of receiving remote demand response (DR) signals to reduce electric loads in HVAC systems are typically slow to react. This can limit their usefulness for grid balancing programs. The Slice PAS technology deploys the use of fast demand response (Fast DR) features that enable buildings to provide near real-time automated demand response. This permits participation in grid balancing ancillary services in both up and down regulation for sub-minute timeframes.
Slice PAS can be quickly deployed as a stand-alone application, reducing cost and minimizing the disruptions associated with traditional mechanical retrofit measures. Performance characteristics of each of the optimization configurations are then captured in a structured approach, ensuring consistency in regard to industry measurement and verification protocols.
30

2.4.3 Objectives The researchers established the following project objectives:
1. Design, manufacture, and test wireless devices of low volume design and demonstrate laboratory environment reliability of greater than 99.8 percent. 4
2. Install low volume hardware prototypes in building(s). Demonstrate measurement of duct static pressure (DSP) at the inlet of the furthest VAV box and reliability of greater than 99.7 percent.
3. Finalize medium volume hardware design for wireless devices. Demonstrate laboratory environment reliability greater than 99.8 percent.
4. Install medium volume hardware prototypes in building(s). Demonstrate measurement of DSP at the inlet of the furthest VAV box and reliability of greater than 99.7 percent.
5. Develop robust, crash-free software for wireless platform communications including: general connectivity, open loop measurements, closed loop control for efficiency, power adjustment factor software for advanced fast DR features, communication with a data read-only memory server (DROMS).
6. Achieve the start of automatic demand response (DR) shedding of controlled electric load(s) within 30 seconds of receipt of signal. Achieve FastDR set point within 90 seconds after the initial response.
7. Verify and compare grid signal regulation up and down functions against CAISO requirements. Compare product specifications with existing and/or planned ancillary services programs offered by CAISO.
8. Determine efficiency benefits of the Slice Energy PAS compared with existing systems. Reduce fan energy by an average of at least 33 percent during occupied hours through use of the Watson system in automatic mode.
9. Detect which VAV box has the greatest demand based on duct static pressure. Detect and identify chronically undersized and non-functional VAV boxes.
2.4.4 Outcomes 1. The researchers tested low volume hardware prototypes in a lab environment, and 100
percent communication reliability was achieved among five wireless (low volume design) motes.
2. The researchers never installed low volume hardware prototypes in the pilot building because full-featured medium volume hardware devices were completed and installed in the pilot site per the revised project schedule, making the need for the less functional
4 Reliability measured in terms of successful wireless data packet transmission and reception.
31
devices unnecessary. The researchers measured communication reliability for the medium volume devices at 99.9997 percent at the pilot site.
3. The researchers completed medium volume hardware design, achieving 100 percent reliability in the lab.
4. The researchers demonstrated measurement of duct static pressure (DSP) at the inlet of the furthest VAV box. They measured on-site communication reliability for the medium volume devices at 99.9997 percent.
5. The researchers developed and demonstrated robust, crash-free software for wireless platform communications in tests at the pilot site including: general connectivity, open loop measurements, closed loop control for efficiency, power adjustment factor software for advanced fast demand response (DR) features, and communication with a Simple Measurement and Actuation Profile (sMAP5) server based on an open source data gathering and visualization platform.
6. The electric load, a variable frequency drive (VFD) fan, initiated response eight seconds after a new set point signal was dispatched. The Fast DR set point was achieved within 45 seconds after a new set point signal was sent.
7. The researchers verified regulation functionality in manual tests at the pilot site. They compared system response characteristics to existing and planned ancillary services programs offered by CAISO.
8. The Slice Energy PAS saved 59.8 percent of fan energy compared with the typical static control system during a two and a half hour test. The Slice Energy PAS saved 29.4 percent of fan energy compared with the typical static control system during a longer 20 hour test.
9. The sMAP server identified the VAV box with the greatest demand based on duct static pressure when the system was in closed-loop dynamic control using the Slice Energy PAS. In addition, the Slice Energy PAS detected how the actual pressure at each location compared with the set point for that location every 60 seconds and ranked the VAV boxes accordingly.
2.4.5 Conclusions 1. Initial connectivity between the wireless network and the database accelerated the
development of custom designed circuit boards (for example, medium volume devices).
2. The functional system mockup was a worthwhile investment, despite the fact that it was time consuming and costly. It allowed the project team to test all hardware and software as a system, in preparation for the pilot site installation.
5 https://code.google.com/p/smap-data/
32
3. System reliability in a laboratory environment exceeded project goals.
4. On-site communication reliability for the medium volume devices exceeded project goals.
5. The objective was expanded to include an open source database and visualization tool (sMAP) to warehouse and visualize data from the pilot site. This created a secure, robust, extensible, saleable, multi-user platform for pilot site analysis as well as growth potential for other sites.
6. Slice PAS has the potential to control VFD fans even though additional system optimization and testing may be required. The system appears able to provide fast, automated demand response using buildings as a grid balancing resource.
7. Buildings have the potential to assist CAISO operators for grid demand response purposes by being able to shed electrical loads quickly when required. The Slice PAS concept can easily be configured for grid synchronization and enable building operators to participate in existing and/or future CAISO ancillary programs.
8. The research team concluded that the proposed concept could reduce VFD fan energy by an average of 32 percent.
9. Energy is wasted in conventional VAV systems due to over pressurization and lack of optimization at the zone level. The proposed concept is very useful for detecting which VAV box has the greatest demand based on duct static pressure. Additional advanced analytics will provide even more value to facility operators to help assure comfort and energy efficiency in their facilities through the use of more comprehensive and intuitive reports about these data.
This project successfully demonstrated a new technology that could be installed in existing commercial buildings without inconveniencing occupants or requiring downtime. The wireless controls and communications network can be applied to all VAV fan systems, controls, and protocols.
2.4.6 Recommendations The program administrator recommends additional testing and evaluation on the existing pilot project and an expansion of the demonstration program to other sites. Additional analysis is also recommended on whole building power and duct noise data. A more detailed comparison is needed to compare the benefits of Slice PAS with competing products/techniques used by HVAC engineers and building operators. Computer models such as EnergyPlus can be used to simulate and forecast performance for various building load conditions. Hourly modeling of building energy loads/performance could help validate technical/economic feasibility across a wide spectrum of building and climate conditions. The results of modeling work could be used to ascertain potential participation in utility emerging technology and energy efficiency resource programs. They may also provide a pathway for potential inclusion in the California Energy Commission’s new building energy efficiency standards (for example, Title 24).
33

Finally, additional testing is needed for the FastDR features of the Slice PAS to determine the precise amplitude and duration of ramping. Optimization algorithms are needed to help define various operational modes to achieve desired financial and environmental benefits, namely, energy efficiency and demand response. These characteristics, along with a more in-depth review of current CAISO ancillary services and preferred resources programs, would help define the conditions under which the Slice PAS would be most financially valuable as a grid balancing resource.
After taking into consideration (1) research findings in the grant project, (2) overall development status, and (3) relevance of the technology to California and the PIER Program, the program administrator has determined that the proposed technology should be considered for subsequent funding within the PIER Program.
Receiving subsequent funding ultimately depends upon (1) availability of funds, (2) submission of a proposal in response to an invitation or solicitation, and (3) successful evaluation of the proposal.
2.4.7 Benefits to California Public benefits derived from PIER research and development projects are assessed within the following context:
• Reduced environmental impacts of the California electricity supply, transmission, or distribution system
• Increased public safety of the California electricity system
• Increased reliability of the California electricity system
• Increased affordability of electricity in California
The primary benefit to the ratepayer from this research is increased affordability of electricity in California. The developed concept could potentially reduce fan energy consumption in California by approximately 32 percent, or about 7,292,000,000 kWh per year. This would result in an annual reduction in electric utility bills of over $318 million, assuming an average electricity rate of $0.1311 per kilowatt-hour.6 Annual savings calculations assume average energy usage intensity for supply fans of 0.85 watts per square foot,7 an average occupied period of operation of 4,150 hours per year, and approximately 2.132 billion square feet of commercial building space conditioned with VAV systems in California. 8
6 U.S. Energy Information Administration, Commercial electricity cost for CA = $0.1311/kWh, Electric Power Monthly with Data for Commercial ratepayers, April 2014.
7 U.S. Environmental Protection Agency, Energy Star®, Building Upgrade Manual, 2008. (1998 DOE report) and an average fan power savings of 32 percent.
8 U.S. Department of Energy, A Look at Commercial Buildings in 1995: Characteristics, Energy Consumption, and Energy Expenditures, Energy Information Agency, 1998.
34

Full implementation of this technology could also reduce electric demand in California by about 600 megawatts (MW with an overall reduction of about 1.2 percent. Power consumed by VFD fans could be varied in near real time with no impact to the building occupants. The Slice PAS algorithms can be configured to provide an energy efficiency set point midway between usual and maximum efficiency.
2.4.8 Technology Transition Assessment As the basis for this assessment, the program administrator reviewed the researchers’ overall development effort, which includes all activities related to a coordinated development effort and not just the work performed with EISG grant funds.
Marketing/Connection to the Market During the project, the research team added key management, sales, and marketing positions to assist with product development and commercialization. The technology has also gained considerable interest from industry professionals, channel partners, California utilities, and other stakeholders. The team is currently forming channel installation partnerships and seeking funding to help complete development from other government solicitation opportunities.
The team is collaborating with potential stakeholders to evaluate the most effective process of introducing these products to the market.
Engineering/Technical There are no remaining key technical hurdles to overcome. The researchers estimated that they could complete design and demonstration in less than a year with less than $100,000.
Legal/Contractual The research team received a provisional patent that was filed prior to the start of the EISG project covering the core algorithms and technology that drives the optimization.
Environmental, Safety, Risk Assessments/ Quality Plans There are no obvious environmental or risk issues at this time. Technology risk can be mitigated through additional development and field demonstration work.
Production Readiness/Commercialization The team has prepared a formal commercialization plan and is collaborating with potential stakeholders to evaluate the most effective process of introducing these products to the market.
35

2.5 Cooling Tower Fouling Prevention Through Surface Modification of Fill Media Awardee: Nano Hydrophobics, Inc.
Principal Investigator: Timothy Rost
2.5.1 Abstract Deposition of mineral fouling on cooling tower and heat exchanger surfaces reduces heat transfer, increases weight, and reduces process efficiency, leading to increasing operational costs, the need for cleaning and renovation, and system replacement. Thus, the goal of this research project focused on the evaluation of novel polymeric coatings to treat the active surface of cooling tower and heat exchanger material to reduce the accumulation of mineral-based fouling. The researchers applied novel surface coatings to both PVC coupons and stainless steel tubes to represent cooling tower media and gasketed plate heat exchangers, respectively. Fouling is usually caused by dissolved minerals such as calcium carbonate in the water that precipitate on surfaces at higher temperatures. The experimental approach was to use hard water to enhance the rate of mineral fouling in tests. Initial results demonstrated unanticipated low levels of mineral fouling on PVC test coupons using the experimental design of wet/dry operation. The research team abandoned the development of a laboratory-scale cooling tower and focused instead on the heat exchanger design. Laboratory tests evaluated 11 coating formulations. The researchers determined that coating P, an ultra-low surface energy material, provided a 42 percent reduction in mineral fouling on stainless steel surfaces. This formulation also demonstrated low mineral adhesion, allowing for potential self-cleaning properties. Issues of optimum coating thickness, effects of coating on heat transfer properties, durability, and cost were not evaluated. Additional research is required to advance this technology to commercial application.
Keywords: Anti-fouling, industrial fouling, mineral scale fouling, cooling towers, evaporative cooling, heat exchangers, gasketed plate heat exchangers
36
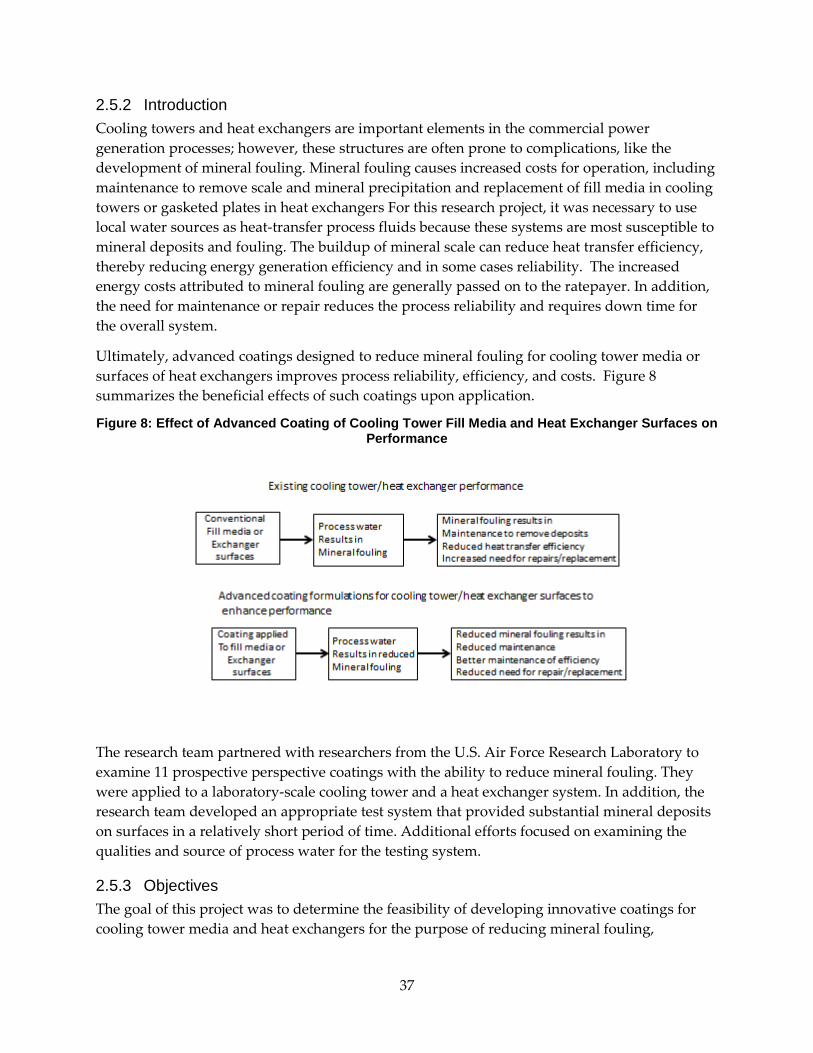
2.5.2 Introduction Cooling towers and heat exchangers are important elements in the commercial power generation processes; however, these structures are often prone to complications, like the development of mineral fouling. Mineral fouling causes increased costs for operation, including maintenance to remove scale and mineral precipitation and replacement of fill media in cooling towers or gasketed plates in heat exchangers For this research project, it was necessary to use local water sources as heat-transfer process fluids because these systems are most susceptible to mineral deposits and fouling. The buildup of mineral scale can reduce heat transfer efficiency, thereby reducing energy generation efficiency and in some cases reliability. The increased energy costs attributed to mineral fouling are generally passed on to the ratepayer. In addition, the need for maintenance or repair reduces the process reliability and requires down time for the overall system.
Ultimately, advanced coatings designed to reduce mineral fouling for cooling tower media or surfaces of heat exchangers improves process reliability, efficiency, and costs. Figure 8 summarizes the beneficial effects of such coatings upon application.
Figure 8: Effect of Advanced Coating of Cooling Tower Fill Media and Heat Exchanger Surfaces on Performance
The research team partnered with researchers from the U.S. Air Force Research Laboratory to examine 11 prospective perspective coatings with the ability to reduce mineral fouling. They were applied to a laboratory-scale cooling tower and a heat exchanger system. In addition, the research team developed an appropriate test system that provided substantial mineral deposits on surfaces in a relatively short period of time. Additional efforts focused on examining the qualities and source of process water for the testing system.
2.5.3 Objectives The goal of this project was to determine the feasibility of developing innovative coatings for cooling tower media and heat exchangers for the purpose of reducing mineral fouling,
37

enhancing self-cleaning, and maintaining heat transfer efficiency. The researchers established the following project objectives:
1. Choose sample formulations based on performance in prior lab tests and other applications
2. Design a test apparatus for control of wet and dry cycling, coupon handling, and water quality management
3. Demonstrate a 10x difference in coupon weight between coated and control fill materials.
4. Duplicate typical industrial conditions on test systems, including constant HE surface temperatures between 48.9°C (120°F) and 60°C (140°F), cooling water velocity of 3 to 6 feet per second, cooling water chemistry with pH 8.0 to 8.5, calcium hardness 600 to 800 parts per million, magnesium 450 to 600 parts per million.
5. Confirm successful coating formulations will achieve at least 50 percent less fouling weight gain than control.
6. Select the three coating formulations from Objective 5 that display the least fouling weight gain.
7. Confirm successful coating material will have 30 percent less weight gain than control sample. Original fill media bundles will weigh about 175 grams. The control sample is expected to double in weight to about 350 grams. A successful test sample would be expected to gain less than 122.5 grams.
8. Confirm successful coating material will have 30 percent better cooling efficiency retention than the control sample at end of test. The control sample is expected to lose 20 percent cooling efficiency during testing. A successful test sample would be expected to decline no more than 14 percent of its original cooling efficiency, an efficiency gain of 30 percent.
9. Demonstrate a 10 percent improvement in coating weight gain compared to weight gain results obtained in Objective 7.
10. Achieve a fill coating material cost of no more than 5 cents per square foot with a 15-year life cycle.
2.5.4 Outcomes The research team performed specified research to address the objectives of the project with minimal success. The project outcomes are as follows:
1. With the assistance of the U.S. Air Force Research Laboratory, the research team selected 11 coating candidates for testing. These included materials in the general categories of ultra-low energy surfaces, super-hydrophilic surfaces, adaptive surfaces, and ultra-soft low energy surfaces. The researchers did not disclose specific formulations, except that
38
they were related to fluorinated polyhedral oligomeric silsesquioxanes. They also did not describe the thermoplastic binder used (including composition or ratio to coating formulation) or the effects of the coating on heat transfer. The researchers did not perform a comparison of the effectiveness of the coating on reducing mineral fouling as a consequence of the specific coating formulations.
2. The researchers constructed and applied test coatings to a laboratory-scale cooling tower apparatus, operated with coupons made from polyvinyl chloride, stainless steel, and copper. The laboratory-scale system performed in both wet and dry conditions, simulating the same operating expectations of a large-scale commercial cooling tower.
3. Results the laboratory-scale cooling tower revealed that the test coupons had accumulated minimal mineral fouling after a 60-day period of operation. The researchers determined weight gain increased by 0.74 to 0.97 percent for the 11 different coatings as compared to 1.04 percent for the uncoated control coupons. The researchers suggested the minimal increase in weight of the coupons in the laboratory-scale cooling tower was a consequence of the temperature of the circulated water which was maintained at 100° F. The research team reasoned that a laboratory-scale heat exchanger would provide for a better system to examine mineral fouling due in part to a significant difference in operating temperature. Therefore, the team abandoned the laboratory-scale cooling tower test as unable to provide useful data within the project period.
4. The researchers designed and tested a laboratory-scale shell and tube heat exchanger test system using a copper tube and acrylic shell. They operated the system at a temperature of 48.9°C (120°F) to 60°C (140°F) and a cooling water flow of 3to 6 feet per second with the experimental hard water formulation. Experiments performed with the laboratory-scale shell and tube heat exchanger and the hard water formulation demonstrated substantially better mineral fouling behavior as compared to the cooling tower coupon test system. The research team determined that the hard water formulation resulted in mineral precipitation within the system prior to the shell and tube heat exchanger. Therefore, the results demonstrated that the original water formulation was unstable and could not be used in the test system. The team then developed alternative sources of process water with better mineral fouling capability. Well water from the Pleasanton and Pittsburg California Water Authorities was used in place of the hard water formulation originally proposed.
5. Laboratory-scale shell and tube heat exchanger experiments demonstrated that out of the 11 test coating formulations, only 3 demonstrated a reduction of greater than 10 percent as compared to the control non-coated tests. Coating designations M and Q demonstrated 14.7 and 19.9 percent reductions in mineral fouling, while coating P reduced mineral fouling by 41.8 percent. Mineral fouling may be assessed by both formation and mineral adhesion. Researchers assessed coating P to provide superior reduction in mineral adhesion allowing the mineral scale to be readily shed from the tube surface and referred to by the research team as self-cleaning. The research team provided no significant data relating the different formulations to the results for
39
resisting mineral fouling in the heat exchanger tests. The team did not examine coating effectiveness, uniformity, thickness, and effects on the overall heat exchanger efficiency, even though the system was instrumented to provide constant temperature data that could have been used for such evaluation. Additionally, the team did not assess the durability of the test coatings. For example, for coating P, the testing period was relatively short with data identifying a test period of only 4 days, 20 hours, and 42 minutes.
6. The research team did not select the best three coating formulations for resisting mineral fouling in the cooling tower system.
7. The researchers did not develop data for reduction greater than 30 percent in mineral fouling as well as better cooling efficiency for coating formulations compared to control for the cooling tower test system.
8. The researchers did not develop demonstration of a 10 percent improvement in weight gain performance since they determined the cooling tower system was inadequate for assessment.
9. The researchers did not determine fill coating material costs and potential life cycle based on the cooling tower system. Data for the shell and tube heat exchanger could have been assessed for coating P based on the available test data. However they did not perform this analysis.
2.5.5 Conclusions The basis for the research project—to reduce mineral fouling, maintain heat transfer efficiency, and reduce capital, operating, and replacement costs for cooling towers and heat exchangers— has the ability to make a substantial impact on energy conservation for commercial applications. The research team set a large number of goals for the project and provided a well-developed plan to accomplish these goals. However, results indicate that none of the original objectives were attained. In addition, the researchers abandoned a large portion of the study involving testing of the cooling tower configuration due to an unanticipated low level of mineral fouling. The research team failed to identify if the alternative well water sample could have influenced mineral development in the cooling tower configuration, much like it did in the heat exchanger configuration. Furthermore, the research team did not evaluate if the temperature difference within the system could have accounted for the minimal mineral fouling in the cooling tower configuration (differential 37.8°C [100° F] and room temperature coupons) as compared to the heat exchanger configuration (53.3°C [128° F] process water and 18.9°C [66° F] cooling water).
The research team failed to adequately describe the different chemical coatings; a comparison of the coating chemistry and a comparison to mineral fouling data for both test systems; and the formulation of the binder along with coating method of coupons and the heat exchanger tube. There was also no evaluation of data on coating uniformity, durability, and effects on heat transfer. Finally, the research team did not attempt to estimate the overall costs for coating the cooling tower media or the shell and tube heat exchanger surfaces. There is no estimate in regard to the potential life cycle for the coating.
40

2.5.6 Recommendations The program administrator recommends that additional research is necessary to develop effective coating technology that helps to reduce mineral fouling in cooling tower and heat exchanger systems. The research team produced a potential formulation, P, which was the most successful coating out of all the tests. This coating formulation may eventually lead to a stable coating that reduces mineral deposition; improve mineral shedding, and self-cleaning properties. Research should be focused on application of binders for coating different materials. Finally, effects on heat transfer efficiency, durability, and application costs for both cooling tower media and heat exchanger surfaces require substantial efforts.
Ultimately, the research team was able to produce a feasibility test which resulted in one promising coating formulation out of the 11 possible. Further research is now needed to examine derivative coating formulations, starting with coating P. Additional derivatives based on this original coating formulation may further improve either mineral fouling or mineral shedding or both. Meanwhile, technical issues related to binder use, uniformity of coating, durability, effects on heat transfer and cost should be addressed.
This study did identify a potential test system useful for evaluation. The shell and tube heat exchanger testing system developed in this project now provides a reliable test system where data may be generated over a relatively short period of time (4-5 days), enhancing the assessment of engineered coatings.
2.5.7 Benefits to California Public benefits derived from PIER research and development projects are assessed within the following context:
• Reduced environmental impacts of the California electricity supply or transmission or distribution system
• Increased public safety of the California electricity system
• Increased reliability of the California electricity system
• Increased affordability of electricity in California
The primary benefit to the ratepayer from this research is increased affordability of electricity in California in regard to the improvement of operation for cooling tower and heat exchanger energy production systems. Reducing mineral fouling of cooling towers and heat exchangers may reduce operational costs, reduce maintenance, and eliminate premature system replacement. In addition, reduced mineral fouling and improved heat transfer efficiency benefits energy production efficiency and reliability. Since this research is fairly new, it is not possible to determine the potential cost savings that associated with the application of advanced coating formulations to reduce mineral fouling.
41

2.5.8 Technology Transition Assessment The program administrator reviewed the researchers’ overall development effort, including all activities related to a coordinated development effort and not just the work performed with EISG grant funds.
Marketing/Connection to the Market The potential for improved operation, reliability, and efficiency from cooling tower and heat exchanger systems with the application of coating formulations able to resist mineral fouling is a substantial market. The research team estimated that the gasketed plate heat exchanger market is $375 million in the United States and $2.45 billion worldwide. System manufacturers and commercial users provide a substantial market for the technology.
Brentwood Industries, a leading manufacturer of cooling tower fill media, has shown interest in this technology, despite its early stage of development.
Engineering/Technical The shell and tube heat exchanger testing system developed in this project provides a reliable method where data may be generated over a relatively short period of time (4-5 days), which enhances the assessment of engineered coatings. The researchers estimated that they could complete the design and demonstration in two years with additional funding of up to $1 million.
Legal/Contractual The research team filed one patent on the coating technology. The research team does not appear to have developed any contractual agreements with commercial partners.
Environmental, Safety, Risk Assessments/Quality Plans Since this research is still in the early stages of development, the research team has not considered environmental, safety, or risk assessments. A quality plan cannot be considered until the optimum coating formulation has been developed and the engineering and technical issues regarding application to cooling tower and heat exchanger materials have been evaluated.
Production Readiness/Commercialization Additional research for laboratory-scale and near commercial-scale testing is required prior to official considering for production readiness or commercialization.
42
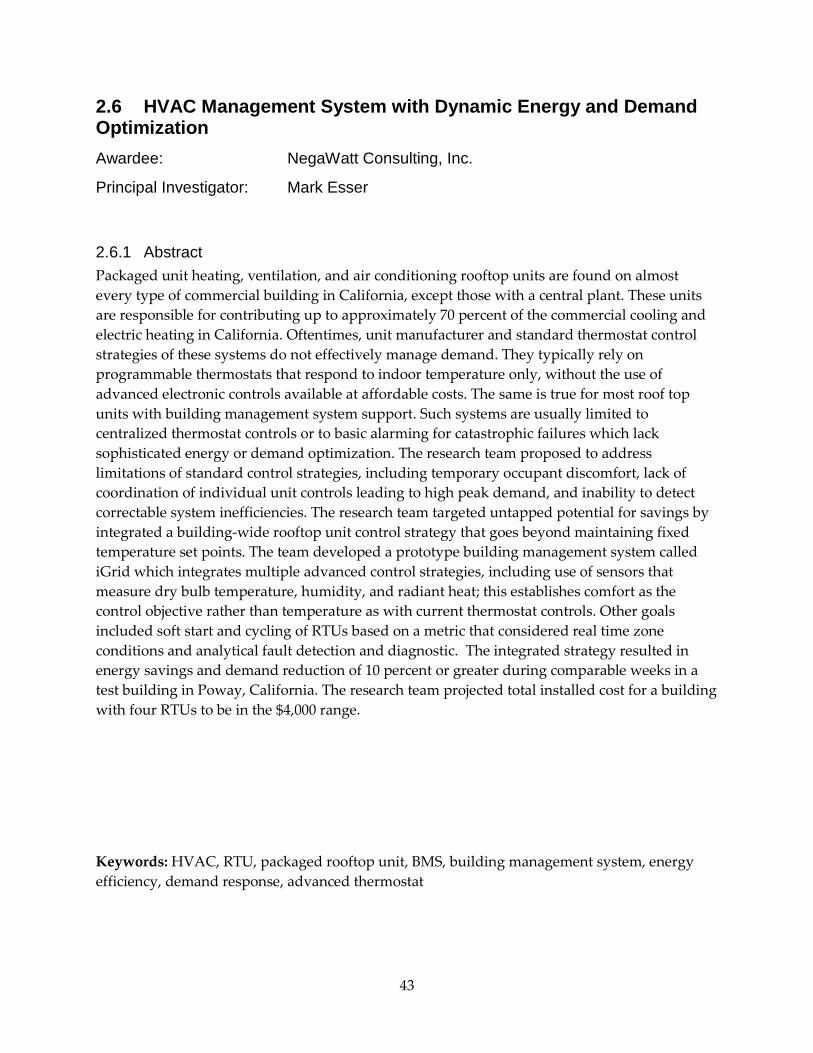
2.6 HVAC Management System with Dynamic Energy and Demand Optimization Awardee: NegaWatt Consulting, Inc.
Principal Investigator: Mark Esser
2.6.1 Abstract Packaged unit heating, ventilation, and air conditioning rooftop units are found on almost every type of commercial building in California, except those with a central plant. These units are responsible for contributing up to approximately 70 percent of the commercial cooling and electric heating in California. Oftentimes, unit manufacturer and standard thermostat control strategies of these systems do not effectively manage demand. They typically rely on programmable thermostats that respond to indoor temperature only, without the use of advanced electronic controls available at affordable costs. The same is true for most roof top units with building management system support. Such systems are usually limited to centralized thermostat controls or to basic alarming for catastrophic failures which lack sophisticated energy or demand optimization. The research team proposed to address limitations of standard control strategies, including temporary occupant discomfort, lack of coordination of individual unit controls leading to high peak demand, and inability to detect correctable system inefficiencies. The research team targeted untapped potential for savings by integrated a building-wide rooftop unit control strategy that goes beyond maintaining fixed temperature set points. The team developed a prototype building management system called iGrid which integrates multiple advanced control strategies, including use of sensors that measure dry bulb temperature, humidity, and radiant heat; this establishes comfort as the control objective rather than temperature as with current thermostat controls. Other goals included soft start and cycling of RTUs based on a metric that considered real time zone conditions and analytical fault detection and diagnostic. The integrated strategy resulted in energy savings and demand reduction of 10 percent or greater during comparable weeks in a test building in Poway, California. The research team projected total installed cost for a building with four RTUs to be in the $4,000 range.
Keywords: HVAC, RTU, packaged rooftop unit, BMS, building management system, energy efficiency, demand response, advanced thermostat
43

2.6.2 Introduction Cooling of commercial buildings accounts for more than 10,000 gigawatt-hours (GWh) of electricity annually in California. Of the total, 7,000 GWh, or about 3.0 percent of the total California consumption is accounted for by commercial building rooftop units (RTUs). Reducing this amount by 10 percent would save California ratepayers nearly $10 billion. Demand reductions compound benefits, but are harder to quantify because they may vary significantly in regard to building load profiles, climate zones, and configuration choices by building operators.
Packaged heating, ventilation, and air conditioning (HVAC) RTUs are found on almost every type of commercial building in California, except those with a central plant. Manufacturer and standard thermostat control strategies of these systems are often significantly older than a decade and produced during a time when energy was less expensive and advanced electronic controls were more costly or not available. This remains true for most RTUs with building management system (BMS) support. Such BMSs are usually limited to centralized/networked thermostat control and/or to basic alarming for catastrophic failures, but they lack sophisticated energy or demand optimization.
Presently, there are newer technologies and programs which make it much easier to implement sophisticated thermostat control strategies for relatively low costs. These programs include: advancements in single board computers, open source and commercial data analytics software, ubiquitous and relatively fast internet, and local wireless mesh networking. On-site central networked hardware and the cloud server, both technologies with significant computing power, allow the HVAC system to be controlled and monitored easily using the web in real time. Control strategy updates can quickly be deployed via the internet.
The researchers’ original goal was to create an affordable small commercial HVAC building management system with zone sensors, a roof-mounted weather station, and a remotely accessible central device. The central device needed to be capable of analog and binary input/output, relay controller switching, and computation. Figure 9, which can be seen below, is a simplified single line diagram for the proposed iGrid system.
The proposed technology advancement consisted of a combination of sensors, on-site controllers, and a cloud-based server designed to be retrofitted in buildings with existing packaged RTUs—preferably rated at five tons or greater. The technology involved the innovative control of RTU fans or compressors, as well as analytical fault detection and diagnostic (FDD) whereby historical temperature, humidity, and run state information were used to alert building operators of non-catastrophic and correctable energy over-consumption.
44
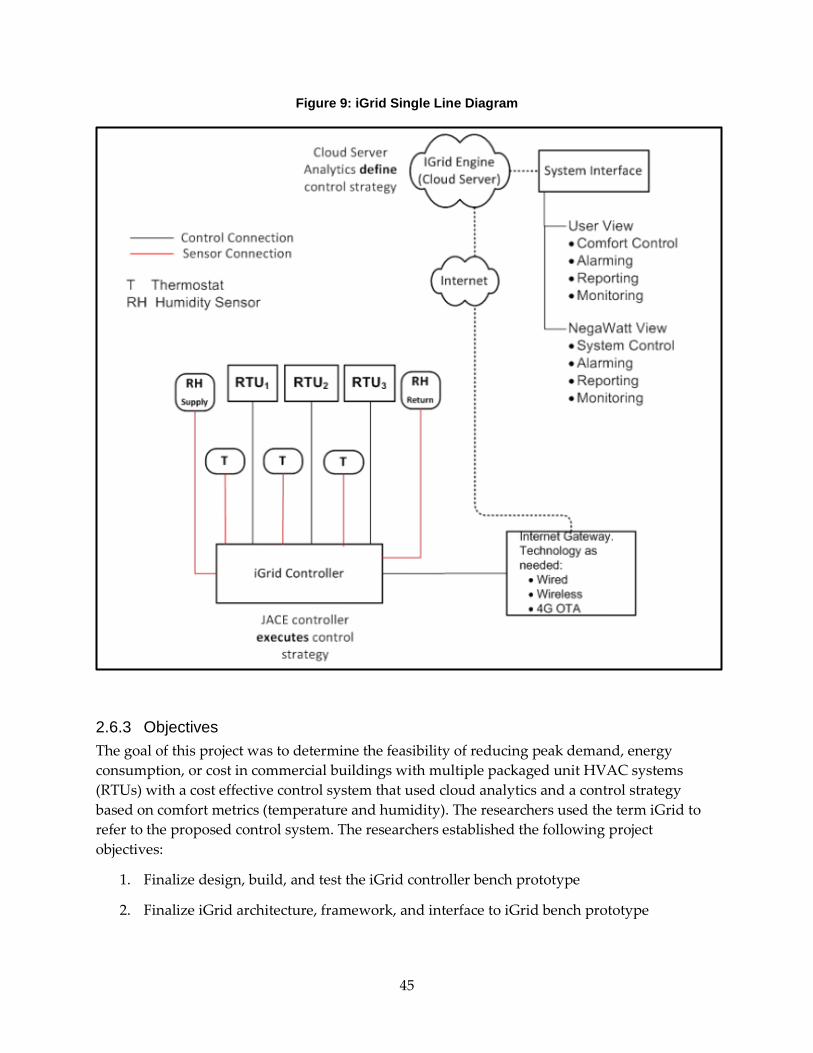
Figure 9: iGrid Single Line Diagram
2.6.3 Objectives The goal of this project was to determine the feasibility of reducing peak demand, energy consumption, or cost in commercial buildings with multiple packaged unit HVAC systems (RTUs) with a cost effective control system that used cloud analytics and a control strategy based on comfort metrics (temperature and humidity). The researchers used the term iGrid to refer to the proposed control system. The researchers established the following project objectives:
1. Finalize design, build, and test the iGrid controller bench prototype
2. Finalize iGrid architecture, framework, and interface to iGrid bench prototype
45
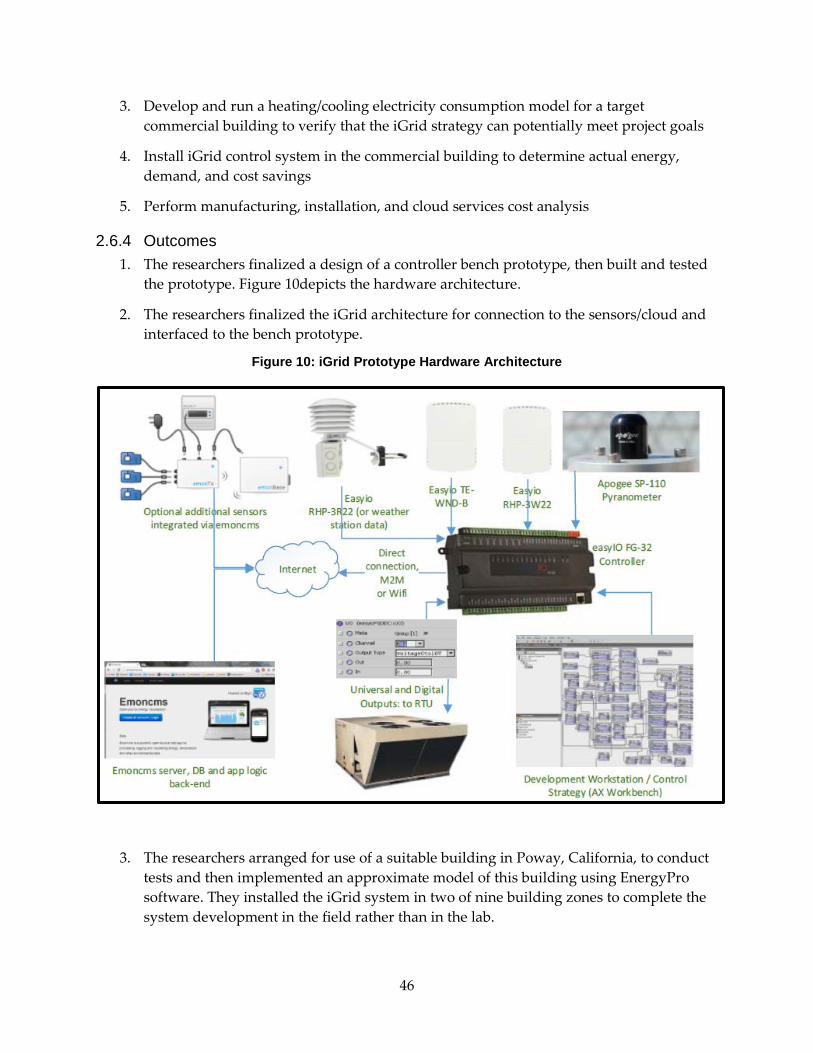
3. Develop and run a heating/cooling electricity consumption model for a target commercial building to verify that the iGrid strategy can potentially meet project goals
4. Install iGrid control system in the commercial building to determine actual energy, demand, and cost savings
5. Perform manufacturing, installation, and cloud services cost analysis
2.6.4 Outcomes 1. The researchers finalized a design of a controller bench prototype, then built and tested
the prototype. Figure 10depicts the hardware architecture.
2. The researchers finalized the iGrid architecture for connection to the sensors/cloud and interfaced to the bench prototype.
Figure 10: iGrid Prototype Hardware Architecture
3. The researchers arranged for use of a suitable building in Poway, California, to conduct tests and then implemented an approximate model of this building using EnergyPro software. They installed the iGrid system in two of nine building zones to complete the system development in the field rather than in the lab.
46

4. The researchers installed the iGrid system in all nine zones, and a third party consultant evaluated it on behalf of San Diego Gas & Electric (SDG&E) and completed savings calculations for six of the nine zones. All data was collected at one minute intervals over a two week period for the baseline and over a five week period under iGrid control. The consultant determined that iGrid control reduced several components including compressor and fan run times during unoccupied hours, the amount of heating consumption during morning warm-up, cycling during afternoon cooling period, and overall compressor consumption in the cooling mode. Five of the RTUs achieved savings. The combined savings of the six units totaled 29 percent of estimated baseline kWh consumption during the test period. The test did not show significant peak demand reduction during the afternoon peak period. A surprise outcome was the extent of energy savings resulting from fault detection and diagnostic benefits (FDD). This could account for actual savings that exceed the project goal.
5. The researchers used the direct costs of the system materials and labor for the test site installation to estimate direct costs at typical future buildings. Based on project experience, they estimated that original combined cost targets for manufacturing, installation, and cloud service were achievable.
2.6.5 Conclusions 1. During the design and construction of the controller bench prototype, the researchers
learned the potential for improved control of rooftop heat pump units that dominate the market for cooling office buildings and other similar buildings. The potential exists primarily because it is now possible to process inputs from multiple sensors in the cloud and to adjust control set points in real time according to strategies that manage for comfort, rather than just indoor temperature.
2. The architecture chosen by the researchers proved feasible could be improved as commercial experience accumulates; however, San Diego may not be the best market in which to develop commercial experience since the utilization factors for heating and cooling equipment may be significantly higher in other regions, particularly those that experience higher humidity and higher numbers of heating and cooling days.
3. The decision to complete controller development in the field suggested that further improvements in the product might require additional field tests across a wider array of climates and building uses to create a product that could be deployed without costly factory technical assistance or installer training.
4. A key benefit of the control system tested was its ability to coordinate multiple units to limit maximum demand. However, the lack of demonstrated demand reduction during peak periods suggests the possible need or opportunity for refinement of control strategies and algorithms.
5. Targets for direct costs (installation labor and manufacturing) were met or nearly met. However, market experience suggests that indirect costs of marketing, customer acquisition, and service and product technical support could equal or exceed direct
47

costs, suggesting the need for a commercialization strategy that would minimize both indirect and direct costs.
2.6.6 Recommendations The program administrator recommends that the research team:
1. Develop a commercialization strategy.
2. Identify the most profitable entry market for the iGrid technology.
3. Target, improve assessment, and quantify the full suite of economic benefits, including energy savings, demand charge savings, demand response value, and failure detection and diagnostic benefits.
4. Identify one or more commercialization partners able to more clearly summarize and communicate annual cost savings and returns on investment based on target entry market economics, electricity tariffs, and typical RTU operating scenarios.
5. Secure funding for product development investments that reduce both direct and indirect costs.
6. Repeat the field tests conducted in this project over longer periods to both validate initial findings and evaluate incremental improvements in control strategy, failure detection, and diagnostic capability.
After taking into consideration (1) research findings in the grant project, (2) overall development status, and (3) relevance of the technology to California and the PIER Program, the program administrator has determined that the proposed technology should be considered for subsequent funding within the PIER Program or successor programs.
Receiving subsequent funding ultimately depends upon (1) availability of funds, (2) submission of a proposal in response to an invitation or solicitation, and (3) successful evaluation of the proposal.
2.6.7 Benefits to California Public benefits derived from PIER research and development projects are assessed within the following context:
• Reduced environmental impacts of the California electricity supply or transmission or distribution system
• Increased public safety of the California electricity system
• Increased reliability of the California electricity system
• Increased affordability of electricity in California
The primary benefit to the ratepayer from this research is increased affordability of electricity in California. The researchers estimate that, “Even at a moderate 1 percent market penetration, 10 percent cooling savings figure, the annual energy savings to the state of California, would
48

consist of roughly 7,000 MWh.” At retail prices of $100 to $150 per megawatt-hours, savings could range up to $1 million per year. Much depends on whether the publication of research results will stimulate efforts by manufacturers, integrators, and installers to use the array of newly available technologies deployed by the research team. If this happens, and if savings exceed 10 percent and are compounded by other economic benefits mentioned above, savings could be in the range of $1 million to $100 million.
2.6.8 Technology Transition Assessment As the basis for this assessment, the program administrator reviewed the researchers’ overall development effort, which includes all activities related to a coordinated development effort, not just the work performed with EISG grant funds.
Marketing/Connection to the Market NegaWatt Consulting has a website that refers to the iGrid solution and a list of consulting clients, but there were no other identifiable market connections. The researchers have been working on a pilot project with San Diego Gas & Electric. They are also working with the County of San Diego to demonstrate their technology.
Engineering/Technical The researchers plan to seek additional funding from public programs. They were not clear what additional engineering/technical work they would do.
Environmental, Safety, Risk Assessments/ Quality Plans The researchers had not addressed these areas at the close of this project.
Production Readiness/Commercialization The researchers stated, “Key to commercialization is the development of key industry partners. The project team targeted both major accounts and California-based HVAC integrators, including targeting HVAC contractors in San Diego, Los Angeles, and the Bay Area.” While large coastal cities have significant commercial building electricity usage for cooling, they may not be the best or most opportune entry markets for the iGrid solution.
49

2.7 Crystallization of Electrodeposited CIS Thin Films on Flexible Foil Awardee: InterPhases Solar
Principal Investigator: S. Menezes
2.7.1 Abstract Researchers in this project assessed laser annealing to improve the physical properties of copper indium selenide photovoltaic films. Current low temperature deposition methods result in films with nanocrystalline structures that need high temperature annealing to increase crystal size. This is typically done in reactive atmospheres, often leading to premature delamination from the substrate. No viable roll-to-roll method for producing copper indium selenide photovoltaic cells exists. This project investigated a non-vacuum laser annealing method that could simultaneously improve copper indium selenide properties and facilitate large-scale production of copper indium selenide solar cells. The research team tested several laser systems and characterized the properties of laser annealed copper indium selenide films. The research team did not demonstrate the laser concept feasible under the conditions tested, but it did provide information that might help design a laser annealing system.
Keywords: Thin film photovoltaics, copper indium selenide, CIS, high efficiency, flexible solar cells, electrodeposition, laser annealing, recrystallization
50
2.7.2 Introduction Achieving the California Renewable Portfolio Standard (RPS) requires a decrease in the cost of renewable generated electricity, similar to that of electricity demand patterns. Current renewables, primarily wind, used to satisfy the RPS are relatively expensive and have outputs that correlate poorly with California’s load profile. Solar-to-electric technologies are even more expensive, but they have outputs that are nearly identical in shape and timing with California’s electricity demand, which is heavily influenced by air conditioning loads. Reducing the cost of solar photovoltaics could lead to successful attainment of the RPS at a lower cost to California ratepayers.
One photovoltaic (PV) technology with high conversion efficiency but high cost uses copper indium selenide (CIS) in a thin crystalline film. Current low temperature CIS deposition methods result in films with nanocrystalline structures needing high temperature annealing to increase crystal size. This is typically done in reactive atmospheres and often leads to premature delamination of the crystalline CIS from the substrate. No viable roll-to-roll method currently exists for producing CIS photovoltaic cells for lower cost cells with consistent production.
This project investigated a non-vacuum laser annealing method to enable roll-to-roll production and facilitate large-scale production of CIS solar cells. In the conceptual process, CIS is deposited from solution (see Figure 11), transitions through a small and stacked crystalline structure, and is laser annealed to microcrystalline single layer film. The laser annealing replaces high temperature oven annealing.
Figure 11: Overall Process for Laser Annealing CIS PV Films9
2.7.3 Objectives The goal of this project was to determine the feasibility of using pulsed laser annealing for CIS PV absorbers to create high performance, low cost solar cells. The researchers established the following project objectives:
1. Design and assemble a laser annealing system.
2. Identify CIS laser crystallization conditions.
9 SSE= Single step electro deposition.
51
3. Evaluate effects of laser annealing on grain growth, composition, defect density, and film quality with PEC, X-ray fluorescence (XRF), SEM, XRD, photoluminescence, and I-V plots.
4. Optimize laser annealing conditions based on device performance.
2.7.4 Outcomes 1. The researchers surveyed available commercial lasers. Rather than design and assemble
a laser annealing system, they chose to evaluate the following eight systems:
a. Pulsed excimer 102 KrF (PE102) laser with a power range of 10–1200 mJ/cm2
b. Pulsed Nd:YAG (NYAG) laser output which provided 8 nanosecond (ns) pulses at 266, 355, 532, or 1064 nanometers (nm) with variable power (10, 100 millijoules per square centimeter [mJ/cm]) and pulse frequency
c. Long-λ (1500 nm) pulsed µsec (LλPµs) laser which provided high power with long (µs) pulse duration
d. Mid-λ (527nm) pulsed nsec (MλPns) laser which offered high energies of 100–500 millijoules per square centimeter (mJ/cm2) with 150ns pulses
e. Short-λ (270mm) Fiber (SλF) laser which offered potential low cost
f. Continuous wave 532 YAG (CWYAG) laser which enabled annealing at energy of up to 200 mJ/cm2 and processing time up to 5 minutes
g. Continuous wave micro-sec (CWµs) laser which allowed monitoring the temperature during annealing at 300–600° C (572--1112° F) for 10 s.
h. High power Flash Lamp (FL) which provided ultra-fast heating and similar energy range as PE102 laser, but in ms and multiples
2. The researchers identified several important characteristics: laser wavelength (λ), power range, pulse width and frequency, and substrate cooling and heating. They initially focused on the wavelength and power range and later evaluated pulse duration and frequency. They annealed CIS and substrates using different wavelengths and pulse duration for the eight lasers noted in Outcome 1.
3. The researchers found that different lasers and annealing times produced different degrees of grain growth and CIS decomposition. The researchers identified laser specifications required for CIS crystallization while avoiding decomposition. The researchers analyzed post-processing crystallinity, composition, morphology, and stability. Table 1 shows the effect of laser parameters (exposure, power, and number of pulses) in regard to change in average crystal size for one laser (NYAG).
52

Table 1: Effect of NYAG Laser Irradiation on CIS Crystal Size
4. The researchers evaluated the photocurrent properties of the annealed crystals. They found that uneven laser heating resulted in non-uniform crystal grain boundaries, which then led to current leakage and poor performance. They concluded that more uniform heating, perhaps through use of a larger laser spot, would allow larger and more consistent growth with less current leakage.
2.7.5 Conclusions 1. The researchers evaluated eight laser systems. Those with shorter wavelengths
performed better at recrystallization while avoiding delamination and, in some cases, CIS decomposition. Larger irradiation spots and less rapid cooling of the melt would most likely result in more uniform crystal size. The researchers evaluated commercially available laser systems and did not design and assemble a customized laser system as called for in Objective 1. The researchers did not achieve this objective.
2. The parameters of wavelength, exposure size, time of exposure, number of pulses, and power level significantly impacted the crystalline properties. Delamination from substrate and decomposition of CIS were not issues for the laser parameters tested. With larger laser spot size and melt region these factors may become of greater concern. The researchers identified the crystalline properties resulting from the lasers tested and the laser properties necessary to produce an efficient CIS crystalline structure. They concluded that shorter wavelengths are important as well as larger focus area, but they did not identify specific wavelengths or focus area. They noted pre-heating may be necessary to avoid substrate deformation. They concluded that a melt duration of about 100 to 200 nanoseconds (ns) should be sufficient for CIS crystallization from the melt. The researchers concluded that the desirable laser system and corresponding conditions are a short wavelength, high energy pulse (greater than 50mJ/cm2) with a 100 to 200 ns pulse duration, or short duration (less than 25 ns) and high repetition rate (greater than
Sample Laser Irradiation Size change Min mW/cm2 pulses
G104 77 50 92400 -3.2 G105 120 25 144000 3.3
M9C1-1 77 56 92400 3.4 M9C1-2 90 75 108000 6.4 M9C12-
30 63 36000 14.1
M9a12-
120 38 144000 19.5 M9a12-
120 56 144000 21.4
G102 30 63 36000 37.1 G101 40 88 48000 43.9
M9a12-
40 94 48000 55.6 M9C2-2 40 80 48000 74.7 G103 90 69 108000 75.3
53

100 Hz) with large beam size so that heat does not dissipate too quickly. The researchers did not completely achieve this objective.
3. The diverse effects on crystallinity of the various lasers tested suggested sensitivity to precise control of laser outputs (power and wavelength) and focus or beam width on post-processing characteristics. This will impact the feasibility of cost effective and consistent roll-to-roll manufacturing.
4. Non-uniform crystal grain size and grain boundary conditions negatively affect photoelectric properties of the film. The researchers did not optimize laser conditions necessary for high performance crystalline films. The researchers did not meet this objective.
Overall, the researchers demonstrated that laser annealing of CIS on substrate to increase crystal size is technically possible. They did not demonstrate if it is economical feasible or practical.
2.7.6 Recommendations The program administrator recommends the researchers extend their efforts to identify specific laser parameters and associated film properties that will result in high performance CIS photovoltaic films. This should include not only laser wavelength and power, but also substrate preheating, system cooling rate, and processing procedures.
The researchers need to:
• Determine and document the technical requirements for each step in the process to ensure consistent manufacture of quality product.
• Evaluate customer needs.
• Work with industrial laser manufacturers to design and develop appropriate laser equipment and a laboratory-scale processing line.
• Conduct a cost and performance analysis comparing laser annealing to other production processes for CIS cells and other types of PV cells.
• Using the laboratory processing line, determine and document control and quality requirements.
• Develop clear and specific processing protocols and control schemes, including safety lockouts for high output lasers.
2.7.7 Benefits to California Public benefits derived from PIER research and development projects are assessed within the following context:
• Reduced environmental impacts of the California electricity supply or transmission or distribution system
54

• Increased public safety of the California electricity system
• Increased reliability of the California electricity system
• Increased affordability of electricity in California
The primary benefit to the ratepayer from this research would be increased affordability of electricity in California. Given the early technical status of the process and unquantified costs and performance, estimating the magnitude of public benefits is premature.
2.7.8 Technology Transition Assessment As the basis for this assessment, the program administrator reviewed the researchers’ overall development effort, which includes all activities related to a coordinated development effort, not just the work performed with Energy Innovations Small Grant funds.
Marketing/Connection to the Market Solar PV is one of the fastest growing energy sources in the United States, with a compound annual growth rate of greater than 50 percent. The researchers had not conducted a survey to determine consumer interest and any competitive advantage or value proposition of their unique PV production technology.
Engineering/Technical The researchers estimated they will need about $10 million and two years to complete development of this concept.
Legal/Contractual The researchers have several affiliated patents dealing with CIS cells and expect to file an application for the laser annealing process.
Environmental, Safety, Risk Assessments/ Quality Plans There are no known unique environmental or safety risks beyond those associated with industrial high output laser use. The researchers did not address these issues in this project.
Production Readiness/Commercialization The concept is not yet ready for production or commercialization.
55
2.8 Optimum Design of Secondary Optical Element for Concentrating Photovoltaics Awardee: Butler Sun Solutions
Principal Investigator: Kenneth W. Stone
2.8.1 Abstract In this project, researchers developed and demonstrated a method for improving the design of secondary optical elements for concentrating photovoltaic systems. The need for improvement stems from enhanced focus and placement of solar irradiation on photovoltaic cells and less light leakage. Researchers estimated that the levelized cost of electricity for the concentrating photovoltaic systems could be reduced by at least 4 percent, with improved secondary optical elements. To optimize the secondary optical elements design, researchers developed a method of measuring the sun flux distribution on the surface of the cell with and without a secondary optical element; they used an analytical simulation to verify and investigate the effect of the secondary optical elements design characteristics and materials. The researchers conducted on-sun tests of different secondary optical element prototypes and compared their performance to a baseline design. Some prototypes showed 10 percent less light spillage and leakage with an estimated 6 percent reduction in the levelized cost of electricity compared to the baseline design. The researchers intend to publish the improved designs in the public domain and license the simulation software to concentrating photovoltaic manufacturers.
Keywords: Concentrating, photovoltaic, tracking, SOE, beam, flux, LCOE, CPV, spillage
56
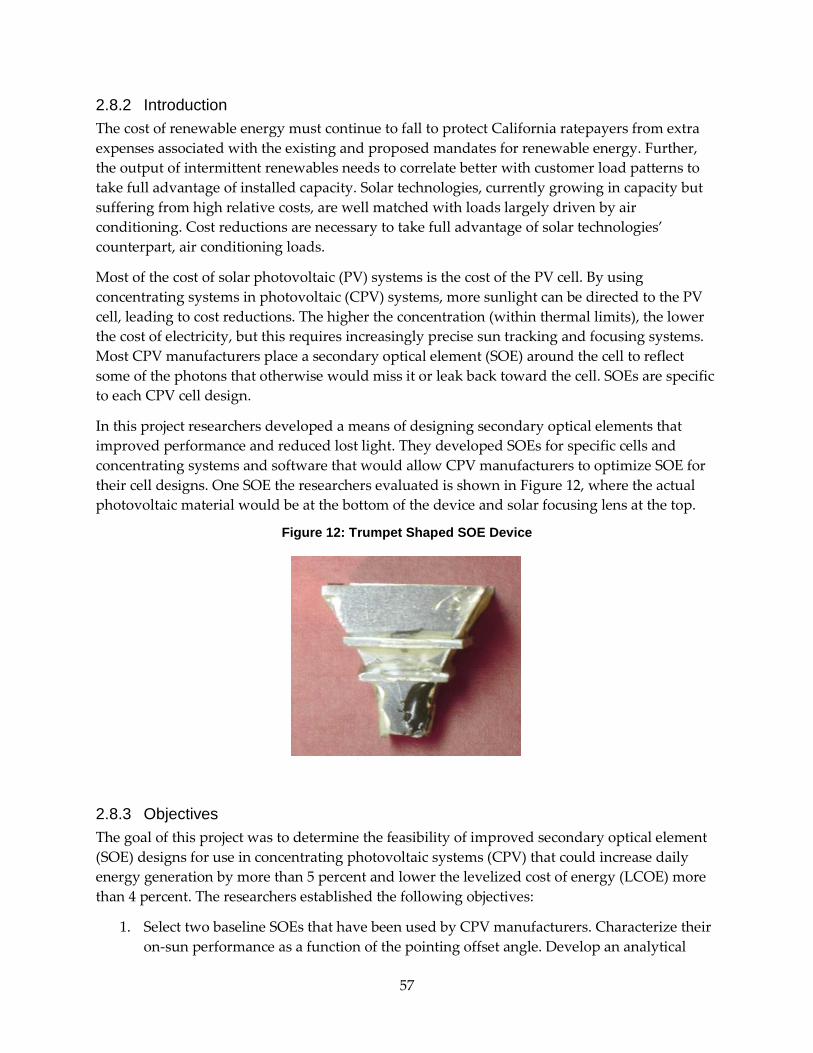
2.8.2 Introduction The cost of renewable energy must continue to fall to protect California ratepayers from extra expenses associated with the existing and proposed mandates for renewable energy. Further, the output of intermittent renewables needs to correlate better with customer load patterns to take full advantage of installed capacity. Solar technologies, currently growing in capacity but suffering from high relative costs, are well matched with loads largely driven by air conditioning. Cost reductions are necessary to take full advantage of solar technologies’ counterpart, air conditioning loads.
Most of the cost of solar photovoltaic (PV) systems is the cost of the PV cell. By using concentrating systems in photovoltaic (CPV) systems, more sunlight can be directed to the PV cell, leading to cost reductions. The higher the concentration (within thermal limits), the lower the cost of electricity, but this requires increasingly precise sun tracking and focusing systems. Most CPV manufacturers place a secondary optical element (SOE) around the cell to reflect some of the photons that otherwise would miss it or leak back toward the cell. SOEs are specific to each CPV cell design.
In this project researchers developed a means of designing secondary optical elements that improved performance and reduced lost light. They developed SOEs for specific cells and concentrating systems and software that would allow CPV manufacturers to optimize SOE for their cell designs. One SOE the researchers evaluated is shown in Figure 12, where the actual photovoltaic material would be at the bottom of the device and solar focusing lens at the top.
Figure 12: Trumpet Shaped SOE Device
2.8.3 Objectives The goal of this project was to determine the feasibility of improved secondary optical element (SOE) designs for use in concentrating photovoltaic systems (CPV) that could increase daily energy generation by more than 5 percent and lower the levelized cost of energy (LCOE) more than 4 percent. The researchers established the following objectives:
1. Select two baseline SOEs that have been used by CPV manufacturers. Characterize their on-sun performance as a function of the pointing offset angle. Develop an analytical
57

optical simulation, and verify the analytical model is within 10 percent of the on-sun test results.
2. Optimize the baseline SOE designs and conduct on-sun testing to verify the power spillage is 5 percent less than the baseline out to a track offset angle of one degree.
3. Using the simulation tool, design and fabricate a dual four-sided SOE, conduct on-sun tests to verify an 8 to 10 percent decrease in the power spillage out to a track offset angle of one degree and to show a 10 percent decrease in peak intensity.
4. Design and fabricate a reduced glass SOE (or fabricate a representative section) and conduct on-sun testing to verify an 8 to 10 percent lower power spillage.
5. Design and fabricate a hyperbolic/trumpet SOE and conduct on-sun testing to verify a 10 percent lower power spillage.
6. Calculate the manufacturing cost of each SOE design and relative change in annual energy performance. Show that several SOE designs are at least 4 percent lower than the LCOE performance baseline.
2.8.4 Outcomes The researchers developed an optical simulation analytic protocol and a method of measuring the beam distribution on the surface of the PV cell.10 Using the measured (on sun) beam distribution, researchers verified that the calculated distribution was nearly identical to the measured distribution, much less than 10 percent difference.
1. The researches optimized the design of the baseline SOEs and fabricated several SOEs for each of two baseline designs. They conducted on-sun tests. They measured as much as a 10 percent decrease in light spillage at pointing offset angles (tracking system accuracy) up to 0.8 degrees between the baseline SOE design and the optimized design.
2. The researchers designed and fabricated a simple, dual four-sided SOE and conducted on-sun tests measuring the beam distribution. The researchers found the four-sided dual SOE provided a slightly more even flux distribution over the cell when at the zero pointing error than the baseline design, but as the pointing offset angle was increased, the Isc (short circuit current) spillage increased at a higher rate than the baseline SOE. The researchers dropped this configuration from further consideration.
3. The researchers found through initial testing that a glass SOE showed promising performance, but they estimated the cost as too high. They rejected this configuration, but in the latter part of the project they found a low cost glass lens. They fabricated several SOE configurations and conducted on-sun tests. They measured decreases in
10 The impact on efficiency and output of concentration is partly a function of how even the focused beam is across the surface of the cell.
58
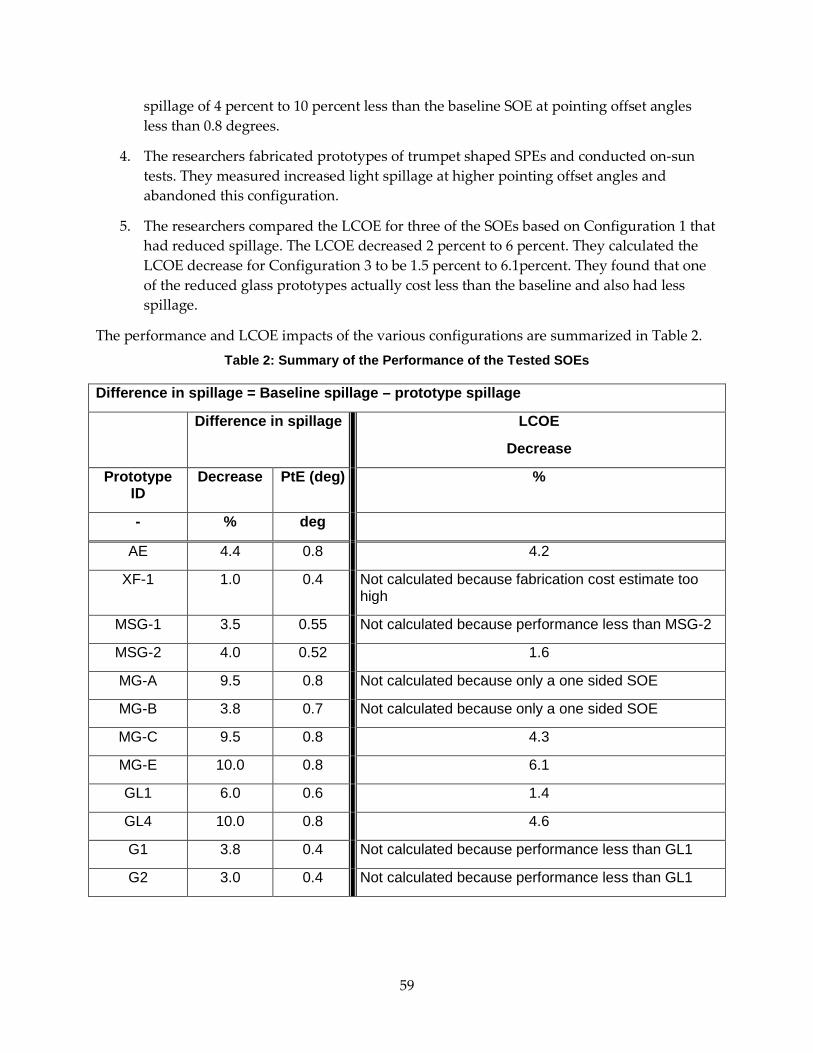
spillage of 4 percent to 10 percent less than the baseline SOE at pointing offset angles less than 0.8 degrees.
4. The researchers fabricated prototypes of trumpet shaped SPEs and conducted on-sun tests. They measured increased light spillage at higher pointing offset angles and abandoned this configuration.
5. The researchers compared the LCOE for three of the SOEs based on Configuration 1 that had reduced spillage. The LCOE decreased 2 percent to 6 percent. They calculated the LCOE decrease for Configuration 3 to be 1.5 percent to 6.1percent. They found that one of the reduced glass prototypes actually cost less than the baseline and also had less spillage.
The performance and LCOE impacts of the various configurations are summarized in Table 2. Table 2: Summary of the Performance of the Tested SOEs
Difference in spillage = Baseline spillage – prototype spillage
Difference in spillage LCOE
Decrease
Prototype ID
Decrease PtE (deg) %
- % deg
AE 4.4 0.8 4.2
XF-1 1.0 0.4 Not calculated because fabrication cost estimate too high
MSG-1 3.5 0.55 Not calculated because performance less than MSG-2
MSG-2 4.0 0.52 1.6
MG-A 9.5 0.8 Not calculated because only a one sided SOE
MG-B 3.8 0.7 Not calculated because only a one sided SOE
MG-C 9.5 0.8 4.3
MG-E 10.0 0.8 6.1
GL1 6.0 0.6 1.4
GL4 10.0 0.8 4.6
G1 3.8 0.4 Not calculated because performance less than GL1
G2 3.0 0.4 Not calculated because performance less than GL1
59

2.8.5 Conclusions 1. The simulation model calculated irradiance and beam distribution with accurate and
precise results, with a difference of less than 10 percent from measured results. The researchers achieved this objective.
2. The performance of the baseline SOEs, as measured by spillage, could be improved by as much as 10 percent to a pointing offset of one degree. The researchers achieved this objective.
3. The simple dual four-sided SOE as designed and tested failed to improve performance compared to the baseline SOE. The researchers completed this objective, but did not achieve performance objectives for this design.
4. Reduced glass SOE improved cost and performance with lowered spillage of between 4 and 10 percent at offset angles under 1 percent. The researchers achieved this objective.
5. The trumpet shaped SOE improved spillage at center aiming point, but performance quickly degraded as offset increased. The researchers completed this objective but did not meet performance objectives.
6. The LCOE of CPV can be improved by as much as 6 percent compared to baseline designs by optimizing secondary optical element geometry and makeup. Daily electrical output can also be increased. The researchers completed this objective.The researchers demonstrated the feasibility of improving secondary optical element (SOE) designs for use in concentrating photovoltaic systems (CPV).
2.8.6 Recommendations The program administrator recommends that the researchers:
• Work with CPV manufacturers to determine impacts, if any, on the manufacturability of CPV cells modified for an optimal SOE.
• Evaluate improvements in primary optical element(s) that may reduce the need for performance improvements in secondary optical elements.
• Extend testing with on-sun evaluations of optimized reduced glass SOE after specific design modifications are made and incorporated into the simulation model.
• Fabricate a number of cells with modified SOE and complete extended field testing, documenting the results of side-by-side comparison with baseline SOE.
• Write a detailed specification for the glass SOE defining the shape, size, glass quality, and transmittance, and obtain bids for mass production from a glass manufacturer.
• Include glass SOE design characteristics in their simulation program.
After taking into consideration (1) research findings in the grant project, (2) overall development status, and (3) relevance of the technology to California and the PIER Program,
60

the program administrator has determined that the proposed technology should be considered for subsequent funding within the PIER Program.
Receiving subsequent funding ultimately depends upon (1) availability of funds, (2) submission of a proposal in response to an invitation or solicitation, and (3) successful evaluation of the proposal.
2.8.7 Benefits to California Public benefits derived from PIER research and development projects are assessed within the following context:
• Reduced environmental impacts of the California electricity supply or transmission or distribution system
• Increased public safety of the California electricity system
• Increased reliability of the California electricity system
• Increased affordability of electricity in California
The primary benefit to the ratepayer from this research is increased affordability of electricity in California. Current CPV levelized cost of electricity is 8 to 15 cents per kilowatt-hour in high solar regions. The promised improvement of 6 percent from this project would reduce that cost to perhaps 7 to 14 cents. Assuming a market penetration of 6,000 MW in California, and inclusive of the 5 percent increase in output, this would result in an overall savings of $210 million per year.
2.8.8 Technology Transition Assessment As the basis for this assessment, the program administrator reviewed the researchers’ overall development effort, which includes all activities related to a coordinated development effort, not just the work performed with EISG grant funds.
Marketing/Connection to the Market The researchers plan to publish the results of their efforts in the public domain. They expect to license the optimization system to CPV manufacturers. They will need to complete in-field on-sun performance tests before marketing to CPV manufacturers.
Engineering/Technical The researchers estimated that they could complete development and demonstration in less than two years with additional funding of about $100,000.
Legal/Contractual The researchers have not applied for nor do they plan to apply for patents. They intend to publish their findings and release them into the public domain. The program for computer simulation and SOE optimization may be licensed to manufacturers of CPV equipment.
61

Environmental, Safety, Risk Assessments/Quality Plans There are no environmental or safety concerns with the concept of improved SOE or the simulation software. Quality assurance of modified designs can be accomplished through normal protocols used in the CPV industry.
Production Readiness/Commercialization The software product is ready for commercialization after making it user-friendly for designers at CPV manufacturing companies and inclusion of glass SOE characteristics. The improved SOE features will not be commercialized per se but released into the public domain.
62
2.9 Enhanced Light Extraction Of LEDs Through Ultra-Fast Laser Nano-Fabrication Awardee: Torrey Hills Technologies, LLC
Principal Investigator: Dajun Yuan
2.9.1 Abstract The researchers proposed a new laser ablation surface treatment (LAST) technology to treat Gallium nitride-based LEDs to enhance light extraction. The researchers built a LAST system and prepared and characterized a series of samples of Gallium nitrade-based LEDs. Preliminary results showed a 20 percent enhancement of electroluminescence and nearly a 150 percent enhancement in photoluminescence after treatment. The researchers claimed LAST technology has the following advantages:
• Ultra-fast process (less than 1/10 second)
• Ultra-low cost (5,000 times cheaper than sapphire pre-roughening)
• No ion damage
• Easy to adapt to batch production
• Compatible with current MOCVD technologies
• Good reproducibility, and maskless fabrication
Not all of these advantages were demonstrated in this project.
Keywords: Laser, interference, GaN, LEDs, nano-fabrication
63
2.9.2 Introduction Gallium nitride (GaN)-based light-emitting diodes (LEDs), when properly deployed, could change the lighting landscape by increasing lighting efficacy and the length of the replacement cycle.
Scientists at the Fraunhofer Institute for Applied Solid State Physics (IAF) in Freiburg, Germany, have increased the light output of GaN LEDs. The luminous flux of commercial LED retrofit lamps featuring silicon components is around 1,000 lumens, the unit used to measure the light produced. Researchers from the IAF have been successful in increasing this to 2,090 lumens. Components made of GaN can operate at higher currents, voltages, and temperatures than standard silicon transistors.
While GaN LEDs can operate at higher temperatures, heat plays a role both in the brightness and the service life of GaN LED lamps. One of the key technical problems with GaN-based LEDs is heat management. This is due to their temperature-dependent performance. The LED's emission power decays exponentially with rising temperature, resulting in substantial changes in luminous efficacy and color stability. As a result, LEDs are designed to run at low currents with configurations enabling fast heat dissipation. Achieving high luminous output usually requires multi-diode assemblies, leading to higher installation cost.
Heat generated in LEDs comes primarily from two sources, joule heat and light absorption, of which the latter is more curable. Semiconductor materials III-V typically have very high refractive indexes (RI). The RIs of GaN and AlGaInP are 2.4 and 3.5, respectively, which result in high total internal reflection (TIR) and very small values of light escape cone. For example, even in contact with an epoxy capsulation (RI=1.5), only 4.0 percent of the light generated in AlGaInP can escape from the top at the first reflection. At the GaN/air interface, 15 percent of the light can escape from the top at the first reflection. For both vertical and flip-chip designs, photons that propagate sideways have even less chance to escape, due both to the thin film configurations and to high extinction coefficients. Trapped light eventually turns into heat. The TIR reduces the light extraction efficiency (LEE) directly. Temperature rise reduces the internal quantum efficiency (IQE). Thus the LED external quantum efficiency (EQE) is doubly reduced.
Two-dimensional (2-D) periodic dielectric structures have been developed for light emitting applications to modify spontaneous recombination and photon confinement or extraction. For the proper management of generated photons in the LEDs, the confinement of photons in the naturally formed waveguide structures must be disturbed. Therefore the improvement in LEE while not compromising IQE, electrical characteristics of the diodes, and controllability and throughput of fabrication process are of critical importance. In efforts to enhance the LEE in LEDs, various schemes and techniques have been developed, including patterning of substrates under the epitaxial structures, roughening of light-emitting surfaces, shaping of LED chips, and incorporation of photonic crystals. While these approaches improve the LEE of III-nitride (III-N)-based visible and white LEDs, they are also accompanied by drawbacks associated with the process applied.
64
In this project, researchers used direct laser interference patterning (LIP) as a simple, yet effective technique to achieve controlled periodic structures on a semiconductor surface. LIP has been utilized in the past to fabricate surface microstructures through a simple and fast process. The interference of two or more high-power pulsed laser beams allows direct creation of surface features with well-defined periodic arrays on the surfaces of polymers, metals, and semiconductors. The laser interference ablation technique using interference of three laser beams needs only a simple preparation step, while the conventional plasma dry etching and photolithography methods require additional steps using a mask. This permits rapid fabrication of the surface patterns with high design flexibility. In addition, relatively large areas can be directly patterned in a short time by manipulating the configuration of the laser beam optics. In this project the researchers focused on direct patterning by laser ablation applied to visible LEDs. They claimed that this technology could be further applied to the formation of photonic crystals and other meta-material periodic structures.
2.9.3 Objectives The goal of this project was to determine the feasibility of using laser interference ablation nano-fabrication to enhance light extraction from GaN-based LEDs. To fulfill the goal, the researchers created the following objectives:
1. Build a LAST test system to achieve surface coverage of 1—200 mm2, achieve ablation depth of 0—500 nm, and design a scanning system that can process 24,000 chips/min.
2. Demonstrate the LAST system by fabricating a series of GaN LED samples. Prepare 300 InGaN/GaN samples with varied surface coverage ratio. Plot diagram of luminescence intensity vs. surface coverage from 0—80 percent.
3. Characterize the patterned InGaN/GaN LED samples. Plot diagram of temperature vs. ablation surface coverage ratio from 0—80 percent. Determine the optimal range of coverage. Demonstrate that EL output can be enhanced by at least 50 percent.
4. Analyze data and optimize system costs. Quantify luminescence enhancement. Determine the optimal treatment conditions. Demonstrate that the manufacturing cost of a single LAST unit can be controlled below $280,000. Confirm from the project findings that the operation cost can be controlled to below 0.0001¢/chip.
2.9.4 Outcomes 1. The LAST system had enough power to pattern up to a 70 cm2 area. Researchers
demonstrated the pattern depth could be up to 1 µm, the laser system could generate 10 pulses per second, and theoretically the laser system could pattern 3.5 two-inch wafers per pulse. Each LED chip is about 0.5mm×0.5mm. The researchers estimated they could pattern 126,000 chips per minute with this system.
2. The researchers prepared more than 300 LED samples to demonstrate the LAST system and to optimize fabrication parameters. They conducted photoluminescence tests for LED samples with different topographies.
65

3. The researchers characterized all samples with SEM, AFM, PL, and EL. They demonstrated the highest extraction could be achieved when the pattern period is 400 nm—550 nm and the pattern depth is 90 nm—100 nm. For cost reasons, the researchers selected only two LED sample wafers for the EL tests. The highest enhancement of the LED samples they achieved was about 20 percent.
4. The researchers developed a numerical model based on the finite-difference time domain (FDTD) method for predicting the photon behaviors within and outside LEDs with photonic crystal structures. They found the LAST process can be imbedded in the LED chip fabrication process right after the MOCVD growth of GaN wafers. The cost of the laser system was around $100,000, and the cost of the optical and scanning system could be under $110,000. The researchers estimated that the cost of the whole system could be below $280,000. The operation cost is the depreciation of the equipment and the electricity costs. The system is capable of fabricating 7.5 million chips per hour. The electricity cost and the depreciation of the laser and scanning system is less than $1/hour. The operation cost is far less than 0.001¢/chip
2.9.5 Conclusions 1. The researchers exceeded the goal for surface area coverage and achieved double the
goal of ablation depth. Their throughput estimate was considerably higher than the goal they set. They achieved this objective.
2. The researchers performed the work, but it is not clear if they measured luminescence intensity vs. surface coverage from 0—80 percent.
3. The researchers did not achieve the objective of 50 percent enhanced EL. Instead they measured 20 percent.
4. The researchers met the cost goals set in the objective. Of course, actual costs may vary from their estimates.
The researchers' LAST technology could benefit the LED manufacturing industry by providing it advanced surface treatment tools that could make LED products brighter, cooler, and more energy efficient.
2.9.6 Recommendations The program administrator recommends that the researchers:
• Determine why they did not achieve the projected EL enhancement. Optimize the technology and retest to verify improved enhancement.
• Build a fully functioning prototype and test it.
• Protect the intellectual property. Perform a patent search.
• Secure an industrial partner.
66

• Compare the improvements in performance with those of competing technologies such as etching.
• Conduct market analysis.
After taking into consideration (1) research findings in the grant project, (2) overall development status, and (3) relevance of the technology to California and the PIER Program, the program administrator has determined that the proposed technology should be considered for subsequent funding within the PIER Program.
Receiving subsequent funding ultimately depends upon (1) availability of funds, (2) submission of a proposal in response to an invitation or solicitation, and (3) successful evaluation of the proposal.
2.9.7 Benefits to California Public benefits derived from PIER research and development projects are assessed within the following context:
• Reduced environmental impacts of the California electricity supply or transmission or distribution system
• Increased public safety of the California electricity system
• Increased reliability of the California electricity system
• Increased affordability of electricity in California
The primary benefit to the ratepayer from this research is increased affordability of electricity in California. The LAST technology could reduce LED manufacturing cost and substantially increase light output, which could accelerate market acceptance of LED lighting. According to the U.S. Department of Energy, the widespread adoption of LED lighting could result in a cumulative energy savings of 2,700 TWh over the next 20 years. In monetary terms this equals about $250 billion of national saving at current energy prices and represents a greenhouse gas emission reduction of 1,800 million metric tons of carbon. Each California ratepayer would save about $40 per year (about $3.33 per month), resulting in a saving of $29.9 billion for the State over 20 years. The cost to replace all lighting with LEDs would have to be significantly less than it is in 2015 for the average ratepayer to invest in LEDs based on such a small payback. However, ratepayers would see other advantages with LED lighting such as instant on, dimmable light, better physical form factors, and no hazardous materials.
LED lighting is rapidly gaining acceptance in the California marketplace in 2015. Less expensive products with higher light output could accelerate that acceptance. The degree that the technology in this project could aid that acceleration is not easy to assess until the technology is fully developed.
67

2.9.8 Technology Transition Assessment As the basis for this assessment, the program administrator reviewed the researchers’ overall development effort, which includes all activities related to a coordinated development effort, not just the work performed with EISG grant funds.
Marketing/Connection to the Market The researchers had not talked to prospective customers nor performed a market analysis by the end of this project.
Engineering/Technical The researchers estimated that they could complete design and demonstration in one to two years with funding of $500,000 to $1 million.
Legal/Contractual The research team had not filed nor received any patents by the completion of this project.
Environmental, Safety, Risk Assessments/Quality Plans The researchers had not completed these studies and plans by the end of this project.
Production Readiness/Commercialization The researchers proposed partnering with some leading LED manufacturers headquartered in the United States, including Cree (Durham, North Carolina), Philips Lumileds (San Jose, California), and GE Lighting (East Cleveland, Ohio).
68
2.10 Model Predictive Smart Lighting Commissioning System for Emerging Demand Management Awardee: University of California, Berkeley
Principal Investigator: Alice Agogino
2.10.1 Abstract The goal of this project was to determine the feasibility of a wireless sensing-enabled rapid indoor lighting commissioning and retrofitting system for energy efficiency and emerging demand response. The researchers designed and built a prototype wireless sensor and tested it for ease of installation and ability to accurately predict and measure the indoor light field. The prototype was powered by a photovoltaic cell with battery backup for system startup and low-light operation. The researchers used a predictive model to enable deployment of approximately 60 percent fewer sensors than are typically needed for state-of-the-art installations. The sensor predicted light levels with 80 to 95 percent accuracy and daylight availability forecasts with 92 percent accuracy. The sensors can be installed in less than 30 minutes for Windows-based operating systems and in about one hour for a Linux system. The researchers did not determine the actual energy savings resulting from the project technology.
Keywords: Wireless sensor network, daylight harvesting, inverse model, clustering, support vector regression, solar powered, demand response, life cycle assessment
69

2.10.2 Introduction According to the United States Department of Energy (U.S. DOE Energy) Yearbook for 2015, lighting accounts for 16.3 percent of commercial energy usage. Research performed by the investigators and others has demonstrated a 50 percent savings potential through wireless control of lighting, with an additional 20 percent savings through daylight harvesting. However, capture of this potential savings has been limited because the systems are expensive to implement or are often disabled by users. The researchers in this project sought to provide a system that would be easy to implement, require little maintenance, require fewer sensors, and accurately assess the light availability to allow for dimming that would be acceptable to users.
The researchers proposed a self-powered wireless sensor. They installed a network of wireless sensors in three facilities to test for ease of installation and light field data accuracy. Sensors transmitted data to a base station for data processing as shown in Figure 13. The researchers used regression algorithms and historical data to process the data and optimize the number of sensors needed for accurate light prediction and validation. The researchers were able to demonstrate an accuracy of 90 percent in indoor light prediction, using only 60 percent of the sensors typically required in state-of-the-art installations. Test users were able to install the sensors in less than 30 minutes for a Windows-based system. The sensors proved to be low maintenance, drawing power from a photovoltaic (PV) cell with battery backup used during system start-up and in low light settings. A three-month test resulted in 7 percent battery depletion, indicating that the sensors could be maintenance free for over one year. The data captured and analyzed could provide input needed for an actuator system that could respond by adjusting luminaire brightness based on user requirements. The actuator system was beyond the scope of this project.
The researchers performed a life cycle cost and energy analysis for the project technology as part of an overall intelligent lighting system. Assuming the lighting system was able to reduce building energy consumption by 70 percent (including 50 percent due to user adjustments and 20 percent due to daylight harvesting), the researchers calculated the environmental payback period to be two working days. Additional environmental benefits could include a savings of up to 23,000 kilotons of equivalent carbon dioxide kt-CO2-eq per year. The researchers did not calculate production costs because they intend to optimize components to reduce size and cost. However they are targeting a total system price point in the range of $100 to $500 to appeal to residential users.
70
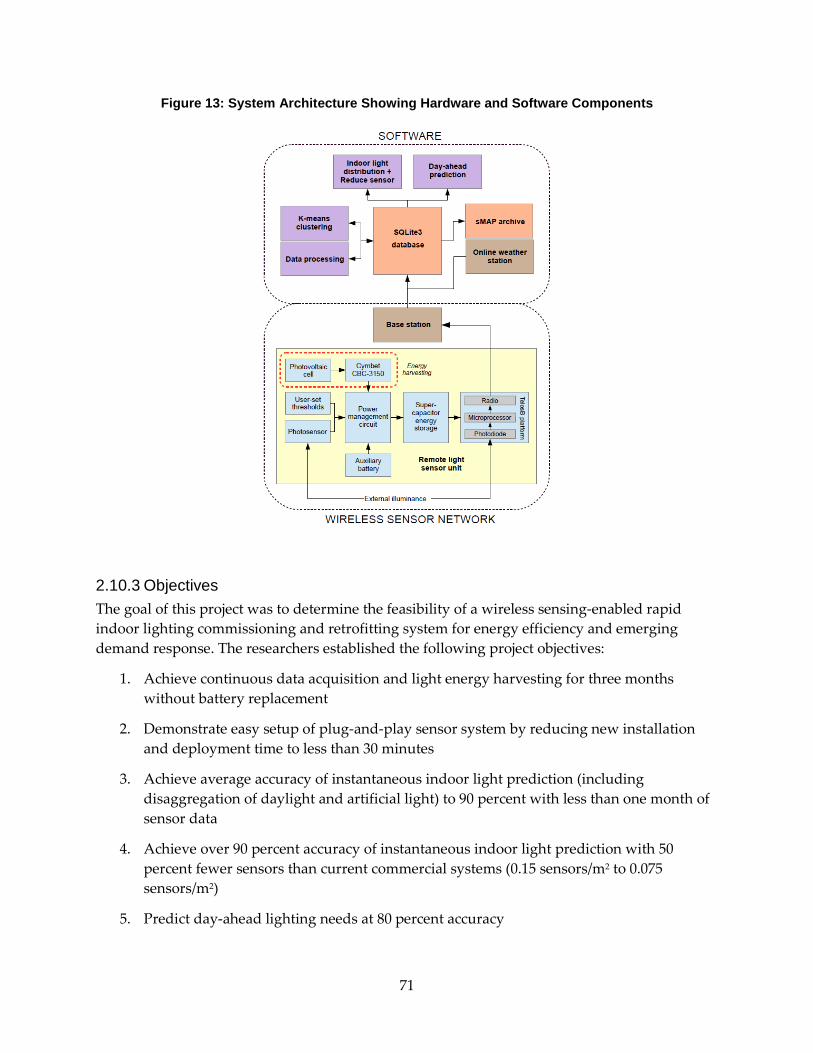
Figure 13: System Architecture Showing Hardware and Software Components
2.10.3 Objectives The goal of this project was to determine the feasibility of a wireless sensing-enabled rapid indoor lighting commissioning and retrofitting system for energy efficiency and emerging demand response. The researchers established the following project objectives:
1. Achieve continuous data acquisition and light energy harvesting for three months without battery replacement
2. Demonstrate easy setup of plug-and-play sensor system by reducing new installation and deployment time to less than 30 minutes
3. Achieve average accuracy of instantaneous indoor light prediction (including disaggregation of daylight and artificial light) to 90 percent with less than one month of sensor data
4. Achieve over 90 percent accuracy of instantaneous indoor light prediction with 50 percent fewer sensors than current commercial systems (0.15 sensors/m2 to 0.075 sensors/m2)
5. Predict day-ahead lighting needs at 80 percent accuracy
71

6. Verify estimated energy savings of 6,000 gigawatt-hours (GWh) per year in California, assuming 10 percent market share
2.10.4 Outcomes 1. Researchers designed remote light sensors using the TelosB platform to collect and
transmit data wirelessly to a base receiver at five-minute intervals. The sensor was powered using a PV cell and auxiliary battery to assist in low light and in system start-up. The researchers optimized transmission period and clock speed to enable operation for one year without maintenance. Testing over a three-month period resulted in a battery voltage drop of 7 percent, indicating sensors could meet the goal to be maintenance free for one year.
2. The researchers installed remote sensors at three separate locations. Speed of installation was assessed at the NASA (National Aeronautics and Space Administration) Ames Research Center. Alpha testing by a single user on a Windows operating system resulted in a scaled-down installation in less than 30 minutes. After modification of installation instructions, four separate users were able to perform installation of the complete system in less than 30 minutes. A single user tested installation on a Linux system and completed installation in over one hour.
3. The researchers predicted and validated light patterns using historical data, time weighted averages, and multiple linear regressions. They developed an algorithm that selected the combination of sensors that most accurately captured the indoor light distribution. Average prediction error ranged from 5 to 15 percent.
4. The researchers determined that only three out of eight sensors were required to sufficiently predict the indoor light field. This represents a 60 percent reduction over state-of-the-art practice in the number of sensors required.
5. The researchers used a support vector regression (SVR) model to predict average light levels. Day-ahead values were predicted based on light levels on three consecutive days. Average accuracy over three days was approximately 92 percent. Temporal distribution of error was within 10 percent for most of the workstations tested.
6. The researchers performed life cycle assessment using Sustainable Minds software. System components needed to monitor lighting needs for a functional unit defined as a 500 square meter office space for one year including two base stations and 28 sensors, shown in Figure 14 below. Researchers estimated standard lighting as 12 kilowatt-hours (kWh) per day, but the researchers anticipated this might be reduced by 70 percent through intelligent lighting (50 percent from user adjustments and 20 percent from daylight harvesting). The Sustainable Minds analysis indicated that environmental payback occurs once the system has reduced energy consumption by 148 kWh, which can occur after two days of use. The researchers estimate the technology could save 23,000 kilograms of equivalent carbon dioxide (kg-CO2-eq) annually. They based energy savings calculations on savings estimates achievable through light control systems determined through research at Lawrence Berkeley National Laboratory, as
72
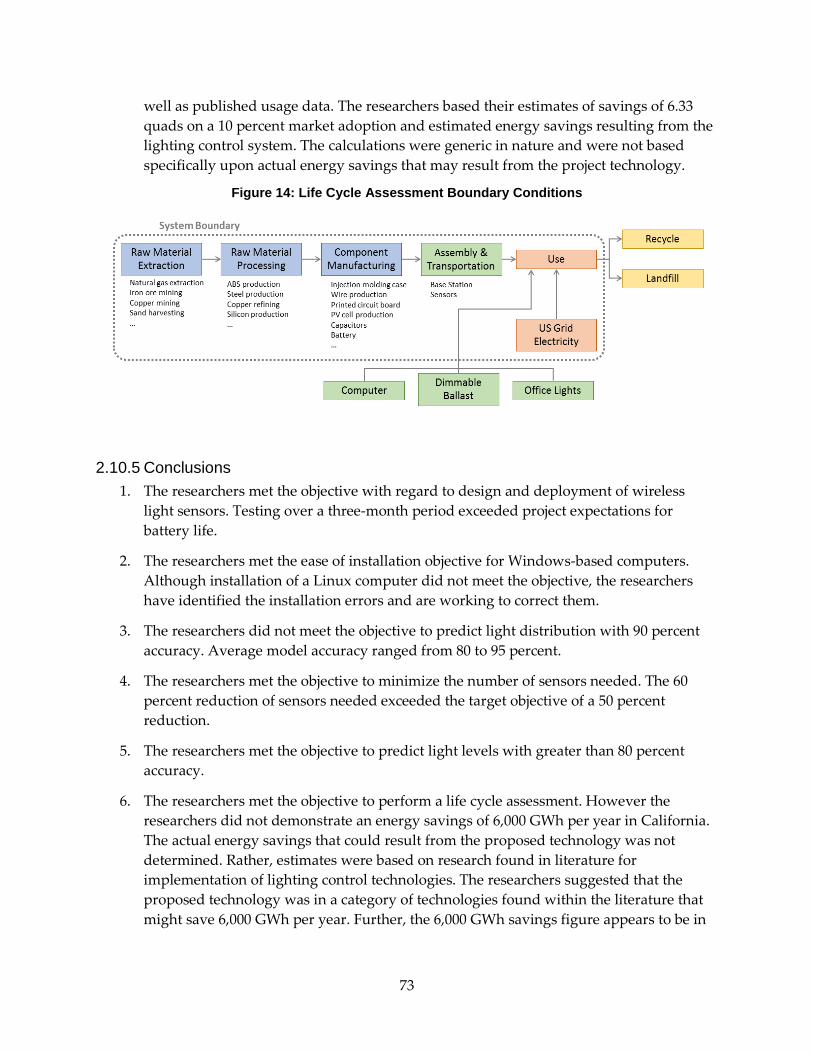
well as published usage data. The researchers based their estimates of savings of 6.33 quads on a 10 percent market adoption and estimated energy savings resulting from the lighting control system. The calculations were generic in nature and were not based specifically upon actual energy savings that may result from the project technology.
Figure 14: Life Cycle Assessment Boundary Conditions
2.10.5 Conclusions 1. The researchers met the objective with regard to design and deployment of wireless
light sensors. Testing over a three-month period exceeded project expectations for battery life.
2. The researchers met the ease of installation objective for Windows-based computers. Although installation of a Linux computer did not meet the objective, the researchers have identified the installation errors and are working to correct them.
3. The researchers did not meet the objective to predict light distribution with 90 percent accuracy. Average model accuracy ranged from 80 to 95 percent.
4. The researchers met the objective to minimize the number of sensors needed. The 60 percent reduction of sensors needed exceeded the target objective of a 50 percent reduction.
5. The researchers met the objective to predict light levels with greater than 80 percent accuracy.
6. The researchers met the objective to perform a life cycle assessment. However the researchers did not demonstrate an energy savings of 6,000 GWh per year in California. The actual energy savings that could result from the proposed technology was not determined. Rather, estimates were based on research found in literature for implementation of lighting control technologies. The researchers suggested that the proposed technology was in a category of technologies found within the literature that might save 6,000 GWh per year. Further, the 6,000 GWh savings figure appears to be in
73

conflict with the stated energy savings of 1.32 quads. See the Benefits to California section for more information.
The researchers were successful in prototyping and testing the proposed wireless sensors. This is the first step toward providing a comprehensive smart lighting system. The next step will require development of actuators that respond to data collected by dimming or illuminating lights in response to available daylight. The researchers have effectively demonstrated the ability to reduce the number of sensors needed to predict the light field in comparison to state-of-the-art systems. This reduction in hardware and corresponding reduction in system cost could contribute to eventual adoption of smart lighting systems in residential settings.
2.10.6 Recommendations The program administrator recommends that the following tasks be completed:
1. Optimize hardware components to reduce sensor cost and size.
2. Design and develop a purpose-built base station.
3. Design and develop the dimming light actuator to respond to the proposed technology.
4. Perform a hardware cost analysis and evaluate residential usage potential.
5. Perform a patent search to determine infringement of existing patent art.
6. Determine any comparative advantage in energy saving over other lighting control systems either in the market place or in the development stages.
2.10.7 Benefits to California Public benefits derived from PIER research and development projects are assessed within the following context:
• Reduced environmental impacts of the California electricity supply or transmission or distribution system
• Increased public safety of the California electricity system
• Increased reliability of the California electricity system
• Increased affordability of electricity in California
The primary benefit to the ratepayer from this research is increased affordability of electricity in California. The researchers presented generalized environmental and energy savings benefits. They determined environmental cost benefits using a life cycle analysis. See Objective 6. The proposed technology has the potential to save 23,000 kg-CO2-eq in emissions and has an environmental payback period of two working days. Energy savings estimates were based on unrelated research performed by the Lawrence Berkeley National Laboratory for similar lighting control infrastructures.
74

The researchers did not describe specific similarities and differences between these infrastructures and the proposed technology. They assumed that 70 percent of office buildings and educational buildings do not have intelligent lighting systems and would thus serve as the target market.
A literature review indicated that these buildings have a total lighting and cooling consumption demand of 6.33 quads British thermal units (Btu). The researchers made assumptions regarding energy savings that led to system savings of 1.32 quads Btu. Elsewhere in their final report the researchers stated savings of 6,000 GWh, assuming a 10 percent market share, but they did not present supporting calculations.
Before benefits to California can be estimated, the researchers must determine the comparative advantage of their system over existing lighting control systems. The researchers did not provide sufficient data for this determination.
2.10.8 Technology Transition Assessment As the basis for this assessment, the program administrator reviewed the researchers’ overall development effort, which includes all activities related to a coordinated development effort, not just the work performed with EISG grant funds.
Marketing/Connection to the Market The researchers have not yet performed a formal market analysis. The market includes commercial and, potentially, residential lighting installations.
Engineering/Technical The researchers have demonstrated the light sensing technology but have not yet defined a development path. The product will likely need to be coupled with an actuation device that will respond to light sensor input. The researchers estimate that it will cost $100,000 to complete engineering, development, and demonstration of the proposed technology.
Legal/Contractual The researchers have not yet performed a patent search.
Environmental, Safety, Risk Assessments/ Quality Plans The researchers do not anticipate any negative effects with regard to public safety or the environment.
Production Readiness/Commercialization The technology is not yet developed sufficiently to pursue commercialization. The researchers have identified a potential strategic partner once the product is ready for commercialization.
75

2.11 New Electromagnetic Method to Map Geothermal Resources Awardee: GroundMetrics, Inc.
Principal Investigator: Dr. A. Hibbs
2.11.1 Abstract In this project researchers adapted an electromagnetic reservoir imaging method recently developed for the oil and gas industry to map the underground features of geothermal energy resources. The researchers used cased well boreholes as the electrical source electrode in electro- telluric surveys. This allowed deeper current penetration than traditional surface electrode methods. This new methodology has the advantage that no downhole access to the well is required, since the borehole casing is electrically connected at the surface.
At an actual geothermal site, researchers tested the new approach to confirm that the produced subsurface map of steam and hot water agreed with existing data for the site. They also used the data to estimate the detection range of the method. The researchers’ new source concept achieved a signal-to-noise ratio adequate for geothermal application and reduced the effect of surface resistivity of traditional surface source placement. The new application requires verification in additional fields and lithographic regimes. It requires existing boreholes (such as slim-hole temperature gradient or existing production wells in a “stepping-out” situation) and is thus not suitable for virgin locations, but it may improve precision and accuracy of underground mapping. It may reduce the cost of production well development by reducing the number of dry wells.
Keywords: Geothermal exploration, geothermal reservoir, subsurface imaging, subsurface mapping, strike rate, electromagnetic, resistivity
76
2.11.2 Introduction Expanded development of renewable energy remains a high priority focus of California’s energy and environmental policies. One potential renewable energy resource that is underused is geothermal energy, due largely to its higher costs relative to other renewables. Geothermal energy provides dispatchable baseload electricity, whereas other renewables do not, energy thus providing higher value to the electrical grid.
Geothermal energy’s higher relative cost is largely due to uncertainty associated with unseen and often small subsurface geologic formations that are costly to drill into. The exploration phase, done after surveying and before drilling, typically begins with gathering data from existing nearby wells and other surface manifestations and goes on to surface and sub-surface mapping using geological, geochemical, and geophysical methods. Geophysical methods include gravity, electrical resistance, magnetotelluric, temperature gradient drilling, and two-and three-dimensional seismic. In general, cost and precision increase going from gravity to seismic methods. The methods are not exclusive, and as exploration continues at a site, efforts start with simpler, cheaper methods and become progressively more complex and costly depending on early results. Electrical resistance is one common early-stage reconnaissance-level exploration technique that requires a source of electrical signals and an array of receivers placed on the ground’s surface. By measuring the resistance of the subsurface features, such as faults and fractures or water, to the electrical signal as it travels downward and is reflected back to the receivers, geophysicists can get a picture of the features’ type, size, and location. Electrical resistance techniques can be improved by decreasing resistance of the source-to-surface connection (owing, for example, to dry ground in desert locations), thereby increasing the proportion of the total resistance due to subsurface features. Electrical resistance methods have been improved through the advancement of electro-magnetic techniques which essentially combine electrical and magnetic properties. A new method used in the oil and gas industry takes advantage of boreholes to inject electric current deep underground. This has been done by lowering a current source electrode into a borehole via a method known as borehole-to-surface electromagnetic (BSEM).
In this project the researchers tested a new proprietary approach of using the entire borehole casing as the current injection electrode. This new methodology, called depth-to-surface electromagnetic (DSEM), has the advantage that no downhole access to the well is needed. This should improve ease of operation as well as improve precision compared to BSEM. The borehole casing can be simply electrically connected at the surface as is shown in Figure 15.
77

Figure 15: Dr. Hibbs Holding the Well Casing During Regular Operation of the DSEM Source
2.11.3 Objectives The goal of this project was to determine the feasibility of a new method for geothermal exploration using a technique modified from the oil and gas industry. The researchers established the following objectives:
1. Set up a radially driven grounded casing source having total contact and ground impedance of 50 ohm (Ω) to allow a source current of up to 20 amps (A).
2. Set up sensor array and acquire BSEM survey data. Achieve sensitivity on 90 percent of the sensors that is within a factor of two of previously acquired data.
3. Process data to extract the normalized amplitude and phase of the surface data and signal-to-noise ratio of 20 in the difference data over a 10 x range of frequency (for instance, 0.5 hertz (Hz) to 5 Hz).
4. Project surface fields from the reservoir model. Produce a forward model with a confidence of 80 percent that the fields fall within the stated range.
5. Compare the projected and measured fields and quantify the agreement. Achieve 50 percent correlation between the projected and measured field profile along the surveyed line.
6. Validate calculation of $162 million savings to California ratepayers. Show that the researchers’ technology can reduce geothermal exploration costs by 20 percent.
78

2.11.4 Outcomes 1. The researchers set up a casing connected source with four transmit signals, which
applied all the current to each transmit electrode individually, and then added the results digitally after the test. Each transmit electrode carried from 12 to 16 amps.
2. The researchers performed a signal averaging study on data acquired at two site locations. They averaged data for 34 minutes and achieved a measurement noise floor of 10-11 V/A for a signal transmitted at 0.5 Hz.
3. The researchers measured the signal-to-noise ratio at all receiver locations in excess of 200. The researchers measured the ratio at the most distant receiver from the transmitter where the signal is normally most faint to be 200.
4. The researchers developed a series of surface field models based upon the geoelectric data for the area. They ran the forward model over a representative range of uncertainty using existing geoelectric data. The researchers determined that the resulting surface fields all fell within 80 percent of the average.
5. The researchers tested a new, proprietary method to normalize the measured data and projected surface fields to remove the effect of near surface resistivity anomalies. They calculated an average fit along the survey line of 90 percent. The average deviation of the measured data from the EM model was approximately 10 percent.
6. The researchers estimated that as much as 42 percent of the cost of a geothermal project is spent on exploration and drilling. They further estimated that a 30 percent reduction in exploration costs could be achieved through use of the casing-connected electrical transmit electrode by improving the success rate of wells drilled.
2.11.5 Conclusions 1. Directly connecting transmit electrodes to a metal borehole casing allows a low
impedance and high amperage electrical signal to be sent through ground formations at up to 16 A. The researchers did not quite meet this objective.
2. Averaging the signal for about half an hour resulted in low noise and high sensitivity. The researchers met this objective.
3. The signal to noise ratio of 200 was better than the project objective of 20. The researchers met this objective.
4. The model that converts field-collected data using the new technique to predicted subsurface features (mapping) correlated with existing data about the site to the 80 percent certainty level. The researchers met this project objective.
5. The researchers’ method achieved 90 percent agreement between predicted and measured data along the sample lines at the site. The researchers met this objective.
6. The researchers have estimated the proportion of project costs attributable to exploration and drilling consistent with data from the International Energy Agency as shown in
79

Table 3. It is not clear that a 30 percent cost reduction in exploration and drilling can be achieved in all cases, or even the 20 percent initial objective, but increased certainty should improve strike rates. The researchers completed this objective but did not conclusively achieve the performance objective.
Table 3: Breakdown of Capital Costs11
Exploration and resource confirmation 10-15%
Drilling 20-35%
Surface facilities 10-20%
Power plant 40-60%
The researchers demonstrated the technical feasibility of the use of borehole casing as a transmit electrode in geophysical exploration of geothermal sites. They have not conclusively demonstrated comparative advantages, including cost competitiveness. The technique has the potential for reducing exploration and drilling costs by increasing certainty about underground geologic features, but it needs further testing and demonstration in varied geologic settings. The technology improves the finding rate for geothermal resources but does not increase the geothermal resource.
2.11.6 Recommendations The program administrator recommends the following actions:
1. Using the technique, the researchers should map known fields that have been mapped with other geophysical techniques and compare the project technology’s performance with that of common techniques. Document side-by-side performance to other geophysical techniques used for geothermal exploration.
2. The researchers should document range and reach of the project’s technology under different geologic situations.
3. The researchers should develop sequencing and cost estimation model for applying the method at other prospective geothermal sites in California, along with the use of other exploration techniques. They should document the best phase during exploration and under what circumstances to use the method, along with project go/no-go criteria.
4. The researchers should work with geothermal developers and financial consultants and investors to identify any technical issues uniquely or more easily solved by the technology.
11 http://www.iea.org/publications/freepublications/publication/Geothermal_Essentials.pdf
80

5. The researchers should work with developers of enhanced geothermal technology to determine the technology’s application to geothermal mapping before and after using enhancement techniques, in other words, virgin and enhanced fields.
6. The researchers should work with safety organizations and regulators to confirm the safety of attaching electricity to well heads in terms of worker safety and necessary safety protocols.
2.11.7 Benefits to California Public benefits derived from PIER research and development projects are assessed within the following context:
• Reduced environmental impacts of the California electricity supply or transmission or distribution system
• Increased public safety of the California electricity system
• Increased reliability of the California electricity system
• Increased affordability of electricity in California
The primary benefit of this research is increased affordability of electricity in California. As California moves to meet a 33 percent renewable portfolio standard, this technology should decrease overall geothermal project costs by increasing exploration phase strike rates. This cost reduction benefits geothermal developers, geothermal financiers, and consumers.
Exploration risk is a significant factor in the lack of access to construction capital for the geothermal industry. This technology may help to mitigate that exploration risk by increasing average strike rates for the first five wells from about 60 percent to about 90 percent.
In addition to developers, geothermal service providers and state utilities would benefit from a dramatically larger project pipeline and more supply of environmentally friendly baseload power. The research team estimated that the technology could double California’s near-term geothermal power capacity to 4800 megwatts (MW). This could produce a 30-year nominal economic output of $72 billion and create 20,000 direct, indirect, and induced jobs. This could avoid 36 million tons of carbon dioxide emissions every year. The research team’s technology could accelerate geothermal as a portion of the State of California’s electrical generation portfolio and help the State achieve its RPS goals.
2.11.8 Technology Transition Assessment As the basis for this assessment, the program administrator reviewed the researchers’ overall development effort, which includes all activities related to a coordinated development effort, not just the work performed with EISG grant funds.
Marketing/Connection to the Market The researchers have held informal discussions with geothermal developers, some of whom have expressed initial interest. The researchers will also need to determine if the technology will
81

add certainty to the lender and financial community in project viability, ultimately increasing access to and reducing cost of capital. Side-by-side demonstrations comparing this technique to others will be crucial to connecting with the potential market. Further marketing to potential markets and customers likely should await United States Patent Office decision on awarding of patent protection.
Engineering/Technical The researchers are in the process of developing a three-dimensional electromagnetic inversion code that includes a casing as part of the electro-magnetic source and validation of the results using field geothermal data. They are also extending engineering requirements from general geophysical work to the more demanding parameters related to geothermal development decisions.
Legal/Contractual The researchers have applied for, but have not yet received, patents on the technology. They have applied for both domestic and international patents.
Environmental, Safety, Risk Assessments/ Quality Plans The researchers will need to work with safety organizations and regulators (such as OSHA) to assure compliance with safety standards and thus achieve certification of this technology.
Production Readiness/Commercialization This technology is not ready for commercialization.
82
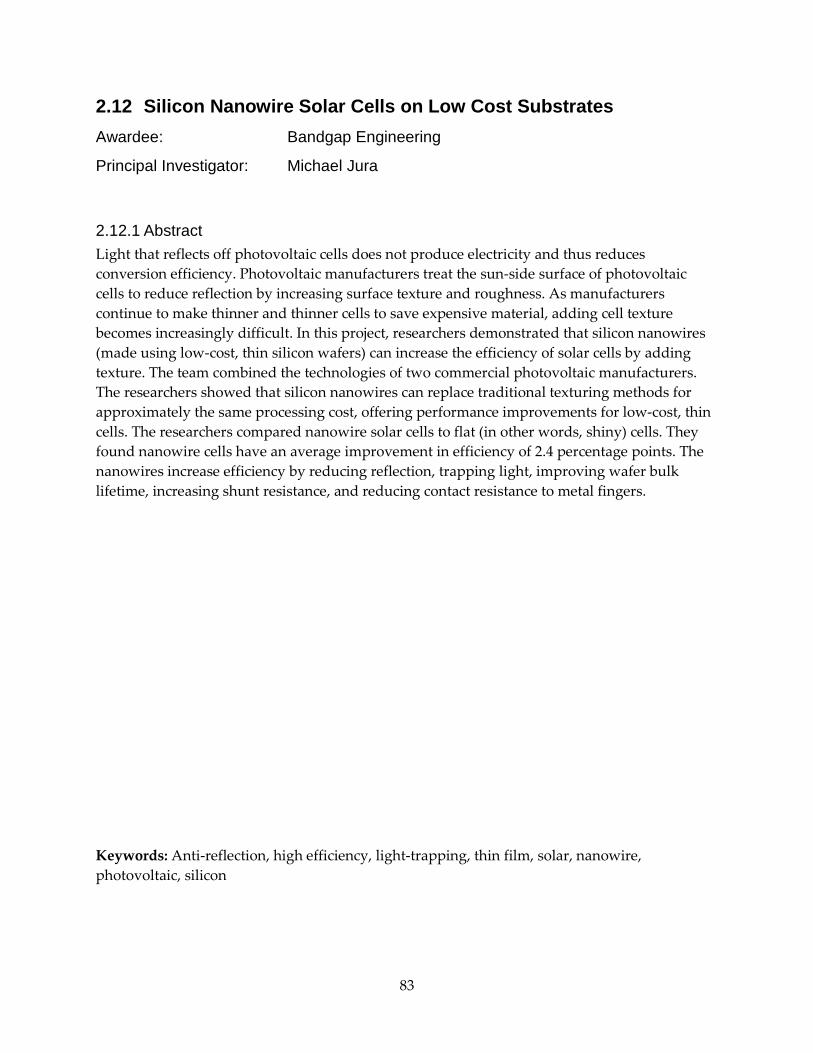
2.12 Silicon Nanowire Solar Cells on Low Cost Substrates Awardee: Bandgap Engineering
Principal Investigator: Michael Jura
2.12.1 Abstract Light that reflects off photovoltaic cells does not produce electricity and thus reduces conversion efficiency. Photovoltaic manufacturers treat the sun-side surface of photovoltaic cells to reduce reflection by increasing surface texture and roughness. As manufacturers continue to make thinner and thinner cells to save expensive material, adding cell texture becomes increasingly difficult. In this project, researchers demonstrated that silicon nanowires (made using low-cost, thin silicon wafers) can increase the efficiency of solar cells by adding texture. The team combined the technologies of two commercial photovoltaic manufacturers. The researchers showed that silicon nanowires can replace traditional texturing methods for approximately the same processing cost, offering performance improvements for low-cost, thin cells. The researchers compared nanowire solar cells to flat (in other words, shiny) cells. They found nanowire cells have an average improvement in efficiency of 2.4 percentage points. The nanowires increase efficiency by reducing reflection, trapping light, improving wafer bulk lifetime, increasing shunt resistance, and reducing contact resistance to metal fingers.
Keywords: Anti-reflection, high efficiency, light-trapping, thin film, solar, nanowire, photovoltaic, silicon
83
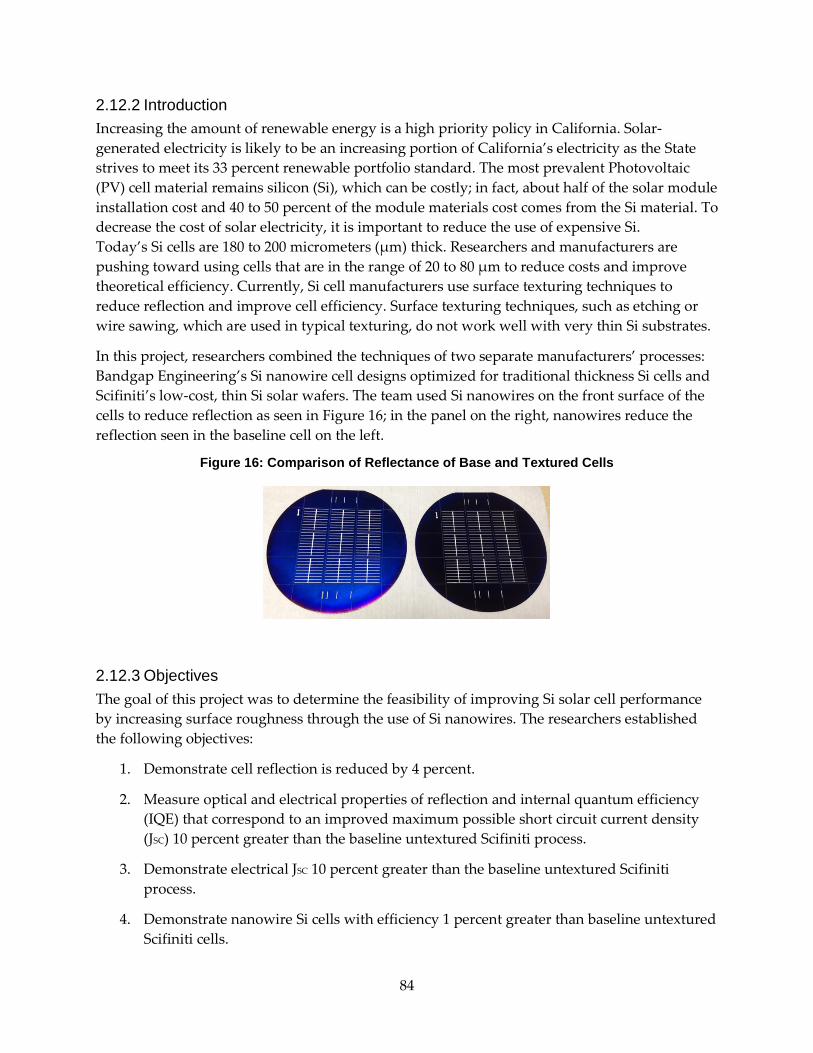
2.12.2 Introduction Increasing the amount of renewable energy is a high priority policy in California. Solar-generated electricity is likely to be an increasing portion of California’s electricity as the State strives to meet its 33 percent renewable portfolio standard. The most prevalent Photovoltaic (PV) cell material remains silicon (Si), which can be costly; in fact, about half of the solar module installation cost and 40 to 50 percent of the module materials cost comes from the Si material. To decrease the cost of solar electricity, it is important to reduce the use of expensive Si. Today’s Si cells are 180 to 200 micrometers (µm) thick. Researchers and manufacturers are pushing toward using cells that are in the range of 20 to 80 µm to reduce costs and improve theoretical efficiency. Currently, Si cell manufacturers use surface texturing techniques to reduce reflection and improve cell efficiency. Surface texturing techniques, such as etching or wire sawing, which are used in typical texturing, do not work well with very thin Si substrates.
In this project, researchers combined the techniques of two separate manufacturers’ processes: Bandgap Engineering’s Si nanowire cell designs optimized for traditional thickness Si cells and Scifiniti’s low-cost, thin Si solar wafers. The team used Si nanowires on the front surface of the cells to reduce reflection as seen in Figure 16; in the panel on the right, nanowires reduce the reflection seen in the baseline cell on the left.
Figure 16: Comparison of Reflectance of Base and Textured Cells
2.12.3 Objectives The goal of this project was to determine the feasibility of improving Si solar cell performance by increasing surface roughness through the use of Si nanowires. The researchers established the following objectives:
1. Demonstrate cell reflection is reduced by 4 percent.
2. Measure optical and electrical properties of reflection and internal quantum efficiency (IQE) that correspond to an improved maximum possible short circuit current density (JSC) 10 percent greater than the baseline untextured Scifiniti process.
3. Demonstrate electrical JSC 10 percent greater than the baseline untextured Scifiniti process.
4. Demonstrate nanowire Si cells with efficiency 1 percent greater than baseline untextured Scifiniti cells.
84

2.12.4 Outcomes 1. The researchers fabricated nanowire textured cells and measured their reflectance. They
compared the reflectance of textured cells to both thin and standard-but-untextured cells. The researchers found that the nanowire-textured cells had lower reflectance than the other two cell types. After some modification to the fabrication process, the researchers measured a reflectance as low as 2 percent for the nanowire thin cells.
2. The researchers measured optical and electrical properties of the textured cell and determined the effect of nanowire geometry on reflectance and internal quantum efficiency (IQE). The researchers concluded that the best performing nanowire geometry provided as low as 2.0 percent reflectance and an improved IQE which led to an increase of short circuit current (JSC) of 15.9 percent. The researchers determined through spectral analysis that most of the improvement occurred in the infrared and little in the blue portion of the spectrum.
3. The researchers measured the JSC for two different dopant protocols using nanowire cells and compared them with the JSC for the baseline thin cells. In the case of the first diffusion protocol, researchers measured a 16.5 percent increase in median short circuit current.
4. The researchers compared properties of the optimum nanowire geometry cell to the flat baseline untextured Scifiniti cell. They compared results using the same two dopant diffusion protocols as in Outcome 3. With one diffusion protocol the researchers measured an increased average cell efficiency of 2.4 percentage points. They measured an increased efficiency of 2.5 percentage points with the second protocol.
Table 4 summarizes results for Outcomes 3 and 4.
Table 4: Summary Results of Nanowire and Baseline Si Cells Using Two Different Dopant Diffusion Protocols
2.12.5 Conclusions 1. Si nanowires, as fabricated and arranged geometrically, can reduce reflectivity of thin
silicon wafers to as low as 2 percent reflectance, approaching that of conventional texturing methods not available for very low wafer thicknesses. The researchers achieved this objective.
2. Si nanowires can improve optical and electrical properties of thin silicon cells, including reflectivity and short circuit current. Nanowire geometry affects optical and electrical
Max Median Max Median Max Median Max Median Best Median Max MedianFlat Sci a 9 12.4 11.7 28.7 27.8 587 578 0.734 0.733 1.89 1.97 8890 1340NW-H Sci a 6 14.3 14.1 32.8 32.4 603 599 0.734 0.727 1.70 1.74 1820 1370Flat Sci b 9 11.3 9.1 28.7 26.6 573 569 0.726 0.604 2.1 4.27 1290 290NW-H Sci b 9 11.8 11.6 27.8 27.4 573 569 0.751 0.745 1.8 1.86 2490 1580
# CellsDiffusion RSh (Ω cm2)Eff (%) JSC (mA/cm2) VOC (mV) FF RS (Ω cm2)
85

properties. The best geometry investigated by the researchers afforded as low as 2 percent reflectance and an improved IQE consistent with an increased JSC of 15.9 percent. The researchers met this objective.
3. The two dopant diffusion protocols resulted in slightly different short circuit current and overall efficiency, as would be expected. Neither by themselves was especially effective in dealing with blue wavelengths. Short circuit current improved by a median 16.5 percent. The researchers met this objective.
4. The best nanowire geometry and either of two dopant diffusion protocols improved the efficiency over 2 percentage points compared to untextured thin films as produced by Scifiniti. The researchers met this objective.
The researchers successfully demonstrated that the overall performance of thin Si cells can be improved through texturing with Si nanowires.
2.12.6 Recommendations The program administrator recommends that the researchers:
1. Determine field durability of cells produced with nanowires.
2. Continue to investigate alternate nanowire geometries to further improve efficiency and short circuit current and compare to alternate texturing methods.
3. Validate that they can make a solar cell that is comparable to conventional Si cells in performance at lower cost and that the processing can be transferred to a manufacturing setting in a low cost and repeatable way. The researchers should document manufacturing requirements necessary for high quality production.
4. Determine if there are interactions between wafer thickness and nanowire geometry that would impact continued thinning of wafers or if a limit other than physical limitations of wafer material exists.
5. Continue to investigate techniques to improve cells using nanowires in the blue portion of the spectrum.
6. Complete and document a life cycle cost comparison with other cell types and manufacturing processes, taking into account current and expected future costs.
7. Work with other manufacturers of thin silicon cells and determine if nanowires are a universal or widely transferable replacement technique for texturing.
After taking into consideration (1) research findings in the grant project, (2) overall development status, and (3) relevance of the technology to California and the PIER Program, the program administrator has determined that the proposed technology should be considered for subsequent funding within the PIER Program.
86

Receiving subsequent funding ultimately depends upon (1) availability of funds, (2) submission of a proposal in response to an invitation or solicitation, and (3) successful evaluation of the proposal.
2.12.7 Benefits to California Public benefits derived from PIER research and development projects are assessed within the following context:
• Reduced environmental impacts of the California electricity supply or transmission or distribution system
• Increased public safety of the California electricity system
• Increased reliability of the California electricity system
• Increased affordability of electricity in California
The primary benefit to the ratepayer from this research is increased affordability of electricity in California. The researchers’ cost estimates suggest that thin Si solar cells that achieve the same performance as conventional cells can be manufactured at half the cost of conventional solar panels on a per-watt basis. This would reduce the levelized cost of electricity (LCOE) for solar PV from about $0.125 per kilowatt-hour (kWh) currently to about $0.095 per kWh. Furthermore, very thin cells have the potential of reduced weight modules which could further lower the cost of installation and simpler sun tracking with increased output in early morning and late afternoon compared to fixed arrays. Assuming a market penetration of 5,000 megawatts (MW) in California, a three-cent reduction in solar costs would translate to an annual savings of $450 million.
2.12.8 Technology Transition Assessment As the basis for this assessment, the program administrator reviewed the researchers’ overall development effort, which includes all activities related to a coordinated development effort, not just the work performed with EISG grant funds.
Marketing/Connection to the Market The research team is working with conventional solar cell manufacturers who have expressed interest in nanowires to improve cell efficiency on conventional manufacturing lines. The main market barrier to this new type of module will be certification which depends on reliability testing underway. Competing cell types such as cadmium indium di-selenide and concentrating solar will limit the market for Si cells to some extent, but it is unlikely to be significant given the overall size of the solar market. Healthy competition between Si and other cell types will continue to grow the solar market and acceptance as costs and performance approach traditional generation technologies.
Engineering/Technical The researchers are continuing their work on improving blue wavelength performance, along with continuous improvement in overall cell performance.
87

Legal/Contractual The researchers have applied for 21 patents in the United States with many of those also filed internationally and have received 6 United States patents.
Environmental, Safety, Risk Assessments/ Quality Plans There are no known and unique safety or environmental risks associated with the technology. Durability, as a quality issue, will need to be demonstrated.
Production Readiness/Commercialization The concept does not yet meet the comparable performance of conventional cells at lower cost. Once that is achieved and demonstrated, the concept will be ready for commercialization.
88

2.13 Measurement of Critical Energy/Mass Balances for Stand-Alone Torrefaction Awardee: Schatz Energy Research Center
Principal Investigator: Peter Lehman
2.13.1 Abstract In this project, the research team investigated the development of a biomass torrefier system to convert organic matter into energy-dense bio-coal and pyrolysis gas (or torrgas). This system was designed to stand anewslone for operation in remote locations to convert forest waste to a dense fuel that could be economically transported. The specific research aim was to generate energy and mass balance data while optimizing process operational parameters.
The researchers fully instrumented a one ton per day biomass torrefier operated with wood chips as fedstock to provide all relevant process data. Optimized process parameters included feedstock moisture content, operating temperature, torrefier dwell time, and internal mixing speed. Researchers determined the thermal energy demand for operation of the torrefier to be 26 kilowatts while the energy generated from the biomass was 22 kilowatts. The researchers determined that the torrefier required an electrical energy demand of 1.2 to 2kilowatts, indicating that in the present configuration the torrefier was not able to meet self-sufficient operation.
Research data revealed that a 20 percent increase in the higher heating value of the torrefied biomass was possible compared to the original high moisture feedstock.
Process review determined that additional energy conservation through reductions in heat loss and the incorporation of a Rankine cycle generator could potentially close the gap in total energy balance for operation of the torrefier. The research team predicted that economies related to process scale-up and increasing the torrefier operating temperature would further enhance the energy balance for the system.
Keywords: Torrefier, torrefication, pyrolysis, biomass energy, forest waste, energy balance, mass balance, stand-alone system
89
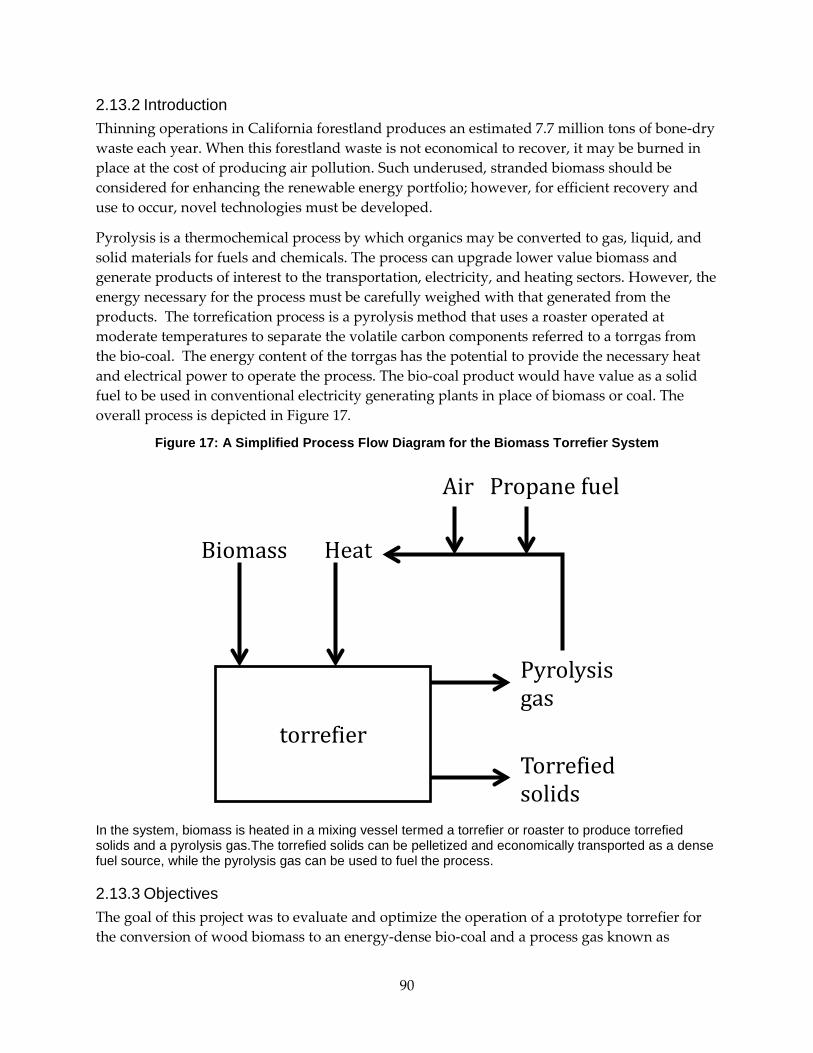
2.13.2 Introduction Thinning operations in California forestland produces an estimated 7.7 million tons of bone-dry waste each year. When this forestland waste is not economical to recover, it may be burned in place at the cost of producing air pollution. Such underused, stranded biomass should be considered for enhancing the renewable energy portfolio; however, for efficient recovery and use to occur, novel technologies must be developed.
Pyrolysis is a thermochemical process by which organics may be converted to gas, liquid, and solid materials for fuels and chemicals. The process can upgrade lower value biomass and generate products of interest to the transportation, electricity, and heating sectors. However, the energy necessary for the process must be carefully weighed with that generated from the products. The torrefication process is a pyrolysis method that uses a roaster operated at moderate temperatures to separate the volatile carbon components referred to a torrgas from the bio-coal. The energy content of the torrgas has the potential to provide the necessary heat and electrical power to operate the process. The bio-coal product would have value as a solid fuel to be used in conventional electricity generating plants in place of biomass or coal. The overall process is depicted in Figure 17.
Figure 17: A Simplified Process Flow Diagram for the Biomass Torrefier System
In the system, biomass is heated in a mixing vessel termed a torrefier or roaster to produce torrefied solids and a pyrolysis gas.The torrefied solids can be pelletized and economically transported as a dense fuel source, while the pyrolysis gas can be used to fuel the process.
2.13.3 Objectives The goal of this project was to evaluate and optimize the operation of a prototype torrefier for the conversion of wood biomass to an energy-dense bio-coal and a process gas known as
torrefier
Biomass Heat
Torrefied solids
Pyrolysis gas
Air Propane fuel
90

torrgas. The process was designed to use the energy contained in the torrgas product to drive the energy needs of the process and thereby create a stand-alone process. Thus, the energy-sufficient technology could be used in remote locations to convert biomass to a dense fuel that is economical for transport. The researchers established the following project objectives:
1. Develop the experimental plan in light of the project timeline and budget.
2. Verify the integrated system operation and instrumentation.
3. Operate the prototype torrefier with wood biomass to produce both torrgas and bio-coal product over a range of operating conditions.
4. Determine both mass and energy balances for the process with a closure of 90 percent or better.
5. Determine if the combustion energy of the torrgas product is greater than or equal to the total energy required for the process operation allowing for stand-alone operation.
6. Determine if the torrefied biomass product has a 20 percent greater specific enthalpy of combustion that the original feedstock.
2.13.4 Outcomes The research project resulted in a substantial number of successful outcomes including the following:
1. The research plan was carried out within the project budget and required a no-cost extension to complete laboratory testing of products and reactants.
2. The prototype torrefier system operated as designed with a wood biomass. Instrumentation was sufficient to generate the necessary data to evaluate the process.
3. The researchers operated the torrefier with variations in feedstock moisture content, operating temperature, torrefier dwell time, and system mixing.
4. The researchers performed mass and energy balance calculations for all torrefier runs.
5. The researchers determined the torrefier process had an average thermal demand of 26 kW. This demand resulted from heating the torrefier (22 kilowatts [kW]) and preheating the air supplied to the thermal oxidizer (4 kW). In addition, the researchers determined electrical demand for the process was in the range of 1.2 to 2 kW. In contrast, they determined the energy content of the torrgas ranged from 5 to 27 kW. While the net energy appeared to be nearly sufficient, the conversion of heat to electricity at 5 to 10 percent efficiency would increase the total energy demand for the torrefier to a range of 40 to 70 kW.
6. The goal to generate torrefied biomass or bio-coal with an energy content that was 20 percent greater than the initial biomass feedstock was possible but only for comparison to the wet feedstock. When the wood biomass was dried prior to torrefication, the increase in the energy content was substantially less than the 20 percent target.
91

2.13.5 Conclusions The researchers identified a number of performance criteria for the torrefier to be considered for stand-alone, remote location implementation. The first criterion was to demonstrate the ability of the torrgas product to provide sufficient energy to provide both the heat and electrical power requirements for the process operation. The second was the ability to demonstrate that the torrefied solids or bio-coal contained 20 percent greater energy value or higher heating value (HHV) as compared to the feedstock.
The researchers analyzed data from 15 test runs with varying conditions of operating temperature, feedstock moisture content, torrefier mixing speed, and residence time. While substantial data were generated or calculated (see Table 2), there was no indication that the evaluation was able to close both the mass and energy balance of the process to 90 percent or better. Data generated did indicate that increasing the biomass feed rate to the torrefier did reduce the energy consumption for the process. In addition, the use of low- or high-moisture content feedstock had negligible difference in the overall energy consumption for the process, although the low-moisture feedstock required less heat demand at higher torrefier operating temperature (275°C [527°F] to 295°C [563°F]).
The researchers were able to increase the energy content of biomass feedstock with a high moisture content by increasing the feedstock’s residence time within the torrefier. Increasing the residence time for feedstock within the torrefier substantially reduced the HHV variability for the torrefied biomass over the range of moisture content.
In summary, the project data demonstrated that wood biomass could be processed in the torrefier to produce torrefied biomass with a HHV 20 percent greater than the original feedstock. This was especially true when considering either high-moisture content biomass or longer residence times within the torrefier. The mass and energy balance data indicated that the torrgas product did not have sufficient energy content to both heat and provide electrical power to support the torrefier in a stand-alone platform. Energy consumed by the process must be reduced to make this process feasible.
2.13.6 Recommendations This research project focused on optimizing the operational parameters for the biomass torrefier to understand the overall energy requirements for the process while enhancing the HHV of both the torrgas and torrefied biomass. The project met many of the primary objectives and furthered the knowledge of the system and operation with a wood biomass feedstock. Project results identified potential areas for improvement, including engineering designs, operational changes, and additional unit operations. Specific recommendations are as follows:
1. Scale up the system: Improve the economics through larger scale. The current plans are to engineer a 20 ton per day capacity system. This sized system is also anticipated to be near to the stand-alone, remote location system to be employed commercially.
2. Reduce heat losses: The researchers identified several sources of heat loss in this study and have proposed engineering improvements to the thermal oxidizer.
92

3. Evaluate an alternative electrical supply: Consider photovoltacis.
4. Optimize process parameters: Optimizing the operating parameters at larger scale may further improve feedstock conversion and energy efficiency.
5. Incorporate system automation: Automating process operation may provide for more uniform process rates and yields while reducing operating energy demand.
6. Modify the torrefier for dirtier feedstock: Additional engineering may be necessary to handle alternative biomass feedstock that contains bark, needles, and other contaminants which can cause problems.
7. Include a pelletizer in future designs: Producing an energy-dense bio-coal from the torrefied biomass may require a pelletizer to be added to the system. This would produce a product that would be smaller in volume.
2.13.7 Benefits to California Public benefits derived from PIER research and development projects are assessed within the following context:
• Reduced environmental impacts of the California electricity supply or transmission or distribution system
• Increased public safety of the California electricity system
• Increased reliability of the California electricity system
• Increased affordability of electricity in California
The primary benefit to the ratepayer from this research is reduced environmental impacts of the California energy supply and distribution system.
Underused forestland biomass poses a potential fire hazard, especially during fire season. Applying the torrefier technology to forestland waste could reduce fire hazards while enhancing forest growth and quality. Operation of the torrefier at moderate temperatures reduces potential liabilities in operating a pyrolysis process in remote locations.
Underused forestland biomass is estimated at 7.7 million bone-dry tons each year in California. The implementation of a remote stand-alone biomass torrefier could produce a dense bio-coal product that is economical to transport to existing biomass-fired electrical generation plants. The impact is estimated at $150 million in energy product per year. Therefore, application of the torrefier technology to forestland biomass may enhance California’s energy independence.
Development of novel technologies such as the biomass torrefier to make use of underused forestland biomass enhances the renewable energy portfolio and reduces reliance on crude oil, coal, or natural gas for production of electricity. The energy-dense fuel produced may be used directly in biomass or coal-burning electrical generation facilities.
93

The affordability of torrefied biomass fuel from a stand-alone remote torrefier is currently unknown, but it may well depend on the transportation costs for delivering the product to a biomass-fueled electricity generating power plant. Additional economic analysis is required to determine the affordability of torrefied biomass as a fuel source in California.
2.13.8 Technology Transition Assessment As the basis for this assessment, the program administrator reviewed the researchers’ overall development effort, which includes all activities related to a coordinated development effort, not just the work performed with EISG grant funds.
Marketing/Connection to the Market The researchers did not conduct a market assessment. They have connections with an industrial firm, RFT. That firm will be the connection to the marketplace and perform any market assessment required.
Engineering/Technical The researchers do not plan to continue this work. Instead they are working with an industrial firm, RFT, to take the technology into the marketplace. They anticipate that RFT will need about two years to complete development.
Legal/Contractual The research team filed a patent application related to the phase change heat transfer approach for the torrefier process.
Environmental, Safety, Risk Assessments/ Quality Plans Environmental, safety and risk assessments were not part of this project since the technology is still in the engineering development and optimization stage. As the technology development nears commercial scale, a rigorous evaluation of safety and environmental issues will need to be conducted. In particular, the emissions profile from the torrgas combustion system will need to be evaluated, including the potential need for emissions control.
Production Readiness/Commercialization The development of the biomass torrefier has progressed near to commercialization. An industrial firm will accomplish the commercialization.
94

2.14 Improving Solar Energy Conversion by Incorporating Broadband Absorption Upconversion Materials Awardee: University of California, Davis
Principal Investigator: Gang-yu Liu
2.14.1 Abstract Most photovoltaic devices can only use radiation above their band gap energy, limiting them to the UV and visible radiation portions of the solar spectrum because the bottom 40 percent infrared energy cannot be used. It is known that some rare earth materials can absorb infrared radiation and emit visible light. However the upconversion efficiency is very low due in part the material’s narrow band absorption. In this project the research team investigated a new design of composite materials with rare earth and photo-active materials having broad band infrared absorption, namely lead (II) sulfide and lead selenide nanocrystals or quantum dots. The lead(II) sulfide and lead selenide quantum dots are known to exhibit high efficiency absorption in 700 to 1000 nm (lead[II] sulfide) and 1000 to 500 nm (lead selenide) regions and emit at 980 nm and 1500 nm, respectively. Their emission matches the absorption of rare earth’s transition energy. Thus this broader range of radiation could be used for more efficient upconversion than by rare earth alone, leading to improvement of solar cell efficiency. To date, however, only slight increases in the order of 0.025 percent in upconversion efficiency have been measured and an increase of 0.8 percent inferred indirectly by calculation.
Keywords: Upconversion, rare earth, quantum dots, photovoltaic, core-shell, infrared
95
2.14.2 Introduction There is a worldwide drive to use renewable sources to displace fossil fuel combustion in electricity generation. Solar photovoltaic (PV) generation is an attractive renewable source, but its market penetration has been slowed by higher cost compared to fossil fuel. Increasing the efficiency of existing PV cell technology offers one solution to lowering costs. At present PV cells use only about 60 percent of the solar spectrum available for electricity generation. Approximately 40 percent infrared (IR) part of the solar spectrum is below band gap (BG) of most cells, and accordingly is too low in energy to excite the electron hole pairs needed for electricity generation. In fact, solar cells are largely transparent to sub-gap IR radiation. It has been suggested that what is needed is a radiation upconversion material to place behind the cell.12 The upconversion material would absorb two or more transmitted low energy sub-gap photons and emit a single high energy photon above the gap energy. The high-energy photon could then excite the electron hole pairs needed for electricity generation in a PV cell. In essence this absorption and re-emission process would be a type of upconverter fluorescence. The most effective upconverter materials known contain rare earth ions of the lanthanide series in a transparent matrix. The rare earth 4f electrons, being relatively close to the nucleus and shielded by valence electrons, are long lived when excited, allowing for successive absorption of two photons. Being in a transparent matrix allows all the active rare earth through the volume of the upconverter device access to the incident IR photons for absorption and lowers the probability of re-absorption of an emitted high energy photon. One of the most attractive upconversion materials has been identified as NaYF4:Ln1 where the dopant Ln1 is a member of the lanthanide series.13 The Ln1 can absorb two sub-gap photons sequentially and then emit one high-energy photon above the PV BG in energy. Unfortunately the absorption by Ln1 is found to occur only over a narrow band of wavelength. Therefore, a second dopant, Ln2, can be added (NaYF4:Ln1Ln2) to absorb additional wavelengths and transfer its energy to Ln1 for emission. In this case Ln2 is referred to as the sensitizer and Ln1 as the activator.14 Unfortunately existing rare earth sensitizers are narrow band. What is needed is a new broad band sensitizer that will efficiently absorb and transfer absorbed energy to NaYF4:Ln1.
If a sensitizer for efficient low cost upconversion could be developed, the payoff in terms of reduced greenhouse gas (GHG) emission could be large. To set the scale, the total in-state production of electricity in California was 199,783 gigawatt-hours (GWh) in 2013. The dominant source for electric generation comes from natural gas-fueled generators which account for 120,863 GWh or 60 percent of all California in-state generation. This natural gas (NG) generation emits 1.21 pounds per kilowatt-hour (kWh), so 120,863 GWh of electricity is estimated to have produced 73.1 million metric tons (MMT) of GHG emissions of in California
12 T. Trupke, M. A. Green and P. Würfel, J. Appl. Phys. 92, 4117 (2002). http://dx.doi.org/10.1063/1.1505677
13 S. Heer, K. Kompe, H.U. Gudel, M. Haase, Adv. Mater. 16, 2102 (2004).
14 J. de Wild, A. Meijerink, J. K. Rath, W. G. J. H. M. van Sarka and R. E. I. Schroppa, Energy Environ. Sci. 4, 4835 (2011).
96

in 2013.15 The solar component (PV plus solar thermal) of California electricity in 2013 was 4,291 GWh or 2.15 percent of in-state production. Since PV power comprised 55 percent of total solar power in California in 2008, it is estimated that in 2013 PV accounted for about 2360 GWh or 1.18 percent of in-state PV generation16,17. At the present time the most common commercial PV modules being installed have efficiencies in the range of 13 to 17 percent.18 If a sufficiently cost-efficient PV technology could be developed, it would displace NG powered generation and with zero GHG emission. A market penetration of the new upconverter cell technology of 10 percent of existing NG generation or 12,086 GWh per year would then reduce GHG emission from NG generation by 7.3 MMT, a significant benefit.
The advancement of science or technology proposed in this project was to develop a novel composite broad band upconverter material to upconvert the infrared sub-gap part of the solar spectrum not absorbed by a solar cell to above the gap energy. Figure 18 shows a schematic of a cell layout. The sub-gap radiation passes through the cell to the backside where the upconversion material is placed. The upconversion material successively absorbs two sub-gap IR photons and re-emits one higher energy photon above the gap. A reflective layer re-directs upconverted radiation to the solar cell.
The approach for the composite broad band upconverter material was to couple nanoscale quantum dots (QD) with rare earth nanoscale particles (REN) of NaYF4:Er and NaYF4:ErxYby. The researchers identified candidate QD materials as PbS which absorbs radiation from 700 to 1000 µ nm in wavelength and PbSe which absorbs from 1000 to 1500 nm. The approach would be to grow a QD core and then subsequently grow a shell of the REN around the QD. In this way the QD would absorb incident long wavelength infrared radiation and efficiently transfer the energy to the REN shell. The radiation transfer mechanism from the closely coupled QD to the shell would be by non-radiative dipole-dipole interaction. The excited shell material would then emit short wavelength upconverted radiation without significant re-absorption by the QD. The reflective layer would assist in efficiently directing all the upconverted above band gap radiation to the solar cell for electron whole generation.
15 http://www.eia.gov/tools/faqs/faq.cfm?id=74&t=11
16 http://energyalmanac.ca.gov/renewables/solar/pv.html
17 http://energyalmanac.ca.gov/renewables/solar/
18 http://sroeco.com/solar/most-efficient-solar-panels
97

Figure 18: Schematic Diagram of the Anticipated Integration of the Nanocomposite Materials into Solar Devices
2.14.3 Objectives The goal of this project was to determine the feasibility of incorporating broadband absorption upconversion materials as additives to existing solar devices to improve solar conversion efficiency. The improvement relied on the utilization of the IR portion in solar radiation that is not used by current devices. The proposed utilization of IR radiation was based on a new design of rare earth-based core/shell nanomaterials.
The researchers established the following project objectives:
1. Synthesize and characterize sensitizer materials for the near-IR region. Demonstrate PbS quantum dots that reach designed absorption coefficient of ε = 105-106 M-1 cm-1 at 700 to 1,000 nm.
2. Synthesize and characterize sensitizer materials for the mid-IR region. Demonstrate PbSe quantum dots that reach designed absorption coefficient of ε = 105-106 M-1 cm-1 at 1,000 to 1,500 nm.
3. Synthesize and characterize core/shell nanomaterials that reach designed upconversion efficiency. Grow nanomaterials having core NaYF4:Ybx,Ery with size from 20 to 200 nm and x,y from 0.01to 0.2 and shell of silica with thickness from 10 to 50 nm. Demonstrate upconversion efficiency that reaches 1.0 percent at 980 nm. Demonstrate stability for 100 hrs at 20 (68) to 200°C (392°F) and 0 to 95 percent humidity.
4. Synthesize and characterize core/shell nanomaterials to reach designed upconversion efficiency. Grow nanomaterials having core NaYF4:Erx with size from 20 to 200 nm and x from 0.1 to 0.3 and shell of silica with thickness from 10 to 50 nm. Demonstrate upconversion efficiency that reaches 10 percent at 1523 nm. Demonstrate stability for 100 hrs at 20 to 200° C and 0 to 95 percent humidity.
5. Synthesize and characterize core/shell/shell nanomaterials that reach designed solar conversion efficiency. Grow with core PbS as optimized from Objective 1, inner shell NaYF4:Ybx,Ery as optimized from Objective 3, and outer shell silica as optimized from Objective 3. Demonstrate that absorption reaches 10 percent at 700 to 1,000 nm vs. 0.3
98

percent for current materials and conversion efficiency reaches 0.1 percent at 700 to 1,000 nm vs. 0.003 percent for current materials.
6. Synthesize and characterize core/shell/shell nanomaterials that reach designed solar conversion efficiency. Grow with core PbSe as optimized from Objective 2, inner shell NaYF4:Erx as optimized from Objective 4, and outer shell silica as optimized from Objective 4. Demonstrate that absorption reaches 10 percent at 1,000 to 1,500 nm vs. 0.3 percent for current materials and conversion efficiency reaches 1.0 percent at 1,000 to 1,500 nm vs. 0.03 percent for current materials.
2.14.4 Outcomes 1. The researchers grew PbS quantum dots and measured absorption coefficient of ε =
0.9x10⁵ M-1 cm-1 near 900 nm. They made 30 materials with absorption in the range of 600 to 1,000 nm.
2. The researchers grew PbSe quantum dots and measured absorption coefficient of ε = 1.2x10⁵ M-1 cm-1 at 1,430 nm. They made ten batches of PbSe materials with absorption covering the mid-IR range from 1,000 to 1,500 nm.
3. The researchers grew a series of core/shell nanoparticles within the specified size and composition ranges, for example a measured core of 21 nm diameters, composition NaYF4:Yb0.2,Er0.02 and 19 nm silica shell. They assumed the rare earth substituted for Y on the Y site. The researchers measured upconversion efficiency at 1.0 percent with 980 nm excitation. Emission intensity was stable for 96 hrs at 100°C (212°F) and decayed only slightly at 200°C (392°F). Emission was essentially stable at 200°C and 85 percent humidity for 96 hours.
4. The researchers grew nanomaterials of NaYF4:Erx and found control over size in the range of 20 to 200 nm. They did not report measurement of silica shell thickness. Using energy dispersive spectroscopy (EDS), they measured composition of NaY0.8F4Er0.2. They were not able to demonstrate upconversion efficiency at 1,523 nm. This may have been an instrumentation problem. The researchers inferred 10 percent conversion efficiency because that has been reported in the literature. The researchers inferred stability of emission from the fact that measured composition was stable at 200° C and 85 percent humidity.
5. The researchers were unable to grow small enough PbS QDs as cores for REN shells. Therefore they grew composite nanoparticle materials of 20 nm REN cores with 5 to 25 PbS QDs of size 3 to 5 nm surrounding the REN core. In this reversed configuration re-absorption by the QD of upconverted radiation from the REN core may be a problem. The researchers indirectly inferred that the addition of PbS leads to almost 10-fold improvement in conversion efficiency (0.025 percent in composite nanoparticles, while 0.003 percent for RENs alone). The researchers reported a brief preliminary experiment with two solid state binary composite films containing PbS and REN.
99

6. The researchers produced composite materials of PbSe core, inner shell of REN and silica outer shell and characterized them using TEM, SEM, EDS. Severe aggregation occurred during different steps of growth creating inhomogeneity. Work is in progress to improve dispersion during growth. Characterization of absorption and upconversion out to 1,523 nm was not possible due to not having access to a 1,523 nm laser.
2.14.5 Conclusions 1. The researchers demonstrated PbS quantum dots that reach designed absorption
coefficient of ε = 105 M-1cm-1 near 900 nm. This goal was met.
2. The researchers grew PbSe quantum dots and measured absorption coefficient that reached the designed absorption coefficient of ε = 1.2x10⁵ M-1cm-1 at 1,430 nm. This goal was met.
3. The researchers grew a series of core/shell nanoparticles within the specified size and composition ranges. Measured upconversion efficiency met the goal of 1.0 percent with 980 nm excitation. Emission was stable at 200°C (392°F) and 85 percent humidity for about 100 hours. These goals were met.
4. The researchers did grow nanomaterials in the design composition and size range. However they did not report measurement of silica shell thickness. Significantly, they were not able to demonstrate upconversion efficiency at 1,523 nm. They did not demonstrate stability at 20°C (68°F) to 200°C (392°F) and 0 to 95 percent humidity. This objective was substantially not met.
5. The researchers were unable to synthesize and demonstrate PbS core/shell/shell nanomaterials that reach designed absorption and solar conversion efficiency. This objective was not met.
6. The researchers grew PbSe core/shell/shell nanomaterials. They did not demonstrate the designed absorption and solar conversion efficiency. They observed severe aggregation during growth. This objective was not met.
The goal of this project was to determine the feasibility of incorporating broadband absorption upconversion materials as additives to existing solar devices to improve solar conversion efficiency. To date, however, only a slight increases in the order of 0.025 percent in upconversion efficiency have been measured and an increase of 0.8 percent inferred indirectly by calculation. More work needs to be done before the concept is shown to be practical or potentially cost effective. Overall the demonstration of increased efficiency by upconversion materials is only indirect and not yet convincing.
2.14.6 Recommendations The program administrator recommends that the researchers carry out further basic research on the approach to demonstrate a measured non-negligible increase in PV cell efficiency and thus demonstrate practical feasibility of the approach.
100
2.14.7 Benefits to California Public benefits derived from PIER research and development projects are assessed within the following context:
• Reduced environmental impacts of the California electricity supply or transmission or distribution system
• Increased public safety of the California electricity system
• Increased reliability of the California electricity system
• Increased affordability of electricity in California
The primary benefit to the ratepayer from this research would increase affordability of electricity in California. If a sensitizer for efficient low cost upconversion could be developed, the payoff in terms of reduced GHG emission could be large. To set the scale, the total in-state production of electricity in California was 199,783 GWh in 2013. The dominant source for electric generation came from natural gas-fueled generators which accounted for 120,863 GWh or 60 percent of all California in-state generation. This NG generation emitted 1.21 pounds per kWh, so 120,863 GWh of electricity is estimated to have produced 73.1 MMT emission of GHG in California in 2013. The solar component (PV plus solar thermal) of California electricity in 2013 was 4,291 GWh or 2.15 percent of in-state production. Since PV power comprised 55 percent of total solar power in California in 2008, in 2013 PV accounted for about 2,360 GWh or 1.18 percent of in-state solar generation. At the present time the most common commercial PV modules being installed have efficiencies in the range of 13 to 17 percent. If a more cost efficient PV technology could be developed, it would displace NG-powered generation and with zero GHG emission. A market penetration of the new upconverter cell technology of 10 percent of existing NG generation or 12,086 GWh per year would reduce GHG emission from NG generation by 7.3 MMT, a significant benefit.
2.14.8 Technology Transition Assessment As the basis for this assessment, the program administrator reviewed the researchers’ overall development effort, which includes all activities related to a coordinated development effort, not just the work performed with EISG grant funds.
Marketing/Connection to the Market The researchers have not completed market assessments nor talked with industrial companies regarding this technology. They published a paper in the Journal of Physical Chemistry in 2014 and submitted a manuscript to Journal of Colloid and Interface Science.
Engineering/Technical The researchers estimated that they need $600,000 for additional basic research and the same amount for research and development phase. They provided no time estimate for these activities.
101

Legal/Contractual The researchers had completed a patent search but had not submitted any preliminary patents for approval by the end of the project.
Environmental, Safety, Risk Assessments/ Quality Plans None of these assessments have been accomplished.
Production Readiness/Commercialization The researchers have not yet developed a commercialization plan. They have not been in contact with any company that could take the technology to market.
102

2.15 Adaptive Fan Demand Control for Low-Energy Consumption Cleanrooms Awardee: Engsys Research, Inc.
Principal Investigators: Wei Sun, Dan Rodier, Koji Miyasaka
2.15.1 Abstract Clean rooms are an important feature of many high technology industrial processes that need to maintain extremely low particulate levels in the air, which is crucial for maintaining quality of manufactured and fabricated products. However, moving and filtering huge volumes of air to achieve low particulate levels consumes large amounts of electricity. Clean rooms are not always occupied or in need of high levels of filtering, yet the air continues to be recirculated and filtered. Ventilation fans are essentially left on high speed all the time. In this project, researchers developed a real-time system to continuously monitor particulate loading and adjust fan speeds. The system uses an adaptive capability that can automatically tune the control parameters.
This fan control technology was tested in a small-scale cleanroom test unit. The researchers demonstrated that airflow volume can be reduced 51 percent to 63 percent during unoccupied periods. They also showed that fan energy consumption could be reduced by about 70 percent on an annual cumulative basis if lower fan speeds were used during other periods. The payback time varied for different fan sizes, depending on controls, variable speed drivers, sensors, and installation. The researchers estimated the payback times for 5, 20, and 50 kilowatt fans were 7.5, 3.7, and 2.3 years, respectively.
The technology needs to be demonstrated in actual cleanroom sites, ideally in a side-by-side situation. The demonstration should document any changes in particulate loading during operation, lag time (recovery time impact on process downtime), and product quality. Unless there is no impact on product quality and productivity, market acceptance will be limited.
Keywords: Cleanroom, adaptive control, demand-based control, model-referenced, air change rate, particle concentration, particle sensor, fan energy conservation, filtration
103

2.15.2 Introduction There are approximately 50 million square feet of cleanrooms in California. Cleanroom fan electricity consumption is about 11,400 gigawatt-hours (GWh) per year. If a reduction of 50 percent of fan energy could be realized, California manufacturing could save 5,700 GWh of electricity a year. Cleanroom air should contain 1 to 0.00001 percent of the airborne particulates typically found in offices. Therefore cleanroom air requires high filtration and ventilation. Cleanrooms are used to produce high technology or high value products commonly found in electronics, semiconductor, aerospace, pharmaceutical, automotive, optical and medical devices, and food processing facilities where air cleanliness is a critical feature.
Cleanrooms are often ventilated with fans on full speed, even during hours when the room is unoccupied and unused. This leads to wasted electricity.
In this project researchers developed and demonstrated a new system to use real-time continuous particle sensors for feedback signals, coupled with adaptive, demand-based control to adjust fan speeds automatically. With modulated fan speeds providing the right amount of airflow while maintaining low particulate levels, electricity consumption can be reduced.
2.15.3 Objectives The goal of this project was to establish an adaptive demand control technology to demonstrate the feasibility of reduction of cleanroom fan energy consumption. The researchers established the following project objectives:
1. Complete CAD drawings
2. Confirm that the unit will have full range cleanliness simulations (Class 1-100,000) and full air change rate modulations (0 to 600 air changes per hour [ACH])
3. Confirm that the adaptive control system can allow supply air change per hour (ACH) to respond dynamically to 10 particle generation rate settings to maintain the room cleanliness classification automatically at all times
4. Confirm the demand flow technology can reduce energy consumption from 455 kilowatt-hours per square foot (kWh/ft2) per year to 228 kWh/ft2 per year at an average of 369 ACH with a full 5—600 ACH test range
5. Confirm from the project findings that a minimum of 4 year, 3 year, and 2.5 year simple payback time can be achieved for small (0 to 10 kilowatts [kW]), medium (10.1 to 30 kW), and large (30.1 kW and above) cleanroom fan systems, respectively
6. Confirm energy savings of 1,140 GWh per year at 10 percent penetration (in other words, in five million square feet cleanrooms in California) at an average of 369 ACH
2.15.4 Outcomes 1. The researchers completed a design for a demonstration cleanroom. They included as
design features technology feasibility validation and future energy saving demonstrations.
104

2. The researchers constructed the cleanroom and verified the prototype unit could achieve a full range cleanliness simulation as sensed by particle sensors from Class 1 to Class 100,00019 and could achieve over 600 ACH. With variable speed fans, the researchers were able to turn down the airflow rate.
3. The researchers showed that the new system could adjust air change rate, dynamically respond and track particle generation rate changes, and maintain air cleanliness with short lag times after introduction of a particulate load. They also determined that a sampling time of one minute balanced data needs with fan response.
4. Using system modeling, the researchers calculated that the new system used about 51.2 percent of the base case electricity during occupied periods and 21.6 percent during unoccupied periods. They calculated that the combined electricity saving on an annual basis was 71 percent. In actual energy saving performance tests, they found that particle generation and the air change rate measured in ACH were the most important determinants of energy consumption. Figure 19 shows the results for one case evaluated. The blue dots represent measured particle concentrations that stayed below maximum level shown by the dark blue line. In each case reported, particle concentration remained below maximum level, except for one case where the particle concentration was just at the maximum level under low particle generation and very low air change rate.
19 These are equivalent to ISO (International Organization for Standardization) Class 3 through 8.
105
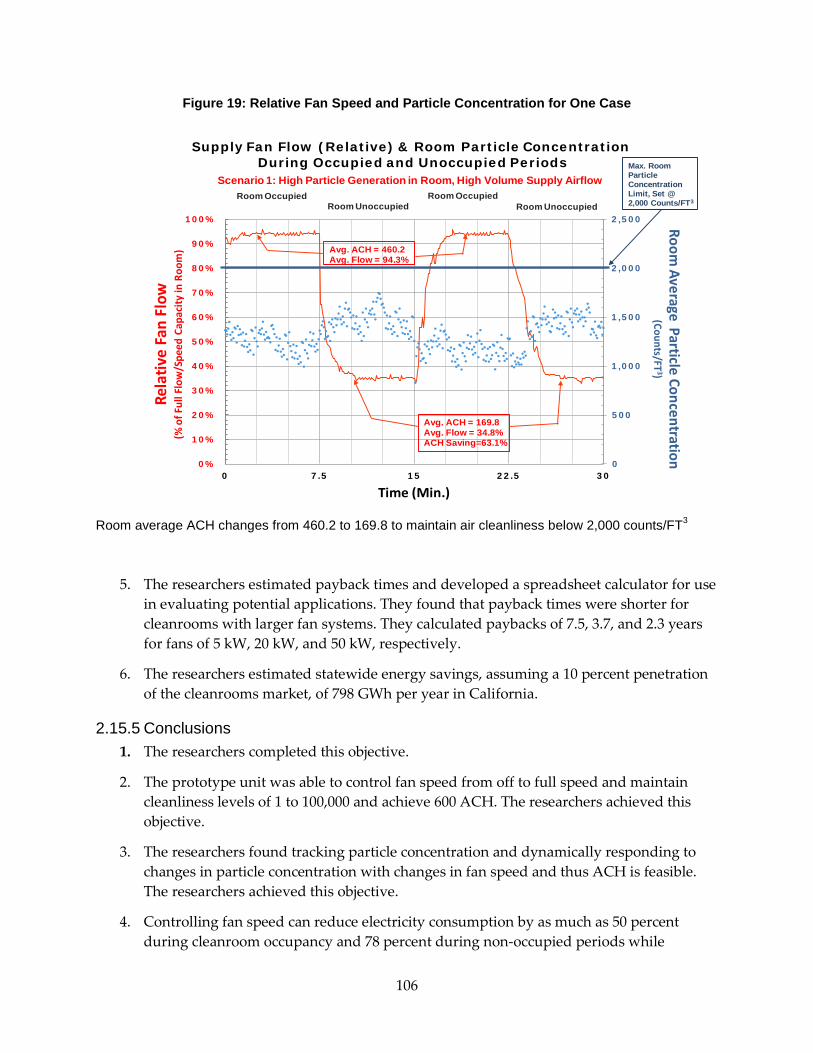
Figure 19: Relative Fan Speed and Particle Concentration for One Case
Room average ACH changes from 460.2 to 169.8 to maintain air cleanliness below 2,000 counts/FT3
5. The researchers estimated payback times and developed a spreadsheet calculator for use in evaluating potential applications. They found that payback times were shorter for cleanrooms with larger fan systems. They calculated paybacks of 7.5, 3.7, and 2.3 years for fans of 5 kW, 20 kW, and 50 kW, respectively.
6. The researchers estimated statewide energy savings, assuming a 10 percent penetration of the cleanrooms market, of 798 GWh per year in California.
2.15.5 Conclusions 1. The researchers completed this objective.
2. The prototype unit was able to control fan speed from off to full speed and maintain cleanliness levels of 1 to 100,000 and achieve 600 ACH. The researchers achieved this objective.
3. The researchers found tracking particle concentration and dynamically responding to changes in particle concentration with changes in fan speed and thus ACH is feasible. The researchers achieved this objective.
4. Controlling fan speed can reduce electricity consumption by as much as 50 percent during cleanroom occupancy and 78 percent during non-occupied periods while
0
500
1,000
1,500
2,000
2,500
0%
10%
20%
30%
40%
50%
60%
70%
80%
90%
100%
0 7.5 15 22.5 30
Room Average Particle Concentration
(Counts/FT3)
Rela
tive
Fan
Flow
(% o
f Ful
l Flo
w/S
peed
Cap
acity
in R
oom
)
Time (Min.)
Supply Fan Flow (Relative) & Room Particle ConcentrationDuring Occupied and Unoccupied Periods
Room Occupied
Avg. ACH = 460.2Avg. Flow = 94.3%
Max. Room ParticleConcentrationLimit, Set @2,000 Counts/FT3
Room OccupiedRoom Unoccupied Room Unoccupied
Avg. ACH = 169.8 Avg. Flow = 34.8%ACH Saving=63.1%
Scenario 1: High Particle Generation in Room, High Volume Supply Airflow
106

maintaining particle levels below specified maximums. The researchers achieved this objective.
5. Payback periods, accounting for capital investment in sensors, variable speed fans, and installation, can be as short as 2.3 years for large fan systems. Smaller fan systems have payback periods of approximately 7.5 years. The researchers achieved this objective.
6. California cleanroom operators could realize significant electricity savings. If 10 percent of cleanroom operators implemented this technology, approximately 800 GWh of saving per year could be achieved. The researchers completed this objective.
The researchers developed an adaptive demand control technology and demonstrated the feasibility of reduction of cleanroom fan energy consumption.
2.15.6 Recommendations The program administrator recommends the researchers:
• Undertake, in cooperation with utilities, a survey of cleanrooms and document actual square footage by cleanliness class. The survey should include current operational practices (including number of shifts) of existing cleanroom operators, to provide more accurate estimates of potential savings compared to estimates based on the assumption that all cleanrooms operate ventilation 24/7 and one daily shift.
• Undertake a comparative cost and performance analysis comparing the system as demonstrated and simple occupancy sensors. The particulate levels modeled and tested in this project were highly correlated with occupancy. The superiority of this technology approach over simpler methods to reduce fan consumption needs to be well established.
• Undertake demonstrations at operating cleanroom facilities in California. It is recommended that initial demonstration be at lower cleanliness-demanding facilities and cover a range of cleanroom sizes.
• Publish a pamphlet or brochure discussing operational and design considerations for cleanroom operators considering a switch to variable speed ventilation.
After taking into consideration (1) research findings in the grant project, (2) overall development status, and (3) relevance of the technology to California and the PIER Program, the program administrator has determined that the proposed technology should be considered for subsequent funding within the PIER Program.
Receiving subsequent funding ultimately depends upon (1) availability of funds, (2) submission of a proposal in response to an invitation or solicitation, and (3) successful evaluation of the proposal.
2.15.7 Benefits to California Public benefits derived from PIER research and development projects are assessed within the following context:
107

• Reduced environmental impacts of the California electricity supply or transmission or distribution system
• Increased public safety of the California electricity system
• Increased reliability of the California electricity system
• Increased affordability of electricity in California
The primary benefit to the ratepayer from this research is reduced environmental impacts of the California electricity supply or transmission or distribution system. As reported in a 2008 survey, 50 million square feet of cleanrooms existed in California. Today in California, cleanroom fan power consumption is about 11,400 GWh per year. Assuming 10 percent of cleanrooms use this technology, and they all achieve an annual savings of 70 percent, 798 GWh of electricity could be saved per year in California. An additional benefit is maintaining California’s attractiveness to high technology industries reliant on cleanrooms by reducing their electricity bills.
2.15.8 Technology Transition Assessment As the basis for this assessment, the program administrator reviewed the researchers’ overall development effort, which includes all activities related to a coordinated development effort, not just the work performed with EISG grant funds.
Marketing/Connection to the Market The researchers have been working with IEST (Institute of Environmental Sciences and Technology), ASHRAE (American Society of Heating, Refrigerating, and Air-Conditioning Engineers), and the ISO (International Organization for Standardization) cleanroom communities. They stated the responses are extremely strong as they understand the huge value. The researchers’ participation in various trade groups and committees will facilitate the transfer of this technology to the market.
Engineering/Technical The researchers plan to have two site demonstration/application sites in California, one in semiconductor sector, and another in pharmaceutical sector. They plan for five to six year tests and estimate funding requirements at $300,000 for each project for engineering, retrofit, and construction efforts.
Legal/Contractual The researchers have not applied for any patents from this work. They have not yet entered into licensing or mutual development agreements with cleanroom operators or HVAC construction firms.
Environmental, Safety, Risk Assessments/ Quality Plans There are no environmental or safety risks associated with the technology.
Production Readiness/Commercialization The technology is ready for commercialization.
108

109

2.16 Quantum Protection System for Secure Grid Automation Communications Awardee: GridCom Technologies, Inc.
Principal Investigator: Duncan Earl
2.16.1 Abstract The researchers in this project proposed a new method of quantum cryptography and provided experimental results on a proof-of-principle test system. This method has been developed specifically for machine-to-machine communications associated with the electric grid. The approach replaces existing public key cryptography methods and eliminates the management of secret keys. In contrast to existing public key cryptography, the new technique is secure even with future advances in computational power (in other words, quantum computers).
The proof-of-principle test system achieved a message transmission rate of 14 bits per second. Using a newly developed quantum protocol called EB13, messages were broadcast, validated, and authenticated in less than 10 seconds over unsecured wired and wireless channels. After recommended component and protocol improvements, the demonstrated system has the potential to achieve a higher bit rate of 27 kilobits per second, resulting in message transmission, validation, and authentication of less than 4 to 5 milliseconds. The technique is future-proof against computational advances, since no secret key is used. It is compatible with the latency requirements of even the most timing-sensitive grid equipment. The researchers presented the steps needed to advance the system to a point where it can be more fully tested and demonstrated, along with the potential benefits to ratepayers. They also discussed the near-term application areas that could benefit immediately from this technology, including synchrophasors, automatic reclosers, and secure generic object-oriented substation events messaging.
Keywords: Quantum, authentication, QKD, M2M, grid security, cybersecurity
110
2.16.2 Introduction The operation of critical infrastructure in the United States, for example many electricity and natural gas systems, has become widely controlled by a network of automation components and machines. For example, there are at least 363 electric utilities in the United States with 27 in California alone.20 Similarly, transportation systems such as vehicles (soon to include driverless vehicles), air traffic control, and rail systems are complex and are moving in the direction of greater autonomous control. There are 254.4 million registered passenger vehicles in the United States.21 There can be as many as 19,000 airplanes in the air at one time over U.S. air space.22 These distributed autonomous machines frequently communicate over public communication channels to ensure optimal control of their operation. As the number of deployed components has grown, so too has the vulnerability of these systems to malicious attacks. Of most immediate concern to cyber security and industry experts is the vulnerability of the modernized North American electric grid to cyber-attack. Such an attack could cripple California and the entire nation's electric infrastructure at great expense to the economy and security.23 While effective methods of cyber security are used today in telecom applications, these same techniques are unsuitable for the grid's machine-to-machine (M2M) communications. M2M communications control the real-time operations of distributed equipment and thus have strict requirements on data latency or message delay and message protocols. These requirements make it difficult or impossible to use slower traditional methods of data encryption and authentication. Furthermore, with automation components being deployed for many decades, the data security solutions must be future-proof against vulnerability associated with advances in computational capabilities. Data integrity is the primary cyber security need of M2M communications associated with the electric grid. Guaranteeing that a message has not been tampered with is the crucial cyber security requirement that must be developed.
A method that guarantees such data integrity and authentication could provide great benefit to California ratepayers. A useful way to identify the benefits is to consider the Single-Loss Expectancy Model based on equipment replacement costs and lost revenue associated with a cyber-attack.24 Assume there is a wide-scale attack on the public key infrastructure for all four of the largest electrical utilities in California. Such an attack would allow an attacker to impersonate the utility and issue commands that would likely attempt to physically damage critical equipment such as large substation transformers. The loss of high capacity distribution equipment would produce a cascade effect that could bring down the power grid for most of the State. To estimate the cost of such a blackout, the 2003 Northeast blackout can be used as a
20 http://en.wikipedia.org/wiki/List_of_United_States_electric_companies
21 http://en.wikipedia.org/wiki/Passenger_vehicles_in_the_United_States
22 http://www.quora.com/How-many-airplanes-are-in-the-air-at-any-given-time-in-the-US
23 http://ecee.colorado.edu/~ekeller/classes/fall2014_advsec/papers/goose_globecomm12.pdf
24 http://en.wikipedia.org/wiki/Single_loss_expectancy
111

comparable event since it affected a similar sized population and faulty M2M communications contributed to it. The 2003 blackout lasted for two days and affected nearly 45 million people in the United States.25 Eleven people died, and the cost was over $6 billion.26 An attack on the public key infrastructure, with subsequent equipment damage, could be expected to last significantly longer. According to the Federal Energy Regulatory Commission (FERC), a small number of the country's substations play an outsized role in keeping power flowing across large regions.27 The FERC analysis indicates that knocking out nine of those key substations could plunge the country into darkness for weeks, if not months.8 For the purpose of estimating the cost of a blackout in California, assume a one month long blackout. Given that California has a population of approximately 40 million people, the daily impact could be projected as being similar to the 2003 Northeast blackout. Using these assumptions, a blackout over a one month period would result in 165 deaths and over $90 billion in losses to California. If distributed evenly across the population, the blackout would cost the average Californian $2,250.
The advancement of science or technology proposed in this project was to demonstrate a proof-of-principle, quantum-protected communication system for M2M communications between external devices. As shown schematically in Figure 20, the system consists of a physically protected quantum server and several physically protected quantum receivers. The receivers communicate with the quantum server through unprotected optical fibers. The quantum receivers are intentionally located far from the quantum server on the periphery of a region or protected zone. The quantum server is a central source of pairs of quantum entangled photons which are randomly distributed by the quantum server to pairs of quantum receivers through optical switches. Each receiver measures the quantum state of its received photon, either zero or one. The non-quantum devices poll each receiver through public wired or wireless channels and concatenate their values using a standardized order into a long random bit stream.
Although each receiver will have a 50/50 chance of measuring either a zero or a one from an entangled photon, the quantum correlation among the receivers ensures that half of the receivers will measure a zero and half will measure a one. The resultant bit stream will contain hidden correlations know only to the server. Once the random bit stream has been retrieved and compiled by a device, the device can check that the bit stream has not been corrupted by asking the quantum server to validate it. Assuming the correlations within the concatenated bit stream agree with the distribution of the entangled photons prepared by the quantum server, the server will validate that the bit stream has not been tampered with and can be used by all devices as a public key. However, if the public key has been tampered with, the correlations within the key bit stream will not agree, and the server will immediately detect tampering. At this point, a device can use the validated public key to encrypt a message and send it to another device that uses the same public key. However, since the quantum receivers broadcast their bits
25 http://en.wikipedia.org/wiki/Northeast_blackout_of_2003
26 http://www.scientificamerican.com/article/2003-blackout-five-years-later/
27 http://www.wsj.com/articles/SB10001424052702304020104579433670284061220
112
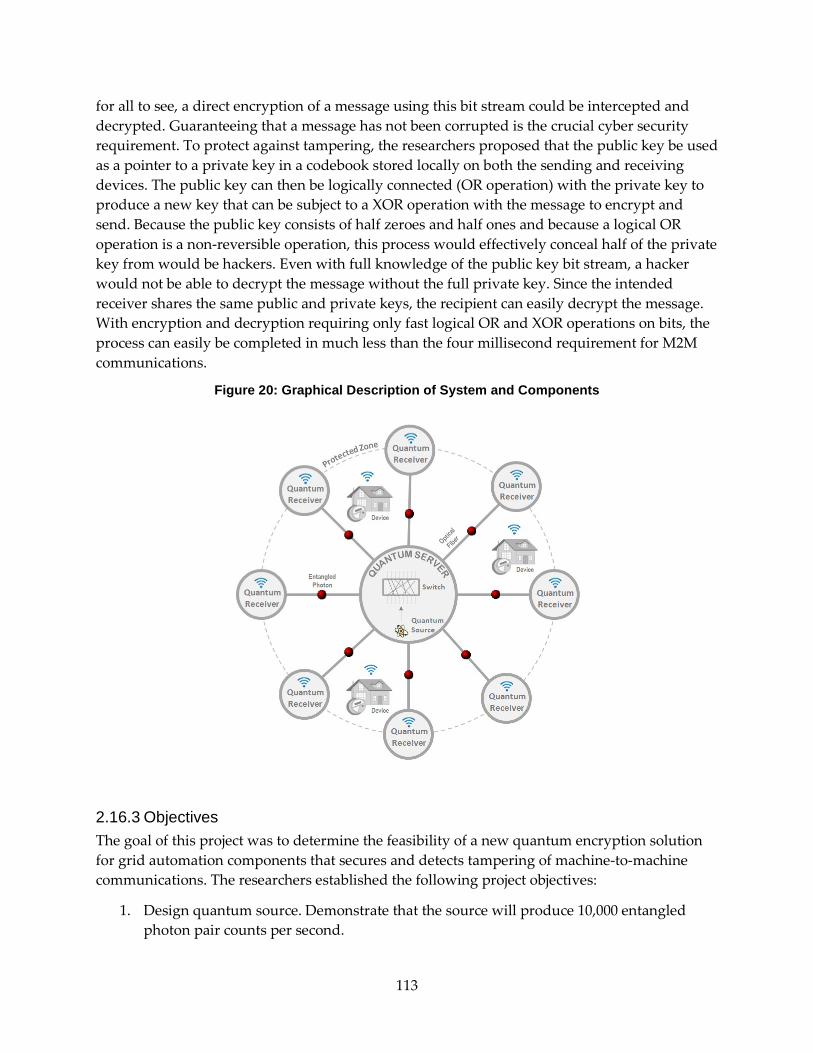
for all to see, a direct encryption of a message using this bit stream could be intercepted and decrypted. Guaranteeing that a message has not been corrupted is the crucial cyber security requirement. To protect against tampering, the researchers proposed that the public key be used as a pointer to a private key in a codebook stored locally on both the sending and receiving devices. The public key can then be logically connected (OR operation) with the private key to produce a new key that can be subject to a XOR operation with the message to encrypt and send. Because the public key consists of half zeroes and half ones and because a logical OR operation is a non-reversible operation, this process would effectively conceal half of the private key from would be hackers. Even with full knowledge of the public key bit stream, a hacker would not be able to decrypt the message without the full private key. Since the intended receiver shares the same public and private keys, the recipient can easily decrypt the message. With encryption and decryption requiring only fast logical OR and XOR operations on bits, the process can easily be completed in much less than the four millisecond requirement for M2M communications.
Figure 20: Graphical Description of System and Components
2.16.3 Objectives The goal of this project was to determine the feasibility of a new quantum encryption solution for grid automation components that secures and detects tampering of machine-to-machine communications. The researchers established the following project objectives:
1. Design quantum source. Demonstrate that the source will produce 10,000 entangled photon pair counts per second.
113

2. Assemble bench-top quantum key server. Demonstrate that the server will support 50 transactions per second.
3. Design/fabricate control circuit for NxN switch with embedded web server. Demonstrate switching times of less than 20 millisecond (msec).
4. Design/fabricate quantum receiver with embedded web server. Demonstrate receivers have maximum counts greater than 10 million photons at detector efficiencies of better than 70 percent.
5. Demonstrate key retrieval and key validation times of less than 10 seconds.
6. Conduct proof-of-principle demonstration of wireless, low data latency quantum encryption. Verify that the device can operate at greater than 115 kbps (kilobits per second) key transmission rates.
2.16.4 Outcomes 1. The researchers built and demonstrated a quantum source that produced greater than
12,000 entangled photon pairs per second per mW (milliwatt) of laser pump power.
2. The researchers demonstrated a new quantum server that could execute 62 transactions per second using a new quantum communication protocol (EB13) that was also developed as part of this project.
3. The researchers fabricated a control circuit for an NxN switch embedded with the web server. They demonstrated switching times of 10 msec.
4. The researchers built a detector with a maximum count rate of 20 million photons per second. However the detection efficiency was only 52 percent. They concluded that the efficiency shortcoming could be fully compensated for by increasing the number of samples made during photon measurements performed by the quantum receivers.
5. The researchers demonstrated key/message retrieval and validation times of less than 9 seconds for a message string of 15 characters.
6. The researchers demonstrated bit rates of 14 bits per second in the proof-of-principle system and identified changes that would increase the bit rate to 27 kbps. They did not find a clear path to achieving bit rates in excess of 115 kbps. They concluded, however, that the lower bit rate of 27 kbps would not prevent application of the developed technology. The large majority of deployed devices controlling the grid today would be able to take advantage of a quantum-protected system with a 27 kpbs bit rate, even devices that require low data latency requirements, such as generic object-oriented substation events (GOOSE) messaging.
7. The researchers conferred with specialists at SDG&E (San Diego Gas and Electric) and PG&E (Pacific Gas and Electric). With this feedback they developed cost models that confirm energy rate reduction of 1.5 cents per kilowatt-hour (kWh) to the ratepayer after capital equipment costs are recouped.
114

2.16.5 Conclusions 1. The researchers built and demonstrated a quantum source that exceeded the goal of
10,000 entangled photon pairs per second. This objective was met.
2. The researchers demonstrated a quantum server that exceeded the goal of greater than 50 transactions per second. They also developed a new quantum communication protocol (EB13) as part of this project. This objective was met.
3. The researchers fabricated a control circuit for an NxN switch with a rate faster than the switching time goal of 20 msec. This objective was met.
4. The researchers built a detector that exceeded the count rate goal of 10 million photons/second but with efficiency that fell short of the detection efficiency, 52 percent not 70 percent. Therefore only part of this objective was met.
5. The researchers demonstrated key/message retrieval and validation times shorter than the goal of 10 seconds. Therefore this objective was met.
6. The researchers demonstrated bit rates of 14 bps in the proof-of-principle system, not 115 kbps. They concluded that a bit rate of 27 kbps was possible and would suffice for many important applications. This objective was not met.
7. The researchers confirmed an energy rate reduction of $0.015/kWh for the ratepayer.
Although not all objectives were met, the researchers demonstrated the main goal of proving feasibility for a new quantum encryption solution for grid automation components that secures and detects tampering of machine-to-machine communications.
2.16.6 Recommendations The program administrator recommends that the researchers implement the changes needed for achieving a higher bit rate such as27 kbps. It is essential that a much higher bit rate than 14 bps be demonstrated for low data latency quantum encryption for the technology to be considered for use in the field.
After taking into consideration (1) research findings in the grant project, (2) overall development status, and (3) relevance of the technology to California and the PIER Program, the program administrator has determined that the proposed technology should be considered for subsequent funding within the PIER Program.
Receiving subsequent funding ultimately depends upon (1) availability of funds, (2) submission of a proposal in response to an invitation or solicitation, and (3) successful evaluation of the proposal.
2.17.7 Benefits to California Public benefits derived from PIER research and development projects are assessed within the following context:
115

• Reduced environmental impacts of the California electricity supply or transmission or distribution system
• Increased public safety of the California electricity system
• Increased reliability of the California electricity system
• Increased affordability of electricity in California
The primary benefit to the ratepayer from this research is increased reliability of the California electricity system. Securing M2M communication through the use of a quantum-protected communication system would guarantee the accuracy of messages by detecting and preventing outside tampering and therefore protect the state’s electric grid from cyber-attacks with the potential to cause widespread damage. Thus, this quantum encryption solution for grid automated components would not only secure the integrity of M2M communications on the grid, but also prevent financial losses and potential endangerment of human life.
2.16.8 Technology Transition Assessment As the basis for this assessment, the program administrator reviewed the researchers’ overall development effort, which includes all activities related to a coordinated development effort, not just the work performed with EISG grant funds.
Marketing/Connection to the Market The company has had discussions with SDG&E and PG&E. In addition, the technology and its application to critical infrastructure cyber security were presented and discussed at a post-quantum cryptography workshop held by the Institute for Quantum Computing. The researchers have been negotiating with SDG&E to jointly demonstrate the system at their facility in 2015.
Engineering/Technical The researchers estimated that they could complete the development and demonstration of this concept in two years with an additional $1 million in funding.
Legal/Contractual The researchers applied for Patent Application #61/826,926. Qubitekk has been awarded a $3 million United States Department of Energy grant to speed the development of unhackable quantum encryption technology.28
Environmental, Safety, Risk Assessments/ Quality Plans Safety and risk assessment analysis will need to be made before the first deployment in an electric grid.
Production Readiness/Commercialization Qubitekk has commercialized a plug-and-play entangled photon generator, the QES1.29
28 http://qubitekk.com/qubitekk-receive-federal-funding-help-protect-nations-power-grid-cyber-attack/
116

2.17 Low Band Gap Antimony-Based Thermophotovoltaics Grown on Gallium Arsenide Substrates Awardee: California Nanosystems Institute, UCLA
Principal Investigator: Diana L Huffaker
2.17.1 Abstract Thermophotovoltaics directly convert photons in the infrared (heat) portion of the spectrum into electricity. The researchers believed cost reduction would occur through materials savings and scalability if gallium arsenide substrates could be matched with an antimony-based cell surface layer. They attempted to demonstrate the feasibility of growing antimony-based themophotovoltaic cells directly on gallium arsenide) substrates. They used a novel growth technique known as interfacial misfit array to facilitate growth of a molecular buffer at the interface between the two distinct lattice structures.
The antimony-based cells grown on gallium arsenide did not perform any better, and in some metrics performed worse, than baseline thermophotovoltaic cells grown on gallium antimony-based substrates. The cells did maintain similar spectral response as the baseline cells.
The researchers also developed quaternary gallium indium arsenic antimony materials lattice-matched to gallium antimony. Gallium indium arsenic antimony can cover a wide spectrum; however, the researchers have yet to test gallium indium arsenic antimony thermophotovoltaic cells.
Keywords: Sb-based thermophotovoltaics, quaternary GaInAsSb, interfacial misfit array, GaAs substrates
118
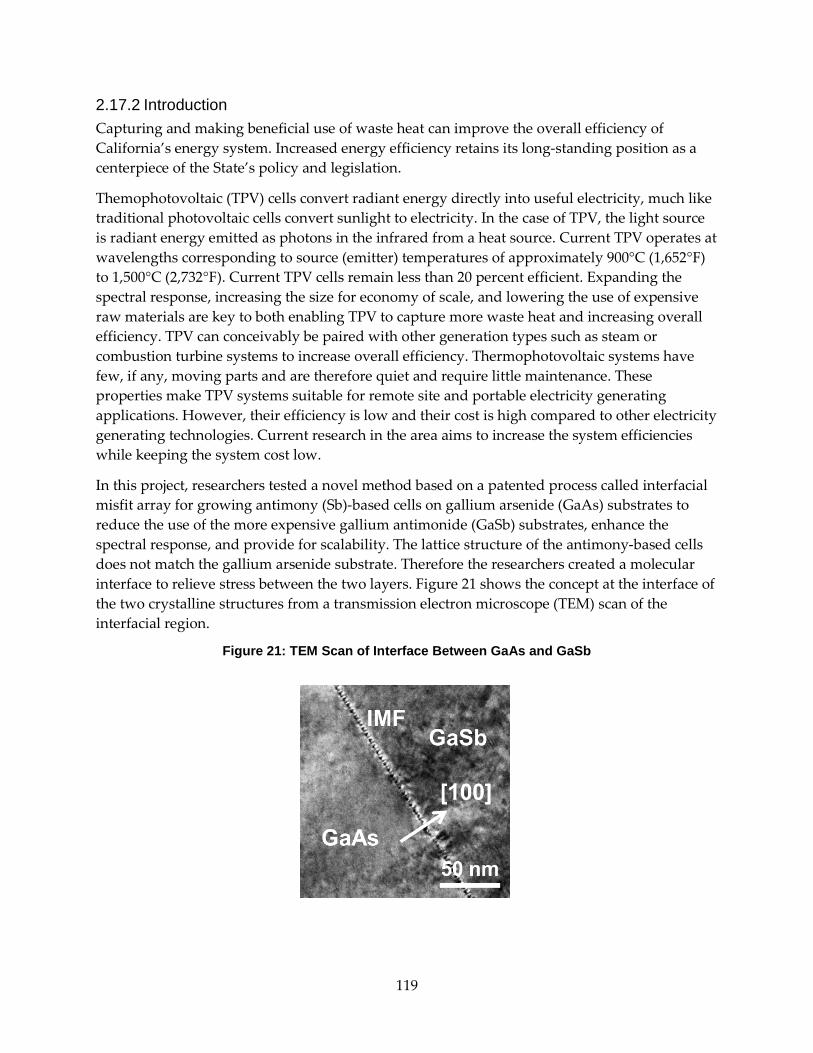
2.17.2 Introduction Capturing and making beneficial use of waste heat can improve the overall efficiency of California’s energy system. Increased energy efficiency retains its long-standing position as a centerpiece of the State’s policy and legislation.
Themophotovoltaic (TPV) cells convert radiant energy directly into useful electricity, much like traditional photovoltaic cells convert sunlight to electricity. In the case of TPV, the light source is radiant energy emitted as photons in the infrared from a heat source. Current TPV operates at wavelengths corresponding to source (emitter) temperatures of approximately 900°C (1,652°F) to 1,500°C (2,732°F). Current TPV cells remain less than 20 percent efficient. Expanding the spectral response, increasing the size for economy of scale, and lowering the use of expensive raw materials are key to both enabling TPV to capture more waste heat and increasing overall efficiency. TPV can conceivably be paired with other generation types such as steam or combustion turbine systems to increase overall efficiency. Thermophotovoltaic systems have few, if any, moving parts and are therefore quiet and require little maintenance. These properties make TPV systems suitable for remote site and portable electricity generating applications. However, their efficiency is low and their cost is high compared to other electricity generating technologies. Current research in the area aims to increase the system efficiencies while keeping the system cost low.
In this project, researchers tested a novel method based on a patented process called interfacial misfit array for growing antimony (Sb)-based cells on gallium arsenide (GaAs) substrates to reduce the use of the more expensive gallium antimonide (GaSb) substrates, enhance the spectral response, and provide for scalability. The lattice structure of the antimony-based cells does not match the gallium arsenide substrate. Therefore the researchers created a molecular interface to relieve stress between the two layers. Figure 21 shows the concept at the interface of the two crystalline structures from a transmission electron microscope (TEM) scan of the interfacial region.
Figure 21: TEM Scan of Interface Between GaAs and GaSb
119
2.17.3 Objectives The goal of this project was to determine the feasibility of low cost TPV systems using Sb-based active layers grown on GaAs substrates. The researchers established the following project objectives:
1. Produce quaternary gallium indium arsenic antimony (GaInAsSb) materials in epitaxial films with less than 0.08 percent lattice mismatch to GaSb
2. Demonstrate greater than 90 percent internal quantum efficiency on GaAs substrates compared to greater than 90 percent on GaSb substrate near band edge
3. Demonstrate greater than 20 percent thermal to electrical conversion efficiency at radiator temperature of 950°C (1,742°F) to 1,000°C (1,832°F) and diode temperature of 27 C (81°F)
4. Reduce device growth cost from $1,500 /3 in wafer to $400/3 in wafer using an industrial MBE machine
2.17.4 Outcomes 1. The researchers grew GaxIn1-xAsySb1-y films on IMF GaSb substrates. Using x-ray
diffraction, they measured a lattice constant for the film of 6.13 angstroms (Å) and about 0.57 percent mismatch to GaSb.
2. The researchers grew GaSb films on GaSb and GaAs substrates. The researchers measured an approximate 90 percent internal quantum efficiency at 1.5 for baseline GaSb devices grown on GaSb substrates. They measured the devices grown using IMF growth of GaSb on GaAs substrates at approximately 64 percent internal quantum efficiency. The researchers did not test the GaInAsSb devices.
3. The researchers did not test the GaSb or GaInAsSb devices under high temperature.
4. The researchers did not complete the cost reduction aspect of the project.
2.17.5 Conclusions 1. The GaxIn1-xAsySb1-y films grown on GaSb substrates had higher lattice mismatch by
almost a factor of eight. The researchers did not achieve this objective. 2. The devices grown using the tested method performed less than the baseline. The
researchers did not achieve this objective. 3. The researchers did not perform high temperature emitter tests. They did not complete
this objective. 4. The researchers did not complete this objective.
The researchers have not demonstrated the feasibility of low cost TVPs using Sb-based active layers grown on GaAs substrates.
120

2.17.6 Recommendations The program administrator recommends the researchers complete high temperature testing of the GaSb and quaternary films grown on GaAs substrates. The researchers should investigate additional quaternary formulations grown on GaAs substrates. The researchers should complete a comparative cost analysis once an appropriate cell is developed that beats current technology in performance.
2.17.7 Benefits to California Public benefits derived from PIER research and development projects are assessed within the following context:
• Reduced environmental impacts of the California electricity supply or transmission or distribution system
• Increased public safety of the California electricity system
• Increased reliability of the California electricity system
• Increased affordability of electricity in California
The primary benefit to the ratepayer from this research would be reduced environmental impacts of the California electricity supply or transmission or distribution system once the technology is shown to be feasible. Given the current unproven status of the technology, the primary benefit to California ratepayers of this project is its research value. It may have application benefit in areas outside electrical generation, such as electronics, and in traditional photovoltaics.
2.17.8 Technology Transition Assessment As the basis for this assessment, the program administrator reviewed the researchers’ overall development effort, which includes all activities related to a coordinated development effort, not just the work performed with EISG grant funds.
Marketing/Connection to the Market To gain widespread acceptance of this technique, the researchers will need to extend outreach to other researchers investigating other PV materials faced with active layer to substrate lattice mismatch. One research paper based on the findings from this work was submitted to a peer-reviewed journal. The researchers have not surveyed potential customers for interest in the product nor have they performed a market analysis.
Engineering/Technical The researchers estimated they would need at least two additional years and about $200,000 to complete development and demonstration. They plan to submit proposals to state and federal agencies seeking money to continue this project.
121

Legal/Contractual The basic technology concept is already held under patent by the researchers. Since the work described here did not show technical feasibility, additional patent protection beyond that already held would be premature.
Environmental, Safety, Risk Assessments/ Quality Plans All major constituents, (gallium, indium, arsenic, and antimony) are toxic and will need special handing during fabrication, although not beyond normal industrial standards. Similarly, disposal of broken TPV using these materials will need to be kept separated from the waste stream, much like electronic waste.
Production Readiness/Commercialization The concept is not yet ready for commercialization. The researchers stated that this technology could be commercialized with the help of other organizations such as JX Crystals, Inc.
122
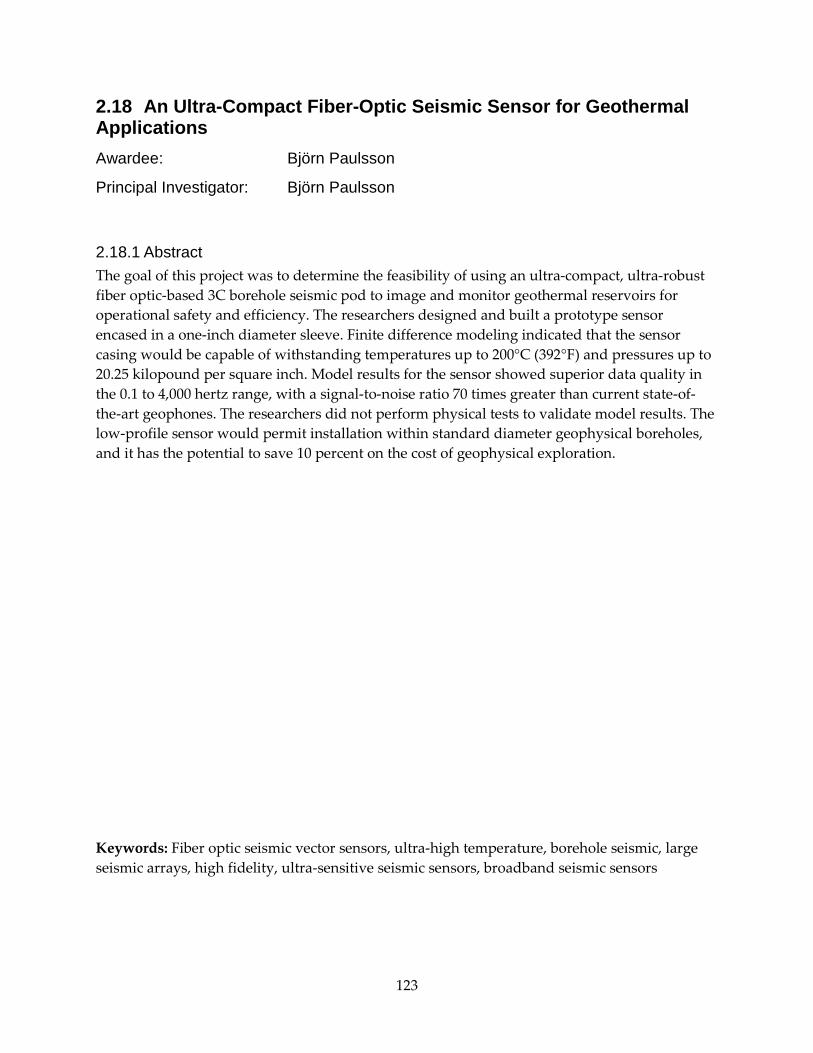
2.18 An Ultra-Compact Fiber-Optic Seismic Sensor for Geothermal Applications Awardee: Björn Paulsson
Principal Investigator: Björn Paulsson
2.18.1 Abstract The goal of this project was to determine the feasibility of using an ultra-compact, ultra-robust fiber optic-based 3C borehole seismic pod to image and monitor geothermal reservoirs for operational safety and efficiency. The researchers designed and built a prototype sensor encased in a one-inch diameter sleeve. Finite difference modeling indicated that the sensor casing would be capable of withstanding temperatures up to 200°C (392°F) and pressures up to 20.25 kilopound per square inch. Model results for the sensor showed superior data quality in the 0.1 to 4,000 hertz range, with a signal-to-noise ratio 70 times greater than current state-of-the-art geophones. The researchers did not perform physical tests to validate model results. The low-profile sensor would permit installation within standard diameter geophysical boreholes, and it has the potential to save 10 percent on the cost of geophysical exploration.
Keywords: Fiber optic seismic vector sensors, ultra-high temperature, borehole seismic, large seismic arrays, high fidelity, ultra-sensitive seismic sensors, broadband seismic sensors
123
2.18.2 Introduction A 2013 report by the Geothermal Energy Association identified an installed geothermal energy capacity of 3,390 megawatts (MW) in the United States, 80 percent of which was generated in California. Although geothermal energy consumption accounts for 3 percent of energy consumption in the United States, it provides 6 percent of California’s energy consumption.
Geothermal energy is reliable and more efficient than any other energy generation sources, including both renewable and non-renewable sources. Further, it can provide continuous production unlike intermittent sources such as wind generation and solar power. Although geothermal energy is presently a relatively minor contributor to energy production, it has the potential to provide over 20 percent of national energy demand. Geothermal power can only be considered sustainable if the reservoirs are properly monitored and managed. Typically, monitoring the reservoirs is done using surficial or borehole seismic surveys. Surficial seismic analyses are limited in depth and resolution of the subsurface environment, resulting in a preference for down hole seismic testing arrays. However, current monitoring instrumentation is limited in its ability to withstand exposure to high temperatures and pressures found in deep geothermal boreholes. Furthermore, existing geophone-based arrays are too large in diameter to fit within the space between the wall of the drilled hole and the well casing, requiring an increase in well diameter, which is cost prohibitive.
The researchers proposed a low-profile borehole seismic sensor that could be installed either inside or outside a standard well casing. The module was comprised of a proprietary fiber optic sensor encapsulated in a one inch diameter corrosion resistant stainless steel capsule capable of withstanding high temperatures and pressures (see Figure 22). Three or more modules would be connected in series along the interior or exterior of the borehole, with electronics placed at the surface. The researchers used finite difference modeling to evaluate the effects of temperature and pressure on the steel capsule and used three-dimensional (3-D) printing to evaluate the ease of assembly. Test results suggested the proposed sensor might successfully withstand temperatures up to 200°C (392°F) and pressures up to 20.25 kilopounds per square inch (ksi). Model results also showed superior data quality in the 0.1 to 4,000 hertz (Hz) range, with a signal-to-noise ratio 70 times greater than current state-of-the-art geophones. The researchers did not perform physical testing to validate the model results.
The researchers anticipated the use of the proposed technology would result in a savings of more than 10 percent of the cost of geothermal exploration. Support for this estimate was not provided. The researchers were unable to quantify direct benefits to California ratepayers.
Figure 22: Machined 1-Inch Diameter Seismic Sensor Pod
124

2.18.3 Objectives The goal of this project was to determine the feasibility of using an ultra-compact, ultra-robust fiber optic-based 3C borehole seismic pod to image and monitor geothermal reservoirs for operational safety and efficiency. The researchers established the following project objectives:
1. Demonstrate that the fiber optic seismic sensor design fits inside a 3C pod with an outside diameter (OD) of 1 inch
2. Demonstrate that the predicted resonance frequency is over 1,600 Hz and that the predicted pressure rating is 30 ksi or more
3. Assemble a 3-D printed ultra-compact fiber optic sensor and sensor pressure vessel.
4. Assess if design meets desired form factor
5. Manufacture all the components
6. Demonstrate that the fiber optics seismic sensor fits into the pod and can easily be assembled
7. Demonstrate sensors will generate high fidelity, high signal-to-noise) ratio data from 5 Hz to 1,600 Hz at temperatures up to 300°C (527°F)
8. Demonstrate that sensors have a noise floor below 50 µg per √Hz, bandwidth 5 to 1,600 Hz, and cross axis isolation better than -50 decibels (dB)
9. Confirm that the projected manufacturing cost of the completed borehole ultra-compact fiber optic seismic sensor is less than $5,000 per channel
10. Confirm that the projected life cycle cost of the new sensor is less than $15,000 per channel, which is the current commercial cost for borehole geophone arrays
2.18.4 Outcomes 1. The researchers selected two fibers having 50 micrometers (µm) and 80 µm cladding
diameters and reviewed a number of different metals for the capsule. They used the fiber diameter of 80 µm for modeling. They selected Inconel 718 stainless steel after performing finite difference modeling. The researchers did not present model results and selection criteria for either the fiber or metal selected. They manufactured two prototypes with fiber optic sensors housed in a casing with a length of 16 inches and an outside diameter of 1 inch.
2. The researchers performed finite difference modeling to determine that the capsule had a structural resonance over 1,600 Hz. However, they did not present data to support this finding. Model results presented indicated that the housing would withstand a temperature of 21°C (70°F) and pressure of 26.15 ksi. Although the researchers stated that the sensor could withstand 27 ksi, they did not present these results.
3. The researchers submitted SOLIDWORKS design drawings for 3-D printing. They completed the module assembly as proposed.
125

4. The assembled pod had a one inch diameter, as proposed.
5. The researchers self-manufactured the prototype components.
6. The researchers assembled the low-profile fiber optic sensor in the prototype casing.
7. Tap tests indicated the signal-to-noise ratio for the proposed sensor was 952, 70 times that of a standard geophone. The researchers performed tests from 0.1 Hz to 4,000 Hz. They did not perform temperature tests as proposed.
8. The researchers tested the noise floor using interrogator electronics and demonstrated the noise level was lower than 50 µg/√Hz over a frequency of 15 Hz. Noise detected below 15 Hz was caused by environmental conditions that could not be eliminated in the researchers’ lab. A tap test demonstrated that the sensor operated at band widths in excess of 5 Hz to 1,600 Hz and outperformed state-of-the-art accelerometers and geophones. The researchers did not determine the cross axis isolation for the prototype sensor as proposed.
9. The researchers stated the manufacturing cost for a 3C sensor pod was about $15,000 or about $5,000 per channel. They did not present supporting data.
10. The researchers stated the life cycle costs for the electronics and sensors for a 3C pod was about $45,000 or about $15,000 per channel. They did not present supporting data to indicate the types of costs included in the life cycle analysis.
2.18.5 Conclusions 1. The researchers met the objective to demonstrate the fiber optic sensor would fit within
a one inch diameter casing.
2. Although the researchers met the objective to demonstrate a resonance frequency of 1,600 Hz, they did not meet the objective to withstand 30 ksi. They presented very limited data in support of this objective. Although they did not validate test results by physical testing, the researchers’ proposal indicated this objective would be performed through finite difference modeling.
3. The researchers met the objective to print and assemble a module using 3-D printing.
4. The researchers met the objective to meet the desired form factor. The criterion for success for this objective was only based on the diameter of the module.
5. The researchers met the objective to manufacture the components.
6. The researchers met the objective to assemble the sensor into the manufactured casing.
7. The researchers met half of the objectives for sensor testing. The signal-to-noise ratio was higher than either a geophone or accelerometer. They did not perform temperature testing. However they tested a similar sensor for one week at 320°C (608°F) without failure. The researchers did not indicate the reasoning for testing an alternate sensor and
126

did not describe how the tested sensor was similar to or different from the prototype or the relevancy of the alternate test results.
8. The researchers met most of the objectives for the proposed sensor. Although they did not model cross axis isolation, they did model a similar sensor and found it to have across axis isolation of -80 dB. The researchers did not indicate the reasoning for testing an alternate sensor and did not describe how the tested sensor was similar to or different from the prototype or the relevancy of the alternate test results.
9. The researchers met the objective to confirm manufacturing costs. However, without any supporting data, this confirmation could not be validated. Further, costs presented did not indicate whether there were any potential economies of scale.
10. The researchers met the objective to confirm life cycle costs. However, without any supporting data, this confirmation could not be validated.
11. The researchers met half of the objectives for sensor testing. The signal-to-noise ratio was higher than either a geophone or accelerometer. They did not perform temperature testing. However they tested a similar sensor for one week at 320°C (608°F) without failure. The researchers did not indicate the reasoning for testing an alternate sensor and did not describe how the tested sensor was similar to or different from the prototype or the relevancy of the alternate test results.
12. The researchers met most of the objectives for the proposed sensor. Although they did not model cross axis isolation, they did model a similar sensor and found it to have across axis isolation of -80 dB. The researchers did not indicate the reasoning for testing an alternate sensor and did not describe how the tested sensor was similar to or different from the prototype or the relevancy of the alternate test results.
13. The researchers met the objective to confirm manufacturing costs. However, without any supporting data, this confirmation could not be validated. Further, costs presented did not indicate whether there were any potential economies of scale.
14. The researchers met the objective to confirm life cycle costs. However, without any supporting data, this confirmation could not be validated.
15. The researchers were successful in prototyping the proposed sensor pod and performing finite difference modeling to predict behavior. However, they performed almost no physical testing of the prototype or its components to validate the predictions. Even in cases where they did perform some physical testing, the researchers acknowledged they performed the testing on a similar sensor rather than the prototype.
2.18.6 Recommendations The program administrator recommends that the following tasks be completed:
1. Conduct physical testing on the prototype as proposed to determine actual temperature and pressure limitations.
127

2. Repeat physical testing on the prototype sensor rather than a similar sensor.
3. Conduct field testing to determine quality of data compared to other state-of-the-art methods.
4. Perform a market survey to quantify market potential, and quantify potential savings through the use of the proposed technology.
5. Perform detailed cost analyses to support objectives 9 and 10.
6. Pursue a provisional patent for proprietary design elements.
2.18.7 Benefits to California Public benefits derived from PIER research and development projects are assessed within the following context:
• Reduced environmental impacts of the California electricity supply or transmission or distribution system
• Increased public safety of the California electricity system
• Increased reliability of the California electricity system
• Increased affordability of electricity in California
The primary benefit to the ratepayer from this research is increased affordability of electricity in California. The researchers were unable to quantify the benefit to ratepayers but estimated a savings of more than 10 percent of the cost of geothermal exploration. However, they gave no support for this estimate.
2.18.8 Technology Transition Assessment As the basis for this assessment, the program administrator reviewed the researchers’ overall development effort, which includes all activities related to a coordinated development effort, not just the work performed with EISG grant funds.
Marketing/Connection to the Market The researchers have not yet performed a market analysis. The market includes commercial and industrial companies involved in geothermal, oil, and gas exploration.
Engineering/Technical The researchers have not yet performed physical testing at high pressure and temperature or in a field installation. The researchers estimate that it will take one year and cost $800,000 to complete engineering, development, and demonstration of the proposed technology.
Legal/Contractual The researchers have identified proprietary technologies that might be candidates for patent protection but have not yet performed a self-search or filed a provisional patent for this technology.
128

Environmental, Safety, Risk Assessments/ Quality Plans The researchers do not anticipate any negative effects with regard to public safety or the environment. None of these plans and assessments was accomplished during this project.
Production Readiness/Commercialization The technology is not yet developed sufficiently to pursue commercialization. Once the proof- of-concept work is complete, the researchers will pursue commercialization independently.
129

2.19 Liquid Metal Thermal Energy Storage Awardee: Thermaphase Energy
Principal Investigator: Arlon Hunt
2.19.1 Abstract Concentrated solar power is a candidate to lower greenhouse gas emissions by displacing fossil fuels in electricity generation. To be successful it must lower its cost and provide nighttime dispatchablity. Two features of concentrated solar power that can decrease cost and provide dispatchability are higher operating temperatures and thermal energy storage. The liquid metal thermal energy storage system is an innovative thermal energy storage system based on the latent heat of melting in aluminum-silicon and magnesium-silicon alloys. The liquid metal thermal energy storage system can store thermal energy produced by gas-cooled solar receivers at temperatures above 800° C (1472°F). However, long term reliable containment for aluminum-silicon and magnesium-silicon alloy melts is critical for liquid metal thermal energy storage system commercialization. Any containment vessel must be simultaneously compatible with the molten alloys and high temperature oxidizing gases (air), facilitate heat transfer between the alloys and high temperature oxidizing gases, and accommodate internal stresses associated with thermal energy storage operation.
A ceramic-metallic composite material, TCON, and select ceramics such as siliconized silicon carbide and alumina showed promise as appropriate containment vessels. However, thermal tests on TCON revealed macroscopic nodules during cycling that eliminated it from further consideration. In contrast, siliconized silicon carbide performed well when exposed to high temperature AlSi36, MgSi56, and air. Scanning electron microscopy and electron dispersion spectroscopy analysis, taken after multiple high temperature cycles in inert gas and air environments, further confirmed siliconized silicon carbide was a good candidate for a containment vessel. Initial tests on Morcoset, a silicon carbide-based mortar, for creating an airtight seal for siliconized silicon carbide were promising. The researchers concluded that siliconized silicon carbide containers and AlSi36, MgSi56 thermal storage materials were a feasible approach to thermal storage for concentrated solar power systems.
Keywords: CSP, thermal energy storage, LiMTESS, reaction bonded silicon carbide, AlSi, MgSi
130
2.19.2 Introduction In 2012 California green house gas (GHG) emissions were 459 million metric tons (MMT) of carbon dioxide (CO2) equivalent. CO2 is the primary GHG emitted in California, accounting for 85 percent of total GHG emissions in 2012. Carbon-based fuel combustion in transportation (43 percent) and electricity generation (24 percent) were the largest contributors to CO2 emission. In-state electricity generation contributed 13 percent to the total California CO2 emissions, and 11 percent was from imported electricity. Thus, replacing carbon-based fueled combustion in electricity generation with renewable sources is of interest. Solar energy is an attractive candidate, but its market penetration has been slowed by cost and lack of storage for nighttime use. The power generated by concentrated solar power (CSP) worldwide reached 3,425 megawatt peak (MWp) (2013).30 The federal Sunshot Initiative has forecast that utility-scale CSP with thermal storage is a candidate to meet 6 cents per kilowatt-hour (kWh) cost target and nighttime dispatchability goal.31 CSP technologies use mirrors to reflect and concentrate sunlight onto absorbers that collect and store solar energy and convert it to high temperature thermal energy. The thermal energy can then be used to produce electricity via a turbine or heat engine driving a generator.32 For the heat engine to be efficient, the stored heat should be at high temperature, about 800°C (1472°F). A present approach to storage is a thermal reservoir in the form of a eutectic fused salt mixture that melts at high temperatures and has high heat capacity.33 The ease of transferring the stored energy is increased because the heat storage medium is a compact liquid rather than a large solid. However, high temperature liquid salt-based storage media is very corrosive, and it decomposes at high temperature. What is needed is a high temperature liquid phase-change material that can be contained without damaging its container and does not decompose. The benefit to California ratepayers if the problem is solved would be a reduction in GHG emissions from both natural gas (NG) and coal combustion.
The advancement of science or technology that was proposed in this project was a liquid metal thermal energy storage system (LiMTESS) for CSP. It was designed to store thermal energy produced by gas-cooled solar receivers in CSP systems, sometimes called power towers, at temperatures above 800°C. It was based on the latent heat of melting and to a lesser extent the sensible heat capacity of aluminum-silicon (Al-Si) and magnesium-silicon Mg-Si alloys. These materials have desirable thermodynamic and heat transfer properties in a high, broad temperature range. The temperature range at which Al-Si and Mg-Si alloys store and release heat is tunable between 577°C (1035°F) and 1,414° C (2577°F) and 946°C (1735°F) and 1,414° C (2577°F), respectively, by varying the composition. These alloys have high specific energy and energy density because silicon has one of the highest known latent heats of fusion.34 There is
30 http://en.wikipedia.org/wiki/Concentrated_solar_power
31 http://energy.gov/eere/sunshot/sunshot-initiative
32 http://energy.gov/eere/sunshot/concentrating-solar-power
33 http://en.wikipedia.org/wiki/Solar_power_tower
34 http://www.engineeringtoolbox.com/fusion-heat-metals-d_1266.html
131

excellent heat transfer within Al-Si and Mg-Si alloys by conduction and by convection when the alloys are at least partially liquid. Because heat transfer within the materials is good, no pumps are required.
Al-Si and Mg-Si alloys are inexpensive, readily available industrial materials. Containing molten Al-Si and Mg-Si alloys, however, is critical for commercialization. Any containment material must be simultaneously compatible with the alloys and high temperature oxidizing gases (air), must allow heat transfer between the alloys and high temperature oxidizing gases, and must accommodate internal stresses associated with thermal energy storage (TES operation).
The goal of this project was to validate the use of selected containment materials and manufacture and analyze the performance of lab-scale storage modules of selected containment materials. Beginning with TCON, a class of ceramic-metal composite materials, the researchers evaluated selected containment materials’ compatibility with AlSi36 (36 at. percent Si, off-eutectic) and MgSi56 (56 at. percent Si, on-eutectic) for their compatibility with high temperature oxidizing gas.35 The researchers evaluated techniques and materials for sealing containers air tight and analyzed them for their simultaneous compatibility with AlSi36, MgSi56, and high temperature oxidizing gas while maintaining an airtight seal.
2.19.3 Objectives The goal of this project was to determine the feasibility of using TCON, a class of ceramic-metallic composite materials, to contain Al-Si and Mg-Si alloys for LiMTESS and manufacture and analyze the performance of laboratory-scale storage modules of TCON. The researchers established the following project objectives:
1. Evaluate TCON compositions for compatibility with AlSi36 and MgSi56. Manufacture cups and charges. Cycle cups and charges in non-oxidizing environment for three days: 12 hours at 1,100°C (2,012°F) and 12 hours at 500°C (932°F). Use optical microscopy and scanning electron microscopy (SEM) with electron dispersion spectroscopy (EDS) to confirm through visual inspection that no corrosion, erosion, or deposition is indicated on cups. Perform sessile drop testing on cups and charges at 1,100°C (2,012°F). Use imaging to confirm lack of wetting with minimum contact angle of 75° between cups and charges after 90 minutes.
2. Evaluate best compositions for compatibility with high temperature oxidizing gas. Cycle cups in air for three days: 12 hours at 1,100°C and 12 hours at 500°C. Use optical microscopy and SEM with EDS to confirm through visual inspection that no corrosion or erosion is indicated on cups. Use balance to confirm mass loss of cups is less than 1.0 percent. Select best compositions.
35https://books.google.com/books?id=kTj2Eqs6E0kC&pg=PA349&dq=TCON+ceramic+metallic+composite&hl=en&sa=X&ei=yXlCVZuPK8jGogTwpoEw&ved=0CEEQ6AEwBQ#v=onepage&q=TCON percent20ceramic percent20metallic percent20composite&f=false
132

3. Evaluate glass gasket for sealing best compositions airtight. Manufacture tubes and gaskets. Load tubes with oxidation standard and seal in a non-oxidizing environment. Cycle tubes in air for three days: 12 hours at 1,100°C and 12 hours at 500°C (932°F). Use optical microscopy and SEM with EDS to confirm through visual inspection that no corrosion, erosion, or deposition is indicated on tubes or gaskets. Use balance to confirm mass loss of oxidation standard is less than 1percent of baseline, indicating limited air seepage.
4. Validate best compositions and sealing technique for simultaneous compatibility with AlSi36, MgSi56, and high temperature oxidizing gas. Manufacture tubes and gaskets. Load tubes with AlSi36 and MgSi56 and seal in a non-oxidizing environment. Cycle tubes in air for 10 days: 12 hours at 1,100°C and 12 hours at 500°C. Use optical microscopy and SEM with EDS to confirm through visual inspection that no corrosion, erosion, or deposition from storage material or high temperature oxidizing gas is indicated on tubes or gaskets.
2.19.4 Outcomes 1. The researchers determined that commercial TCON cups cost $200 per unit and SiSiC
cups cost $128.43 per unit. The TCON cups exuded nodules, balls of AlSi12 (eutectic) that melted and exited the cup after cycling for three days between 500°C and 1,100°C in argon. No evidence of formation was reported in literature. Therefore the team investigated SiSiC as an alternative. SiSiC cups and AlSi36 charges were compatible when cycled for three days between 500°C and 1,100°C in argon. Scanning electron micrographs (SEM) and electron dispersive spectroscopy (EDS) showed poor wetting and a clear unpenetrated boundary between SiSiC and AlSi36. SiSiC cups and MgSi56 charges were also compatible when cycled for one day between 500°C (932°F) and 1,100°C (2012°F) in argon. SEMs and EDS showed similarly poor wetting and a clear unpenetrated boundary. The researchers limited cycling to one day because of magnesium vapor loss from unsealed cups. Due to the shortened project duration, the research team did not conduct sessile drop testing on SiSiC cups with AlSi36 or MgSi56 charges. However, SEMs show poor wetting and a clear unpenetrated boundary between SiSiC and both charges.
2. SiSiC cups were compatible with air when cycled for three days between 500° C and 1,100° C in air because SEMs, EDS, and visual inspection showed no structural or visual changes in the cups along with minimal oxidation. SiSiC cups did not lose weight as careful weight measurements showed negligible mass loss.
3. The research team selected Morcoset mortar with gas drying (such as drying in argon and airas the sealing technique. Only 9.3 grams of Morcoset were required to seal SiSiC cups, so sealed SiSiC cups cost 3 cents per unit. Due to shortage of time, the research team did not conduct tests in air with the SiSiC cups sealed by the mortar. However, results from the loaded vs. un-loaded test conducted in argon indicate the mortar created a high quality seal. The team could not find a suitable oxidation standard to evaluate the Morcoset sealing technique, so the team used magnesium vapor loss as an
133

alternative, comparing the weight loss of an MgSi56-loaded SiSiC cup to an unloaded SiSiC cup. After accounting for Morcoset weight loss during curing, the team measured negligible magnesium vapor loss in the MgSi46-loaded cup, from which it inferred a high quality seal.
4. Due to the shortened project duration, the research team did not test a SiSiC-AlSi36/MgSi56-Morcoset system in air. However, the team showed that SiSiC is compatible with AlSi36/MgSi56 and high temperature air and that Morcoset effectively seals SiSiC to create an AlSi36/MgSi56 system inside the cup and an air-only system outside the cup. The research team did not conduct the cycling for 10 days between 500° and 1,100°C in air.
2.19.5 Conclusions 1. TCON was an unsatisfactory container due to partial melting when cycled between 500°
C (932°F) and 1,100° C (2012°F). The researchers demonstrated that SiSiC is a satisfactory material for containing AlSi36 and MgSi56 melts, displaying little wetting and no penetration of the container material. Due to loss of time, sessile drop testing was not carried out. But successful wetting and penetration tests indicated that it would be successful. This objective was met only in part, but overall it was largely a success.
2. The researchers determined that SiSiC cups are compatible with air over three-day tests at operation temperatures. This objective was met.
3. The researchers found a mortar technique for sealing cups. Seal testing in argon (but not air) indicated a good seal. It seems likely that it would be successful in air, but this needs to be confirmed with actual tests. This objective was met only in part.
4. The researchers did not do thermal cycle testing in air for 10 days. Therefore this objective was not met. Presumably this was due to the extra time spent on TCON testing and analysis.
The new SiSiC container and silicon-based thermal storage materials look promising. However, long-term compatibility testing is needed. Tests over 10 days will be necessary, but not sufficient, to provide confidence in long term application. Overall, the researchers have shown that their approach is feasible, at least over the short term.
2.19.6 Recommendations The program administrator recommends that the researchers take into account the volume change of the alloys during melt/solidification. For elemental silicon the increase in density upon melting is 9 +/-1percent. This is significant because it could lead to large internal stresses in a container. It may be necessary to accommodate the volume change over a possible lifetime of thousands of diurnal melt-freeze cycles over several years. Also, there could be some surprises over long term disproportionation effects if the charge is not completely melted.
The program administrator also recommends that the researchers seal two SiSiC cups with carefully weighed charges of AlSi36 and MgSi56 and treat them at 1,100° C (2012°F) for at least
134

several months. This could give them information relating to long term reactions or sealing problems.
After taking into consideration (1) research findings in the grant project, (2) overall development status, and (3) relevance of the technology to California and the PIER Program, the program administrator has determined that the proposed technology should be considered for subsequent funding within the PIER Program.
Receiving subsequent funding ultimately depends upon (1) availability of funds, (2) submission of a proposal in response to an invitation or solicitation, and (3) successful evaluation of the proposal.
2.19.7 Benefits to California Public benefits derived from PIER research and development projects are assessed within the following context:
• Reduced environmental impacts of the California electricity supply or transmission or distribution system
• Increased public safety of the California electricity system
• Increased reliability of the California electricity system
• Increased affordability of electricity in California
The primary benefit to the ratepayer from this research is reduced environmental impacts of the California electricity supply or transmission or distribution system. If a thermal storage system for CSP-derived electricity were developed, there could be a significant reduction in GHG emissions from both NG and coal combustion.
The total California electricity generated in 2013 was 296,628 GWh.7 Of this, 199,783 GWh was generated in-state, 120,863 gigawatt-hours (GWh) by NG (60.5 percent of in-state) and only 1,018 GWh by coal (0.51 percent of in-state). However, California imported another 96,845 GWh from out-of-state with 10,560 GWh by NG (10.9 percent of out-of-state) and 22,175 GWh by coal (22.9 percent of out-of-state). The total power from the two fossil fuel sources (in- and out-of-state) was 131,423 GWh NG (44.31 percent of total consumption) and 23,193 GWh coal (7.82 percent of total). The combustion of NG for electricity produced 1.21 lbs per kWh of carbon dioxide and coal produced about 2.1 lbs per kWh.8 Thus, NG emitted 72.3 million metric tons (MMT) of CO2 and coal emitted 22.1 MMT of CO2 in California electricity consumption.
The complete elimination of CO2 emissions would remove 94.4 MMT of CO2 if a cost effective CSP with thermal storage were developed that could displace all NG and coal combustion in California electricity consumption. Clearly the actual amount saved would be less than this, but it demonstrates the scale of potential savings.
135

2.19.8 Technology Transition Assessment As the basis for this assessment, the program administrator reviewed the researchers’ overall development effort, which includes all activities related to a coordinated development effort, not just the work performed with EISG grant funds.
Marketing/Connection to the Market The researchers performed a preliminary market assessment but had not talked with potential customers by the end of this project. They claim they received interest in commercializing the concept from several major companies in the CSP market.
Engineering/Technical The researchers expect that they can complete development and demonstration in three to five years with funding of up to $500,000.
Legal/Contractual The researchers have applied for two patents (12/878,896 and 61/664,643) and are currently negotiated with patent examiners over infringement issues.
Environmental, Safety, Risk Assessments/ Quality Plans Because of the type of materials and the high temperatures, these assessments must be performed.
Production Readiness/Commercialization The researchers stated that their company is too small to manufacture the technology. They plan to partner with a large engineering firm to commercialize the technology. The barriers they see to commercialization are securing patent protection and successfully building and testing a prototype
136

2.20 Concentrated Solar Power on Demand Proof of Concept Awardee: Daniel Codd, PhD, PE
Principal Investigator: Daniel Codd, PhD, PE
2.20.1 Abstract In this project, researchers tested a single-tank thermal energy storage system with a movable and insulated divider plate separating the hot and cold heat exchange fluids. The researchers fabricated and tested a 240-liter assisted thermocline tank using water as the working fluid. They moved the position of the divider to match the thermocline between hot and cold water as heat was added or removed. Heat was added and removed to replicate charge-store-discharge conditions. During six-hour storage cycles, the tank exhibited a round trip storage efficiency of 0.53 compared to 0.46 for the baseline tank, a 14 percent improvement. The divided tank achieved a 53 percent improvement in usable thermal storage capacity compared to baseline tank design. The researchers used experimental findings to redesign and confirm larger-scale development feasibility. The next step is to confirm the design’s improvements over baseline with salt storage medium.
Keywords: Thermal energy storage, concentrating solar power, assisted thermocline, molten salt, divider plate
137
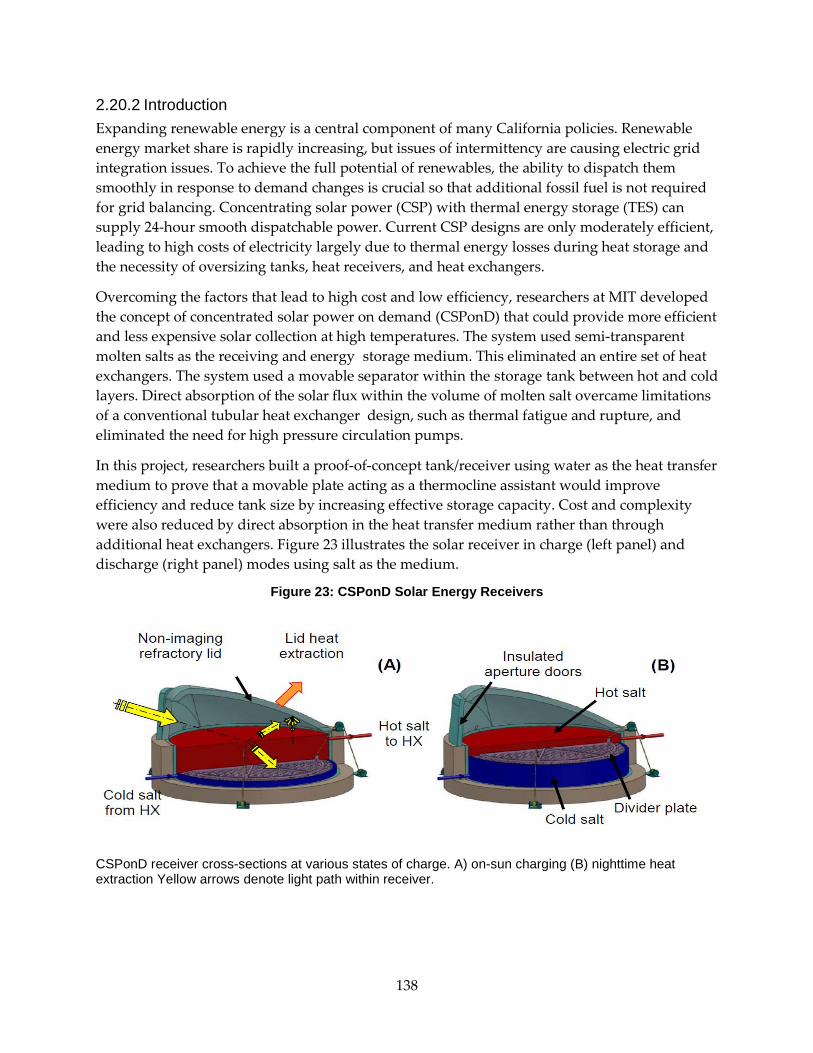
2.20.2 Introduction Expanding renewable energy is a central component of many California policies. Renewable energy market share is rapidly increasing, but issues of intermittency are causing electric grid integration issues. To achieve the full potential of renewables, the ability to dispatch them smoothly in response to demand changes is crucial so that additional fossil fuel is not required for grid balancing. Concentrating solar power (CSP) with thermal energy storage (TES) can supply 24-hour smooth dispatchable power. Current CSP designs are only moderately efficient, leading to high costs of electricity largely due to thermal energy losses during heat storage and the necessity of oversizing tanks, heat receivers, and heat exchangers.
Overcoming the factors that lead to high cost and low efficiency, researchers at MIT developed the concept of concentrated solar power on demand (CSPonD) that could provide more efficient and less expensive solar collection at high temperatures. The system used semi-transparent molten salts as the receiving and energy storage medium. This eliminated an entire set of heat exchangers. The system used a movable separator within the storage tank between hot and cold layers. Direct absorption of the solar flux within the volume of molten salt overcame limitations of a conventional tubular heat exchanger design, such as thermal fatigue and rupture, and eliminated the need for high pressure circulation pumps.
In this project, researchers built a proof-of-concept tank/receiver using water as the heat transfer medium to prove that a movable plate acting as a thermocline assistant would improve efficiency and reduce tank size by increasing effective storage capacity. Cost and complexity were also reduced by direct absorption in the heat transfer medium rather than through additional heat exchangers. Figure 23 illustrates the solar receiver in charge (left panel) and discharge (right panel) modes using salt as the medium.
Figure 23: CSPonD Solar Energy Receivers
CSPonD receiver cross-sections at various states of charge. A) on-sun charging (B) nighttime heat extraction Yellow arrows denote light path within receiver.
138

2.20.3 Objectives The goal of this project was to determine the feasibility of storing and extracting thermal energy from a prototype CSPonD divided thermocline TES tank. To achieve this goal, the researchers sought to complete the following objectives:
1. Develop a test bed prototype using water as the working fluid, an input power rating of 5 kilowatts (kW), and maximum heat rejection rate of 10 kW
2. Measure key performance parameters to an accuracy of +/- 10 percent (energy input/extraction, temperature distribution, volumetric flow rates)
3. Demonstrate accuracy of +/- 5 percent for all sensors
4. Demonstrate divided thermocline barrier plate position is controllable to +/- 5 percent of range
5. Demonstrate improved performance of CSPonD divider plate design vs. baseline
6. Demonstrate output fluid temperature is +/- 10 percent of the initial fluid temperature regardless of system state of charge
7. Demonstrate increased TES utilization with 25 percent improvement in energy storage density
8. Verify a six-hour storage capacity with more than 25 percent improvement in round trip storage efficiency
9. Verify divider plate device can operate at least 100 hours (5 charge/discharge cycles) without failure or thermocline instability
10. Verify the model computer simulation predicted losses are within +/-10 percent of measured internal losses
11. Demonstrate from project findings megawatt (MW)-scale development remains viable: operating temperature is at least 700°C (1292°F); durability is at least 10,000 cycles (30 years); energy storage is at least 6 hours; capture and storage efficiency is at least 90 percent; full-scale receiver cost is less than $150 per kW.
2.20.4 Outcomes 1. The research team designed, built, and tested a 5 kW prototype. They used water as a
storage medium, an electric heater to thermally charge the system, and an 80,000 British thermal unit (Btu) per hour (23.4 kW maximum) radiator to replicate discharge. They used a blower fan to regulate thermal output.
2. The team measured key performance indicators of flow rate, temperature, and energy input and output. It measured flow rates using in-line flow sensors, temperatures with thermocouples it fabricated, and energy in/energy out based on flow rates and temperature differentials. See Outcome 3 for details.
139

3. Using measurements from Outcome 2, the researchers calculated measurement accuracies of :
i. Energy input/extraction (charge/discharge rates and amounts) to be ±3.3 percent.
ii. Temperature distribution within the tank to be ±2.6 percent.
iii. Volumetric flow rates to be ±2 percent.
4. The researchers moved the divider plate using a microcontroller and actuated with a stepper motor coupled to an overhead-mounted worm gear winch to follow the thermocline. They determined that the position could be controlled to within ±0.001 in (0.025 mm), or ±0.003 percent of full scale.
5. The researchers compared the performance of the divider plate design with the baseline design. Results are shown in Table 5. They demonstrated a 14 percent improvement in round trip efficiency.
Table 5: Net Energy Flows to/from Tank and Round-Trip Storage Efficiency
Energy input to tank (J)
Energy extracted from tank (J)
Energy input to tank (kWh)
Energy extracted from tank (kWh)
Round trip storage efficiency
Percent improvement
Baseline 2.57E+07 1.18E+07 7.13 3.29 0.46 -
Divider Plate 2.56E+07 1.35E+07 7.12 3.75 0.53 14%
6. Output fluid temperatures with the SCPonD divider plate tank remained within ±10
percent of the initial fluid temperature for 89 percent of tank capacity compared to only 58 percent for the baseline tank. This represents a 53 percent improvement in usable storage capacity.
7. The researchers measured the degree of stratification and compared it to the baseline tank. Stratification is an indicator of internal conduction losses from hot to cold layers, with higher stratification leading to lower losses. This is a measure of the TES use and energy storage density. The researchers made no statement indicating the numerical value of the change of energy storage density.
8. The researchers measured the energy losses during a simulated six-hour storage period. Over a six-hour period the system lost slightly less than 2 percent of the system charge. The divider plate exhibited a round trip storage efficiency of 0.53, compared to 0.46 for the baseline tank, a 14 percent improvement for the six-hour storage cycle.
9. The researchers cycled the divider plate configuration for five complete daily charge/store/discharge cycles (100 hours) to demonstrate robustness of the concept. No problems with robustness were disclosed.
140

10. The researchers compared model-predicted losses with measured losses, including transient conduction simulations. The predicted internal loss was 86 percent, while the measured value was 83 to 93 percent.
11. The researchers used their experimental findings to redesign the system, and determined that a larger-scale molten salt development is viable. The researchers estimated the levelized cost of electricity to be 7 cents to 33 cents per kilowatt-hour (kWh).
2.20.5 Conclusions 1. The researchers completed this objective.
2. Measurement errors of less than ± 10 percent were achieved for performance metrics, but may be increased at the higher temperatures of molten salt. The researchers completed this objective.
3. The researchers did considerably better than their objective.
4. The researchers did considerably better than their objective.
5. Round trip efficiency was enhanced 14 percent by the use of the divider plate design, although this may differ in full scale. The researchers completed this objective.
6. The researchers completed this objective.
7. It is difficult to determine to what extent this objective was met.
8. The researchers completed this objective. They measured a 14 percent improvement in round trip storage efficiency. This falls short of the projected 25 percent improvement.
9. The researchers discovered no durability issues during this test.
10. The researchers’ model successfully agreed with measured values.
11. Although the researchers declared their system viable, further development is required to substantiate this claim. The researchers used the National Renewable Energy Laboratory Solar Advisor Model for their cost analysis. It appeared to be a competent analysis.
The researchers demonstrated the technical feasibility of storing and extracting thermal energy from a prototype divided thermocline TES tank with water as the storage medium. The feasibility and practicality on a larger scale using molten salt will be tested in a next-stage project.
2.20.6 Recommendations The program administrator recommends the researchers:
1. Evaluate the system impacts of higher viscosity of molten salt compared to the lower viscosity of water used in this project. This will affect the movement of the separator plate, at least with respect to response time and motor drive requirements.
141

2. Increase the tank insulation to reduce heat lost during storage periods and determine optimal levels of insulation for different tank sizes.
3. Evaluate the horizontal thermal gradients resulting from direct solar heating of semi-transparent molten salt.
4. Determine the maximum heat extraction rate that avoids cold spots within storage. Rapid heat extraction rates will be necessary for rapid response to changes in electric demand. Calculate maximum ramp rate for a power plant using the new technology.
5. Complete a pilot-scale test using molten salt and do so with actual on-sun concentrated solar energy.
6. Perform longer durability and functionality testing, beyond the five charge/discharge cycles already completed. Long-term operation under the more extreme conditions of molten salt is important to further prove the concept. This should include variable charge and discharge heat input and output rates, along with different storage time periods.
7. Complete and document cost and performance aspects of CSP power plants using the concept, and compare these results to plants using baseline collection and storage.
After taking into consideration (1) research findings in the grant project, (2) overall development status, and (3) relevance of the technology to California and the PIER Program, the program administrator has determined that the proposed technology should be considered for subsequent funding within the PIER Program.
Receiving subsequent funding ultimately depends upon (1) availability of funds, (2) submission of a proposal in response to an invitation or solicitation, and (3) successful evaluation of the proposal.
2.20.7 Benefits to California Public benefits derived from PIER research and development projects are assessed within the following context:
• Reduced environmental impacts of the California electricity supply or transmission or distribution system
• Increased public safety of the California electricity system
• Increased reliability of the California electricity system
• Increased affordability of electricity in California
The primary benefit to the ratepayer from this research is reduced environmental impacts of the California electricity supply or transmission or distribution system. A secondary benefit is increased reliability of the California electricity system. Installation of 11 gigawatts (GW) of concentrating solar power would result in an elimination of perhaps 16 to 20 megatons (Mt) of carbon dioxide (CO2) emissions per year by 2030. Emissions of criteria pollutants like nitrogen
142

oxides (NOX) and particulate matter would also be reduced. Reliability would be enhanced, all other things being equal, using CSP to achieve part or a large fraction of the renewable mandate, since CSP is dispatchable while many other renewable options are not.
2.20.8 Technology Transition Assessment As the basis for this assessment, the program administrator reviewed the researchers’ overall development effort, which includes all activities related to a coordinated development effort, not just the work performed with EISG grant funds.
Marketing/Connection to the Market The researchers have published the results of their work to date in technical journals and presented it at trade conferences. They are working in cooperation with MIT Energy Initiative and the federal Advanced Research Projects Agency–Energy (ARPA-E) agency in developing the next pilot-stage test. Funding has been awarded. Through publication of results, utility and independent power producer and project developers’ interest will likely grow.
Engineering/Technical Preliminary engineering requirements for the next stage pilot test have been defined. Detailed requirements and specifications are currently in development for two (MIT/Masdar and ARPA-E) projects.
Legal/Contractual The researchers have applied for several patents that are currently being evaluated by United States and international patents officials.
Environmental, Safety, Risk Assessments/ Quality Plans There is no known safety or environmental risks of this technology compared to baseline thermal energy storage technology. Use of molten salt would likely pose less environmental and safety risk than use of synthetic thermal oil.
Production Readiness/Commercialization The concept is ready for pilot-scale testing. If successful, the concept will be ready for initial commercial demonstration and production.
143

2.21 CPV Receiver for Parabolic Troughs Awardee: Clean Energy Research Associates
Principal Investigator: Servando Gereau
2.21.1 Abstract In this project, researchers designed and tested a concentrating photovoltaic receiver for retrofitting solar thermal electric facilities using parabolic troughs. Using multi-junction concentrating photovoltaic cells along with secondary optical elements, the system was intended to generate power directly at the trough and replace the heat to steam turbine system. The researchers designed prototype modules that had outputs of 40 watts. The average solar concentration level was 92.5 suns. The researchers did not obtain conclusive results due to module construction difficulties leading to light interference on approximately 50 percent of the cell area.
Keywords: Concentrating photovoltaics, concentrating solar power, parabolic trough, multi-junction cells, receiver, secondary optical element, solar concentration
144

2.21.2 Introduction Concentrating solar power (CSP) plants that use parabolic troughs concentrate solar energy to produce steam that turns a turbine to produce electricity. Several have been in operation in California since about 1984 and provide just over 400 megawatts (MW) of renewable energy. As CSP plants age, operation and maintenance (O&M) costs become quite high. In 1999 Sandia National Laboratory reported that O&M requirements at Kramer junction (the major site of CSP plants) comprised about one-quarter the total cost of production. Existing plants are approaching the end of their expected lifespan and face shutdown or expensive refurbishment of heat exchangers, collector field collector tubes, and other equipment associated with the hot side of such plants.
In this project, researchers proposed using concentrating photovoltaics (CPV) to replace the hot side of the plants. Taking advantage of the existing tracking parabolic trough solar concentrators, yet reducing hot side costs, might economically extend the life of such plants. Parabolic trough solar fields represent as much as 50 percent of the total investment in plant construction. As an optical system for concentrating sunlight, the installed equipment should function well over a longer period than the thermal side. The concentrating PV would be placed at the focal line of the parabolic trough, replacing the heat collector tubes.
2.21.3 Objectives The goal of this project was to determine the feasibility of achieving an arrangement of multi-junction cells that is dense enough and a concentration level that is high enough on a solar parabolic trough to meet or exceed the power currently generated by thermal receivers on a per unit basis. The researchers established the following objectives:
1. Finalize the system design for arranging, mounting, and wiring the chosen multi-junction cells in a dense array to achieve 4.4 kilowatt-hours (kWh) per four-meter receiver and for a forced air convection cooling system to maintain operating temperature below 180°C (356°F)
2. Fabricate prototype device, confirm projected prototype cost (materials and assembly) of $8,000, and ensure mechanical system for supporting device at the precise position relative to focal point within accuracy of +/- 1 degree
3. Finalize test protocol and schedule and confirm it will measure the energy generation and cell operating temperature with an error of +/- 5 percent
4. Conduct prototype testing; demonstrate effectiveness of cell placement/density, in-field cell efficiency of 30 percent, and concentration level of 194x based on expected watts of 5.82 watts (W)/cm2 or 4,423 watts per receiver; demonstrate effectiveness of cell placement/density relative to system temperature and cooling strategy at or below 180°C. Perform manufacturing cost analysis to determine per unit cost reduction in a production mode from $8,000 to $4,000, an expected reduction of 50 percent.
5. Perform levelized cost of electricity impact analysis with a target of 12 cents/kWh.
145

2.21.4 Outcomes 1. The researchers designed and built a system for arranging, mounting, and wiring the
multi-junction cells with a secondary optical element (SOE) to concentrate light above 200x average, the level necessary for the chosen multi-junction cells. The researchers also designed a forced air convection cooling system to maintain operating temperature below 180°C (356°F). This objective was later abandoned in favor of a lighter, less expensive passive cooling system.
2. The researchers determined that the actual cost for materials and fabrication services was approximately $12,900 based on actual purchases of equipment. They also designed, built, and tested an adjustable support system. This system controlled the position of the receiver inward and outward within the focal length.
3. The researchers developed a test protocol that was modified during testing to keep cell temperatures below 180°C. The protocol was altered to take roll-though readings, as hold-on-focus temperatures sometimes exceeded 180°C.
4. The researchers tested the cell placement and density, measuring electric current at all connection points. They also tested the heat management system through a series of thermocouples placed throughout the array next to the cells. Table 6 shows the test results under one series. The maximum cell temperature reached was often over 180°C during on-hold tests.
5. The researchers had a manufacturing cost analysis prepared by the University of California, Riverside (UCR) consulting team.
6. The researchers did not perform a levelized cost of electricity analysis.
Table 6: Test Results Under Hold-on-Axis Series
MODULE DATE TIME IRRADIANCE
WIND VOLTAGE (V)
CURRENT (A)
POWER (W)
1 10/8/14 12:36 1034 w/m2 8 mph 15.69 0.5 7.84
2 10/8/14 12:36 1034 w/m2 8 mph 16.03 0.7 11.22
3 10/8/14 12:37 1034 w/m2 8 mph 15.62 1.1 17.18
4 10/8/14 12:37 1034 w/m2 8 mph 15.47 0.8 12.37
5 10/8/14 12:41 1034 w/m2 8 mph 8.61 0.8 6.88
6 10/8/14 12:41 1034 w/m2 8 mph 16.01 1.0 16.01
7 10/8/14 12:43 1034 w/m2 8 mph 15.62 1.0 15.62
8 10/8/14 12:43 1034 w/m2 8 mph 15.75 0.8 12.6
146

2.21.5 Conclusions 1. The forced convection cooling system was abandoned due to high cost for small
performance gains. The design used achieved a concentration of just over 190 suns. The researchers completed this objective but did not meet performance objectives.
2. The control mechanism for cell placement within the focal length of the trough achieved a precision of +/- 1 percent when measured in millimeters and compared to the focal length. The researchers completed this objective.
3. The on-hold testing was not completed since the protocol was changed to avoid high cell temperatures. A better cooling system may overcome this deficiency. The researchers completed this objective, but did not meet performance objectives.
4. The cooling system design was incapable of maintaining safe cell temperatures. The output wattage ranged from just under 7 to over 17 W. The highest performing module was an SOE-mounted board with an output of nearly 40 W. This level may indicate that, with the elimination of air gaps covering approximately 50 percent of the cell area, approximately 80 W could be produced per module. The researchers completed this objective for wattage but not for maintaining cell temperature. This may affect the long-term viability of the system in use. Data logging problems for some of the thermocouples rendered the results inconclusive.
5. Manufacturing costs, as estimated by the UCR team, showed cost exceeding $12,900, well above the target of $4,000. The researchers completed this objective but did not meet the performance objective.
6. The researchers did not complete the objective to estimate levelized cost of electricity.
The researchers did not achieve the performance objectives. They did not demonstrate feasibility of achieving an arrangement of multi-junction cells on a solar parabolic trough to meet or exceed the power currently generated by thermal receivers on a per unit basis. Furthermore, the lack of storage would reduce the achievable capacity factor and reduce dispatchability, two of the benefits of concentrated solar thermal facilities. The addition of power conditioning (such as through inverters) would further drive the cost upward.
2.21.6 Recommendations The program administrator recommends that the researchers improve the cooling system to maintain safe cell temperatures over periods of several hours on-focus. The program administrator recommends measuring actual cell temperature, not estimating it from a thermocouple placed next to the cell. The secondary optical elements further magnify incident solar flux on the cells and temperatures may vary from locations adjacent to the cell itself. The program administrator also recommends the researchers complete a levelized cost of electricity analysis once performance objectives are met. The levelized cost analysis should consider the probable remaining life and associated O&M for the receiver field and associated tracking mechanism of CSP thermal facilities.
147

2.21.7 Benefits to California Public benefits derived from PIER research and development projects are assessed within the following context:
• Reduced environmental impacts of the California electricity supply or transmission or distribution system
• Increased public safety of the California electricity system
• Increased reliability of the California electricity system
• Increased affordability of electricity in California
The primary benefit of this research is increased affordability of electricity in California. A secondary benefit is reduction of water consumed for cooling solar thermal facilities, if the technology performance objectives can be achieved. Given the technology’s current status, it is too soon to estimate potential cost reductions or water consumption reductions.
2.21.8 Technology Transition Assessment As the basis for this assessment, the program administrator reviewed the researchers’ overall development effort, which includes all activities related to a coordinated development effort, not just the work performed with EISG grant funds.
Marketing/Connection to the Market The researchers will be working with plant owners to develop the technology further. They plan to work with grid operators and regulators to insure market acceptance and compatibility.
Engineering/Technical The researchers stated that they could complete design and demonstration in less than one year with less than $100,000 in additional funding.
Legal/Contractual The researchers have not applied for patents; however, they have not found any infringements. They will need to apply for protection once the technology is proven feasible.
Environmental, Safety, Risk Assessments/ Quality Plans There are no known environmental or safety risks associated with the concept. The researchers will need to ensure quality concerns with respect the long-term durability of the cooling system are addressed.
Production Readiness/Commercialization The concept is not yet ready for commercialization or production.
148

2.22 Unified Power Control for Set-Top Devices Awardee: AGGIOS, INC.
Principal Investigator: Vojin Zivojnovic
2.22.1 Abstract Internet protocol television and other set-top box devices dominate plug load energy consumption in residential buildings due to their sheer numbers. This project evaluated advanced energy design and management for the reduction of energy consumption of internet protocol television set-top box devices. The project outcome was a fully functional reference design that used only 1.4 watts when idle, an 84 percent reduction, and 4.3 watts when in use, a 55 percent reduction. Based on the level of energy savings for the in-idle and in-use modes achieved in this project and the quantitative assumptions of the current set-top box Voluntary Agreement, the project team forecast potential aggregate savings for California of around $330 million per year in electricity bills and 1.3 metric tons of carbon dioxide emissions per year. The costs to achieve such savings for California are estimated at less than $10 million per year.
Keywords: Energy consumption, plug load device, set-top box device, energy management software, energy design and management tools, energy and power measurements
149

2.22.2 Introduction Home entertainment systems are in nearly every California residence and range from simple television to complex home theaters. Many, if not most, include a set-top box (STB) to accommodate cable, satellite, or internet signals. According to a 2011 Natural Resources Defense Council (NRDC) study, STB devices cost Americans $3 billion in electricity each year, including $2 billion when the systems are off.36 In 2013, the major United States TV content providers entered into a voluntary agreement to improve STB efficiency by 10 to 45 percent. 37
STB devices are provided to consumers by cable, satellite, and internet signal providers as part of an entertainment delivery package. The consumer seldom has a choice of devices and little understanding of the devices’ energy consumption. They seldom know that the devices consume energy even when the entertainment system is off.
This project was intended to demonstrate the technical feasibility of much more energy efficient STBs. Through a combination of proprietary software, firmware, and device improvements, the project sought to demonstrate significant improvement in STB energy consumption and provide guidance to device manufacturers.
2.22.3 Objectives The goal of this project was to demonstrate reduction in electricity consumption of internet protocol television (IPTV) STBs by using the proprietary software CLIOS. 38 The researchers sought to:
1. Confirm that CLIOS can control all clocks and the majority (more than 80 percent) of the components on the IPTV platform.
2. Achieve 4 watts (W) in-idle and 6 W in-use electricity consumption on the device prototype by activating the CLIOS management software running on the always-on microcontroller. With the standard software without CLIOS the platform consumed 8.8 W and 9.5 W in idle and in use, respectively.
3. Achieve 1 W in idle and 4 W in use on the device prototype.
4. Demonstrate a fully functional prototype with less than 1 W in idle with a wake up (transition from idle to in-mode) latency of less than 5 seconds and less than 4 W when the device is in use.
36 http://www.nrdc.org/energy/files/settopboxes.pdf
37 https://www.ncta.com/sites/prod/files/VOLUNTARY-AGREEMENT-ENERGY-EFFICIENCY-OF-SET-TOP-BOXES.pdf
38 Internet Protocol television (IPTV) is a system through which television services are delivered using the Internet protocol suite over a packet-switched network such as a LAN or the Internet, instead of being delivered through traditional terrestrial, satellite signal, and cable television formats.
150

5. Demonstrate a device prototype that in production adds not more than 20 percent to the current costs for the material and software.
2.22.4 Outcomes 1. The researchers customized and installed the CLIOS software on a test-bed platform to
confirm compatibility under the UHA signal compression protocol with device configurations. The researchers demonstrated 100 percent of clocks (31 of 31) and 94 percent of the components (29 of 31) were controlled by CLIOS.
2. The researchers measured 5.4 W in idle and 6.7 W in use for the first prototype. The researchers measured wakeup time at approximately 2.7 seconds.
3. Using a modified base platform, the researchers measured 1.4 W in idle and 4.3 W in use. Wakeup time was not established, as wakeup was erratic.
4. The researchers did not produce a prototype due to the issue with wakeup noted in Outcome 3.
5. The researchers estimated that the hardware and software modifications and the engineering design procedures necessary to reach the demonstrated savings were well below 20 percent of the typical $50 STB’s cost of material. The researchers estimated an incremental cost of less than $2 per device under the assumption of 5 million new STB devices per year.
2.22.5 Conclusions 1. The researchers completed the objective of installing CLIOS on the test-bed Internet
protocol television (IPTV) platform and demonstrated it controlled all clocks and 94 percent of devices. The researchers completed this objective.
2. For the first prototype, power consumption was reduced compared to the baseline device in both idle and in-use conditions but did not achieve the objectives of 4 and 6 W, respectively. The researchers did not achieve this intermediate objective.
3. At very low power consumption and under the current operating system, wakeup was problematic. The researchers did not achieve this objective.
4. The researchers did not achieve the objective of producing a prototype capable of 1 W idle and 4 W in use.
5. Estimated cost increment is likely low, compared to the cost of devices today. Contingent upon verification once a successful prototype is demonstrated, the researchers completed this objective.
The researchers successfully demonstrated reduction of power consumption using the proprietary software, but did not achieve the performance objectives set.
151

2.22.6 Recommendations The program administrator recommends the researchers continue to refine the concept to achieve idle and in-use power consumption yet achieve wakeup times. The program administrator recommends the researchers evaluate the incorporation of battery or capacitor storage to push wake up signals to higher levels. Once a prototype is successfully demonstrated, the researchers should complete a detailed cost estimate and compare it with devices on the market. Further, the researchers should complete an update to the NRDC survey of STB, focusing on more detailed device populations, fleet turnover, and customer use patterns to better quantify the potential energy savings. The program administrator also recommends that the researchers determine compatibility and conflicts with home networks using Wi-Fi, wired systems, and Bluetooth. Finally, the researchers should conduct similar analysis and development projects for other types of STBs, like cable, satellite, digital terrestrial television (DTT), and over-the-top (OTT) STBs.
After taking into consideration (1) research findings in the grant project, (2) overall development status, and (3) relevance of the technology to California and the PIER Program, the program administrator has determined that the proposed technology should be considered for subsequent funding within the PIER Program.
Receiving subsequent funding ultimately depends upon (1) availability of funds, (2) submission of a proposal in response to an invitation or solicitation, and (3) successful evaluation of the proposal.
2.22.7 Benefits to California Public benefits derived from PIER research and development projects are assessed within the following context:
• Reduced environmental impacts of the California electricity supply or transmission or distribution system
• Increased public safety of the California electricity system
• Increased reliability of the California electricity system
• Increased affordability of electricity in California
The primary benefit of this concept is from increased affordability of electricity in California. A secondary benefit would come from reduced environmental impacts of the California electricity supply or transmission or distribution system stemming from an overall reduction in consumption. Assuming that the energy savings achieved in this project can be achieved in all STB types (such as IPTV, satellite, and cable) distributed in California, the total savings for California’s electricity ratepayers could be about $330 M per year and a reduction of 1.3 metric tons of carbon dioxide emissions per year. A reasonable penetration of 10 percent of the market by 2020 would result in $33 million savings per year.
152

2.22.8 Technology Transition Assessment As the basis for this assessment, the program administrator reviewed the researchers’ overall development effort, which includes all activities related to a coordinated development effort, not just the work performed with EISG grant funds.
Marketing/Connection to the Market An unnamed California semiconductor manufacturer has expressed interest in partnering with the researchers to further develop this technology.
Engineering/Technical The researchers intend to extend the technology to other set-top box types (for example, satellite and cable) that will require additional engineering for compatibility and functionality.
Legal/Contractual The researchers have applied for three patents that are pending review.
Environmental, Safety, Risk Assessments/ Quality Plans There are no known environmental or safety risks associated with the technology.
Production Readiness/Commercialization The product is ready for demonstration but not yet ready for full commercial deployment.
153
2.23TE Cost-Effective Thermal Management Design for Electric Vehicle Batteries Awardee: University of California, Merced
Principal Investigator: Yanbao Ma
2.23.1TE Abstract Thermal management of lithium-ion batteries is a crucial problem for the safe and optimal operation of electric vehicles and hybrid electric vehicles. In this project, researchers evaluated mini-channel cooling as the thermal management system for a high capacity single battery cell under normal discharge rates. To optimize the mini-channel design, the researchers tested the cooling performance of five different setups and compared them for total flow rate. Using four strips with four mini-channels per strip, researchers controlled both the average temperature rise and the temperature difference across the whole battery to a temperature difference of less than 1°C (1.8°F). They calculated the pressure drop at 246 Pascals and the required pumping power at 2.05 e-4 watts at a discharge rate of 2 C.39 These results suggest that the mini-channel cooling system could be a promising solution for battery thermal management under normal operating conditions. The researchers also evaluated thermal runaway of a single cell triggered by a nail penetration. They demonstrated that the mini-channel cooling system alone cannot help reduce the peak value of maximum battery temperature when nail penetration occurs in a single cell. However, the mini-channel cooling system can prevent the propagation of thermal runaway from one cell to its neighbor cells. The most effective way to prevent thermal runaway and its propagation is through the combined addition of functional materials and effective cooling using a mini-channel cooling system.
Keywords: Electric vehicle, lithium-ion batteries, mini-channel, thermal management, nail penetration
39 The charge and discharge current of a battery is measured in C-rate. Most portable batteries are rated at 1 C. This means that a 1000 mAh battery would provide 1000 mA for one hour if discharged at 1 C rate. The same battery discharged at 0.5 C would provide 500 mA for two hours. At 2 C, the 1000 mAh battery would deliver 2000 mA for 30 minutes. One C is often referred to as a one hour discharge rate.
154

2.23.2TE Introduction Electric vehicles have become more practical to own and operate in the last decade due in part to the rapid development of power electronics technology. Because of its high energy density, high power density, and long life, the lithium-ion battery has become the dominant energy source for electric vehicles (EV). To obtain optimal performance, lithium-ion batteries or battery packs must operate within safe and reliable operating conditions. Temperature is one such condition; some of the major thermal concerns of using a lithium-ion battery pack are overheating and/or uneven heating within each individual battery cell and across the entire battery pack during charge/discharge cycles, which can lead to fast battery degradation and capacity reduction of the cells. In the worst case, thermal abuse of a high power lithium-ion battery can lead to thermal runaway and fire.
To control the temperature of the battery, researchers must have adequate knowledge of heat generation and thermal behavior inside a lithium-ion battery. Many studies have been done on thermal modeling and analysis of batteries for different operating conditions under both normal discharge rates and thermal abuse. Since the battery performance is temperature dependent, varying battery temperature automatically affects the vehicle performance. In this project, the researchers developed a detailed three-dimensional thermal model to examine the thermal behavior of a lithium-ion battery, including the layered structure of the cell stacks, the case of a battery pack, and the gap between both elements. Using this detailed model, researchers found some important phenomena such as an asymmetric temperature profile. For oven exposure testing, they developed a predictive model using thermal properties of cells and reaction kinetics. This model was developed for electrode materials with electrolyte exposed to high temperature. The researchers developed other three-dimensional models for oven tests to determine how a local hot spot can propagate through the cell and to analyze the temperature distribution under abuse conditions. They developed more models for abuse testing of lithium-ion batteries to help understand the complex reactions and mechanisms during thermal runaway.
The purpose of thermal management for a battery is not only to reduce the maximum temperature rise inside the battery, but also to reduce the temperature difference across the whole battery. Low operating temperature and low temperature difference are important to maintain optimal efficiency in operation and to maximize battery life.
The researchers predicted that the benefits of this new cooling system would be a weight reduction of at least 20 percent compared with the conventional cooling system, which often weighs at least 200 lbs, and a cost reduction of at least 20 percent compared with conventional cooling design, which often costs at least $1,500, for an 85 kilowatt-hour (kWh) battery system.
In this project, the researchers sought to demonstrate the feasibility of using a straight mini-channel cooling design for battery thermal management at normal discharge rates. They selected water as the cooling fluid. They planned to evaluate the performance of a mini-channel cooling system on a single battery cell of large capacity at different flow rates. To control the rise of average battery temperature as well as the temperature difference across the whole
155
battery, they analyzed models with different flow rates for different discharge rates. Based on the analytical results, they selected the best design of a mini-channel system.
The researchers did not complete the planned experimental tasks in this project partially due to the truncated performance period. The performance period was influenced by the legislatively determined closing of the PIER Program.
2.23.3TE Objectives The primary goal of this project was to determine the feasibility of using multiport mini-channels for the thermal management of electric vehicle batteries to increase battery life by reducing uneven temperature distribution in batteries through efficient cooling design at the cell level. The researchers also sought to reduce the weight, volume, and manufacturing cost of the battery cooling system by at least 20 percent. The project objectives were to:
1. Demonstrate a maximum temperature difference (ΔTmax) less than or equal to 5°C (41°F)in the cell at discharging rates of 2 C, 1 C, and ½ C using numerical simulations.
2. Use numerical methods to demonstrate the parasitic pumping power less than or equal to 10 percent of battery output power while keeping ΔTmax at less than or equal to 5°C in the cell at different discharging rates of 2 C, 1 C, and ½ C.
3. Confirm the parasitic pumping power ≤ 10 percent of battery output power while keeping ΔTmax less than or equal to 5°C in the cell at different discharging rates of 2 C, 1 C, and ½ C in laboratory-scale experiments
4. Demonstrate efficient mini-channel cooling with ΔTmax less than or equal to 5°C for an 85 kWh battery pack
5. Confirm that the new cooling system for an 85 kWh battery could reduce the weight at least 20 percent compared with the conventional cooling system ( 200 lbs or more) and reduce the cost at least 20 percent compared with the conventional cooling design ($1,500 or more)
2.23.4TE Outcomes 1. The researchers conducted numerical modeling of mini-channel cooling for different
discharge rates and controlled the maximum temperature difference to less than 1°C (33.8°F). They modeled the prismatic battery cell as a homogeneous and isotropic entity with uniform volumetric heat generation, varying at different discharge rates. They applied different designs of a mini-channel cooling system to study parametrically the effect of contact area, flow speed, and flow rate. They compared the pressure drop values inside the mini-channels with theoretical predictions based on a straight mini-channel. The result was only 3 percent different when the flow rate was small. As the flow rate became larger, the pressure drop in this mini-channel cooling design became much greater than the predicted value based on straight channels due to the design feature of two extra corners. For the discharge rate at 1 C, using a flow rate at 0.2 L/min, the average temperature rise was 0.57°C (33°F) and the temperature difference was
156

0.65°C (33.2°F), both less than 1°C (33.8°F). For the discharge rate at 2 C, the average temperature rise was controlled at 0.52°C (32.9°F) and the temperature difference was only 0.63° C (33.1°F), with an increased flow rate at 0.8 L/min.
2. Pressure drops at different flow rates were calculated in numerical simulation. The pumping power required was far less than 1 percent of battery output power. To pump the flow through mini-channels, the power required for cooling a single battery cell at a discharge rate of 1 C was only 7.50e-6 W. When the discharge rate increased to 2 C, the pumping power needed was 2.05 e-4 W, which was less than 1 percent of the battery output power.
3. The researchers finalized an initial experimental design and initiated construction of a laboratory-scale mini-channel cooling system. They identified necessary instrumentation facilities (thermocouples, pressure gauges, pumps) and exact specifications. They did not complete the setup in the short contracted project time.
4. Based on numerical simulations on a laboratory-scale cooling system, the cooling system could be scaled up to a full-scale 85 kWh battery pack cooling system.
5. The cost analysis was based on the results of a laboratory-scale prototype cooling system. Due to the incomplete laboratory-scale cooling system, the cost analysis could not be performed, since the final weight and cost of the mini-channel-based cooling system was unknown.
2.23.5TE Conclusions In this project, researchers used numerical simulations to investigate heat generation in prismatic lithium ion batteries. The results showed that the maximum temperature increase (ΔTmax) in the cell was less than 1°C (33.8°F) at different discharging rates (2 C, 1 C, and ½ C) which was much better than the design goal for a ΔTmax less than or equal to 5°C (41°F). The numerical results also showed that the parasitic pumping power for battery cooling using a multiport mini-channel was less than percent of battery output power while keeping the thermal design goal for ΔTmax less than or equal to 5°C. Based on these results, the researchers concluded that it is feasible to use multiport mini-channels for the thermal management of electric vehicle batteries to increase battery life by reducing uneven temperature distribution through efficient cooling design at the cell level. In addition, the new battery cooling system based on the multiport mini-channel technology could prevent the propagation of thermal runaway from one problematic cell to its neighbors.
Unfortunately program time constraints prevented the research team from completing significant laboratory work, and there was little data at the contracted end of this project to prove feasibility of this concept. This does not mean that the concept is not feasible.
2.23.6TE Recommendations The program administrator recommends that this work be continued to completion of the original statement of work. In addition, the program administrator recommends:
157

• Seeking funds to complete the original statement of work.
• Forming a partnership with a major battery manufacturing company.
• Performing a thorough market analysis to identify potential customers, distribution channels, collaborators, and competitors.
After taking into consideration (1) research findings in the grant project, (2) overall development status, and (3) relevance of the technology to California and the PIER Program, the program administrator has determined that the proposed technology should be considered for subsequent funding within the PIER Program.
Receiving subsequent funding ultimately depends upon (1) availability of funds, (2) submission of a proposal in response to an invitation or solicitation, and (3) successful evaluation of the proposal.
2.23.7TE Benefits to California Public benefits derived from PIER transportation research and development projects are assessed within the following context:
• Improved transportation energy efficiency
• Reduced greenhouse gas emissions or reduced health and environmental impacts from transportation associated air pollution related to electricity and NG production and use
• Increased use of alternative fuels
The primary benefit of this project is increased use of alternative fuels. According to the California Air Resource Board, fuel-cycle emissions from electric vehicles (EV) are 65 percent to 70 percent lower than gasoline vehicles, based on California’s present electricity grid. The issues associated with the stability and reliability of EV batteries, especially due to lack of efficient thermal management, have so far resulted in very poor EV adoption rate in California. The findings from this project could lead to development and commercialization of a robust cooling technology for EV batteries to address this problem. Because the project was not completed, potential cost and weight savings were not calculated. Thus, quantitative benefits that may result from this project cannot be assessed. The researchers calculated that the application of this technology could save $1,000 in the manufacturing cost of the battery package for each car.
2.23.8TE Technology Transition Assessment As the basis for this assessment, the program administrator reviewed the researchers’ overall development effort, which includes all activities related to a coordinated development effort, not just the work performed with EISG grant funds.
Marketing/Connection to the Market The researchers were working with American Lithium Energy Corporation, a California company. However they had not conducted a market analysis nor surveyed potential customers by the end of this project.
158

Engineering/Technical The researchers stated that they could complete all development in roughly two years at a cost of about one million dollars. They have completed an engineering specification document.
Legal/Contractual The researchers applied for a patent which was pending at the conclusion of this project. Environmental, Safety, Risk Assessments/ Quality Plans Because of the very short performance period of this grant, nothing was accomplished in this area. Further work must be planned for future research endeavors.
Production Readiness/Commercialization Since it was not possible to complete the research work in the truncated time period, there was no progress toward a commercialization plan.
159

2.24TE Intelligent Energy Management for Solar Powered EV Charging Stations Awardee: University of California, Davis
Principal Investigators: Hengbing Zhao, Andrew Burke
2.24.1TE Abstract In this project, the research team designed and demonstrated a photovoltaic (solar-powered) battery-buffered electric vehicle charging station with intelligent energy management in University of California, Davis’s West Village, the largest planned zero net energy community in the United States. The researchers introduced an on-site controller into a level two workplace charging system to control the power flow between the photovoltaic panel, the grid, the battery, and the vehicle charger. This energy management approach introduced weather information and load demand statistics to optimize the charging station’s use of solar and grid. Instead of immediately recharging the battery to a fixed state of charge after each electric vehicle charging period, the charging station optimized the charge level of the buffer battery according to estimated levels of photovoltaic electricity generation and projected electric vehicle charging load. Thus, the use of solar energy was maximized and the impact of electric vehicle charging on the utility grid was minimized. The system extracted cloud cover from a weather forecast website to estimate the photovoltaic electricity and used historical electric vehicle charging data to project the electric vehicle charging load. This charging station management approach simplified utility grid management from the load side during the initial stages of solar photovoltaic and electric vehicle introduction.
Keywords: Electric vehicle, charging station, energy storage, weather forecast, load projection, optimization, photovoltaic panel, bi-directional inverter
160

2.24.2TE Introduction With the adoption of electric vehicles and continued installation of solar power systems, especially in high photovoltaic (PV) and electric vehicle (EV) penetration areas, electric vehicle charging and solar power availability pose a challenge for the utility grid. In particular, the utility grid may lack the capacity both to deliver required periodic high power levels and to store unneeded surplus solar electricity. In addition, upgrading the distribution infrastructure in these early stages to handle higher power demand and surplus solar energy would not be cost effective. Reducing the impacts of EV charging systems on the California electricity supply, transmission, and distribution system in terms of peak power demand and energy exchange is necessary if electric vehicle sales are to grow.
Solar-powered charging stations equipped with battery storage provide an approach to enabling high penetration of electric vehicle charging and solar electricity into the present distribution infrastructure. Only a few solar-powered EV charging stations with battery buffers have been demonstrated, and those stations immediately replenish the batteries after each EV charging session. None of the charging stations have included the effects of PV electricity estimation and EV charging load projection in their energy management strategy. This project focused on the design and demonstration of an on-site controller and the development of a control strategy that could lower the impact of EV charging and PV generation on the utility grid. The control and monitoring software for the charging station provided a number of functions including the display of the measured parameters and status of each component of the charging system. See Figure 24 for a block diagram of the tested system.
The tested system differed from previous systems in many respects. Previous systems behaved like an uninterruptable power supply; the battery was always full and acted as backup power. When the battery voltage reached the lower limit, the system topped off the battery to the upper voltage limit at full power from the PV panel and/or the utility grid without considering off-peak periods. In the tested system, the researchers introduced an on-site controller and a supervisory computer to communicate with the bi-directional inverter and the battery management system. The on-site controller monitored the solar PV power, the battery status, the EV charging load, and the grid status to control power flow between different components. The supervisory computer extracted weather conditions from a weather forecast website to predict the available PV electricity and projected the expected EV charging load based on stored past use patterns. The system calculated an optimal battery state-of-charge (SOC) for charging the battery during off-peak periods based on the projected PV electricity and EV charging load.
161
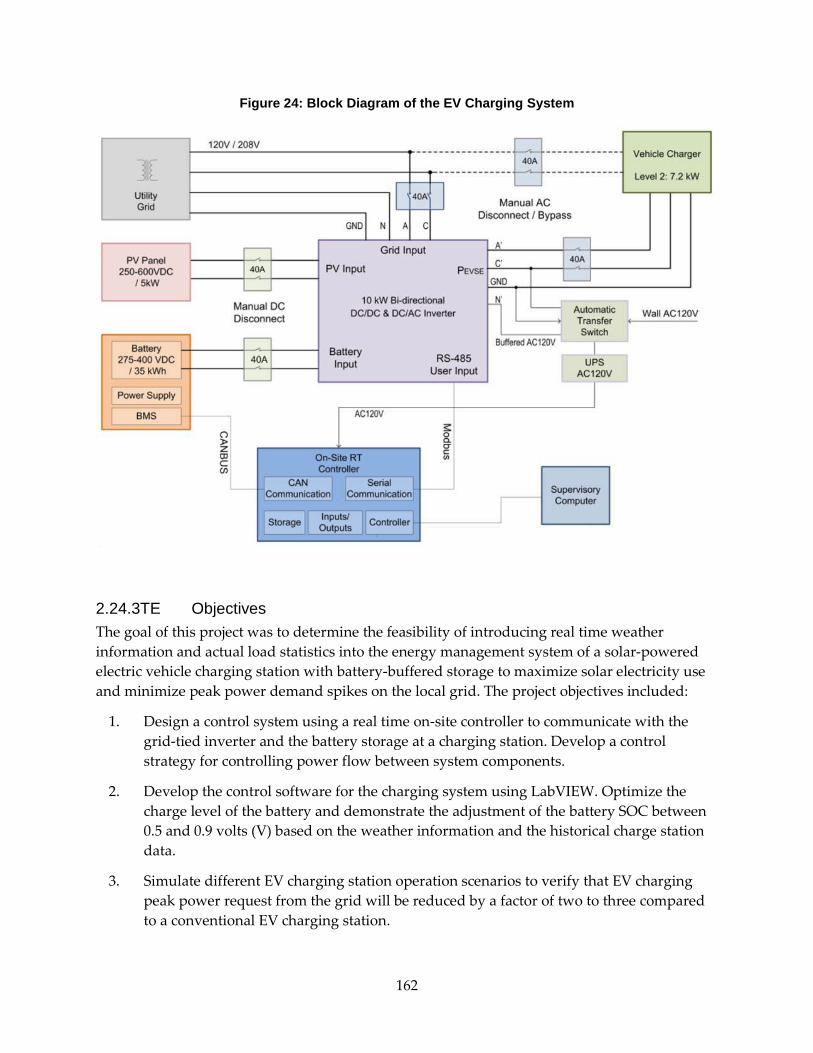
Figure 24: Block Diagram of the EV Charging System
2.24.3TE Objectives The goal of this project was to determine the feasibility of introducing real time weather information and actual load statistics into the energy management system of a solar-powered electric vehicle charging station with battery-buffered storage to maximize solar electricity use and minimize peak power demand spikes on the local grid. The project objectives included:
1. Design a control system using a real time on-site controller to communicate with the grid-tied inverter and the battery storage at a charging station. Develop a control strategy for controlling power flow between system components.
2. Develop the control software for the charging system using LabVIEW. Optimize the charge level of the battery and demonstrate the adjustment of the battery SOC between 0.5 and 0.9 volts (V) based on the weather information and the historical charge station data.
3. Simulate different EV charging station operation scenarios to verify that EV charging peak power request from the grid will be reduced by a factor of two to three compared to a conventional EV charging station.
162
4. Operate the charging station with the on-site controller and the energy management approach to show the optimal battery SOC varies between 0.5 and 0.9 V.
5. Demonstrate that intelligent energy management can reduce the grid peak power demand for EV charging by at least a factor of 2.
2.24.4TE Outcomes The research team achieved all project goals.
1. The researchers designed a control system using the NI cRIO-9082 controller to communicate with the system components.
2. The researchers created the control and monitoring software for the charging system using LabVIEW. The software accomplished the functions of data monitoring and logging, power flow control, weather information extraction, PV electricity estimation, EV charging load projection, battery target SOC optimization, and system operation projection.
3. The research team performed simulations for different scenarios. In comparison to a charging station without optimal energy management, the grid peak power demand for the battery buffered charging station with optimized energy management was reduced by a factor of 2.
4. The research team successfully installed the control hardware and software. The test operation of the system demonstrated that the controller could successfully extract weather information, estimate PV electricity, project EV charging load, and optimize the battery target SOC between 0.3 and 1 V as instructed.
5. Continuous operation of the charging station demonstrated that intelligent energy management reduced the grid peak power demand for EV charging by at least a factor of 2.
2.24.5TE Conclusions The research team accomplished all project milestones and demonstrated a successful control system to reduce power draw on the grid during peak hours. Based on the information presented, the technology should minimize the effect of electric vehicles on the grid. Additionally, by shifting power transmission to off-peak hours, it should reduce power exchange with the grid and therefore power transmission losses. Specific conclusions are as follows:
1. The team successfully developed the power flow control for both grid-tied operation and stand-alone operation.
2. The research team demonstrated that the EV charging station with a buffer battery can significantly reduce the grid peak power demand, shift the grid power demand into off-peak time periods, and cut down on the energy exchange with the utility grid by a factor of 2 to 3.
3. The estimated PV electricity based on the extracted weather information reflected the actual PV electricity generation. A linear fit of the historical EV charging load from the
163

same day of the week over the latest six weeks was appropriate for extracting the charging pattern of a workplace EV charging station.
4. The researchers concluded that optimization of energy management based on the estimated PV electricity and the projected EV charging load was feasible. Optimization of energy management can satisfy EV charging load requirements and at the same time almost eliminate the peak power demand for EV charging from the grid and cut down on energy exchange between the charging station and the utility grid by a factor of 2.
5. The researchers showed that the tested power flow control and intelligent energy management can be integrated with current charging stations without installing additional devices and is suited for charging systems with one big battery and multiple charging outlets.
2.24.6TE Recommendations The Program Administer recommends that the researchers:
• Use a supervisory computer instead of the external on-site controller to communicate with present charging stations and to perform optimization of the energy storage with no additional hardware cost.
• Develop more complex PV electricity estimation modeling and more accurate load projection modeling for multiple charging outlets. The intelligent energy management strategy used in this project is best suited for charging station systems with one large energy storage battery and multiple charging outlets, such as workplace or commercial public charging stations.
• Investigate model improvements to address a more extensive use of the system and more diverse weather conditions.
• Perform a market assessment to determine if a market need exists.
• Search for a commercialization partner.
• Determine total system cost.
• Work with system integration specialists to reduce high system cost.
• Determine benefits to the utility.
2.24.7TE Benefits to California Public benefits derived from PIER transportation research and development projects are assessed within the following context:
• Improved transportation energy efficiency
• Reduced greenhouse gas emissions or reduced health and environmental impacts from transportation associated air pollution related to electricity and NG production and use
164
• Increased use of alternative fuels
The primary benefit to the ratepayer from this research is improved transportation energy efficiency.
An EV charging station equipped with a buffer battery and with intelligent energy management can lower the station’s peak power demand and reduce the energy exchange with the utility grid by a factor of 2 to 3 and eliminate grid power demand during on-peak hours. According to California Energy Demand 2014-2024 Preliminary Forecast, electric consumption by EVs in the Pacific Gas and Electric Company (PG&E) planning area is projected to reach up to 2,800 gigawatt-hours (GWh) and peak impacts are estimated to be up to 121 megawatts (MW) by 2024, with the assumption that most charging would occur during off-peak hours. Therefore, battery-buffered EV charging stations with intelligent energy management could eliminate the growing electricity demand of 121 MW from EV charging in the PG&E planning area during on-peak time periods. The intelligent energy management for the PV-powered EV charging station with a buffer battery could ease the challenge faced by the utility grid to upgrade the distribution infrastructure to handle high EV charging power demand.
Both simulation and demonstration indicate that a workplace PV-powered, battery buffered EV charging station with intelligent energy management could reduce energy exchange with the grid by a factor of at least two. Considering the California average transmission and distribution losses of 5.4 to 6.9 percent in 2002 to 2008 and the projected electric consumption of up to 2,800 GWh by EVs in the PG&E planning area in 2024, 75.6 to 96.6 GWh electricity losses could be avoided in the PG&E planning area in 2024 by using PV-powered EV charging stations with intelligent energy management.
2.24.8TE Technology Transition Assessment As the basis for this assessment, the program administrator reviewed the researchers’ overall development effort, which includes all activities related to a coordinated development effort, not just the work performed with EISG grant funds.
Marketing/Connection to the Market There was no reported marketing effort for this concept. At this time, the concept has not been applied at existing non-university electric vehicle charging stations. To further awareness of the research, the project team presented a conference paper on this concept at the International Electric Vehicle Conference in December 2014. The researchers have not conducted a market assessment.
Engineering/Technical The research team intends to seek additional funding to continue the research at the University of California, Davis’s West Village community. However, they have no firm plans or product specification to continue the technical work at this time.
Legal/Contractual The researchers submitted no patent applications and did not sign any commercial contracts during the period of this project.
165

Environmental, Safety, Risk Assessments/ Quality Plans The researchers did not plan to do additional testing in these areas.
Production Readiness/Commercialization The researchers did not develop commercialization plans. The research was done at a public university, and commercialization was not a goal. Nonetheless, the researchers intend to inform system integrators of the project results.
166

2.25TE Dual Chemistry Battery System Awardee: DCBPower, Inc.
Principal Investigator: Nad Karim
2.25.1TE Abstract In this study the research team proposed to determine the feasibility of employing two divergent battery chemistry types within the same electric vehicle to increase the range by 50 percent without increasing the cost or weight of the battery system. To achieve these results, the team designed and built two battery packs with differing cell chemistries and designed and set up a dynamometer system to conduct testing. The first round of tests established a baseline for the performance of the battery packs and the motor and braking systems; next, the team conducted comparative tests. The research team then assessed the impacts attributable to charging battery packs from zero to 100 percent state-of-charge (SOC) followed by a discharge from 100 to zero percent SOC. Results confirmed battery pack energy losses, motor/inverter losses, and energy/power at motor shaft. However, research outcomes varied. Battery pack energy matched specification within 10 percent. Battery pack efficiency met expected charge/discharge losses and range improvement. Other outcomes could not be verified due to the limitations of the dynamometer setup and cost and research time constraints. Specifically, the research team could not confirm range improvement from improved efficiency, could not measure reduction in battery pack capacity, and could not verify the maximum battery pack power output.
Keywords: Electric vehicle, battery range, cost efficiency, miles/kWh
167
2.25.2TE Introduction The lack of an efficient and cost-effective energy storage system in electric vehicle (EV) applications is a significant shortcoming that limits their widespread adoption. The relatively short range electric vehicles can achieve before the battery pack runs out of power represents a significant barrier to substantially expanding the EV market in California. Most internal combustion engine (ICE) vehicles can travel 300 to 400 miles on a single tank of fuel and can be rapidly refilled. EVs on the market today can typically travel only 70 to 200 miles on fully charged batteries and can require four to nine hours to fully recharge the batteries. In addition, EVs typically cost 50 percent more than ICE vehicles of similar class and performance.
The primary cause of these limitations is the battery technology used in EVs. To effectively compete with ICE vehicles in the consumer market, an EV must have a battery that:
• Enables the vehicle to travel a distance equivalent to that of an ICE vehicle.
• Can be recharged in five to ten minutes.
• Costs as much to own as an ICE vehicles of the same class.
The proliferation of EVs would benefit California primarily by reducing greenhouse gas emissions from ICE vehicles.
The researchers proposed a new electric battery system that uses two divergent battery chemistries within the same vehicle to achieve benefits impossible with commonly-used single battery chemistry. While dual chemistry battery technology is not new, it does represent a new approach of integrating existing technology to demonstrate an improved product. The research team proposed a technique that brings EV battery technology closer to meeting the three aforementioned requirements than any other battery technology available in the industry today. The research team’s analysis of the concepts shows a 50 percent increase in range compared to single chemistry batteries while maintaining the same or lower cost and weight. The research team determined:
• No single battery chemistry exists today that can get close to the ideal requirements.
• Different chemistries are ideal to meet some requirements.
• A combination of different battery chemistries can provide performance closer to the ideal requirements than any single battery chemistry.
The research team hoped to demonstrate improvements in EV operation by increasing the use of battery energy to nearly 100 percent and decreasing the average impedance of the battery system, resulting in more energy for locomotion. The researchers built prototype battery packs and a control system to verify the expected outcome of the system, an increase of range by 50 percent without increasing weight or cost. They used a static dynamometer setup to simulate a vehicle. The dynamometer and testing setup are displayed in Figure 25.
The research team intends to commercialize the concept through licensing to automotive manufacturers and/or drive train designers.
168
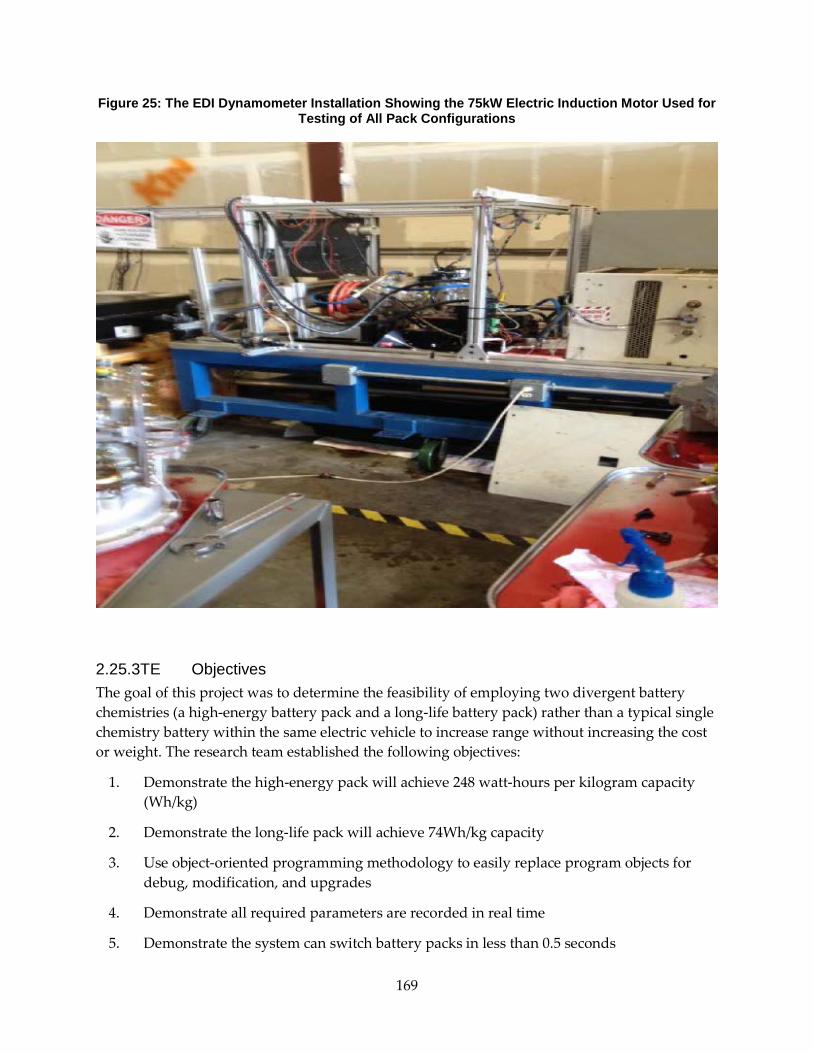
Figure 25: The EDI Dynamometer Installation Showing the 75kW Electric Induction Motor Used for Testing of All Pack Configurations
2.25.3TE Objectives The goal of this project was to determine the feasibility of employing two divergent battery chemistries (a high-energy battery pack and a long-life battery pack) rather than a typical single chemistry battery within the same electric vehicle to increase range without increasing the cost or weight. The research team established the following objectives:
1. Demonstrate the high-energy pack will achieve 248 watt-hours per kilogram capacity (Wh/kg)
2. Demonstrate the long-life pack will achieve 74Wh/kg capacity
3. Use object-oriented programming methodology to easily replace program objects for debug, modification, and upgrades
4. Demonstrate all required parameters are recorded in real time
5. Demonstrate the system can switch battery packs in less than 0.5 seconds
169
6. Demonstrate the following are within 5 percent: Power equals 1,675 W/kg Energy equals 74 Wh/kg Battery-to-wheel power loss is less than 5 percent
7. Demonstrate loss in capacity of 0.01 percent per cycle
8. Demonstrate efficiency of about 4.2 miles per kilowatt-hour (miles/kWh)
9. Demonstrate the following are within 5 percent: Power equals 465 W/kg Energy equals 248 Wh/kg Battery-to-wheel power loss is less than 10 percent
10. Demonstrate loss in capacity of is less than 0.4 percent per cycle
11. Confirm that efficiency (miles/kWh) is approximately 10 percent higher for the high energy battery pack over the long life battery pack
12. Demonstrate efficiency of about 3.8 miles/kWh
13. Confirm from project findings that dual pack modeling projections of 50 percent increase in range over a single battery pack continue to be supported
14. Confirm approximately 42 percent increase from increased use and 8 percent increase from improved efficiency
15. Confirm overall efficiency of about 4.1 miles/kWh
2.25.4TE Outcomes During the process the research team encountered a number of issues that impeded the research and/or required altering of the initial objectives.
• The original plan intended to use 18650B cells from Panasonic for the high-energy battery pack. However the research team selected another cell, 18650PF, which had a lower cost and also a higher power output, requiring fewer cells to build the pack. Long-life battery pack cells were from Altairnano as planned, but again the research team chose a smaller cell that was available at a lower price.
• The research team concluded that it would be impossible to measure the loss in capacity of the packs. Instead, the research team assumed the manufacturer’s specifications.
• Due to technical and safety issues, the research team did not have sufficient time to balance the battery pack to an ideal state. The team chose to estimate unused capacity by comparing the average cell voltage versus the minimum cell voltage.
• The use of a DC-DC convertor to handle voltage differential in the battery packs when switching from the battery packs to drive the motor or regenerate the battery was beyond the budget of this project. Therefore, the research team used a pre-charge circuit
170

that balanced the voltage and reduced the chance of a high voltage switch across the relay contactors but had very limited regeneration. After testing, the research team concluded it was evident that the reduced regeneration made it quite difficult to measure increased range due to the lower impedance of the overall battery system.
• In regard to Objectives 6 and 9 to demonstrate battery-to-wheel power loss figures of 5 percent and 10 percent, the typical power/energy loss from the battery terminal to the wheel was at least 15 percent. Therefore figures of 5 percent or 10 percent were not possible. At the time of the grant submission the research team did not know what the dynamometer setup efficiency would be. The team concluded that a more appropriate objective would have been to demonstrate one-way battery energy loss of less than 5.0 percent.
Given the above factors, the project outcomes were:
1. For the high-energy battery pack, the research demonstrated 194 Wh/kg instead of a 248 Wh/kg capacity.
2. The testing of the long-life battery pack capacity met the objective of 74 Wh/kg.
3. The research team determined that its own application software provided an effective programming methodology to enable easy replacement of program objects for debug, modification, and upgrades.
4. The research team recorded all required parameters in real time by virtue of screen shots of the log data and related time stamps.
5. The project demonstrated switching time of between 200 mS and 400 mS. The research team concluded that this was acceptable for the testing.
6. The power target of 5 percent could not be confirmed due to a limitation on the dynamometer setup. Testing demonstrated energy at 74Wh/kg as designed. The battery-to-wheel power loss objective was an error and should simply have been one-way battery loss. The research team demonstrated battery loss to be 4.3 percent.
7. The researchers did not demonstrate the loss in capacity as there was insufficient time to cycle batteries enough times to yield a measurable capacity reduction.
8. The efficiency was not demonstrated. The research team concluded that there was no correlation, since this factor was specific not only to battery efficiency but also aerodynamic drag of the vehicle and efficiency of other components such as tires, motor, transmission, etc.
9. The power target could not be confirmed due to a limitation on the dynamometer setup. Instead of the planned energy at 248 Wh/kg, the testing demonstrated 194 Wh/kg. The research team considered this acceptable given the change in cell type and the poor cell balancing. The battery-to-wheel power loss objective was an error and should simply have been one-way battery loss. Battery loss was shown to be 8.1 percent.
171

10. There was insufficient time to cycle batteries enough times to yield a measurable capacity reduction.
11. The goal of 10 percent higher efficiency (miles/kwh) for the long-life over the high-energy battery pack was not demonstrated. The research team did measure an outcome of 0.37 percent. However this result was inconclusive since this factor was highly dependent on regeneration, and there was limited regeneration with this drive cycle.
12. The efficiency was not demonstrated. The research team concluded there was no correlation, since this factor was specific to battery efficiency, but also aerodynamic drag of the vehicle and efficiency of other components such as tires, motor, and transmission.
13. The research team confirmed a 32 percent increase in range. However that was below the 50 percent project goal. The team concluded the findings were below expectations for two reasons. The increase in range due to improved efficiency could not be measured, and the cost and weight data were based on cells, not a pack.
14. The project confirmed a 44 percent increase in range from increased utilization. However the research team could not demonstrate an 8.0 percent increase in range from improved overall efficiency, due to a poor regeneration cycle.
15. The demonstrated overall efficiency did not meet 4.1 miles/kWh but was 3.26 miles/kWh.
2.25.5TE Conclusions The overall project conclusions were as follows:
1. The observed energy available from the high-energy battery pack was less than expected largely due to the imbalance in the cells. This could be mitigated with more time, but nonetheless the available energy was within 10 percent of the specification.
2. The long-life battery pack performed much closer to expectations and appeared to require less balancing with less variance in cell voltage.
3. The existing EDI programming methodology provided the necessary tools to enable effective replacement of program objects for debug, modification, and upgrades. While the research team confirmed and recorded all data and logs in real time, it frequently had to be manually synchronized and the sampling rate was not the same. This required additional work and greater chance of errors, although the switching time was demonstrated to be within 0.5 seconds.
4. The research team could not demonstrate maximum power limitations in the setup. The team did demonstrate that energy content was within specifications. As noted above, the relevant power loss objective should have related to the battery alone and not the drive train, in which case the loss was demonstrated to be within the objective. The only way to realistically measure the loss in capacity is to execute hundreds of cycles for the high-
172

energy battery pack and thousands of cycles for long life battery pack. This was not possible, so the loss in capacity could not be demonstrated.
5. The research team concluded that the stated goal of 4.2 m/kWh for the long-life battery pack was not a meaningful goal. This efficiency is dependent on many factors such as battery-to-wheel losses, but much more related to vehicle weight and motor/inverter losses, which were completely unknown at the time this grant application was submitted. With the changes in methodology and other factors, the project did still show a measured efficiency of 3.25 miles/kWh.
6. The research team could not demonstrate the maximum power due to limitations in the setup. Energy content was demonstrated to be within specifications. As stated above, the relevant power loss objective should have related to the battery alone and not the drive train, in which case the loss was demonstrated to be within the objective. The loss in capacity could not be demonstrated.
7. Largely due to the drive cycle chosen and secondarily due to the dynamometer setup, the amount of regeneration occurring during the drive cycle was typically between two and four percent. Since approximately 50 percent of battery chemical energy becomes kinetic energy in the vehicle, and in reverse approximately 50 percent of the kinetic energy becomes chemical energy during regeneration, the measured range improvement was less than one percent with long-life battery pack over the high-energy battery pack. Further testing will be required to arrive at a more realistic number, and as such the 10 percent improvement could not be demonstrated.
8. The research team concluded that the stated goal of 3.8 m/kWh for the high energy battery pack was in hindsight not a meaningful goal, as stated above.
9. Driving the high-energy battery pack from 100 to 0 percent vs. 80 to 10 percent SOC produced a driving range increase of 44 percent. Furthermore the ratio of long-life battery pack to the high-energy battery pack capacity significantly affected the benefit of this approach since the high-energy battery pack used at 100 percent capacity provided a low cost, small form factor, low weight energy source. The test setup had a long-life to high-energy battery pack ratio of 1:2, but in real deployments the research team expected this ratio would be 1:3 to 1:7, which would improve the range increase.
10. The overall improvement in range of 32 percent was less than expected primarily because the number was based only on cell cost rather than the complete pack cost, and increases from improved efficiency could not be measured. The dual pack testing, due to the lack of regeneration, in essence became a sequential test of the two packs, and so it did not provide any useful data other than the limitations of the setup. While the energy losses were reduced, the increase in range was still inconclusive.
The project did not prove the feasibility of employing two divergent battery chemistries rather than a typical single chemistry battery within the same electric vehicle to increase range without increasing the cost or weight of the battery system. The research team encountered multiple
173

technical, cost, timing, and even safety issues that prevented them from addressing the objectives in their proposal.
2.25.6TE Recommendations The program administrator recommends that the researchers:
1. Repeat the individual pack and dual pack tests reported here with drive cycles that include significant amounts of regeneration. This will enable explicit determination of the increase in range available from the difference in battery efficiency.
2. Cycle the dual pack through multiple cycles of 100 percent state-of-charge using a range of driving profiles. This will provide statistics for demand on the high-energy battery pack over the range of driving conditions and enable determination of the cycle life required of it.
3. Cycle the high-energy battery pack through full state-of-charge multiple times to determine the effect on capacity of 100 percent charge/discharge cycles. This will provide data on the lifetime of the high energy battery pack and confirm whether it will have a sufficient lifetime with 100 percent state-of-charge cycling.
4. Build a road-going prototype to enable extensive testing under actual driving conditions.
2.25.7TE Benefits to California Public benefits derived from PIER transportation research and development projects are assessed within the following context:
• Improved transportation energy efficiency
• Reduced greenhouse gas emissions or reduced health and environmental impacts from transportation associated air pollution related to electricity and NG production and use
• Increased use of alternative fuels
The primary benefit to the ratepayer from this research is reduced greenhouse gas emissions and reduced health and environmental impacts from transportation-associated air pollution related to electricity and natural gas production and use. If this technology were successful, it would enable the production of electric vehicles with a range comparable to a vehicle with an internal combustion engine. The assumption is that longer range at a reasonable cost would lead to higher sales of electric vehicles. No estimate can be made for the effects of this technology on vehicle sales since the project did not produce the necessary data.
2.25.8TE Technology Transition Assessment As the basis for this assessment, the program administrator reviewed the researchers’ overall development effort, which includes all activities related to a coordinated development effort, not just the work performed with EISG grant funds.
174

Marketing/Connection to the Market DCBPower plans to commercialize this dual chemistry battery invention through a royalty model. The royalty model assumes that the patent will be licensed for an appropriate fee to licensees who would manufacture EVs. The EV manufacturers would produce the dual chemistry DCBPower battery packs but pay royalties to DCBPower for each unit shipped. The company is working with Efficient Drivetrains, Inc. in this regard.
Engineering/Technical The researchers could complete design and demonstration in one additional year with funding of up to $200,000.
Legal/Contractual Patents are pending in the United States, China, and the United Kingdom.
Environmental, Safety, Risk Assessments/ Quality Plans The researchers or their licensees will need to address these assessments and plans during commercialization.
Production Readiness/Commercialization A detailed commercialization plan has not been developed.
175

2.26TE PEV-Based Active and Reactive Power Compensation in Distribution Networks: Design Optimization and Technology Demonstration Project Awardee: University of California, Riverside
Principal Investigator: Hamed Mohsenian-Rad
2.26.1TE Abstract In this project, the research team assessed the feasibility and advantages of plug-in electric vehicle-(PEV) based active and reactive power compensation. The goal was to improve efficiency and reliability of power distribution networks that contain renewable generation. To achieve this goal, the research team sought to:
• Design and simulate a PEV battery charger system that can support both active and reactive power.
• Develop an optimization-based framework to select the right active and reactive power set points for the system to improve the efficiency and reliability of power distribution networks.
• Evaluate the advantages of using the proposed technology concept to address various network issues, including peak load shaving, sub-station congestion control, power reliability maintenance, voltage control, lower power distribution loss, and absorption of renewable energy fluctuations.
Based on the simulations and measurements in this project, the research team demonstrated that using PEV-based active and reactive power compensation has the potential to:
• Shave the active power peak load at distribution substations by 14.7 percent.
• Shave the reactive power peak load at distribution substations by 23.2 percent.
• Improve power reliability by 13.7 percent.
• Improve the voltage regulation index at distribution buses by 31.6 percent.
• Reduce power loss on power distribution lines by 30.2 percent.
Although the research team achieved the goal of the project, they were not able to finish some of the hardware implementation tasks. This is because the California Energy Commission reduced the length of the project by 25 percent due to the termination of the EISG Program. Nonetheless, the team’s successful demonstration of performance improvements to the power distribution networks suggest it is beneficial to look at PEV battery and charger systems not just as a source of active power as in vehicle to grid, but also as a distributed active power and reactive power control power resource that can offer a variety of operational advantages.
Keywords: Electric vehicle, battery, charger, active power, reactive power, optimization
176
2.26.2TE Introduction While plug-in electric vehicles (PEVs) are expected to provide economic and environmental benefits to the transportation sector, they may also help the electric grid, in particular at the distribution level, either as a potential source of energy storage or as a means to improve power quality and reliability. PEV-based active and reactive power compensation can help with:
• Reducing the cost of equipment, installation, and maintenance in power distribution networks.
• Mitigating the impacts of variability in distributed renewable generation.
• Improving reliability, power quality, and voltage control in power distribution networks.
• Using the demand response potential of PEVs in building a distribution grid with faster, more efficient, more cost effective, and more reliable load-assisted control mechanisms.
Although the recent papers by the research team and others have revealed the benefits of PEV-based combined active and reactive power compensation, such technologies are yet to be optimized, implemented, and tested. Currently there is a limited understanding of how a large-scale deployment of PEV-based active and reactive power compensation technologies affects the PEV batteries, distribution grid, utilities, users, and the environment. If the proposed concept were used in every distribution network in California and if the use of PEVs became popular to the extent that every distribution network supported at least one PEV charging station, then the use of the PEV-based active and reactive power support technology could potentially help reduce the carbon dioxide (CO2) emissions associated with the power grid by three million metric tons.
The idea of using PEVs to discharge electricity back to the grid has been studied in vehicle-to-grid (V2G) systems. This research team has previously shown that PEVs may also offer reactive power compensation not only in a V2G mode, but also during a regular charging cycle, with a minimum impact on battery lifetime and user comfort. In this project the research team focused on the PEV-based combined active (P) and reactive (Q) power compensation using P-Q control, as shown in Figure 26. P denotes active power and Q denotes reactive power. Currently, a grid-connected PEV may operate only in simple charging (P > 0; Q = 0) or simple discharging (P < 0; Q = 0) mode. However, if P-Q control were being used, PEVs operation could be set across all four regions in Figure 1(b), subject to the PEV inverter’s power capacity constraint.
177

Figure 26: PEV-Based Active and Reactive Power Compensation (a) A PEV Battery Pack and Charger Inverter (b) Simple Charging and Simple Discharging Versus P-Q Control
In this project the research team addressed the questions: What is the best choice of P and Q at each time on a PEV-based active and reactive power control system on a power distribution network, and how can one evaluate the performance of the system under such best P and Q selections using a credible simulation and test framework? The research team used an optimization-based approach that considered a wide range of system parameters, such as power flow equations, resistance and inductance of power distribution lines, background active and reactive power loads, available renewable (such as solar) power generation at the power distribution level, and limits on operation voltages of batteries. A real time digital simulator (RTDS) provided the primary tool for the project analytics (ee Figure 27). The RTDS is an industry standard approach to simulate power systems.
178
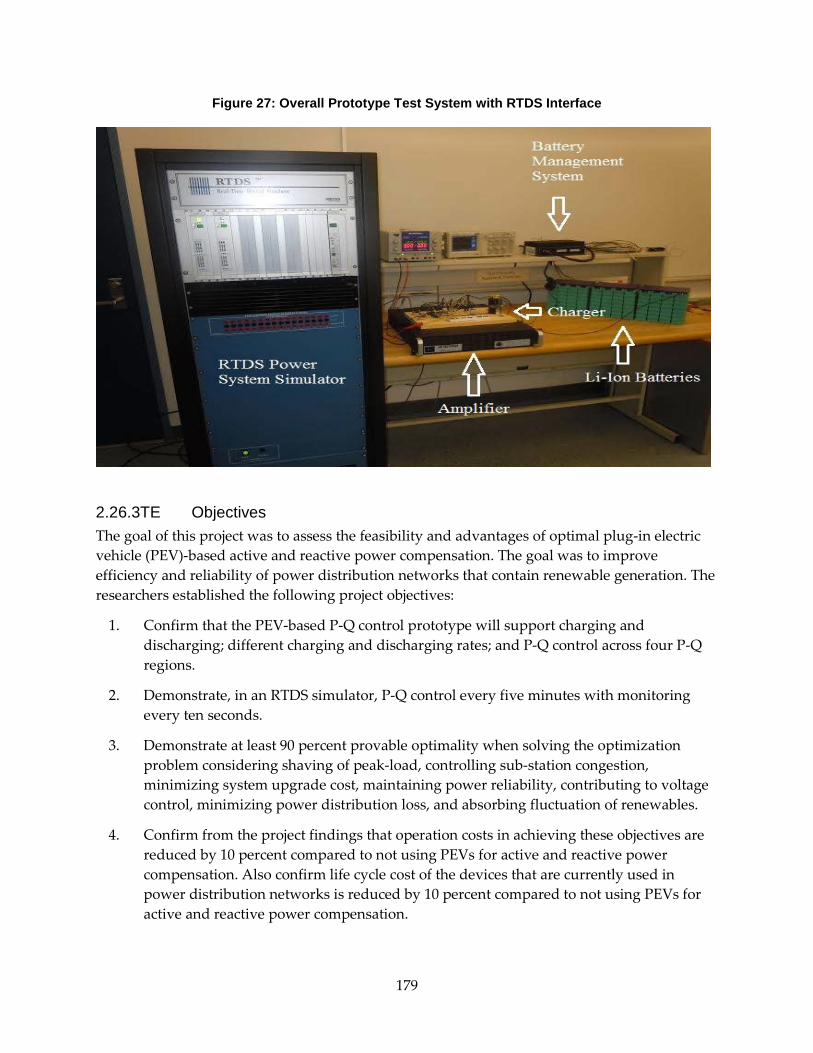
Figure 27: Overall Prototype Test System with RTDS Interface
2.26.3TE Objectives The goal of this project was to assess the feasibility and advantages of optimal plug-in electric vehicle (PEV)-based active and reactive power compensation. The goal was to improve efficiency and reliability of power distribution networks that contain renewable generation. The researchers established the following project objectives:
1. Confirm that the PEV-based P-Q control prototype will support charging and discharging; different charging and discharging rates; and P-Q control across four P-Q regions.
2. Demonstrate, in an RTDS simulator, P-Q control every five minutes with monitoring every ten seconds.
3. Demonstrate at least 90 percent provable optimality when solving the optimization problem considering shaving of peak-load, controlling sub-station congestion, minimizing system upgrade cost, maintaining power reliability, contributing to voltage control, minimizing power distribution loss, and absorbing fluctuation of renewables.
4. Confirm from the project findings that operation costs in achieving these objectives are reduced by 10 percent compared to not using PEVs for active and reactive power compensation. Also confirm life cycle cost of the devices that are currently used in power distribution networks is reduced by 10 percent compared to not using PEVs for active and reactive power compensation.
179

2.26.4TE Outcomes The project outcomes with respect to each objective are as follows:
1. The designed charger system operated in all four regions on P-Q space and supported both charging and discharging of the battery.
2. The researchers were able to monitor data at one millisecond intervals. However the research team decided to update the P-Q control signals every 15 minutes instead of every 5 minutes based on two considerations:
a. Since the focus of the PEV-based active and reactive power control concept was on steady state analysis of the system, five minute updates of the P and Q set points might prevent the power distribution system from reaching a steady state. This could unnecessarily change the overall system performance.
b. Increasing the update intervals to 15 minutes matched many of the existing monitoring systems in the smart grid environments, such as the typical reading rate of smart meters.
3. The researchers demonstrated that an optimal solution (in other words, the solution with 100 percent optimality) of the formulated problems could be achieved using convex programming techniques such as the interior point method.
4. Using PEV-based active and reactive power compensation could potentially help reduce power loss on power distribution lines by 30.2 percent, shave the active power peak load at distribution substations by 14.7 percent, shave the reactive power peak load at distribution substations by 23.2 percent, improve power reliability by 13.7 percent, and improve the voltage regulation index at distribution buses by 31.6 percent. All these performance gains were higher than the original 10 percent performance improvement target that was considered for this project.
2.26.5TE Conclusions The research team fulfilled all of the goals of the project. Some hardware implementation tasks were not completed because the California Energy Commission reduced the length of the project due to the termination of the Energy Innovations Small Grant Program. The project conclusions with respect to each objective are as follows:
1. The research team designed a PEV battery and charger system and simulated through an RTDS simulator that it could support both charging and discharging, different charge and discharge rates, and P-Q control across four P-Q regions.
2. The research team developed a real-time monitoring and control system to determine the set points for P and Q on the PEV battery and charger system and to monitor how changing P and Q affects various system parameters, such as the bus voltages, active and reactive power draw from the substations, power loss on distribution lines.
180

3. The research team formulated an optimized P and Q set point. The team demonstrated that this problem is convex and therefore a true optimal solution can be obtained using standard convex optimization techniques.
4. All performance gains were higher than the original 10 percent performance gain target.
From a larger perspective, since almost all battery systems are direct current (DC) and essentially accompanied with a charger and power electronics interface before they can be connected to a typical alternating current (AC) power distribution network, the performance improvements suggest it is potentially beneficial to look at battery and charger systems of PEVs more than as a source of active power as in V2G, but additionally as a distributed P-Q power resource that can offer a variety of operational advantages.
2.26.6TE Recommendations After taking into consideration (1) research findings in the grant project, (2) overall development status, and (3) relevance of the technology to California and the PIER Program, the program administrator has determined that the proposed technology should be considered for subsequent funding within the PIER Program.
Receiving subsequent funding ultimately depends upon (1) availability of funds, (2) submission of a proposal in response to an invitation or solicitation, and (3) successful evaluation of the proposal.
Key areas for future research include:
1. Extending the problem formulation to include finding the best location to build a charging station. This could benefit both the grid operator and the charging station operator.
2. Assessing the effect on project outcomes by extending solar irradiance data for one year.
3. Complete the proposed hardware simulations to further assess the feasibility of the project technology concept in practice.
4. Developing an appropriate incentive mechanism to pay a portion of the achieved cost savings for the PEV participants. Developing such incentive mechanism could facilitate large-scale PEV participation.
5. Investigating the impact of the proposed design approach on vehicle owners and their potential objection to or acceptance of having their batteries used in this manner versus the simple charging cycle that they expect to pay for and receive.
2.26.7TE Benefits to California Public benefits derived from PIER transportation research and development projects are assessed within the following context:
• Improved transportation energy efficiency
181

• Reduced greenhouse gas emissions or reduced health and environmental impacts from transportation associated air pollution related to electricity and NG production and use
• Increased use of alternative fuels
The primary benefit to the ratepayer from this research is reduced greenhouse gas emissions or reduced health and environmental impacts from transportation associated air pollution related to electricity and NG production and use.
Since California has the highest penetration rate of PEVs in the United States, and it also has more distributed solar panels integrated into its grid than any other state, the results of this project are of great importance and interest to California. From the results in the project Outcomes, the adoption of the proposed technology in California could help reduce power loss on power distribution lines by 30.2 percent, shave the active power peak load at distribution substations by 14.7 percent, shave the reactive power peak load at distribution substations by 23.2 percent, and improve the voltage regulation index at distribution buses by 31.6 percent. Furthermore, there is a potential to reduce CO2 emissions in California by three million metric tons annually.
2.26.8TE Technology Transition Assessment As the basis for this assessment, the program administrator reviewed the researchers’ overall development effort, which includes all activities related to a coordinated development effort, not just the work performed with EISG grant funds.
Marketing/Connection to the Market At this point there is no marketing plan. To adopt the concept in this project, there is a need to receive support from PEV charging station operators and utility companies. The key is to develop an incentive and economic model that works both for PEV owners/charging stations and utility companies.
Engineering/Technical The researchers estimated they could complete development and laboratory-scale demonstration in two to three years with additional funding of about $250,000.
Legal/Contractual The research team has not applied for any patents.
Environmental, Safety, Risk Assessments/ Quality Plans None of these plans were reported as being accomplished during this project.
Production Readiness/Commercialization The research team plans to continue the current laboratory-scale development efforts to address the hardware development that was not completed under the project. Following that, the research team’s next step is to test a true-scale system, such as the one that is part of the Sustainable Integrated Grid Initiative at UC Riverside’s Center for Environmental Research and Technology. Such true-scale demonstration can potentially be integrated into the power distribution monitoring and control system in collaboration with Riverside Public Utilities. The
182

deployment of this technology relies on the availability of a smart grid infrastructure at the distribution level to collect and provide the charger controller with the appropriate information.
183