energy, emission and economic impact of palm, jatropha ... · jatropha curcas and calophyllum...
TRANSCRIPT

Energy, emission and economic impact of palm, jatropha curcas and calophyllum inophyllum biodiesel as biofuel for road transport
H.C. Ong1)*, A.S. Silitonga1), T.M.I. Mahlia2),
H.H. Masjuki1) and W.T. Chong1)
1) Department of Mechanical Engineering, University of Malaya, 50603 Kuala Lumpur, Malaysia
2) Department of Mechanical Engineering, Universiti Tenaga Nasional, 43000 Kajang, Selangor, Malaysia
1) [email protected], [email protected]
ABSTRACT
The energy used by road transport is around 36% of total energy consumption and causes serious air pollution. Therefore, biodiesel fuel is one of the significant solutions to oil shortages, global warming and air pollution for road vehicles. This study shows the energy, emission and economic impact biodiesel for road transport. The projected diesel saving and CO2 emissions reduction are estimated to be 698 ktons and 1200 ktons by year 2031 with replacement of 5% diesel fuel with biodiesel. In order to repay the carbon debt from land converting to feedstock cropland, calophyllum inophyllum biodiesel requires the lowest cropland and ecosystem carbon payback period compared to palm and jatropha curcas biodiesel due to the high oil yield which is 4680 kg/ha. This study serves as a guideline for further investigation on biodiesel production, subsidy cost and other limitation factors before the wider utilization of biodiesel.
Keywords: Biodiesel fuel; Alternative Energy; Emission; Road transport; economic impact.
1. INTRODUCTION The global fuel consumption are increasing due to the transport sector almost
entirely relies on fossil fuels worldwide. This fact has caused oil shortages, global warming and environmental degradation. Since 1993, the global oil consumption grew from 6,762 thousand barrels/day (b/d) to 84,077 thousand b/d in 2009 (British Petroleum 2012). Globally, the road transport used 80% of total delivered energy and this sector is nearly responsible for 60% of world total oil demand (U.S. Energy Information Administration 2010). Fig. 1 shows the total world, transportation and other sectors oil consumption (Atabani et al. 2012). The figure shows that the oil consumption is increasing throughout the year and is expected to reach 236 billion GJ in 2035. The European Directorate General for Energy and Transport has reported that the production of renewable energy source increased from 86,447 ktoe in 2000 to 125,802 in 2010 or grew up by 4.1% annually (Capros et al. 2008). However, the European
271
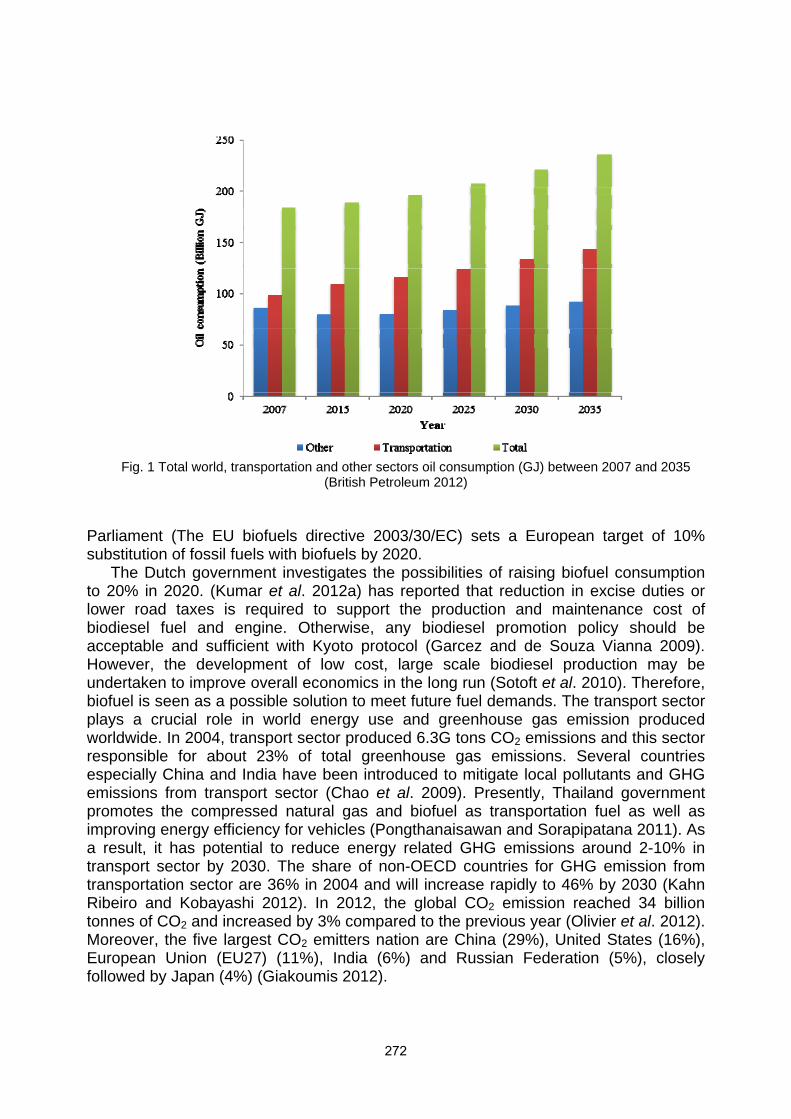
Fig. 1 Total world, transportation and other sectors oil consumption (GJ) between 2007 and 2035
(British Petroleum 2012)
Parliament (The EU biofuels directive 2003/30/EC) sets a European target of 10% substitution of fossil fuels with biofuels by 2020.
The Dutch government investigates the possibilities of raising biofuel consumption to 20% in 2020. (Kumar et al. 2012a) has reported that reduction in excise duties or lower road taxes is required to support the production and maintenance cost of biodiesel fuel and engine. Otherwise, any biodiesel promotion policy should be acceptable and sufficient with Kyoto protocol (Garcez and de Souza Vianna 2009). However, the development of low cost, large scale biodiesel production may be undertaken to improve overall economics in the long run (Sotoft et al. 2010). Therefore, biofuel is seen as a possible solution to meet future fuel demands. The transport sector plays a crucial role in world energy use and greenhouse gas emission produced worldwide. In 2004, transport sector produced 6.3G tons CO2 emissions and this sector responsible for about 23% of total greenhouse gas emissions. Several countries especially China and India have been introduced to mitigate local pollutants and GHG emissions from transport sector (Chao et al. 2009). Presently, Thailand government promotes the compressed natural gas and biofuel as transportation fuel as well as improving energy efficiency for vehicles (Pongthanaisawan and Sorapipatana 2011). As a result, it has potential to reduce energy related GHG emissions around 2-10% in transport sector by 2030. The share of non-OECD countries for GHG emission from transportation sector are 36% in 2004 and will increase rapidly to 46% by 2030 (Kahn Ribeiro and Kobayashi 2012). In 2012, the global CO2 emission reached 34 billion tonnes of CO2 and increased by 3% compared to the previous year (Olivier et al. 2012). Moreover, the five largest CO2 emitters nation are China (29%), United States (16%), European Union (EU27) (11%), India (6%) and Russian Federation (5%), closely followed by Japan (4%) (Giakoumis 2012).
272

Biodiesel consists of long-chain alkyl esters containing two oxygen atoms per molecule and considered as promising fuel for transport sector. Biodiesel that satisfied ASTM 6751 or EN 14214 standards are similar properties and characteristics with diesel fuel. Furthermore, many researchers had studied that biodiesel and diesel blended can be used in any diesel engine without modification. Biodiesel can effectively reduce emissions produced such as particulate matter, carbon monoxide (CO) and unburned hydrocarbons in four-stroke compression ignition engines (Hong 2012). The presence of oxygen in the fuel allows the fuel to burn more completely and resulted in fewer unburned fuel emissions. Thus, biodiesel fuel is meeting the global energy demand for transport fuels and can be sustainably developed in the future (Kumar et al. 2012b, Serrano et al. 2012, Swaminathan and Sarangan 2012). However, a slight increase in emissions of nitrogen oxides (NOx) has been observed in the use of oxygenated fuels in general (Buyukkaya 2010).
Biodiesel is gaining much attention as an alternative cleaner fuel to reduce the emission produced and decrease the dependence on fossil fuels (Khoo et al. 2011). Therefore, many countries are focused on developing and studying biodiesel fuel and policy which is environmental friendly and sustainable. (Rathmann et al. 2012) analysed that the Program National Production Biodiesel (PNPB) as Brazilian biodiesel policy was used to mitigate the CO2 emissions using biodiesel fuel by 75% compare to mineral diesel fuel (Garcez and de Souza Vianna 2009). (Pongthanaisawan and Sorapipatana 2011) reported that use of biodiesel diesel blends (B2) in 2008 and B5 in 2012 will lead to mitigating GHG emission in the transport sector. Furthermore, China had experienced rapid growth in road vehicles over the last three decades. Currently, road vehicles have accounted for about one-third of petroleum use and produce 9.7 billion of CO2 emissions (Yan and Crookes 2010). On the other hand, (Mao et al. 2012) determined that five policy design scenarios can be implemented to reduce CO2 emission in the transportation sector of China. The five policies are CO2 tax, fuel tax, energy tax, clean energy vehicle subsidy (CEVS) and reduction on ticket price (RTP). In their studies, China has announced that the target of abatement carbon intensity is about 40-45% in 2020. (Uherek et al. 2010) study showed that the past, present and future emissions from land transport will have impacts on the atmospheric and air quality. In their study, it was mentioned that Euro regulation (EC) has been applied to mitigate the CO2 emission from 130 g/km to 95 g/km in 2020.
Biodiesel implementation and policy need to be studied and addressed to match with the automobile manufacturing and scenarios. Thus, it is very crucial to investigate the suitable policy for biodiesel fuel for road transport and the impact of implantation of biodiesel fuel. The objective of this study focuses on energy, emission and economic impact of biodiesel fuel for road transport. This can serve as a guideline to develop and implement the biodiesel fuel in this nation for the future.
2. Methodology 2.1 Data prediction
The polynomial curve fitting method is used to estimate and predict long-term time
series. With the aid of this method, the relationship between variable x as the function
273
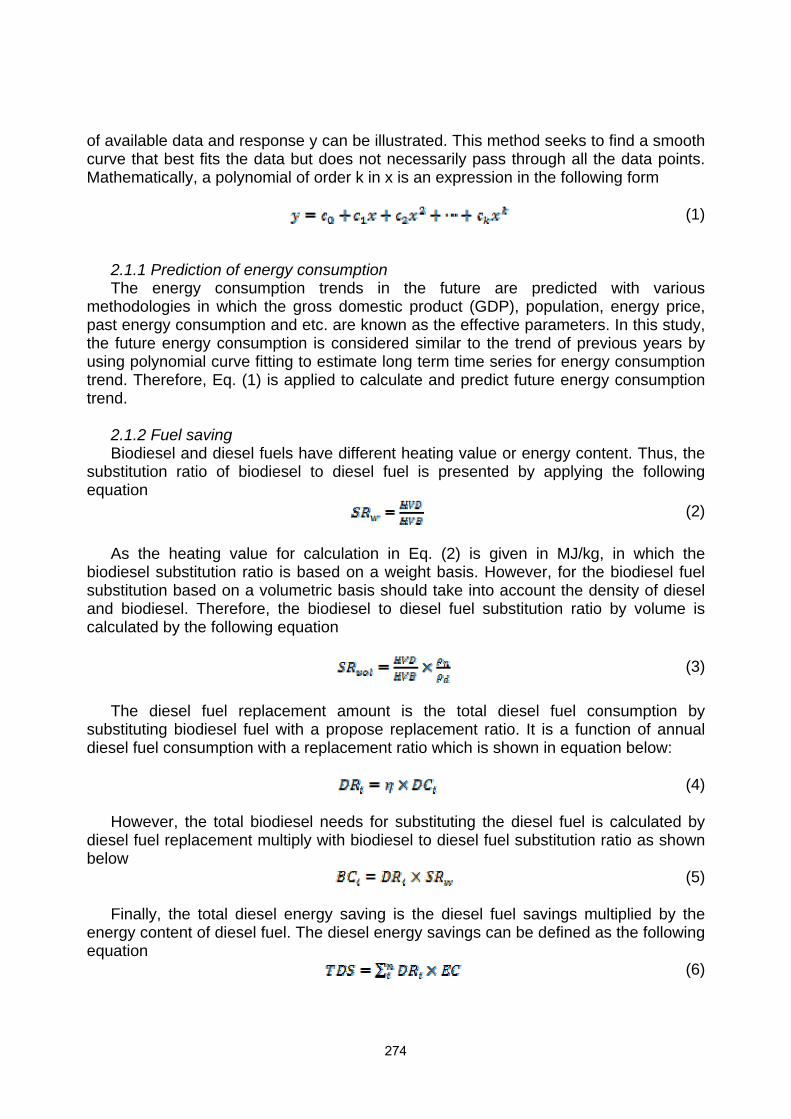
of available data and response y can be illustrated. This method seeks to find a smooth curve that best fits the data but does not necessarily pass through all the data points. Mathematically, a polynomial of order k in x is an expression in the following form
(1)
2.1.1 Prediction of energy consumption The energy consumption trends in the future are predicted with various
methodologies in which the gross domestic product (GDP), population, energy price, past energy consumption and etc. are known as the effective parameters. In this study, the future energy consumption is considered similar to the trend of previous years by using polynomial curve fitting to estimate long term time series for energy consumption trend. Therefore, Eq. (1) is applied to calculate and predict future energy consumption trend.
2.1.2 Fuel saving Biodiesel and diesel fuels have different heating value or energy content. Thus, the
substitution ratio of biodiesel to diesel fuel is presented by applying the following equation
(2)
As the heating value for calculation in Eq. (2) is given in MJ/kg, in which the
biodiesel substitution ratio is based on a weight basis. However, for the biodiesel fuel substitution based on a volumetric basis should take into account the density of diesel and biodiesel. Therefore, the biodiesel to diesel fuel substitution ratio by volume is calculated by the following equation
(3)
The diesel fuel replacement amount is the total diesel fuel consumption by
substituting biodiesel fuel with a propose replacement ratio. It is a function of annual diesel fuel consumption with a replacement ratio which is shown in equation below:
(4)
However, the total biodiesel needs for substituting the diesel fuel is calculated by
diesel fuel replacement multiply with biodiesel to diesel fuel substitution ratio as shown below
(5) Finally, the total diesel energy saving is the diesel fuel savings multiplied by the
energy content of diesel fuel. The diesel energy savings can be defined as the following equation
(6)
274

2.2 Environmental impact The environmental impacts such as potential emission reductions, crop land use for
biodiesel plant and ecosystem carbon payback period are discussed in this study. 2.2.1 Total carbon reduction Biodiesel is known as a cleaner fuel than diesel fuel which emits less emission and
pollutant into the environment. Thus, the potential carbon emission reduction is the difference between the total carbon emitted by biodiesel and the produced carbon emission by diesel fuel. Consequently, the total potential carbon saving is shown by the following equation
(7) Whereby, the terms of equation can be calculated by the following equations
(8)
(9) 2.2.2 Cropland needed The required cropland for the biodiesel plant is the total feedstock needs to produce
the biodiesel fuel. The needed cropland is a function of required feedstock divided by the feedstock oil yield and biodiesel conversion yield which is shown in following equation.
(10)
2.2.3 Ecosystem carbon payback period Carbon payback period is used to compare the overall carbon balance from biofuel
to compensate for losses in ecosystem carbon stock during land conversion to biofuel cropland. Ecosystem carbon payback period is calculated by the difference between the carbons stock from converting the natural land into biodiesel feedstock cropland divided by the annual carbon savings by using biodiesel fuel. The ecosystem carbon payback period is shown by the equation below
(11)
The change of ecosystem carbon stock is caused by the change of land use due to
the natural forest replacement with biodiesel feedstock production such as oil palm, jatropha curcas and calophyllum inophyllum. As a result, the change of ecosystem carbon stock between natural forest and biodiesel feedstock’s cropland are considered. In the present study, the estimation of carbon stock is taken from the results carried out by the intergovernmental panel on climate change (IPCC) guidance methodology reports prepared by Gibbs et al. (Gibbs et al. 2008). The outcome shows that the carbon stock for tropical forest in Southeast Asia is 229 tC/ha.
275

2.3 Economical Impact 2.3.1 Fossil diesel cost The production cost of fossil diesel fuel is estimated based on crude oil price and
refining margin of crude oil to diesel. Due to the absence of ex-refinery price for diesel because of the commercially confidential nature of the information, the production cost is estimated by applying US refining margin to Malaysia. The average margin for refining crude oil to diesel fuel is estimated to be 18% (Energy Information Administration 2011, Lopez and Laan 2008). Thus, fossil diesel cost can be summarized and calculated by following equation
(12)
2.3.2 Final biodiesel unit cost Final biodiesel unit cost is the total biodiesel cost converted into $ per liter of
biodiesel fuel. The conversion unit is a function of total biodiesel cost and density of biodiesel divided by annual production capacity. The final biodiesel unit cost can be expressed by the following equation
(13)
3. Results and discussion 3.1 Energy consumption by transportation sector
Being one of the fast industrialized countries with rapid economy growth, transportation plays a curial role to the economy and makes a vital contribution in daily activities in Malaysia. This is one of the factors that increase energy consumption of the transportation sector. The pattern of energy consumption by transportation sector based on fuel types in Malaysia is tabulated in Table 1 (Malaysia Energy Centre 2009). Total energy use by transportation sector increased from 7.83 Mtoe in 1995 to 16.8 Mtoe in 2010. This high growth rate is more than double with an annual growth rate of 6.6% over the year. The main energy sources for transportation sector are fossil fuels in which the primary usage belongs to petrol, followed by diesel and ATF & AV gas.
3.2 Prediction of diesel fuel consumption
The future diesel fuel consumption of the transportation sector is predicted by applying the polynomial curve fitting method as shown in Eq. (1) with assessment of the existing historical data from 1980 to 2010. Based on the listed historical data in Table 1, the diesel fuel consumption is projected by the following polynomial equation
(14) The results of predicted diesel fuel consumption for motor vehicles from year 2012
276

to 2031 in Malaysia are shown in Table 2. Based on the projection of historical fuel consumption trend, the total diesel consumption will increase to 14,368 ktoe or 16,972 million litres in 2031.
Table 1 Energy use by transportation sector in Malaysia (ktoe)
Year Petrol Diesel ATF & AV Gas Fuel Oil Natural Gas Electricity Total 1980 1296 847 250 0 0 0 2,420 1985 2057 1032 386 0 0 0 3,475 1990 2889 1826 628 41 0 0 5,384 1995 4,477 2,168 1,160 17 5 0 7,827 1996 5,161 2,417 1,335 32 4 1 8,950 1997 5,574 3,106 1,439 75 5 1 10,200 1998 5,849 2,311 1,619 9 4 1 9,793 1999 6,778 3,174 1,424 13 0 4 11,393 2000 6,378 4,103 1,574 4 7 4 12,070 2001 6,820 4,534 1,762 5 14 5 13,140 2002 6,940 4,680 1,785 4 28 4 13,441 2003 7,352 5,019 1,852 3 40 5 14,271 2004 7,867 5,398 2,056 4 54 6 15,385 2005 8,138 5,132 2,010 4 95 5 15,384 2006 7,838 4,726 2,152 3 120 5 14,825 2007 8,549 4,859 2,155 3 147 4 15,717 2008 8,788 5,283 2,112 3 194 15 16,395 2009 8,667 5,063 2,120 21 236 12 16,119 2010 9,076 5,094 2,380 12 247 18 16,827
Table 2 Diesel fuel consumption projection for transportation sector from 2012 to 2031
Year Diesel fuel consumption (ktoe) Diesel fuel consumption
( million litres) 2012 6,941 8,056 2013 7,263 8,429 2014 7,593 8,812 2015 7,931 9,205 2016 8,276 9,605 2017 8,629 10,015 2018 8,989 10,433 2019 9,357 10,860 2020 9,733 11,296 2021 10,116 11,741 2022 10,507 12,194 2023 10,906 12,657 2024 11,312 13,129 2025 11,726 13,609 2026 12,147 14,098 2027 12,576 14,596 2028 13,013 15,103 2029 13,457 15,618 2030 13,909 16,143 2031 14,368 16,675
277

3.3 Energy and emission impact The impact of the biodiesel fuel substitution on energy and emission saving is
predicted in this section. The calculation results for diesel fuel savings are based on 5% replacement of diesel fuel with palm, jatropha curcas and calophyllum inophyllum biodiesel. Thus, the results are presented in Table 3. The total diesel fuel savings is 337 ktons in year 2012 and it would increase to 698 ktons in 2031 when 5% of total diesel consumption is substituted by biodiesel in Malaysia. The required palm oil and palm plantation cropland are reported to be 415 ktons and 123 thousand hectare in 2012. It is predicted that the required palm biodiesel will increase to 859 ktons and the cropland needed will rise to 255 thousand hectare in 2031 for 5% of diesel fuel substitution. On the other hand, 377 ktons of jatropha curcas biodiesel with feedstock cropland of 279 thousand hectare are required which is more than double of the palm plantation cropland required in the same year. Moreover, with the same amount of diesel fuel savings, calophyllum inophyllum biodiesel only required 90 thousand hectare of cropland to produce 370 ktons of calophyllum inophyllum biodiesel. The required cropland for the calophyllum inophyllum biodiesel is about only 70% and 32% of palm Table 3 Biodiesel and cropland needed
Year Diesel
consumption (ktoe)
Diesel savings
(ton)
Palm biodiesel needed
(ton)
Palm cropland needed
(ha)
Jatropha curcas
biodiesel needed (ton)
Jatropha curcas
cropland needed (ha)
Calophyllum inophyllum biodiesel needed
(ton)
Calophyllum inophyllum cropland
needed (ha)
2012 6,941 337,130 415,151 123,337 377,410 279,253 369,727 90,806
2013 7,263 352,769 434,410 129,058 394,919 292,208 386,879 95,019
2014 7,593 368,798 454,148 134,922 412,862 305,484 404,458 99,336
2015 7,931 385,215 474,364 140,928 431,240 319,083 422,462 103,758
2016 8,276 401,972 494,999 147,059 449,999 332,963 440,839 108,272
2017 8,629 419,117 516,113 153,331 469,193 347,165 459,642 112,890
2018 8,989 436,603 537,645 159,728 488,768 361,649 478,819 117,600
2019 9,357 454,477 559,656 166,267 508,778 376,454 498,421 122,414
2020 9,733 472,739 582,145 172,948 529,222 391,581 518,449 127,333
2021 10,116 491,342 605,052 179,754 550,048 406,990 538,851 132,344
2022 10,507 510,333 628,439 186,702 571,308 422,721 559,678 137,459
2023 10,906 529,713 652,303 193,792 593,003 438,774 580,932 142,679
2024 11,312 549,433 676,587 201,006 615,079 455,108 602,558 147,991
2025 11,726 569,541 701,349 208,363 637,590 471,765 624,611 153,407
2026 12,147 589,989 726,529 215,844 660,481 488,702 647,036 158,915
2027 12,576 610,826 752,189 223,467 683,808 505,962 669,888 164,527
2028 13,013 632,051 778,326 231,232 707,569 523,544 693,166 170,244
2029 13,457 653,617 804,882 239,121 731,711 541,407 716,816 176,053
2030 13,909 675,571 831,917 247,153 756,288 559,592 740,893 181,966
2031 14,368 697,865 859,371 255,309 781,246 578,058 765,343 187,971
278

and jatropha curcas cropland to generate the same amount of energy. The high production rate per hectare of calophyllum inophyllum is due to the high oil yield of crude calophyllum inophyllum oil which is about 4680 kg/ha.
3.4 Life cycle emission reduction Evaluating greenhouse gas or CO2 emissions is required to assess all direct and
indirect effects from production to the combustion of biodiesel fuel. Fig. 2 presents the impact of CO2 saving from 5% biodiesel substitution for diesel consumption. Jatropha curcas biodiesel shows the highest CO2 saving compare to palm biodiesel and calophyllum inophyllum biodiesel. The amount of CO2 saving for jatropha curcas biodiesel is predicted to be around 1200 ktons in year 2031 which is 33% and 40% more than the reported amounts for the palm biodiesel and calophyllum inophyllum biodiesel respectively.
Fig. 2 Impact of CO2 saving from 5% biodiesel substitution for diesel consumption
3.5 Ecosystem carbon payback period Ecosystem carbon payback time is the years required for the biodiesel carbon
emission savings from fossil fuel to compensate the carbon losses in ecosystem during land conversion to biodiesel cropland. Generally, in comparison with fossil diesel fuel, biodiesel shows lower life cycle emission and improvement of environmental performance. However, the extra greenhouse gas emissions loss for natural forest converted to biodiesel cropland is considered as a ‘carbon debt’. It is due to the carbon stock in natural forest which was found to be 3 to 21 times higher than biodiesel cropland plantation. In order to incorporate the costs of carbon emissions accurately, the greenhouse gas emission reductions must be extended to include the net
279
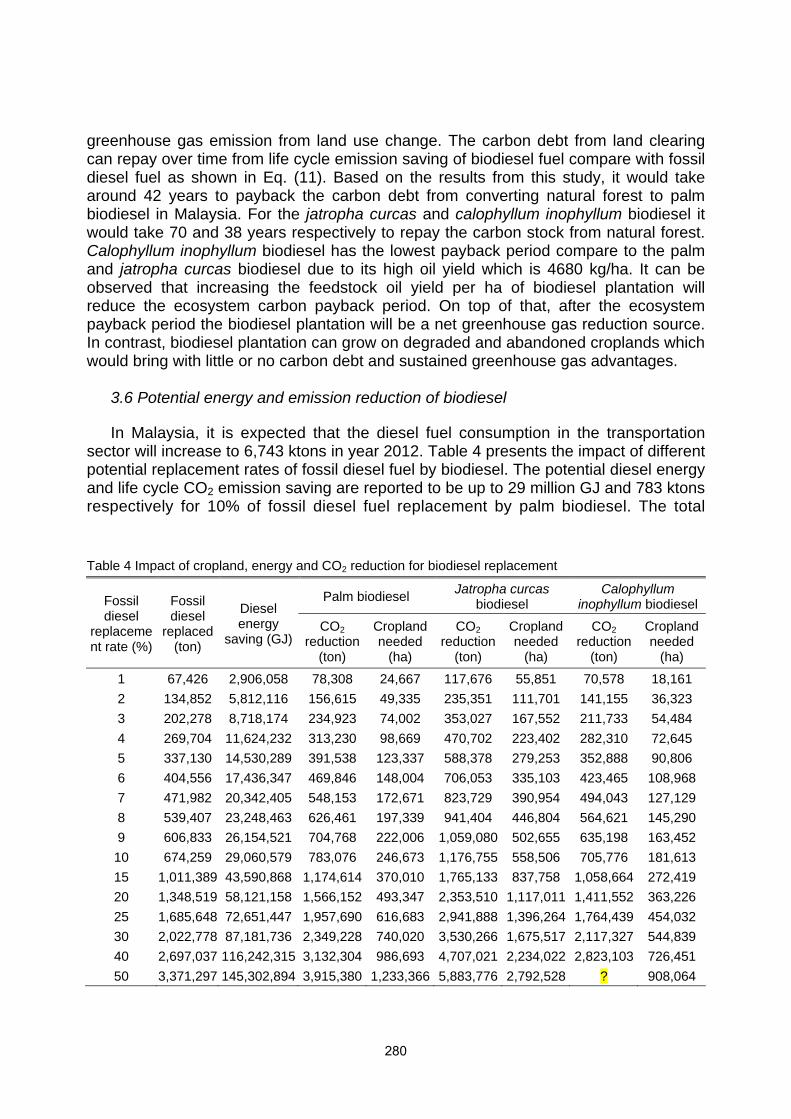
greenhouse gas emission from land use change. The carbon debt from land clearing can repay over time from life cycle emission saving of biodiesel fuel compare with fossil diesel fuel as shown in Eq. (11). Based on the results from this study, it would take around 42 years to payback the carbon debt from converting natural forest to palm biodiesel in Malaysia. For the jatropha curcas and calophyllum inophyllum biodiesel it would take 70 and 38 years respectively to repay the carbon stock from natural forest. Calophyllum inophyllum biodiesel has the lowest payback period compare to the palm and jatropha curcas biodiesel due to its high oil yield which is 4680 kg/ha. It can be observed that increasing the feedstock oil yield per ha of biodiesel plantation will reduce the ecosystem carbon payback period. On top of that, after the ecosystem payback period the biodiesel plantation will be a net greenhouse gas reduction source. In contrast, biodiesel plantation can grow on degraded and abandoned croplands which would bring with little or no carbon debt and sustained greenhouse gas advantages.
3.6 Potential energy and emission reduction of biodiesel In Malaysia, it is expected that the diesel fuel consumption in the transportation
sector will increase to 6,743 ktons in year 2012. Table 4 presents the impact of different potential replacement rates of fossil diesel fuel by biodiesel. The potential diesel energy and life cycle CO2 emission saving are reported to be up to 29 million GJ and 783 ktons respectively for 10% of fossil diesel fuel replacement by palm biodiesel. The total Table 4 Impact of cropland, energy and CO2 reduction for biodiesel replacement
Fossil diesel
replacement rate (%)
Fossil diesel
replaced (ton)
Diesel energy
saving (GJ)
Palm biodiesel Jatropha curcas
biodiesel Calophyllum
inophyllum biodiesel
CO2 reduction
(ton)
Cropland needed
(ha)
CO2
reduction (ton)
Cropland needed
(ha)
CO2
reduction (ton)
Cropland needed
(ha)
1 67,426 2,906,058 78,308 24,667 117,676 55,851 70,578 18,161
2 134,852 5,812,116 156,615 49,335 235,351 111,701 141,155 36,323
3 202,278 8,718,174 234,923 74,002 353,027 167,552 211,733 54,484
4 269,704 11,624,232 313,230 98,669 470,702 223,402 282,310 72,645
5 337,130 14,530,289 391,538 123,337 588,378 279,253 352,888 90,806
6 404,556 17,436,347 469,846 148,004 706,053 335,103 423,465 108,968
7 471,982 20,342,405 548,153 172,671 823,729 390,954 494,043 127,129
8 539,407 23,248,463 626,461 197,339 941,404 446,804 564,621 145,290
9 606,833 26,154,521 704,768 222,006 1,059,080 502,655 635,198 163,452
10 674,259 29,060,579 783,076 246,673 1,176,755 558,506 705,776 181,613
15 1,011,389 43,590,868 1,174,614 370,010 1,765,133 837,758 1,058,664 272,419
20 1,348,519 58,121,158 1,566,152 493,347 2,353,510 1,117,011 1,411,552 363,226
25 1,685,648 72,651,447 1,957,690 616,683 2,941,888 1,396,264 1,764,439 454,032
30 2,022,778 87,181,736 2,349,228 740,020 3,530,266 1,675,517 2,117,327 544,839
40 2,697,037 116,242,315 3,132,304 986,693 4,707,021 2,234,022 2,823,103 726,451
50 3,371,297 145,302,894 3,915,380 1,233,366 5,883,776 2,792,528 ? 908,064
280

Table 5 Fossil diesel production cost at different crude oil price
Crude petroleum oil price
$/barrel 25 50 75 100 125 150 175 200 225 250
$/litre 0.157 0.314 0.472 0.629 0.786 0.943 1.101 1.258 1.415 1.572
Diesel production cost (Crude oil cost + refining margin)
$/litre 0.186 0.371 0.557 0.742 0.928 1.113 1.299 1.484 1.670 1.855
Fig. 3 Diesel fuel production cost as a function of crude petroleum price
required cropland for oil palm plantation is around 247 thousand hectares when 10% of fossil diesel is replaced by palm biodiesel. On the other hand, the potential life cycle CO2 emission saving is up to 1,177ktons and 559 thousand hectares cropland is needed when 10% of fossil diesel fuel is replaced by jatropha curcas biodiesel. Jatropha curcas biodiesel shows more CO2 saving compared to the palm biodiesel. However, the cropland required to produce the jatropha curcas biodiesel is more than double of palm biodiesel. Besides, the potential CO2 emission reduction is 706 ktons and 182 thousand hectares cropland is needed when 10% of fossil diesel fuel is replaced by calophyllum inophyllum biodiesel. Calophyllum inophyllum biodiesel can save up to 26% and 68.5% of cropland compared to the palm and jatropha curcas biodiesel for 10% of diesel replacement rate. The advantage of calophyllum inophyllum biodiesel in comparison with palm and jatropha curcas biodiesel is being the lowest required cropland. Besides, calophyllum inophyllum biodiesel is from non-edible feedstock. Thus, calophyllum inophyllum biodiesel has no conflict between food and fuel competition. Furthermore, calophyllum inophyllum plant can tolerate various kinds of soil and it can grow in degraded and marginal soil.
3.7 Diesel production cost The diesel fuel cost is calculated and estimated by crude petroleum oil price using
refining margin of 18%. The diesel fuel production cost at different crude oil price is
281

calculated by using Eq. (12). The results are presented in Table 5 and Fig. 3. The diesel production cost is $0.557 when the crude oil price is $75/barrel.
3.8 Biodiesel production cost The biodiesel fuel cost is calculated and estimated by life cycle cost of biodiesel
production and the data collected from previous study (Ong 2012, Ong et al. 2012). The biodiesel production cost is calculated at a function of crude feedstock oil price and converted to $ per litre of diesel equivalent by Eq. (13). The results of palm, jatropha curcas and calophyllum inophyllum biodiesel production cost at different feedstock price are shown in Table 6. Table 6 Biodiesel production cost at different feedstock price
Feedstock price ($/ton) 400 600 800 1,000 1,200 1,400 1,600 1,800 2,000
Palm biodiesel production cost
$/litre 0.33 0.45 0.56 0.67 0.79 0.90 1.01 1.12 1.24
$/litre diesel equiv. 0.39 0.52 0.66 0.79 0.92 1.05 1.19 1.32 1.45
Jatropha curcas biodiesel production cost
$/litre 0.34 0.45 0.56 0.67 0.77 0.88 0.99 1.10 1.21
$/litre diesel equiv. 0.37 0.49 0.61 0.72 0.84 0.96 1.08 1.19 1.31
Calophyllum inophyllum biodiesel production cost
$/litre 0.32 0.42 0.53 0.63 0.73 0.83 0.93 1.04 1.14
$/litre diesel equiv. 0.34 0.45 0.55 0.66 0.77 0.88 0.99 1.09 1.20
3.9 Economic impact: biodiesel breakeven cost Biodiesel breakeven cost is at a point in which price of the biodiesel is economically
competitive with the fossil diesel. Biodiesel breakeven cost is calculated based on the comparison between the biodiesel production costs at different crude fossil oil price which is presented in Table 6. The production cost of diesel fuel at different crude petroleum price is illustrated in Fig. 3. The different energy content of biodiesel and diesel fuel is taken into account. Thus, the cost of biodiesel production is converted to diesel fuel by considering the substitution ratio as shown in Eq. (3). The calculated breakeven price is based on no subsidy assumption for both fuels.
Tables 5 and 6 indicate that palm biodiesel is likely to be competitive with diesel fuel when the CPO price is $1000/ton and the crude oil price is around $105/barrel or above. At this price, biodiesel and diesel fuel production cost are around $0.8/litre of diesel equivalent. The breakeven price for palm biodiesel at different petroleum oil and crude palm oil price are presented in Fig. 4. The upper part area of the line in Fig. 4 represents the subsidy needed for replacement of diesel fuel with palm biodiesel fuel. Whereas, the lower part of the line area is the potential saving generated by the substitution. For instance, when the crude petroleum oil price is $100/barrel, biodiesel fuel is comparable with diesel fuel at CPO price of $931/ton. When the CPO price increases to above $931/ton, subsidy is required to keep biodiesel viable. However, if
282

Fig. 4 Breakeven price for palm biodiesel production at different petroleum and CPO prices
the CPO price falls below $931/ton, a saving would be generated by substituting diesel fuel with palm biodiesel fuel.
Tables 5 and 6 indicate that jatropha curcas biodiesel is competitive with diesel fuel when the CJO price is $800/ton and the crude oil price is around $80/barrel or above. At this price, both fuel production cost are around $0.6/litre of diesel equivalent. Based on the listed data in Tables 5 and 6, the breakeven price for jatropha curcas biodiesel at different petroleum oil and CJO price are calculated and illustrated in Fig. 5. It is shown that when the crude petroleum oil price is $80/barrel, jatropha curcas biodiesel fuel is comparable with diesel fuel at CJO price of $780/ton. When the CJO price
Fig. 5 Breakeven price for jatropha curcas biodiesel production at different petroleum and CJO prices
283

increases to above $780/ton, subsidy is needed to keep biodiesel viable at $80/barrel of crude petroleum. However, if the CJO price falls to $780/ton or below, a saving would be generated by replacing diesel fuel with jatropha curcas biodiesel fuel.
Besides, Tables 5 and 6 indicate that calophyllum inophyllum biodiesel is likely to be competitive with diesel fuel when the CBO price is $800/ton and crude oil price is around $75/barrel or above. Biodiesel and diesel fuel production costs are around $0.55/litre of diesel equivalent at this price. The breakeven price for calophyllum inophyllum biodiesel at different price of petroleum oil and CBO are presented in Fig. 6. It can be seen that when the crude petroleum oil price is $80/barrel, biodiesel fuel is comparable with diesel fuel at CBO price of $873/ton. When the CBO price increases to above $873/ton, subsidy is required to keep biodiesel viable. However, when the CBO price falls below $873/ton saving would be generated by substituting diesel fuel with calophyllum inophyllum biodiesel fuel at $80/barrel of crude petroleum oil.
Fig. 6 Breakeven price for calophyllum inophyllum biodiesel production
at different petroleum and CBO prices
4. Conclusions Biodiesel fuel is one of the significant solutions to oil shortages, global warming and
air pollution for road vehicles. The projected diesel saving and CO2 emissions reduction are estimated to be 698 ktons and 1200 ktons by year 2031 with replacement of 5% diesel fuel with biodiesel. Applying jatropha curcas biodiesel shows the highest CO2 reduction compare to palm and calophyllum inophyllum biodiesel. However, Calophyllum inophyllum biodiesel required the lowest cropland and payback period compare to the palm and jatropha curcas biodiesel due to its high oil yield which is 4680 kg/ha.
284

Acknowledgement The authors would like to acknowledge the Ministry of Higher Education of Malaysia
and The University of Malaya, Kuala Lumpur, Malaysia for the financial support under High Impact Research Grant (HIRG) UM.C/HIR/MOHE/ENG/15 (D000015-16001).
References
Atabani, A.E., Silitonga, A.S., Irfan, A.B., Mahlia, T.M.I., Masjuki, H.H. and Mekhilef, S. (2012), “A comprehensive review on biodiesel as an alternative energy resource and its characteristics”, Renew. Sust. Eng. Rev., 16(4), 2070-2093.
British Petroleum (2012), Statistical Review of World Energy. Buyukkaya, E. (2010), “Effects of biodiesel on a DI diesel engine performance,
emission and combustion characteristics”, Fuel, 89(10), 3099-3105. Capros, P., Mantzos, L., Papandreou, V. and Tasios, N. (2008), European Energy and
Transport, Institute of Communication and Computer Systems of the National Technical University of Athens. Belgium.
Chao, H., Yunshan, G., Jianwei, T., Kewei, Y., Xunkun, H., Junfang, W., Qiuwen, Y. and Asad, N.S. (2009), “Comparison of carbonyl compounds emissions from diesel engine fueled with biodiesel and diesel”, Atmos. Environ., 43(24), 3657-3661.
Energy Information Administration (2011), Petroleum and Other Liquids: Refining and Processing.
Garcez, C.A.G. and de Souza Vianna, J.N. (2009), “Brazilian Biodiesel Policy: Social and environmental considerations of sustainability”, Energy, 34(5), 645-654.
Giakoumis, E.G. (2012), “A statistical investigation of biodiesel effects on regulated exhaust emissions during transient cycles”, Appl. Eng., 98, 273-291.
Gibbs, H., Johnston, M., Foley, J. and Zaks, D. (2008), “Carbon payback times for crop-based biofuel expansion in the tropics: the effects of changing yield and technology”, Environ. Res., 3(10).
Hong, J. (2012), “Uncertainty propagation in life cycle assessment of biodiesel versus diesel: Global warming and non-renewable energy”, Bioresource. Technol., 113(0), 3-7.
Kahn Ribeiro, S.K. and Kobayashi, S. (2012), “Transport and its infrastructure”, Transport and its infrastructure, 2012.
Khoo, H.H., Sharratt, P.N., Das, P., Balasubramanian, R.K., Naraharisetti, P.K. and Shaik, S. (2011), “Life cycle energy and CO2 analysis of microalgae-to-biodiesel: Preliminary results and comparisons”, Bioresource. Technol., 102(10), 5800-5807.
Kumar, S., Chaube, A. and Jain, S.K. (2012a), “Critical review of jatropha biodiesel promotion policies in India”, Eng. Policy, 41, 775-781.
Kumar, S., Singh, J., Nanoti, S.M. and Garg, M.O. (2012b), “A comprehensive life cycle assessment (LCA) of Jatropha biodiesel production in India”, Bioresource. Technol. 110(0), 723-729.
Lopez, G.P. and Laan, T. (2008), Biofuels-At what cost?, International Institute for Sustainable Development (IISD).
Malaysia Energy Centre (2009), National Energy Balance (2008), Ministry of Energy,
285

Communications and Multimedia. Mao, X., Yang, S., Liu, Q., Tu, J. and Jaccard, M. (2012), “Achieving CO2 emission
reduction and the co-benefits of local air pollution abatement in the transportation sector of China”, Environ. Sci. Policy, 21, 1-13.
Olivier, J.G.J., Maenhout, G.J. and Peters, J.A.H.W. (2012), “Trends in global CO2 emissions”, PBL Netherlands Environmental Assessment Agency.
Ong, H.C. (2012), “Techno-economics analysis of biodiesel production from palm, jatropha and calophyllum inophyllum for road transport in Malaysia”, Mechanical Engineering, Ph.D., University of Malaya. Kuala Lumpur.
Ong, H.C., Mahlia, T.M.I., Masjuki, H.H. and Honnery, D. (2012), “Life cycle cost and sensitivity analysis of palm biodiesel production”, Fuel, 98, 131-139.
Pongthanaisawan, J. and Sorapipatana, C. (2011), “Greenhouse gas emissions from Thailand’s transport sector: Trends and mitigation options”, Appl. Eng. In Press, Corrected Proof, Available online 18 October 2011.
Rathmann, R., Szklo, A. and Schaeffer, R. (2012), “Targets and results of the Brazilian Biodiesel Incentive Program – Has it reached the Promised Land?”, Appl. Eng., 97, 91-100.
Serrano, L., Carreira, V., Câmara, R. and da Silva, G.M. (2012), “On-road performance comparison of two identical cars consuming petrodiesel and biodiesel”, Fuel Process. Technol., 103, 125-133.
Sotoft, L.F., Rong, B.-G., Christensen, K.V. and Norddahl, B. (2010), “Process simulation and economical evaluation of enzymatic biodiesel production plant”, Bioresource. Technol. ,101(14), 5266-5274.
Swaminathan, C. and Sarangan, J. (2012), “Performance and exhaust emission characteristics of a CI engine fueled with biodiesel (fish oil) with DEE as additive”, Biomass. Bioeng., 39(8), 168-174.
U.S. Energy Information Administration (2010), International energy outlook 2010 Energy and Enviromental aspect of transport policy, 2012.
Uherek, E., Halenka, T., Kleefeld, J.B., Balkanski, Y., Berntsen, T., Borrego, C., Gauss, M., Hoor, P., Rezler, K.J., Lelieveld, J., Melas, D., Rypdal, K. and Schmid, S. (2010), “Transport impacts on atmosphere and climate: Land transport”, Atmos. Environ., 44(37), 4772-4816.
Yan, X. and Crookes, R.J. (2010), “Energy demand and emissions from road transportation vehicles in China”, Prog. Eng. Combust. , 36(6), 651-676.
286