energy efficiency potential study for consolidated edison
TRANSCRIPT

Global Energy Partners, LLC 500 Ygnacio Valley Road Suite 450 Walnut Creek, CA 94596
Energy Efficiency Potential Study for Consolidated Edison Company of New York, Inc.
Volume 2: Electric Potential Report
Final Report
March 2010
Global Energy Partners Project Managers
I. Rohmund and G. Wikler


iii
DISCLAIMER OF WARRANTIES AND LIMITATION OF LIABILITIES
This document was prepared by Global Energy Partners, LLC (Global), a privately-held, employee-owned company. Neither Global nor any person acting on its behalf:
(a) Makes any warranty or representation whatsoever express or implied, (i) With respect to the use of any information, apparatus, method, process, or similar item
disclosed in this document, including merchantability and fitness for a particular purpose, or (ii) That such use does not infringe on or interfere with privately owned rights, including any
party's intellectual property, or (iii) That this document is suitable to any particular user's circumstance; or
(b) Assumes responsibility for any damages or other liability whatsoever (including any consequential damages, even if Global or any Global representative has been advised of the possibility of such damages) resulting from your selection or use of this document or any information, apparatus, method, process, or similar item disclosed in this document.
This report was prepared by
Global Energy Partners, LLC 500 Ygnacio Valley Road Suite 450 Walnut Creek, CA 94596
Principal Investigator(s): I. Rohmund G. Wikler A. Duer B. Kester J. Prijyanonda D. Weidberg C. Williamson S. Yoshida Sub-contractors:
Washington University Michael’s Engineering, Inc. tLync Energy Engineering and Consulting The report is a corporate document that should be cited in the literature in the following manner:
Energy Efficiency Potential Study for Consolidated Edison Company of New York, Inc. Volume 2: Electric Potential Report, Global Energy Partners, LLC, Walnut Creek, March 2010.


v
CONTENTS
1 INTRODUCTION.................................................................................... 1-1 1.1 Background ................................................................................... 1-1 1.2 Objectives ..................................................................................... 1-1 1.3 Report Organization ........................................................................ 1-2
2 STUDY APPROACH ................................................................................ 2-1 2.1 Market Assessment ........................................................................ 2-2 2.2 Customer Surveys .......................................................................... 2-2 2.3 Reference Energy Use ..................................................................... 2-2
2.3.1 Base-year Market Profiles ...................................................... 2-2 2.3.2 Reference Forecast ............................................................... 2-3 2.3.3 Modeling Approach ............................................................... 2-3
2.4 Energy-Efficiency Measures Analysis ................................................. 2-5 2.5 Assessment of Energy-Efficiency Potential ......................................... 2-6
3 MARKET ASSESSMENT .......................................................................... 3-1 3.1 Residential Sector .......................................................................... 3-2 3.2 C&I Sectors ................................................................................... 3-3
4 REFERENCE FORECAST ......................................................................... 4-1 4.1 Residential Sector .......................................................................... 4-1
4.1.1 Market Segmentation ........................................................... 4-1 4.1.2 Prototype Modeling ............................................................... 4-2 4.1.3 Base-year Market Profiles ...................................................... 4-4 4.1.4 Reference Forecast ............................................................... 4-6
4.2 Commercial Sector ....................................................................... 4-12 4.2.1 Market Segmentation ......................................................... 4-12 4.2.2 Prototype Modeling ............................................................. 4-14 4.2.3 Base-Year Market Profiles .................................................... 4-14 4.2.4 Reference Forecast ............................................................. 4-17
4.3 Industrial Sector .......................................................................... 4-21 4.4 Reference Forecast Summary ........................................................ 4-25
5 ENERGY EFFICIENCY MEASURES .......................................................... 5-1 5.1 List of Energy Efficiency Measures .................................................... 5-2
5.1.1 Residential Measures ............................................................ 5-2 5.1.2 C&I Measures ...................................................................... 5-3
5.2 Measure Characteristics .................................................................. 5-5 5.2.1 Measure Cost Data Development ............................................ 5-6
vi
5.2.2 Representative Measure Data Inputs ...................................... 5-6 5.3 Economic Screening ....................................................................... 5-7
5.3.1 Avoided Costs ...................................................................... 5-8 5.4 Results of the Economic Screen........................................................ 5-9
6 ENERGY EFFICIENCY POTENTIAL RESULTS .......................................... 6-1 6.1 Definitions of Potential .................................................................... 6-1
6.1.1 Technical Potential ............................................................... 6-1 6.1.2 Economic Potential ............................................................... 6-1 6.1.3 Maximum Achievable Potential ............................................... 6-2 6.1.4 Realistic Achievable Potential ................................................. 6-2
6.2 Overall Energy Efficiency Potential .................................................... 6-3 6.2.1 Comparison of Results .......................................................... 6-7
6.3 Residential Sector Potential ............................................................. 6-8 6.3.1 Residential Potential by Market Segment ............................... 6-11 6.3.2 Residential Potential by End Use .......................................... 6-11 6.3.3 Residential Potential by Measure Type .................................. 6-12
6.4 Commercial Sector Potential .......................................................... 6-14 6.4.1 Commercial Potential by Market Segment ............................. 6-16 6.4.2 Commercial Potential by End Use ......................................... 6-17 6.4.3 Commercial Potential by Measure Type ................................. 6-18
6.5 Industrial Sector Potential ............................................................. 6-21 6.5.1 Industrial Potential by End Use ............................................ 6-23 6.5.2 Industrial Potential by Measure Type .................................... 6-23
APPENDICES
A: Customer Surveys
B: Residential Prototype Descriptions
C: Residential Energy Market Profiles
D: Residential Energy-Efficiency Equipment and Measure Data
E: Residential Reference Forecast and Potential Results
F: Commercial Prototype Descriptions
G: Commercial Energy Market Profiles
H: Commercial and Industrial Energy-Efficiency Equipment and Measure Data
I: Commercial and Industrial Reference Forecast and Potential Results
J: Market and Program Acceptance Factors

vii
LIST OF FIGURES
Figure 2-1 Depiction of Analysis Framework .......................................................... 2-1 Figure 3-1 Residential Electricity Use by Customer Segment 2007 ............................ 3-2 Figure 3-2 C&I Electricity Use by Customer Segment 2007 ...................................... 3-4 Figure 4-1 Residential Electricity Consumption by End Use, 2007 ............................. 4-5 Figure 4-2 Residential End-Use Shares by Market Segment, 2007 ............................ 4-5 Figure 4-3 Residential Reference Forecast by End Use (GWh) .................................. 4-9 Figure 4-4 Commercial Electricity Consumption by End Use, 2007 .......................... 4-16 Figure 4-5 Commercial End-use Shares by Market Segment, 2007 ......................... 4-17 Figure 4-6 Commercial Reference Forecast by End Use ......................................... 4-19 Figure 4-7 Industrial Electricity Consumption by End Use, 2007 ............................. 4-23 Figure 5-1 Approach for Measure Assessment ........................................................ 5-1 Figure 6-1 Summary of Energy Efficiency Potential ................................................. 6-5 Figure 6-2 Energy Efficiency Potential Forecasts ..................................................... 6-5 Figure 6-3 Residential Energy Efficiency Potential ................................................... 6-9 Figure 6-4 Residential Energy Efficiency Potential Forecast .................................... 6-10 Figure 6-5 Commercial Energy Efficiency Potential ................................................ 6-15 Figure 6-6 Commercial Energy Efficiency Potential Forecast ................................... 6-15 Figure 6-7 Industrial Energy Efficiency Potential ................................................... 6-22 Figure 6-8 Industrial Energy Efficiency Potential Forecast ...................................... 6-22


ix
LIST OF TABLES
Table 2-1 Data Needs for the Reference Forecast and Potentials Estimation in LoadMAP ......................................................................................... 2-4
Table 3-1 Estimated Sector-Level Electricity Use .................................................... 3-1 Table 3-2 Residential Sector Electricity Usage and Population Estimates by Building
Type ............................................................................................... 3-2 Table 3-3 C&I Sector Electricity Usage and Floor Space Estimates by Building Type .... 3-3 Table 3-4 Comparison of Floor Stock Estimates (thousand square feet) ..................... 3-5 Table 4-1 Residential End Uses and Technologies ................................................... 4-2 Table 4-2 Residential Sector Market Profile, 2007 ................................................... 4-6 Table 4-3 Forecast of Household Growth ............................................................... 4-7 Table 4-4 Residential Reference Forecast by Market Segment .................................. 4-8 Table 4-5 Residential Reference Forecast by End-Use and Technology .................... 4-10 Table 4-6 Residential Reference Forecast per Household ....................................... 4-11 Table 4-7 Commercial End Uses and Technologies ................................................ 4-13 Table 4-8 Commercial Electricity Use by Market Segment, 2007 ............................. 4-14 Table 4-9 Commercial Sector Market Profile, 2007 ............................................... 4-15 Table 4-10 Commercial Floor Stock Forecast by Market Segment ........................... 4-18 Table 4-11 Commercial Reference Forecast by Market Segment ............................. 4-18 Table 4-12 Commercial Reference Forecast by End Use and Technology .................. 4-20 Table 4-13 Industrial End Uses and Technologies ................................................. 4-21 Table 4-14 Industrial Sector Market Profile, 2007 ................................................. 4-22 Table 4-15 Industrial Floor Stock Forecast ........................................................... 4-23 Table 4-16 Industrial Reference Forecast by End Use and Technology ..................... 4-24 Table 4-17 Reference Forecast Summary ............................................................ 4-25 Table 5-1 Summary of Residential Energy-Efficiency Measures ................................. 5-3 Table 5-2 Summary of Commercial Energy-Efficiency Measures ............................... 5-4 Table 5-3 Summary of Industrial Energy-Efficiency Measures .................................. 5-5 Table 5-4 Sample Equipment Measures for Central Air Conditioning – Single Family
Home .............................................................................................. 5-6 Table 5-5 Sample Non-Equipment Measures – Single Family Home .......................... 5-7 Table 5-6 Avoided Cost and Retail Electricity Price Forecasts.................................... 5-8 Table 5-7 Summary of Economic Screen Results .................................................... 5-9 Table 6-1 Summary of Energy Efficiency Potential .................................................. 6-4 Table 6-2 Energy Efficiency Potential by Sector ...................................................... 6-6 Table 6-3 Comparison of Energy Efficiency Potential Studies .................................... 6-7 Table 6-4 Energy Efficiency Potential for the Residential Sector ................................ 6-9 Table 6-5 Residential Potential by Market Segment, 2018 ..................................... 6-11

x
Table 6-6 Residential Potential by End Use and Potential Type ............................... 6-12 Table 6-7 Residential RAP (mid-level) by Technology – Equipment Measures ........... 6-13 Table 6-8 Residential RAP (mid-level) for Non-Equipment Measures ....................... 6-13 Table 6-9 Energy Efficiency Potential for the Commercial Sector ............................ 6-14 Table 6-10 Commercial Potential by Market Segment, 2018 .................................. 6-16 Table 6-11 Commercial Potential by End Use and Potential Type ........................... 6-17 Table 6-12 Commercial RAP (mid-level) by Technology – Equipment Measures ........ 6-19 Table 6-13 Commercial RAP (mid-level) for Non-Equipment Measures .................... 6-20 Table 6-14 Energy Efficiency Potential for the Industrial Sector .............................. 6-21 Table 6-15 Industrial Potential by End Use and Potential Type .............................. 6-23 Table 6-16 Industrial RAP (mid-level) by Technology – Equipment Measures ........... 6-24 Table 6-17 Industrial RAP (mid-level) for Non-Equipment Measures ........................ 6-24

1-1
CHAPTER 1
INTRODUCTION
1.1 BACKGROUND Over the past few years, there has been a major shift in the energy agenda for New York City and New York State. New York City announced PlaNYC 2030, which is targeting a 30 percent reduction in greenhouse gases by 2030. Similarly, by 2015 New York State plans on meeting 45 percent of its electricity needs (45 x 15) through improved energy efficiency and clean renewable energy.
The introduction of these broad program initiatives—along with the resultant energy efficiency regulatory proceedings undertaken by the New York State Public Service Commission (NYSPSC) to expedite energy efficiency programs, establish benchmarks, and administer the 45 x 15 initiative—calls for a comprehensive study of energy efficiency potential that focuses on the Consolidated Edison Company of New York, Inc. (Con Edison) downstate markets of New York City and Westchester County. Con Edison retained Global Energy Partners (Global) to conduct a 10-year market assessment for energy efficiency in these markets.
The market assessment is comprehensive and comprises the potential savings for four forms of energy: electricity (energy and demand), natural gas, steam, and fuel oil. The results of the assessment are detailed in a multi-volume report. This particular volume focuses on the electricity savings potential.
1.2 OBJECTIVES The overall goal of this assessment is to provide a thorough and realistic analysis of the available energy and demand savings that can be obtained from viable energy efficiency measures through 2018. The main objectives for this study include the following:
• Isolate and evaluate specific end-use energy consumption encompassing electric (both energy and demand), natural gas, fuel oil and steam by service class, customer type, building category and business segment.
• Develop baseline energy profiles for each market segment.
• Estimate the technical, economic and achievable potentials by passing all measures through a screening process to determine their viability in the market.
• Administer a number of key cost effectiveness tests or variations of such tests to determine key cross-over points, including Total Resource Cost - TRC, Rate Impact Measure – RIM, and Participant Cost – PCT.
Specific objectives for the analysis of potential energy savings include considering impacts from five factors:
• Natural turnover of equipment or market availability (including existing saturation data) and early and other discretionary retrofits decisions.
• Anticipated changes to federal minimum efficiency ratings addressing equipment (e.g. The Energy Independence and Security Act of 2007) and state and local building codes and standards.
• Customer growth, equipment adoption rates and applicability.

Introduction Volume 2: Electric Potential Report
1-2
• New construction market (estimated by segment).
• The American Recovery and Reinvestment Act of 2009.
Specific objectives for the research approach are as follows:
• Utilize existing customer and market data from Con Edison, the City of New York (NYC), the New York Power Authority (NYPA), the New York State Energy Research and Development Authority (NYSERDA) and other local sources.
• Conduct extensive primary market research across all Con Edison customer types, including onsite surveys with the largest and most complex buildings.
• Benchmark for similarly situated market segments and buildings across the United States and draw comparisons with recently completed engineering and parametric analyses.
• Leverage a national study undertaken by the Electric Power Research Institute (EPRI), hereafter referred to as the EPRI National Potential Study.1
1.3 REPORT ORGANIZATION
This report describes the estimation of energy efficiency potential for electricity. The report is organized into the following chapters:
• Chapter 2 – Study Approach describes the overall approach and the analysis steps taken to conduct the study.
• Chapter 3 – Market Assessment outlines the approaches used to segment the residential, commercial and industrial markets and create control totals for the reference forecast.
• Chapter 4 – Reference Forecast describes the development of the baseline forecast and presents the forecast results for the residential and business sector over a 10 year planning horizon.
• Chapter 5 – Energy Efficiency Measures describes the process employed to identify and screen energy efficiency measures. This process involves identifying the applicable measures; determining the savings, measure costs, and lifetimes; and conducting an economic screening of the measures.
• Chapter 6 – Energy Efficiency Potential describes the approach taken to develop the technical, economic, and achievable potentials and provides the summary results for each of the potentials.
A series of appendices accompanies this Electric Potential Report. These appendices provide details on specific steps of the analysis and results:
A. Customer Surveys describes the data collection plan and execution
B. Residential Prototype Descriptions provide detailed parameters associated with each residential market segment drawing upon the primary market research; the prototypes then support the running of various models and tools that were used to estimate measure-level savings to support the various potential estimates.
C. Residential Energy Market Profiles provide the saturations and estimated energy use by end use for each of the market segments.
D. Residential Energy-Efficiency Equipment and Measure Data lists all of the equipment and non-equipment measures that were assessed in this study by describing each measure and reporting the associated parameters developed for the potential analysis including the estimated energy savings, equipment cost and lifetimes, and benefit/cost (B/C) ratios resulting from the economic screen.
1 Electric Power Research Institute. “Assessment of Achievable Potential from Energy Efficiency and Demand Response Programs in the U.S.” January 2009. (EPRI Technical Report #1016987).

Volume 2: Electric Potential Report Introduction
1-3
E. Residential Reference Forecast and Potential Results provides links to the detailed results of the reference forecast and energy efficiency potential analysis.
F. Commercial Prototype Descriptions provide detailed parameters associated with each building type in the Commercial and Industrial (C&I) sector drawing upon the primary market research; the prototypes then support the running of various models and tools that were used to estimate measure-level savings to support the various potential estimates.
G. Commercial Energy Market Profiles provide the saturations and estimated energy use by end use for each of the market segments.
H. Commercial and Industrial Energy-Efficiency Equipment and Measure Data lists all of the equipment and non-equipment measures that were assessed in this study by describing each measure and reporting the associated parameters developed for the potential analysis including the estimated energy savings, equipment cost and lifetimes, and B/C ratios resulting from the economic screen.
I. Commercial and Industrial Reference Forecast and Potential Results provides links to the detailed results of the reference forecast and energy efficiency potential analysis.
J. Market and Program Acceptance Factors documents the market acceptance analysis and assumptions along with the actual acceptance rates that reflect the various levels of energy efficiency achievable potential.


2-1
CHAPTER 2
STUDY APPROACH
A depiction of the analysis approach is presented in Figure 2-1. To execute this approach the following steps were taken:
1. Performed a market assessment to describe electricity use for the residential and C&I sectors.
2. Developed a market research and data development plan for the residential and business sectors.
3. Developed base-year energy market profiles and a reference energy forecast.
4. Identified and analyzed energy-efficiency measures appropriate for the Con Edison service area.
5. Estimated energy-efficiency potential.
The steps are described in further detail throughout the remainder of this section.
Figure 2-1 Depiction of Analysis Framework
Customer surveysCustomer dataSecondary data
Codes and standards
Prototypedevelopment
Engineering simulations
(BEST)
Market sizeAppliance/
equipment saturationFuel shares
Technology sharesEfficiency shares
Energy-use intensity
Unit energy consumption
Coincident demand
Base-year EnergyConsumptionby technology,
end use,segment, vintage,
and sector
Data Sources/Analysis
Market Profile Elements
Con Edison dataAEO purchase shares
Market/program acceptance factors
Energy-efficiencymeasure analysis
Forecast Data
Results
ForecastAnnual energy
consumption (GWh)for
Reference forecast,Technical potential,Economic potential,Achievable potential
SavingsAnnual GWh
Coincident peak MW
Study Approach Volume 2: Electric Potential Report
2-2
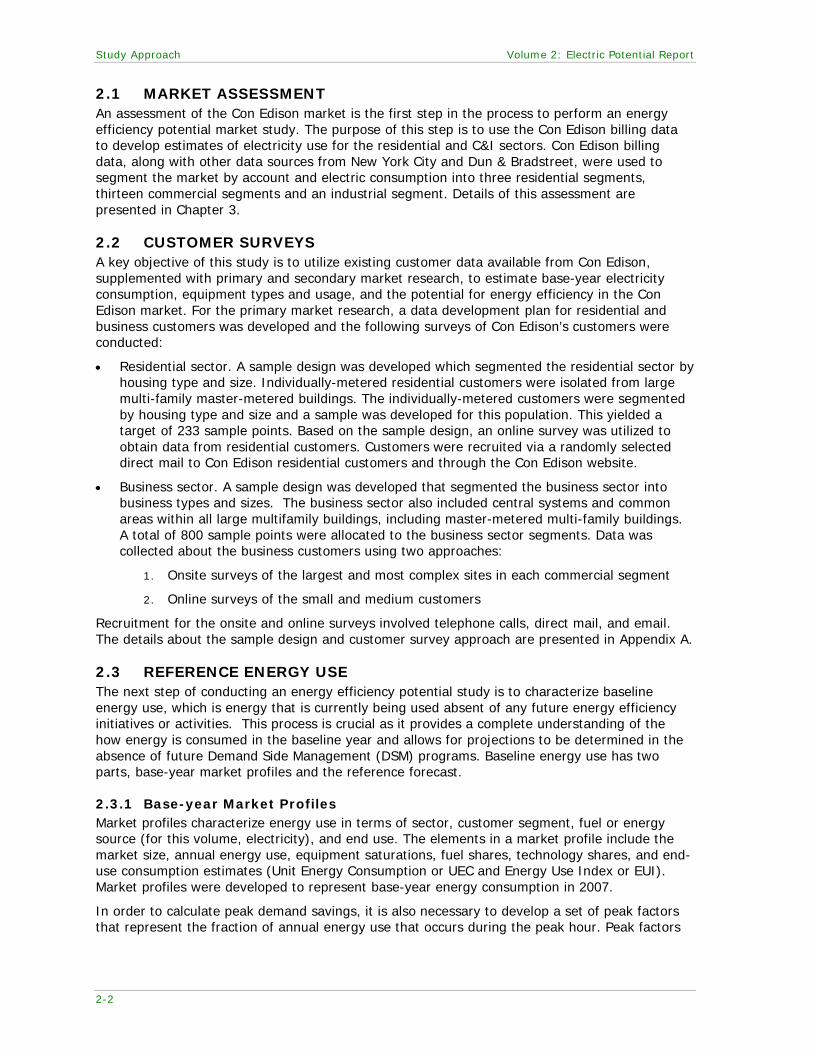
2.1 MARKET ASSESSMENT An assessment of the Con Edison market is the first step in the process to perform an energy efficiency potential market study. The purpose of this step is to use the Con Edison billing data to develop estimates of electricity use for the residential and C&I sectors. Con Edison billing data, along with other data sources from New York City and Dun & Bradstreet, were used to segment the market by account and electric consumption into three residential segments, thirteen commercial segments and an industrial segment. Details of this assessment are presented in Chapter 3.
2.2 CUSTOMER SURVEYS A key objective of this study is to utilize existing customer data available from Con Edison, supplemented with primary and secondary market research, to estimate base-year electricity consumption, equipment types and usage, and the potential for energy efficiency in the Con Edison market. For the primary market research, a data development plan for residential and business customers was developed and the following surveys of Con Edison’s customers were conducted:
• Residential sector. A sample design was developed which segmented the residential sector by housing type and size. Individually-metered residential customers were isolated from large multi-family master-metered buildings. The individually-metered customers were segmented by housing type and size and a sample was developed for this population. This yielded a target of 233 sample points. Based on the sample design, an online survey was utilized to obtain data from residential customers. Customers were recruited via a randomly selected direct mail to Con Edison residential customers and through the Con Edison website.
• Business sector. A sample design was developed that segmented the business sector into business types and sizes. The business sector also included central systems and common areas within all large multifamily buildings, including master-metered multi-family buildings. A total of 800 sample points were allocated to the business sector segments. Data was collected about the business customers using two approaches:
1. Onsite surveys of the largest and most complex sites in each commercial segment
2. Online surveys of the small and medium customers
Recruitment for the onsite and online surveys involved telephone calls, direct mail, and email. The details about the sample design and customer survey approach are presented in Appendix A.
2.3 REFERENCE ENERGY USE The next step of conducting an energy efficiency potential study is to characterize baseline energy use, which is energy that is currently being used absent of any future energy efficiency initiatives or activities. This process is crucial as it provides a complete understanding of the how energy is consumed in the baseline year and allows for projections to be determined in the absence of future Demand Side Management (DSM) programs. Baseline energy use has two parts, base-year market profiles and the reference forecast.
2.3.1 Base-year Market Profiles Market profiles characterize energy use in terms of sector, customer segment, fuel or energy source (for this volume, electricity), and end use. The elements in a market profile include the market size, annual energy use, equipment saturations, fuel shares, technology shares, and end-use consumption estimates (Unit Energy Consumption or UEC and Energy Use Index or EUI). Market profiles were developed to represent base-year energy consumption in 2007.
In order to calculate peak demand savings, it is also necessary to develop a set of peak factors that represent the fraction of annual energy use that occurs during the peak hour. Peak factors

Volume 2: Electric Potential Report Study Approach
2-3
for this study were developed for each sector, customer segment and end use using Global’s EnergyShapeTM database and information from Con Edison about cooling peak data.2
2.3.2 Reference Forecast
Following the development of the base-year market profiles, a reference forecast of annual energy use by customer segment and end use was performed. The reference estimates energy use, given the following:
• Current economic growth forecasts
• Energy price forecasts
• Appliance and equipment standards
• Existing and approved changes to building codes and standards
• The (future) effects of existing utility programs for 2007-2009 offered to Con Edison’s customers by Con Edison, the New York Power Authority and NYSERDA
This forecast is the metric against which savings from energy-efficiency measures are compared. An end-use forecasting approach was used to develop the reference forecast.
2.3.3 Modeling Approach The Load Management Analysis and Planning tool (LoadMAPTM), developed by Global, was utilized to develop the baseline forecast, as well as forecasts representing technical potential, economic potential, and achievable potential. LoadMAP has been used for the EPRI National Potential Study, as well as numerous utility-specific forecasting and potential studies. Built in Excel, the LoadMAP framework is both accessible and transparent and has the following key features.
• Embodies the basic principles of rigorous end-use models (such as EPRI’s REEPS and COMMEND) but in a more simplified, accessible form.
• Includes stock-accounting algorithms which treat older, less efficient appliance/equipment stock separately from newer, more efficient equipment. Equipment is replaced according to the measure life defined by the user.
• To balance the competing needs of simplicity and robustness, the LoadMAP model incorporates important modeling details related to equipment saturations, efficiencies, vintage, and the like, where market data are available, and treats end uses separately to account for varying importance and availability of data resources.
• Isolates new construction from existing equipment and buildings and treats purchase decisions for new construction, replacement upon failure, early replacement, and non-owner acquisition separately.
• Uses a simple logic for appliance and equipment decisions. Other models available for this purpose embody complex decision choice algorithms or diffusion assumptions, and the model parameters tend to be difficult to estimate or observe and sometimes produce anomalous results that require calibration or even overriding. The LoadMAP approach allows the user to drive the appliance and equipment choices year by year directly in the model. This flexible approach allows users to import the results from diffusion models or to input individual assumptions. The framework also facilitates sensitivity analysis.
• Includes appliance and equipment models customized by end use. For example, the logic for lighting equipment is distinct from refrigerators and freezers.
2 The peak factors were used to compute peak demand savings only and they were not used to develop a stand-alone peak-demand forecast.

Study Approach Volume 2: Electric Potential Report
2-4
• Can accommodate various levels of segmentation. Analysis can be performed at the sector level (e.g., total residential) or for customized segments within sectors (e.g., housing type or income level).
The LoadMAP model provides forecasts of reference energy use by sector, segment, end use and technology for existing and new buildings. It also provides forecasts of total energy use and energy-efficiency savings associated with the four types of potential: technical, economic, maximum achievable and realistic achievable. It also provides forecasts of peak-demand savings for each type of potential.3
Table 2-1 summarizes the LoadMAP model inputs required for the reference forecast. These inputs are required for each segment within each sector, as well as for new construction and existing dwellings/buildings.
Finally, because the model is relatively transparent in its operation, it can be used for developing alternative or future scenarios at the same level of detail. Therefore, updates to the reference forecast and various estimates of potential can be accommodated when new or updated information becomes available.
Table 2-1 Data Needs for the Reference Forecast and Potentials Estimation in LoadMAP
Model Inputs Description Key Sources
Base-year data
Market size Base-year residential dwellings and C&I floor space
Con Edison billing data, primary market research
Appliance/equipment saturations
Fraction of dwellings with an appliance/technology; Percent of C&I floor space with equipment/technology
Primary market research, Con Edison appliance saturation survey, secondary data
UEC/EUI for each end-use technology
UEC: Annual electricity use for a technology in dwelling that have the technology; EUI: Annual electricity use per square foot for a technology in floor space that has the technology
Engineering analysis, prototype simulations
Appliance/equipment vintage distribution Age distribution for each technology
Primary market research, secondary data (DEEM, NYSERDA, EIA, EPRI, DEER, etc.)
Efficiency options for each technology
List of available efficiency options and annual energy use for each technology
Prototype simulations, engineering analysis, appliance/equipment standards, secondary data (DEEM, NYSERDA, EIA, EPRI, DEER, etc.)
Peak factors Share of technology energy use that occurs on the peak day
Con Edison data; Global’s EnergyShape database
Forecast data
Customer growth forecasts
Forecasts of new construction in residential and C&I sectors
McGraw-Hill construction data for 6 counties served by Con Edison
Equipment purchase shares for reference forecast
For each equipment/technology, purchase shares for each efficiency level; specified separately for equipment replacement (replace-on-burnout), non-owner acquisition, and new construction
Shipments data, AEO forecast assumptions, appliance/efficiency standards analysis
Electricity prices Forecast of average electricity prices Con Edison price forecast data
Usage elasticities Price elasticities EPRI’s REEPS and COMMEND models; secondary data
The quality of data inputs is critical to the outcome of the LoadMAP modeling process. To ensure the best results, the following course was pursued during the data development process.
3 The model computes a peak-demand forecast for each type of potential for each end use as an intermediate calculation. Peak-demand savings are calculated as the difference between the peak-demand value in the potential forecast (e.g., technical potential) and the peak-demand value in the reference forecast.

Volume 2: Electric Potential Report Study Approach
2-5
1. Surveys of Con Edison customers were conducted to provide information about market size for customer segments, appliance and equipment saturation, appliance and equipment characteristics, fuel shares, building characteristics, customer behavior, operating characteristics, and energy-efficiency actions already taken.
2. Supplement the customer surveys conducted for this study with other sources, including Con Edison’s annual residential appliance saturation survey, billing data, and staff expertise, as well as information from other entities (e.g., NYSERDA and NYC).
3. Incorporate secondary data sources provided by Con Edison to supplement and corroborate the primary research in items 1 and 2 above.
4. Compare and cross-check with regional data obtained as part of the EPRI National Potential Study and other regional sources.
5. Ensure calibration to control totals such as total usage values by segment, available through the billing data.
6. Work with the Con Edison staff and the extended project team4
7. Compare results against other national and regional studies, including the New York statewide studies conducted by Optimal Energy (Optimal Study) in 2003
to vet the data and modeling results against their knowledge and experience.
5 and 20086
2.4 ENERGY-EFFICIENCY MEASURES ANALYSIS
.
The framework for assessing savings, costs and other attributes of energy-efficiency measures involves identifying the list of energy efficiency measures to include in the analysis, fully characterizing each measure, and performing cost-effectiveness screening.
A robust listing of energy efficiency measures was compiled for each customer sector, drawing upon a variety of high quality secondary sources including the following:
• Global’s Database of Energy Efficiency Measures (DEEM). In 2004, Global prepared a database of energy efficiency measures for residential and commercial segments across the U.S. This is analogous to the DEER database developed for California. Global updates the database on a regular basis as it conducts new energy efficiency potential studies.
• EPRI National Potential Study (2009). In 2009, Global conducted an assessment of the national potential for energy efficiency, with estimates derived for the four DOE regions (including the Northeast region which covers New York, Pennsylvania and all of New England).
• Optimal Energy Inc. Achievable Electric Energy Efficiency Potential in New York State (2008)
• TecMarket Works, Inc. NYS Approach for Estimating Energy Savings from Energy Efficiency Programs (Electric and Gas) 2009 (TecMarket Manual).7
In addition, the primary research validated the presence of many of the energy efficiency measures characterized in this study.
The measures identified cover all major types of end-use equipment, as well as devices and actions to reduce energy consumption. Each measure was characterized for typical savings, incremental cost and its service life. Following the measure characterization, an economic screening of each measure was conducted to screen out those energy efficiency measures that were not economic from a societal perspective. The results of the economic screen are then used as the basis for which to develop the economic potential, described in the section that follows. 4 The extended project team includes subcontractors Washington University, Michael’s Engineering and tLync Energy Engineering and Consulting. 5 Energy Efficiency and Renewable Energy Resource Development Potential in New York State (August 2003), Optimal Energy, Inc. 6 Achievable Electric Energy Efficiency Potential in New York State (Draft). November 2008. Optimal Energy, Inc. 7 New York Standard Approach for Estimating Energy Savings from Energy Efficiency Programs. 2009. New York State Department of Public Service.

Study Approach Volume 2: Electric Potential Report
2-6
Further description of analysis of the energy efficiency measures is provided in Chapter 5.
2.5 ASSESSMENT OF ENERGY-EFFICIENCY POTENTIAL A key objective of this study is to estimate the potential for energy savings through energy efficiency activities in the Con Edison electric service territory. The potential impact of energy efficiency activities is the cumulative total of all energy related projects, including the replacement of a unit that has failed or is at the end of its useful life with an efficient unit, retrofit/early replacement of equipment, improvements to the building envelope and other actions resulting in improved energy efficiency, and the application of controls to optimize energy use.
The methodology outlined for this study adheres to the approaches and conventions outlined in the National Action Plan for Energy-Efficiency (NAPEE) Guide for Conducting Potential Studies (November 2007).8
• Technical potential is calculated by applying the most efficient option commercially available to each purchase decision, regardless of cost. It provides the broadest and highest definition of savings potential since it quantifies the savings that would result if all current equipment, processes, and practices in all sectors of the market were replaced by the most efficient type. Technical potential does not take into account the cost-effectiveness of the measures. Further, technical potential is specifically defined as “phase-in technical potential,” which assumes that only the portion of the current stock of equipment that has reached the end of its useful life and is due for turnover is changed out by the most efficient measures available (i.e., replacement). Non-equipment measures, such as controls and other devices (e.g., programmable thermostats) are not adopted all at once but are phased-in over time, just like the equipment measures. Lighting retrofits, which are in effect early replacements of existing lighting systems, are considered a non-equipment measure.
The NAPEE Guide represents the most credible and comprehensive industry practice for specifying energy-efficiency potential. Specifically, four types of potentials were developed as part of this study:
• Economic potential results from the purchase of the most efficient cost-effective option available for a given equipment or non-equipment measure. Cost effectiveness is determined by applying an economic test. In this report, the total resource cost (TRC) test9
• Achievable potential refines the economic potential by taking into account expected program participation, customer preferences, and budget constraints. Two types of achievable potential are evaluated and discussed:
was used to assess the cost-effectiveness of individual measures. Measures that passed the economic screen were then represented in the aggregate for economic potential. As with technical potential, economic potential is a phased-in approach. Economic potential is still a hypothetical upper-boundary of savings potential as it represents only measures that are economic but does not yet consider customer acceptance and other factors.
1. Maximum achievable potential (MAP) establishes the upper-boundary of potential
savings a utility could achieve through its energy efficiency programs. MAP presumes incentives that are sufficient to ensure customer adoption. Oftentimes, incentives take the form of rebates that typically represent a substantial portion of the customer’s extra cost for the energy efficient measures.10
8 National Action Plan for Energy Efficiency (2007). National Action Plan for Energy Efficiency Vision for 2025: Developing a Framework for Change.
These high incentives are combined with
www.epa.gov/eeactionplan. 9 While there are other tests that can be used to represent the economic potential (e.g., Participant or Utility Cost), the TRC is generally seen as the most appropriate representation of economic potential since it tends to be most representative of the net benefits of energy efficiency to society as a whole. The TRC is used in the economic screen as a proxy for moving forward and representing achievable energy efficiency savings potential for those measures that are most widely cost-effective. Finally, the TRC is the cost- effectiveness test currently used by the New York State Public Service Commission for its assessment and review of energy-efficiency programs. 10 Incentive levels linked to MAP are based on industry best practices. The amount varies from measure to measure ranging from 50 to 100% of the incremental cost of the measure.

Volume 2: Electric Potential Report Study Approach
2-7
substantial administrative and marketing costs that are used for broad customer awareness campaigns and sweeping educational opportunities. It also considers a maximum participation rate by customers for the various energy efficiency programs that are designed to deliver the various measures. Market acceptance rates from the EPRI National Potentials Study are applied to this study’s estimates of economic potential to estimate MAP. These estimates of the MAP are closely matched to the energy efficiency potential studies conducted by Optimal in 2003 and 2008. When the results of these studies are presented in Chapter 6, differences are identified and explained.
2. Realistic Achievable Potential (RAP) represents a forecast of potentials resulting from likely customer behavior and penetration rates of efficient technologies. It takes into account existing market, financial, political, and regulatory barriers that are likely to limit the amount of savings that might be achieved through energy efficiency programs. For example, it considers that there are other goals such as low rates and customer equity in the development of final program designs and savings targets. It also considers customer incentive levels that are in line with typical industry practice, defined marketing campaigns, and internal budget constraints. Political barriers often reflect differences in regional attitudes toward energy efficiency and its value as a resource. The RAP also takes into account recent utility experience and reported savings from past and present programs. Because there is a significant degree of uncertainty associated with the participation rates that are embedded in the RAP estimates, the approach taken for this study bounds these experience-based participation rates into upper and lower ranges in order to address the uncertainty.
The LoadMAP model provides a forecast of annual electricity use and peak demand under the four types of potential. The energy and peak-demand savings from energy efficiency measures are calculated as the difference between the values for the reference forecast and the potential forecast.
It should be noted that the future effects of future participants from energy efficiency programs that are currently being implemented by Con Edison and NYSERDA in the Con Edison territory are embedded within the energy efficiency potential forecast in this study.
Results of this assessment are presented in Chapter 6.


3-1
CHAPTER 3 MARKET ASSESSMENT
The first step in this study is to define the scope of coverage associated with this potential study and to characterize the markets associated with that scope. Con Edison defines the scope of this study as the residential, commercial and industrial sectors. To this end, the project team analyzed the various information sources available for this purpose: Con Edison’s customer billing data, the primary market research data, and secondary data. Using that analysis, electricity use estimates were developed for these sectors.
The process begins with an assessment of the actual electricity sales and deliveries for the reference year 2007. Drawing from Con Edison data, the total sendout for 2007 was 58,261 GWh.11 Various adjustments are made to the sendout in order to represent actual 2007 electricity use organized by the sectors that are pertinent to this study (residential, commercial, and industrial). Those adjustments include netting out customer categories that, while having energy efficiency potential of their own, are not typically applicable for energy efficiency measures and programs that are assessed in this type of study (e.g., voucher billing accounts including County of Westchester Public Utility Service Agency, New York City Public Utility Service, Kennedy International Airport Cogeneration, traction accounts, unbilled accounts, streetlighting, and light rail). In 2007 these accounts made up 5,651 GWh.12
The next step in the process is to develop from the bottom-up a parallel estimate of 2007 electricity use. Since the benchmark year of 2007 is historical, the parallel estimate represents actual consumption, rather than weather-adjusted consumption.
Once this adjustment was completed, the modified sendout was 52,610 GWh.
13
Table 3-1 Estimated Sector-Level Electricity Use
Drawing upon various available data sources, population totals associated with these sectors are then determined (number of dwellings for the residential sector and number of square feet for the C&I sectors). These totals are combined with appliance and equipment saturations derived from the primary market research along with estimates of unit-level energy consumption. The result of this process is shown in Table 3-1. The details associated with the sector-level electricity use are described in the sections that follow.
Sector 2007 Electricity Use (GWh)
Residential 15,510 Commercial and Industrial 34,901 Total 50,411
Differences between the modified Con Edison sendout total and the total shown above in Table 3-1 are attributable to precision estimates in the sample design and other factors related to the
11 Con Edison Six-Year Financial and Operating Statistics, 2002 - 2007, Page 16. 12 Con Edison billing data analysis. 13 Note that while the benchmark estimates of electricity use for 2007 are not weather adjusted, the forecast estimates presented in Chapter 4 represent normalized weather conditions since the bottom-up estimates are calibrated relative to the Con Edison volumetric forecasts used for guidance as part of this study.

Market Assessment Volume 2: Electric Potential Report
3-2
primary market data. Appendix A contains a complete description of the sample frame that drives the primary market research efforts associated with this study.
3.1 RESIDENTIAL SECTOR Con Edison’s electric franchise territory consists of six counties: the five New York City boroughs (Bronx, Manhattan, Queens, Brooklyn and Staten Island) and Westchester County. As described above, the residential sector in Con Edison’s service territory used a total of 15,510 GWh14
Table 3-2
in 2007. The total number of residential dwellings is just over 3.2 million dwelling units. Electricity use and number of dwellings by housing type is presented in . Figure 3-1 shows the breakdown of residential electricity use by segment. The data-collection approach is described in detail in Appendix A.
Table 3-2 Residential Sector Electricity Usage and Population Estimates by Building Type
Reported Building Type Annual Electricity Usage
(GWh) in 2007
Population (Number of Dwellings)15
Single Family
4,316 509,107
Small Multi Family 3,604 806,923
Large Multi Family 7,590 1,892,762
Total Residential 15,510 3,208,792
Figure 3-1 Residential Electricity Use by Customer Segment 2007
14 Note that these figures represent all residential dwelling units in the Con Edison service territory, including all multi-family types of units (individually-metered and master-metered). For purposes of sampling and data collection, a portion of the master-metered multi-family buildings was included in the C&I sector to more accurately represent the common areas of multi-family buildings, which are typically more suitable to commercial energy-efficiency programs. 15 Note that the number of dwelling units includes all SC-1 and SC-7 accounts (approximately 2.75 million) plus an estimate as to the number of individual apartment units (approximately 465,000) contained within the SC-8 and SC-12 master-metered accounts.

Volume 2: Electric Potential Report Market Assessment
3-3
3.2 C&I SECTORS As mentioned above, the C&I sectors together used 34,901 GWh in 2007. To develop estimates of energy use by C&I buildings in selected building types, the Con Edison billing data were further analyzed. The billing system maintains information at the account level and for each account there is an indicator of building type. There is also a building identifier which indicates the building to which the account belongs. This information was used to develop a market research plan for the C&I sectors that would provide electricity-use characteristics for buildings in selected building types. The data collection approach is described in detail in Appendix A.
The data collection and survey analysis resulted in estimates of electricity use, floor space, equipment saturations by end use and presence of energy-efficiency measures. The electricity use and floor space estimates are presented in Table 3-3. Figure 3-2 shows the breakdown of C&I electricity use by segment.
Table 3-3 C&I Sector Electricity Usage and Floor Space Estimates by Building Type
Reported Building Type Annual Electricity Usage
(GWh) in 2007 Floor Space
(Square feet) Office – Small 2,362 158,630,781
Office – Large 9,770 492,047,369
Restaurant 2,837 48,827,505
Retail 2,000 128,136,682
Grocery/Supermarket 1,834 31,156,389
Warehouse 1,202 166,241,215
Education 2,567 181,531,987
Hospital 1,965 57,679,015
Nursing Home 1,073 68,641,658
Lodging 796 52,885,517
Entertainment 1,234 118,713,264
Miscellaneous 2,631 151,532,371
Multifamily Residential 2,885 398,888,552
Subtotal Commercial 33,156 2,054,912,305
Industrial 1,745 189,169,291
Total C&I 34,901 2,244,081,596

Market Assessment Volume 2: Electric Potential Report
3-4
Figure 3-2 C&I Electricity Use by Customer Segment 2007
The estimates of floor space were compared closely against three other sources and were deemed to be reliable estimates for the Con Edison marketplace. These three sources are:
• McGraw Hill estimates of floor space for the five boroughs of New York City and Westchester County.16
• The New York City Primary Land Use Tax Lot Output (PLUTO) database provides floor space estimates for New York City based on County Assessor information.
17
• North American Industry Classification System (NAICS) data sources from Dun and Bradstreet.
(Does not include Westchester County)
18
A comparison of these three sources and the final survey estimates is presented in Table 3-4 for a set of building types that would provide the closest in-kind comparison.
16 F.W. Dodge Building Stock. June, 2009. McGraw Hill Construction, Research and Analytics, Bedford, MA. A division of the McGraw Hill Companies. 17 Primary Land Use Tax Lot Output (PLUTO™) data files. City of New York Department of City Planning (DCP). 2007. 18 Market Identification Study performed by Dun & Bradstreet for Con Edison. 1998.

Volume 2: Electric Potential Report Market Assessment
3-5
Table 3-4 Comparison of Floor Stock Estimates (thousand square feet)19
Building Type
Survey Estimates
(2007)
McGraw Hill 2008
PLUTO* 2008
D&B 1998
Offices 650,678 461,996 493,148 567,044
Restaurants 48,828 In retail In retail 23,443
Retail 128,137 215,171 160,094 130,651
Grocery/Supermarket 31,156 In retail In retail 26,982
Warehouses 166,241 154,043 114,413 148,955
Education 181,532 195,290 216,414 54,879
Health 126,321 95,755 107,870 41,356
Hotels/Motels 52,886 47,794 54,497 20,077
Entertainment 118,713 68,613 9,198 64,529
Miscellaneous 151,532 188,692 334,045 95,611
Total Commercial 1,656,024 1,427,354 1,489,679 1,173,527
* PLUTO database is for New York City only, it does not include Westchester County.
19 Note that these floor stock estimates do not include Multi-family Common Area: 398,888,552 square foot estimated from this study.


4-1
CHAPTER 4 REFERENCE FORECAST
Prior to developing estimates of energy-efficiency potential, a reference end-use forecast was prepared to quantify how electricity is used by end use in the base year and what electricity is likely to be in the future in absence of new utility programs. The reference forecast serves as the metric against which energy-efficiency potentials – technical, economic, maximum achievable and realistic achievable – are compared.
4.1 RESIDENTIAL SECTOR Con Edison provides electricity to about 3.2 million dwelling units, representing modified sendout in 2007 of 15,510 GWh, as explained in Chapter 3. The residential segments range from single family dwellings in suburban communities of Westchester to large multi-family public housing projects in the Boroughs of New York City, creating a vast diversity in energy consumption across the residential segment. In multi-family buildings, the individual dwelling units are considered residential, while the common areas and central systems are placed in the commercial sector under multi-family common area due to the types and usage of equipment.
4.1.1 Market Segmentation As described in Chapter 3, the residential sector was divided into three segments that represent the mix of housing types in Con Edison’s territory:
• Single family homes
• Small multi-family residences (2-4 units per building)
• Large multi-family residences (5 or more units per building)
Further distinctions were made to characterize different vintages in the building stock:
• Existing buildings - Buildings constructed more than three years ago with baseline building shell characteristics at existing stock levels for Con Edison territory weather conditions and installed equipment adhering to existing stock efficiency levels. The characterization of existing buildings as three years or older was used because the baseline was created in 2007, but the forecast period started in 2010. Therefore the years between 2007 and 2010 were forecasted considering new construction within those years. While it is recognized that existing buildings in the Con Edison territory are significantly older than three years, this definition was used as a basis to facilitate the building type analysis for this study, including the parametric engineering simulations and prototype models that are described later in this chapter.
• New construction - Building constructed after 2007; installed heating, ventilation and air-conditioning (HVAC) equipment meeting current minimum efficiency standards; baseline building shell characteristics adhering to current known energy codes and construction practices in the Con Edison territory.
In addition, the residential market was segmented by end uses and technologies as shown in Table 4-1. These classifications represent the largest consumers of energy within a home and represent the resolution at which the baseline forecast was developed. As discussed in Chapter 5, dozens of additional measures were considered in the potentials analysis.

Reference Forecast Volume 2: Electric Potential Report
4-2
Table 4-1 Residential End Uses and Technologies
End Use Technology
Cooling20
Central AC
Room AC
Heat Pump
Heating
Electric Resistance
Heat Pump
Furnace
Water heating Water Heater
Interior and Exterior Lighting Linear Fluorescent
Screw in
Appliances
Refrigerator
Second Refrigerator
Freezer
Clothes Washer
Clothes Dryer
Combined Washer - Dryer
Dishwasher
Cooking
Electronics
PC
Color TV
Other Electronics
Miscellaneous
Furnace Fan
Pool Pump
Other Miscellaneous
4.1.2 Prototype Modeling Prototype modeling refers the use of primary and secondary data to create a representative baseline profile for each building type. The prototype approach is often used in energy efficiency potential assessments, particularly when primary data are collected such that representative building parameters such as square footage, vintage, and equipment efficiencies can be accurately portrayed.
Once developed, prototype models are entered into thermal load models which simulate building loads using representative temperature and weather conditions specific to the region for which the study is being conducted. The prototypes are used to benchmark similarly situated market segments and buildings in the region to draw comparisons with recently completed engineering and parametric analysis.
The energy simulation software tool known as “BEST” (Building Energy Simulation Tool) was used for conducting the analysis of baseline energy use and measure-level savings needed for this study. BEST taps into the powerful DOE-2 energy simulation model to generate end-use load shapes. BEST has been tailored to generate 8,760 load shape outputs for representative energy efficiency measures. Once generated, the BEST outputs are used to represent differences in electricity use before and after energy efficiency measures are introduced. These differences form the basis by which the various levels of energy efficiency potential are
20 Cooling measures such as whole house fans, attic fans or room fans are considered in the model as secondary measures that increase the efficiency of the primary cooling measures.

Volume 2: Electric Potential Report Reference Forecast
4-3
estimated. BEST results are represented as unit-level baseline energy consumption and savings (typically kWh/household). These results are then entered into the LoadMAP model for the purpose of characterizing end-use and technology-specific average electricity use per dwelling (kWh/household) over the forecast time horizon – 2010 to 2018 for this study.
For each of the three residential segments in the study, single family, small multifamily, and large multifamily, a prototype model was developed to characterize the energy usage and peak demand for that segment. The results from the prototype modeling fed into the baseline analysis and also served as the basis behind energy efficiency measure characterization and potential assessment.
The prototype approach requires the specification of typical building parameters (such as square footage, base equipment types and efficiencies, and shell levels) for each of the segments and considers the specific weather conditions and standard building construction practices in the area. Each prototype was designed to correspond to a typical building of its type and incorporated the major components affecting energy use in each segment of the residential sector, including the following:
• Air conditioning and ventilation equipment
• Heating equipment
• Lighting
• Refrigeration equipment
• Water heating equipment
• HVAC motors
• Miscellaneous equipment such as office equipment, laundry and cooking appliances
Each prototype was developed to reflect the conditions in Con Edison’s territory in terms of building construction and weather. When appropriate, industry standard assumptions prescribed by ASHRAE and other organizations were used for various parameters, such as air changes per hour. Specific characteristics are as follows:
• Floor area and number of floors
• Lighting and equipment densities
• Operating hours
• HVAC systems and efficiency levels
• Building construction and insulation levels
• Occupancy levels
• Operating controls
The starting point for the prototypes was the Northeast region database from the EPRI National Potentials study. These were modified using the survey data collected in this study.
Once the prototype parameters were defined, the BEST model was used to estimate baseline energy usage by end use for the residential building prototypes. The values produced from BEST served as key inputs for the residential baseline model in two ways:
1. To compare and combine with other data sources to develop base-year energy consumption by end use and technology.
2. Analyze efficiency measures to determine savings impacts.
Appendix B contains detailed descriptions for each prototype utilized in this study.

Reference Forecast Volume 2: Electric Potential Report
4-4
4.1.3 Base-year Market Profiles The formulation of the residential baseline forecast requires definition of base-year energy use and equipment holdings. This objective was achieved by developing a market profile for each segment. Market profiles characterize energy use in terms of sector, customer segment, fuel or energy source (i.e., electricity), and end use. The elements in a market profile include floor stock, equipment saturation by type, efficiency level, annual energy use, and peak demand.
The following parameters are used to create the market profiles:
• Market size represents the number of households in the segment.
• Fuel share embodies the saturation of appliances or equipment and the share of homes using electricity for that use (e.g., homes with electric space heating).
• Unit energy consumption (UEC) describes the amount of electricity consumed by a specific technology in homes that utilize the technology.
• Intensity represents the average use for the technology/end use across all homes. It is the product of fuel share by UEC.
• Total energy use, stated in gigawatt hours (GWh), is the total energy used by a technology/end use in the segment. It is the product of the number of households and intensity.
The market-profile elements were developed primarily from the survey data along with Con Edison saturation study21 data. The profiles were compared against other sources including Northeast regional data from a variety of sources to ensure that results were in line with expectations.22
Key results from the market profile development include a summary of electricity use by end use. Figure 4-1 presents the end-use breakout for the residential sector. Four main end uses – appliances, lighting, cooling, and refrigeration – account for nearly two-thirds of the total usage. Space and water heating have a relatively small piece of the total due to the high saturation of natural gas, steam and fuel oil use in the residential sector. Additional electricity consumption is allocated to electronics (personal computers and color TVs are singled out as technologies within the electronics end use, while all other electronics equipment such as home audio, video game consoles and digital video recorders have been combined in “other electronics”). The remaining energy is classified as the miscellaneous end use. Within this end use, furnace fans and pool pumps are isolated. All other plug loads, including microwaves, toasters, blow dryers and irons are included in other miscellaneous.
Minor adjustments were made, as appropriate, to improve market profiles to reflect the Con Edison territory and marketplace.
Miscellaneous consumption represents 21% of the Con Edison residential electric usage in 2007. For comparison, the EPRI National Potential Study attributed 22% of the residential baseline to miscellaneous, while the USDOE Energy Information Agency’s (EIA) Annual Energy Outlook23
While the devices classified as miscellaneous make up a significant portion of baseline energy usage in the residential sector, their potential as a source of energy efficiency is not quantified in this study due to the difficulty of isolating specific uses within this category. As was the case with lighting, which in the past was classified within miscellaneous, it is expected that some uses will increase and become a separate end use and, therefore, a source of future potential.
(AEO) for 2009 lists 17% of residential electric consumption as “other uses.”
Figure 4-2 presents the end-use shares of total electricity use for each housing type. The relative consumption by cooling is lower for the multi-family segments than for single family homes, while lighting and electronics have a fairly constant share across segments.
21 2008 Residential Customer Research for Con Edison (prepared by Knowledge Networks). 22 These sources were primarily the 2008 EPRI National Potential Study, the 2005 EIA Residential Energy Consumption Survey, the 2005 EIA Commercial Building Energy Consumption Survey, and the American Housing Survey analysis for Con Edison (prepared by GDS Associates). 23 AEO 2009, Updated Reference Case, Supplemental Table 4.

Volume 2: Electric Potential Report Reference Forecast
4-5
A summary of the total residential sector market profile is provided in Table 4-2. Note that the data presented in Table 4-2 represents a composite profile of energy use by end-use across all three segments in the residential sector. Appendix C contains the market profile data that are specific to each of the three market segments in the residential sector (single-family, small multi-family and large multi-family). Across all segments, the average intensity is 4,834 kWh per dwelling. Because the large multi-family segment represents nearly half of the total residential energy use, the average intensity is heavily weighted towards this segment.
Figure 4-1 Residential Electricity Consumption by End Use, 2007
Figure 4-2 Residential End-Use Shares by Market Segment, 2007
Cooling17%
Space Heating2%
Water Heating3%
Lighting19%
Refrigeration20%
Appliances8%
Electronics10%
Miscellaneous21%
Cooling
Space Heating
Water Heating
Lighting
Refrigeration
Appliances
Electronics
Miscellaneous
0%
10%
20%
30%
40%
50%
60%
70%
80%
90%
100%
Single Family Small Multi Family Large Multi Family
Space Heating
Cooling
Water Heating
Lighting
Refrigeration
Electronics
Appliances
Miscellaneous

Reference Forecast Volume 2: Electric Potential Report
4-6
Table 4-2 Residential Sector Market Profile, 2007
End Use Technology
Electric Saturation
(% of dwellings24
UEC (kWh/
) dwelling)
Intensity (kWh/
dwelling)
Total Use (GWh)
Cooling
Central AC 7% 1,033 96 309 Room AC25 79% 884 690 2,214 Heat Pump 2% 1,033 18 56
Space Heating
Electric Resistance 2% 3,869 51 165 Heat Pump 2% 2,128 34 108 Electric Furnace <1% 2,138 10 31
Water Heating Water Heater 4% 2,861 132 422
Interior Lighting Screw-in 100% 786 786 2,523 Linear Fluorescent 7% 24 2 6
Exterior Lighting Screw-in 80% 175 146 470
Appliances
Refrigerator 100% 789 788 2,529 Freezer 10% 888 103 332 Second Refrigerator 5% 1,204 72 233 Clothes Washer 44% 95 46 148 Clothes Dryer 37% 531 220 707 Combined Washer-Dryer <1% 344 1 3 Dishwasher 33% 83 30 95 Cooking 29% 399 115 369
Electronics
Personal Computer 71% 273 193 618 Color TV26 100% 217 217 697 Other Electronics27 100% 81 81 261
Miscellaneous
Pool Pump 4% 1,020 98 315 Furnace Fan28 56% 77 51 163 Other Miscellaneous29 100% 852 852 2,735
Total 4,834 15,510
4.1.4 Reference Forecast Once the base-year market profiles were developed, the next step was to develop a forecast of annual energy use by customer segment and end use. This forecast projects annual energy consumption given the following:
• Current economic growth forecasts 24 Saturation reflects the percent of homes with one or more of each appliance or equipment type. 25 Saturation reflects average between two primary data sources: the primary market research data conducted for this study and room air conditioning saturation data extracted from Con Edison’s 2008 Residential Customer Research conducted by Knowledge Networks, Inc. Further, the UEC reflects that fact that each home has one or more room air conditioners. 26 The primary data reveals that on average more than one color TV is present in each household. The UEC reflects the energy usage associated with more than one color TV. 27 Other electronics includes home audio equipment, digital video recorders, all types of gaming consoles, computing peripherals such as fax machines, telephones, etc. 28 For furnace fans, the saturation reflects the percent of homes heated that use any fuel and have furnace fans. Therefore, the saturation is higher than the sum of the electric space heating saturations. 29 Other miscellaneous includes all plug loads not elsewhere classified. Examples include microwave ovens, electric tea kettles, hair dryers, irons, toasters and air compressors in home workshops,

Volume 2: Electric Potential Report Reference Forecast
4-7
• Electricity price forecasts
• Appliance/equipment standards and building codes already mandated
• Naturally occurring conservation
A reference end-use forecast was developed using the following data elements:
• Base-year market profiles
• Econometric forecast assumptions from Con Edison30
• Northeast Census region forecasts from the EPRI National Potentials Study
• Forecasts of new construction31
• Con Edison price forecast
Table 4-3 presents customer growth forecast by housing type.
Table 4-3 Forecast of Household Growth
Market Segment Number of Households (000) %
Increase (‘10-‘18) 2010 2012 2015 2018
Single Family 511.9 514.4 518.2 522.0 2.0%
Small Multi-family 815.1 822.4 833.7 844.8 3.6%
Large Multi-family 1,938.3 1,979.8 2,042.8 2,105.5 8.6%
Total 3,265.3 3,316.6 3,394.7 3,472.3 6.3%
Various appliance standards have been incorporated into the reference forecast presented in Table 4-4:
• Residential lighting is affected by the passage of the Energy Independence and Security Act (EISA) in 2007, which mandates higher efficiencies for lighting technologies in 2012 and 2013. Several lighting technologies are anticipated to meet this standard when it goes into effect, including Compact Fluorescent Lamps (CFL), White Light-Emitting Diodes (LED), and advanced incandescents currently under development. Old stock is phased out over time starting in 2012.
• In 2006, a new federal standard for central air conditioners went into effect, requiring all newly manufactured air conditioners to meet SEER 13 or better. This standard applies to all types of purchases: replace-on-burnout, new construction and non-owner acquisition.
• Federal efficiency standards have been mandated for various “white-goods” appliances, including refrigerators, clothes washers, and dishwashers. The reference forecast takes into account the most recent refrigeration standards as of 2009.
• The success of the US EPA’s ENERGY STARTM program over the years has led to an increase in ENERGY STAR designated refrigerators, room air conditioners, and other appliances. The trend toward ENERGY STAR appliances is expected to continue throughout the forecast horizon.
• In November 2008, ENERGY STAR 3.0 for color televisions went into effect. This standard sets the rules for becoming energy star qualified. One such criterion is that TVs must not exceed 1 watt of power in standby mode.
30 Forecast assumptions provided by Con Edison. 31 McGraw-Hill Construction Starts Database (2008Q4), provided by Con Edison.

Reference Forecast Volume 2: Electric Potential Report
4-8
Based on Con Edison forecasts,32 saturations for some appliances were assumed to increase modestly during the forecast horizon. These appliances include central air conditioners, room air conditioners, second refrigerators, freezers, color TVs, and PCs. In addition, the saturation of other electronics and other miscellaneous were increased, commensurate with growth included in the Annual Energy Outlook.33
Table 4-4 presents the reference forecast results for each of the segments and the sector total. Over the 8-year horizon, electricity use increases by about 7%. Growth in the large multi-family segment is the highest, with an increase of 12.8%.
Finally, for electric space heating, it was assumed that resistance heating is limited to new construction/major retrofits where space requirements do not allow for the installation of a central system. Rather, heat pumps or gas/oil furnaces/boilers are installed.
Table 4-4 Residential Reference Forecast by Market Segment
Market Segment Electricity Usage (GWh) %
Increase (‘10-‘18) 2010 2012 2015 2018
Single Family 4,525 4,581 4,534 4,606 1.8%
Small Multi-family 3,756 3,789 3,736 3,786 0.8%
Large Multi-family 8,164 8,483 8,745 9,208 12.8%
Total 16,445 16,853 17,015 17,600 7.0%
Figure 4-3 and Table 4-5 present the electricity use baseline forecast at the end-use level for the residential sector and Table 4-6 presents the forecast in terms of electricity use per dwelling. Key observations about this forecast include the following:
• Lighting use decreases by about 40% as a result of the lighting standard signed into law as part of the Energy Independence and Security Act of 2007 (EISA). Under this standard, the efficacy of many general service lamps is required to meet minimum efficiency levels beginning in 2012.
• Cooling electricity use grows slightly between 2010 and 2018. Greater consumption from increasing air conditioning saturation is partially offset by efficiency gains as equipment is replaced.
• Central AC energy use is decreasing over the time horizon. This negative growth reflects the increasing efficiencies of central AC units as a result of the standards. In addition, it is projected that there is greater movement toward heat pumps, which are also a form of central AC. When central AC and heat pump usage is combined, there is an overall increase in consumption.
• Room air conditioners grow in overall consumption as a result if an increasing appliance saturation, but decline in usage per household.
• Growth in electricity use in computers and color TVs is the highest of all specific technologies. Growth in electronics and miscellaneous use is substantial. The trends in these end uses are consistent with the EPRI Study, which utilized the Annual Energy Outlook as its baseline forecast.
These long-term trends generally comport with the assumptions in the Annual Energy Outlook.
32 Con Edison 2008 Residential Model Forecast Assumptions. 33 Energy Information Agency, AEO 2009.

Volume 2: Electric Potential Report Reference Forecast
4-9
Figure 4-3 Residential Reference Forecast by End Use (GWh)
-
2,000
4,000
6,000
8,000
10,000
12,000
14,000
16,000
18,000
20,000
2007 2010 2012 2015 2018
Elec
trici
ty U
se (
GW
h)
Space Heating
Cooling
Water Heating
Lighting
Refrigeration
Electronics
Appliances
Miscellaneous

Reference Forecast Volume 2: Electric Potential Report
4-10
Table 4-5 Residential Reference Forecast by End-Use and Technology
End Use Technology Electricity Usage (GWh) %
Increase ('10-'18) 2010 2012 2015 2018
Cooling
Central AC 312 309 307 300 -4%
Heat Pump 64 79 107 140 119%
Room AC 2,289 2,313 2,380 2,467 8%
Space Heating
Electric Resistance 167 166 166 165 -1%
Electric Furnace 31 31 31 31 0%
Heat Pump 119 142 184 236 98%
Water Heating Water Heater 425 422 420 417 -2%
Interior Lighting Linear Fluorescent 6 6 6 6 0%
Screw-in 2,586 2,478 1,866 1,559 -40%
Exterior Lighting Screw-in 478 456 340 282 -41%
Refrigeration
Refrigerator 2,499 2,481 2,475 2,479 -1%
Second Refrigerator 247 255 270 288 17%
Freezer 357 370 391 415 16%
Appliances
Clothes Dryer 723 731 744 756 5%
Clothes Washer 152 154 156 158 4%
Combined Washer-Dryer 3 3 4 4 33%
Cooking 374 376 378 380 2%
Dishwasher 98 100 103 105 7%
Electronics
Personal Computer
639 663 701 741 16%
Color TV 773 816 877 931 20%
Other Electronics 375 435 527 622 66%
Miscellaneous
Furnace Fan 160 157 155 153 -4%
Other Miscellaneous 3,254 3,597 4,121 4,657 43%
Pool Pump 314 311 309 307 -2%
Total 16,445 16,853 17,015 17,600 7%

Volume 2: Electric Potential Report Reference Forecast
4-11
Table 4-6 Residential Reference Forecast per Dwelling
End Use Technology
Average Electricity Usage per Dwelling (kWh/household)34 %
Increase (’10-’18)
2010 2012 2015 2018
Cooling
Central AC 97 96 96 94 -3%
Heat Pump 20 25 33 44 120%
Room AC 713 721 742 769 8%
Space Heating
Electric Resistance 52 52 52 52 0%
Electric Furnace 10 10 10 10 0%
Heat Pump 37 44 57 74 100%
Water Heating Water Heater 132 132 131 130 -2%
Interior Lighting
Linear Fluorescent 2 2 2 2 0%
Screw-in 806 772 582 486 -40% Exterior Lighting
Screw-in 149 142 106 88 -41%
Refrigeration
Refrigerator 779 773 771 773 -1%
Second Refrigerator 77 80 84 90 17%
Freezer 111 115 122 129 16%
Appliances
Clothes Dryer 225 228 232 236 5%
Clothes Washer 47 48 49 49 4% Combined Washer-Dryer
1 1 1 1 0%
Cooking 117 117 118 118 1%
Dishwasher 31 31 32 33 6%
Electronics
Color TV 241 254 273 290 20%
Other Electronics 117 136 164 194 66%
Personal Computer 199 207 218 231 16%
Miscellaneous
Furnace Fan 50 49 48 48 -4%
Other Miscellaneous 1,014 1,121 1,284 1,451 43%
Pool Pump 98 97 96 96 -2%
Total 5,125 5,252 5,303 5,485 7%
Appendix E contains detailed results of the residential reference forecast, including year-by-year electricity consumption by end-use and technology type.
34 This table presents the forecast of average use per dwelling for the entire residential sector (all three housing types are combined). Market profiles for each segment, as well as the full list of measures that was analyzed for each segment, are presented in Appendix C. The Residential Survey form is in Appendix A.

Reference Forecast Volume 2: Electric Potential Report
4-12
4.2 COMMERCIAL SECTOR The commercial sector accounts for over two-thirds of Con Edison electric consumption, with total sales in 2007 exceeding 33,000 GWh. Total floor space in the commercial sector is over two billion square feet, which implies an average intensity of 16.1 kWh per square foot in 2007.
4.2.1 Market Segmentation As indicated in Chapter 3, the commercial sector was divided into the following thirteen market segments:
• Small Office (less than 50,000 square feet)
• Large Office (50,000 or more square feet)
• Restaurant
• Retail
• Grocery/Supermarket
• Warehouse
• Education
• Hospital
• Nursing Home
• Lodging
• Entertainment
• Miscellaneous
• Residential Multi-Family (MF) Common Area
Further distinctions were made to characterize two vintages in the building stock:
• Existing buildings – Commercial buildings constructed more than three years ago with baseline building shell characteristics at existing stock levels for Con Edison territory weather conditions and installed equipment adhering to existing stock efficiency levels. The characterization of existing buildings as three years or older was used because the baseline was created in 2007, but the forecast period started in 2010. Therefore the years between 2007 and 2010 were forecasted considering new construction within those years. While it is recognized that existing commercial buildings in the Con Edison territory are significantly older than three years, this definition was used as a basis to facilitate the building type analysis for this study, including the parametric engineering simulations and prototype models that are described later in this chapter.
• New construction – Commercial buildings constructed after 2007; reflect cooling, ventilation and heating (HVAC) equipment meeting current ASHRAE efficiency standards; baseline building shell characteristics adhering to current known energy codes and construction practices in the Con Edison service territory.
For each customer segment, electricity usage was segmented by end use and technology as shown in Table 4-7.

Volume 2: Electric Potential Report Reference Forecast
4-13
Table 4-7 Commercial End Uses and Technologies
End-Use Technology
Cooling
Central Chiller
Packaged AC/HP
Packaged Terminal AC
Space Heating Electric Resistance
Heat Pump
Ventilation Ventilation
Water Heating Water Heater
Interior Lighting Interior Lighting
Exterior Lighting Exterior Lighting
Office Equipment
Personal Computer
Server
Monitor
Printer/Copier
Refrigeration Walk-in Refrigeration
Reach-in Refrigeration
Food Service Food Service
Miscellaneous Miscellaneous
Table 4-8 presents estimates of annual electricity use, floor space and intensity by building type. Overall, the commercial sector intensity is in alignment with estimates from other sources, primarily the Commercial Building Energy Consumptions Survey (CBECS) which is conducted periodically by the Energy Information Administration.35
• The Office intensity ranges from 15 to 20 kWh/square foot, which is in alignment with the CBECS intensities.
As with CBECS, the intensity estimates vary considerably by building type. Based on the data, the following observations are made:
• The Grocery/Supermarket segment includes large suburban supermarkets, mid-size grocery stores, “Mom-and-Pop” markets and convenience stores. The survey-based intensity aligns with the CBECS “Food Sales” category and is the highest in both surveys.
• Restaurants have the second-highest intensity in CBECS and in the Con Edison territory. However, the Con Edison estimates are higher than CBECS, which is typical of most utility-specific studies. In the case of Con Edison, the high intensity reflects the prevalence of smaller sit-down and fast-food restaurants in Manhattan which tend to have higher air conditioning loads and higher cooking intensities due to the smaller spaces.
• Education and Retail are among the lower intensity buildings, with intensities ranging from 14 to 16 kWh/square foot.
• Warehouses and Multi-Family Common Areas, as expected, have the lowest intensities at 7.2 kWh/square foot.
35 The Commercial Buildings Energy Consumption Survey (CBECS) is a national sample survey that collects information on the stock of U.S. commercial buildings, their energy-related building characteristics, and their energy consumption and expenditures. The latest survey data and methodology can be found at http://www.eia.doe.gov/emeu/cbecs/.

Reference Forecast Volume 2: Electric Potential Report
4-14
Table 4-8 Commercial Electricity Use by Market Segment, 2007
Market Segment Annual Electricity
Usage (GWh) Floor Space
(Square feet) Intensity
(kWh/sq.ft.) Office – Small 2,362 158,630,781 14.9
Office – Large 9,770 492,047,369 19.9
Restaurant 2,837 48,827,505 58.1
Retail 2,000 128,136,682 15.6
Grocery/Supermarket 1,834 31,156,389 58.9
Warehouse 1,202 166,241,215 7.2
Education 2,567 181,531,987 14.1
Hospital 1,965 57,679,015 34.1
Nursing Home 1,073 68,641,658 15.6
Lodging 796 52,885,517 15.1
Entertainment 1,234 118,713,264 10.4
Miscellaneous 2,631 151,532,371 17.4
Multi-Family Common Area 2,885 398,888,552 7.2
Total 33,156 2,054,912,305 16.1
4.2.2 Prototype Modeling Prototype models were created for each of the 13 commercial building types. The prototype modeling was conducted in the same manner that is described for the residential sector (Section 4.1.2 above). BEST prototypes were developed based on a series of input parameters such as average square footage, number of floors in the building, average age of the building, type of equipment present in the building and the associated efficiency levels of that equipment. The basis for these input parameters was the primary market research that was conducted as part of this study. In effect, the prototypes are a statistically-based, accurate representation of the Con Edison commercial sector. Appendix F contains detailed descriptions for each commercial building prototype utilized in this study.
4.2.3 Base-Year Market Profiles After annual electricity use, floor space and intensities were defined, comprehensive market profiles were developed for each segment. Table 4-9 presents the 2007 market profiles for the commercial sector as a whole. This represents a composite of the thirteen segments. This market profile includes the following:
• Saturations of floor space with each electric end use. For space heating, cooling and water heating, this embodies the electric fuel share. For space heating and cooling, it also embodies the fraction of conditioned space.
• End-use indices (EUI) represent the amount of electricity used per square foot of floor space in buildings where the equipment is present.
• Intensity is the average use across all floor space (computed as the product of saturation and EUI).
• Annual use is the total consumption in 2007 for each end use (computed as the product of the intensity and total commercial-sector square feet).
The EUIs were created through development and analysis of prototype buildings. Analogously to the residential analysis, these prototypes were developed using the BEST model, a DOE-2 simulation interface. EUIs were developed by applying New York area weather and incorporating

Volume 2: Electric Potential Report Reference Forecast
4-15
information obtained through primary market research with existing information regarding state codes and regional construction practices.
Table 4-9 Commercial Sector Market Profile, 2007
End Use Technology
Electric Saturation
(% of floor
space)
EUI (kWh/ sq.ft.)
Intensity (kWh/ sq.ft.)
Annual Use
(GWh)
Cooling
Central Chiller 20% 4.19 0.85 1,754
Packaged Terminal AC 8% 3.05 0.24 495
Packaged AC/HP 41% 4.21 1.74 3,573
Space Heating
Electric Resistance 2% 3.15 0.05 110
Heat Pump 1% 1.29 0.01 21
Electric Boiler 7% 6.62 0.46 949
Electric Furnace 2% 3.30 0.05 113
Ventilation Ventilation 100% 2.45 2.45 5,042
Auxiliary Pumps/fans 20% 1.39 0.28 581
Water Heating Water Heater 26% 0.60 0.16 324
Refrigeration Reach-in Refrigeration 18% 1.56 0.29 591
Walk-in Refrigeration 10% 9.77 0.94 1,940
Food Service Food Service 18% 2.34 0.42 863
Interior Lighting Indoor Fluorescent 100% 3.69 3.69 7,588
Indoor Screw-in 100% 0.44 0.44 905
Exterior Lighting Outdoor Fluorescent 100% 0.37 0.37 767
Outdoor Screw-in 100% 0.55 0.55 1,139
Office Equipment
Personal Computer 89% 0.35 0.31 639
Server 48% 0.24 0.12 242
Monitor 89% 0.40 0.35 724
Printer/Copier 90% 0.10 0.09 184
Other Office Equipment 100% 0.36 0.36 740
Miscellaneous Miscellaneous 100% 1.89 1.89 3,874
Total 16.14 33,156
The breakdown of annual electricity use by end use is shown in Figure 4-4. Lighting (indoor and outdoor) is the largest single end use in the commercial sector, accounting for 32% of total usage. Cooling is second (17%), followed by ventilation (15%). The other end-uses account for the remaining 36% of electric consumption.
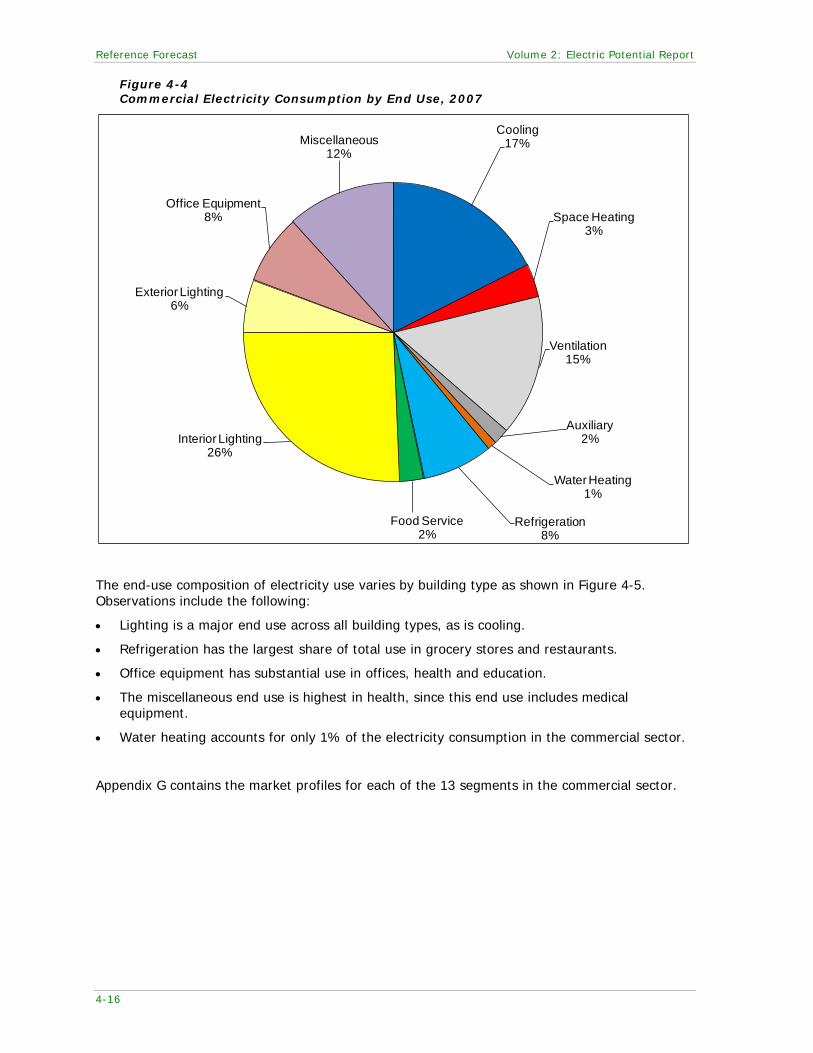
Reference Forecast Volume 2: Electric Potential Report
4-16
Figure 4-4 Commercial Electricity Consumption by End Use, 2007
The end-use composition of electricity use varies by building type as shown in Figure 4-5. Observations include the following:
• Lighting is a major end use across all building types, as is cooling.
• Refrigeration has the largest share of total use in grocery stores and restaurants.
• Office equipment has substantial use in offices, health and education.
• The miscellaneous end use is highest in health, since this end use includes medical equipment.
• Water heating accounts for only 1% of the electricity consumption in the commercial sector.
Appendix G contains the market profiles for each of the 13 segments in the commercial sector.
Cooling17%
Space Heating3%
Ventilation15%
Auxiliary2%
Water Heating1%
Refrigeration8%
Food Service2%
Interior Lighting26%
Exterior Lighting6%
Office Equipment8%
Miscellaneous12%

Volume 2: Electric Potential Report Reference Forecast
4-17
Figure 4-5 Commercial End-use Shares by Market Segment, 2007
4.2.4 Reference Forecast The commercial reference forecast was developed using the same approach and similar data sources as those used for the residential sector. The floor-stock forecasts were based on a forecast of building construction data36. Table 4-10 presents the forecast of floor stock by building type for each of the Con Edison commercial segments. The growth rates in the building construction data were applied to the base-year floor stock estimates presented above. Changes in purchase decisions and usage behavior were modeled based on primary market research, the Annual Energy Outlook and Con Edison’s retail price forecast for the commercial sector.37
Table 4-11 presents the reference forecast results for each of the thirteen commercial segments. While the total consumption increases by 7% over the forecast horizon, there is significant variation over the building types:
• Offices drive the total, representing over one-third of the base-year consumption.
• Education and Miscellaneous experience the fastest growth, with increases of 15% and 25% over 8 years, respectively. This reflects growth trends in the floorstock estimates for these segments, as projected by McGraw-Hill. The miscellaneous market segment is represented by gas stations, law enforcement facilities, postal facilities, telecommunication facilities, certain types of public transit and port authority facilities, and all other buildings not classified in the other market segments.
• Slight decline in the Hospital and Nursing home segments. 36 McGraw-Hill Construction Starts Database (2008Q4), provided by Con Edison. 37 The floor stock estimate for the multi-family common area market segment in 2007 was estimated through further analysis. The figure in Table 3-11 represents the floor area for all multi-family common area accounts, including SC8 and SC12 account classifications.
- 10 20 30 40 50 60 70
Multi-Family Common Area
Miscellaneous
Entertainment
Lodging
Nursing Home
Hospital
Education
Warehouse
Grocery/Supermarket
Retail
Restaurant
Large Office
Small Office
Intensity (kWh/Square Foot)
MiscellaneousOffice EquipmentExterior LightingInterior LightingFood ServiceRefrigerationWater HeatingAuxiliaryVentilationSpace HeatingCooling

Reference Forecast Volume 2: Electric Potential Report
4-18
• Grocery/Supermarket use declines slightly as a result of naturally-occurring improvements in refrigeration efficiency, which takes place as equipment is replaced and in new construction. These improvements outweigh the effects of customer growth because refrigeration represents half of Grocery/Supermarket usage.
Table 4-10 Commercial Floor Stock Forecast by Market Segment
Market Segment Million Square Feet %
Increase (‘10-‘18) 2010 2012 2015 2018
Small Office 162.1 168.1 177.6 184.2 14%
Large Office 502.7 521.3 550.9 571.5 14%
Restaurant 52.4 53.9 56.1 59.2 13%
Retail 135.6 138.8 143.5 149.8 10%
Grocery/Supermarket 32.3 32.8 33.5 34.4 7%
Warehouse 172.9 180.0 190.5 199.6 15%
Education 200.5 209.7 224.2 240.9 20%
Hospital 59.4 60.0 60.8 62.0 4%
Nursing Home 70.7 71.4 72.4 73.8 4%
Lodging 57.1 58.3 60.3 63.4 11%
Entertainment 122.5 124.2 126.5 129.6 6%
Miscellaneous 166.9 180.6 200.6 221.2 33%
MF Common Area 406.8 409.7 413.8 420.0 3%
Total 2,141.7 2,208.7 2,310.7 2,409.7 13%
Table 4-11 Commercial Reference Forecast by Market Segment
Market Segment Electricity Usage (GWh) %
Increase (‘10-‘18) 2010 2012 2015 2018
Small Office 2,428 2,482 2,573 2,625 8.1%
Large Office 10,014 10,235 10,618 10,841 8.3%
Restaurant 3,024 3,059 3,113 3,213 6.3%
Retail 2,125 2,139 2,148 2,178 2.5%
Grocery/Supermarket 1,864 1,844 1,822 1,823 -2.2%
Warehouse 1,253 1,283 1,329 1,367 9.1%
Education 2,839 2,928 3,075 3,254 14.6%
Hospital 2,028 2,023 2,014 2,016 -0.6%
Nursing Home 1,110 1,107 1,104 1,108 -0.1%
Lodging 857 861 872 895 4.4%
Entertainment 1,281 1,282 1,280 1,286 0.4%
Miscellaneous 2,889 3,071 3,333 3,600 24.6%
MF Common Area 2,963 2,946 2,919 2,903 -2.0%
Total 34,674 35,259 36,199 37,109 7.0%
The reference forecast by end use is displayed graphically in Figure 4-6, and in tabular form in Table 4-12. Observations include the following:
• EISA 2007 reduces indoor consumption for screw-in lighting, resulting in a decrease of 10% over the forecast horizon, while fluorescent lighting increases by 10%.

Volume 2: Electric Potential Report Reference Forecast
4-19
• Cooling increases as virtually all new construction incorporates air conditioning. These gains are partially offset by naturally-occurring improvements in equipment efficiency.
• Refrigeration grows modestly, reflecting naturally-occurring efficiency improvements.
• Office equipment rises due to increased computation loads.
Figure 4-6 Commercial Reference Forecast by End Use

Reference Forecast Volume 2: Electric Potential Report
4-20
Table 4-12 Commercial Reference Forecast by End Use and Technology
End Use Technology Electricity Usage (GWh) %
Increase ('10-'18) 2010 2012 2015 2018
Space Heating
Electric Resistance
120 122 125 129 8%
Heat Pump 20 20 20 20 -1%
Electric Boiler 992 1,007 1,054 1,106 12%
Electric Furnace 119 123 128 131 10%
Cooling
Central Chiller 1,762 1,781 1,837 1,899 8%
Pkg Terminal AC 494 502 520 537 9%
Pkg AC/HP 3,669 3,708 3,802 3,894 6%
Ventilation Ventilation 5,193 5,254 5,336 5,424 4%
Auxiliary Pumps/fans 601 611 629 642 7%
Water Heating Water Heater 341 346 355 364 7%
Refrigeration
Reach-in Refrigeration
603 602 605 618 3%
Walk-in Refrigeration
1,988 1,985 1,999 2,044 3%
Food Service Food Service 929 953 990 1,035 11%
Interior Lighting
Indoor Fluorescent 8,100 8,294 8,610 8,895 10%
Indoor Screw-in 973 969 924 871 -10%
Exterior Lighting
Outdoor Fluorescent 824 843 875 907 10%
Outdoor Screw-in 1,223 1,230 1,188 1,128 -8%
Office Equipment
Personal Computer
665 685 718 742 12%
Server 252 260 273 282 12%
Monitor 753 776 813 840 12%
Other Office Equipment 770 793 831 859 11%
Printer/Copier 192 198 207 214 12%
Miscellaneous Miscellaneous 4,092 4,198 4,361 4,527 11%
Total 34,674 35,259 36,199 37,109 7%
Appendix I contains detailed results of the commercial reference forecast, including year-by-year electricity consumption by end-use and technology type.

Volume 2: Electric Potential Report Reference Forecast
4-21
4.3 INDUSTRIAL SECTOR The industrial sector used 1,745 GWh of electricity in 2007, which accounts for only 3% of Con Edison’s of the total electricity usage. Industrial consumption is divided into end uses and technologies, as outlined in Table 4-13.
Table 4-13 Industrial End Uses and Technologies
End-Use Technology
Space Heating
Heat Pump
Electric Resistance
Electric Furnace
Electric Boiler
Cooling
Central Chiller
Packaged AC/HP
Packaged Terminal AC
Ventilation Ventilation
Process
Process Cooling/Refrigeration
Process Heating
Electrochemical Process
Interior Lighting Indoor Screw-in
Indoor Fluorescent
Exterior Lighting Outdoor Screw-in
Outdoor Fluorescent
Machine Drive
Less than 5 HP
5-24 HP
25-99 HP
100-249 HP
250-499 HP
500 or more HP
Other Other Uses
Table 4-14 presents the industrial sector market profile. The largest end use category is machine drives, followed by industrial process. These end uses are represented in Figure 4-7 below as 80% of industrial electricity consumption. While lighting and HVAC comprise a smaller portion of the industrial load, these applications consumed 282 GWh, or 16% of the industrial electric consumption in 2007.
Table 4-15 presents the forecast of floor stock for the Con Edison industrial sector. The growth rate in the building construction data was applied to the base-year floor stock estimate for the industrial sector presented in Chapter 3. As illustrated in the McGraw Hill construction forecast for the industrial sector in Con Edison territory, the sector is expected to experience very little growth over the foreseeable future. The reference forecast for the industrial sector reflects the fact that energy usage for this segment is slightly decreasing at 1.1% between 2010 and 2018. Growth across the various end uses (except for screw-in lighting) tracks the overall growth rate for the sector, as shown in Table 4-16. The lighting reductions represent the phase-in of the EISA lighting standards, and are consistent with how this end-use evolves in the commercial sector.

Reference Forecast Volume 2: Electric Potential Report
4-22
Table 4-14 Industrial Sector Market Profile, 2007
End Use Technology
Electric Saturation
(% of floor
space)
EUI (kWh/ sq.ft.)
Intensity (kWh/ sq.ft.)
Annual Use
(GWh)
Space Heating
Electric Resistance 2% 3.21 0.1 14
Electric Furnace 1% 2.46 0.0 5
Electric Boiler 0% 2.46 0.0 1
Cooling
Central Chiller 3% 1.69 0.0 9
Packaged AC/HP 24% 1.69 0.4 76
Packaged Terminal AC 4% 1.31 0.0 9
Ventilation Ventilation 100% 0.16 0.2 30
Process
Process Cooling/Refrigeration
2% 27.03 0.7 123
Process Heating 26% 4.93 1.3 244
Electrochemical Process 3% 26.01 0.7 127
Interior Lighting Indoor Screw-in 100% 0.22 0.2 42
Indoor Fluorescent 100% 0.49 0.5 92
Exterior Lighting Outdoor Screw-in 100% 0.01 0.0 3
Outdoor Fluorescent 100% 0.00 0.0 1
Machine Drive
Less than 5 HP 90% 0.95 0.9 162
5-24 HP 80% 1.21 1.0 184
25-99 HP 72% 1.47 1.1 201
100-249 HP 65% 1.53 1.0 189
250-499 HP 24% 1.70 0.4 76
500 or more HP 26% 1.79 0.5 88
Other Other Uses 100% 0.36 0.4 68
Total 9.22 1,745

Volume 2: Electric Potential Report Reference Forecast
4-23
Figure 4-7 Industrial Electricity Consumption by End Use, 2007
Table 4-15 Industrial Floor Stock Forecast
Market Segment
Million Square Feet Change 2007-18 2010 2012 2015 2018
Industrial 190.3 190.9 191.6 192.4 1.1%
Space Heating1%
Cooling5%Ventilation
2%
Process28%
Lighting8%
Machine Drive52%
Other4%

Reference Forecast Volume 2: Electric Potential Report
4-24
Table 4-16 Industrial Reference Forecast by End Use and Technology
End Use Technology Electricity Usage (GWh) %
Increase ('10-'18) 2010 2012 2015 2018
Space Heat
Electric Resistance 14 14 14 14 0%
Electric Furnace 6 6 6 6 0%
Electric Boiler 1 1 1 1 0%
Cooling
Central Chiller 9 9 9 9 0%
Packaged AC/HP 79 79 78 78 -1% Packaged Terminal AC
9 9 9 9 0%
Ventilation Ventilation 31 31 30 30 -3%
Process
Process Cool/Refrig. 127 127 126 126 -1%
Process Heating 253 252 251 250 -1% Electrochemical Process
131 131 131 130 -1%
Interior Lighting
Indoor Fluorescent 95 95 95 94 -1%
Indoor Screw-in 44 43 40 36 -18%
Exterior Lighting
Outdoor Fluorescent 1 1 1 1 0%
Outdoor Screw-in 3 3 3 2 -33%
Machine Drive
Less than 5 HP 168 167 167 166 -1%
5-24 HP 190 190 189 188 -1%
25-99 HP 208 207 207 206 -1%
100-249 HP 196 195 194 194 -1%
250-499 HP 79 79 78 78 -1%
500 or more HP 91 91 91 90 -1%
Other Other Uses 69 69 69 70 1%
Total 1,804 1,797 1,789 1,780 -1%

Volume 2: Electric Potential Report Reference Forecast
4-25
4.4 REFERENCE FORECAST SUMMARY Table 4-17 provides an overall summary of the reference forecast by sector and for the Con Edison system as a whole. As described above, this reference forecast was developed entirely based on primary market research data representing Con Edison’s customer characteristics and derived through the prototype modeling approach, coupled with the customer growth forecasts for the Con Edison territory.
Table 4-17 Reference Forecast Summary
Sector Electricity Usage (GWh) %
Increase (’10-’18) 2010 2012 2015 2018
Residential 16,445 16,853 17,015 17,600 7.0%
Commercial 34,674 35,259 36,199 37,109 7.0%
Industrial 1,804 1,797 1,789 1,780 -1.3%
Total 52,923 53,909 55,003 56,489 6.7%
The reference forecast reveals that electric loads overall are projected to grow 7% between the period 2010 to 2018. As a point of comparison, the reference forecast was reviewed relative to Con Edison’s March 2009 baseline forecast. That forecast reveals a 9% growth rate in a comparable period 2010-2015.38
The two C&I forecasts are roughly in alignment. However, there are differences between the two residential forecasts that are attributable to the following factors:
When separating out each of the segments, the Con Edison forecast shows 2010 to 2015 growth rates of 5% for C&I and 12% for residential.
• The effects of EISA lighting standards: The reference forecast takes into account that these standards will begin to take effect in 2012. Beyond that time period, the more efficient lighting products that are prescribed under the legislation will become part of customer base usage.
• The effects of other building codes and appliance efficiency standards: The reference forecast takes into account naturally-occurring efficiencies associated with codes and standards.
Both of these effects are reflected in the estimates of unit energy consumption (UECs and EUIs) represented in this chapter. The Con Edison March 2009 baseline forecast did not reflect the effects of the EISA lighting standards or other codes and standards expected to influence the forecast.
38 Con Edison Volumetric Forecast, March 2009, which only forecasts electricity sales through 2015.


5-1
CHAPTER 5
ENERGY EFFICIENCY MEASURES
This section describes the framework used to assess the savings, costs, and other attributes of energy efficiency measures. These results are needed to support measure-level cost-effectiveness analyses as well as measure-level impacts. For all measures, information was assembled to reflect equipment performance, incremental costs, and equipment lifetimes. This information, along with the avoided costs, was employed in the economic screen to determine economically feasible measures. The framework that was followed is outlined in Figure 5-1.
Figure 5-1 Approach for Measure Assessment
The analytical framework for developing the measure savings assessment for all sectors closely follows the frameworks described for the baseline development. The BEST model was used to simulate energy usage assuming that the various energy-efficiency measures are installed in the building. These so-called “change cases” are then compared relative to the baseline prototypes to determine the amount of savings. For the energy efficiency measures, these change cases reflected increasing levels of energy efficiency escalating to maximum efficiency levels.

Energy Efficiency Measures Volume 2: Electric Potential Report
5-2
5.1 LIST OF ENERGY EFFICIENCY MEASURES The first step of the energy efficiency measure analysis is to identify the list of all relevant energy-efficiency measures that could be considered as part of the Con Edison energy efficiency potential assessment. Several sources of information were consulted to develop the list for this study, including the primary market research conducted as part of this study, the EPRI National Potential Study, the California DEER database, the DEEM database, and the Optimal Studies.
All measures are categorized into one of two types for calculation of energy savings: equipment measures and non-equipment measures.
The key differences between the equipment and non-equipment measures are as follows:
• Equipment Measures, or efficient energy-consuming equipment, save energy by providing the same service with a lower energy requirement. An example of an equipment measure is the replacement of a standard efficiency refrigerator with an Energy Star model. For equipment measures, many efficiency levels are available for a specific technology that range from the baseline unit (determined by code or standard) up to the most efficient product commercially available. For instance, in the case of central air conditioners, this list begins with the federal standard SEER 13 unit and spans a broad spectrum of efficiency, with the highest efficiency level represented by a ductless mini-split system with variable refrigerant flow (at SEER levels of 18 or greater).
• Non-Equipment Measures save energy by reducing the need for delivered energy but do not involve replacement or purchase of major end-use equipment (such as a refrigerator or air conditioner). An example of this group of measures would be a programmable thermostat that is pre-set, for example, to run the air conditioner only when people are home. Non-equipment measures fall into one of the following categories:
1. Building shell (windows, insulation, roofing material)
2. Equipment controls (thermostat, occupancy sensors)
3. Equipment maintenance (cleaning filters, changing setpoints)
4. Whole building design (natural ventilation, passive solar lighting)
5. Lighting retrofits (included as non-equipment because they are performed prior to the equipment’s normal end of life)
6. Displacement measures (ceiling fan instead of central air conditioner)
Non-equipment measures can apply to more than one end use. For example, insulation levels will affect both space heating and cooling energy consumption.
5.1.1 Residential Measures The residential measures span all end uses and vary significantly in the manner in which they impact energy consumption. Table 5-1 presents a summary of the measures. All residential measures considered for this study are described in Appendix D.

Volume 2: Electric Potential Report Energy Efficiency Measures
5-3
Table 5-1 Summary of Residential Energy-Efficiency Measures
Cooling Interior Lighting
Central AC, Room AC and Heat Pumps Advanced Incandescent Lamps
AC Maintenance Compact Fluorescent Lamps (CFLs)
Attic Fans and Ceiling Fans High Intensity Discharge Lamps (HID)
Ceiling Insulation LED Lamps
Dehumidifier Occupancy Sensor
Duct Insulation Lighting Timer
Duct Repair Exterior Lighting
External Shades Advanced Incandescent Lamps
Foundation Insulation Compact Fluorescent Lamps (CFLs)
High-efficiency Windows High Intensity Discharge Lamps (HID)
Infiltration Control Efficient Linear Fluorescent Lamps (T8, T5)
Programmable Thermostat LED Lamps
Radiant Barrier Motion Detectors, Photosensors and Timers
Reflective Roof Appliances
Storm Doors Energy Star Refrigerators
Wall Insulation Advanced Energy Star Refrigerators
Whole-House Fan Multiple Drawer Refrigerators
Space Heating Energy Star Freezer
High-efficiency Heat Pumps Compact Freezer
Ceiling Insulation Energy Star Dishwasher
Duct Insulation and Duct Repair Horizontal Axis Clothes Washer
Foundation Insulation Inverter-drive Clothes Washer
High Efficiency Windows Combo Washer/Dryer
HP Maintenance Moisture Sensor Clothes Dryer
Infiltration Control Heat Pump Clothes Dryer
Programmable Thermostat Efficient Oven and Range
Storm Doors Electronics
Wall Insulation Energy Star Color TV
Water Heating Energy Star PC
High-efficiency Water Heaters ClimateSavers PC
Heat Pump Water Heaters Efficient Home Electronics
Solar Water Heating SmartPlug
Geothermal HP Desuperheater Reduce Standby Wattage
Drainwater Heat Recovery Miscellaneous
Faucet Aerators High-Efficiency Furnace Fan
Low-Flow Showerheads High-Efficiency Pool Pumps
Pipe Insulation Pool Pump Timer
5.1.2 C&I Measures Table 5-2 and Table 5-3 present a summary of the commercial and industrial measures, respectively. All commercial and industrial measures considered for this study are described in Appendix H.

Energy Efficiency Measures Volume 2: Electric Potential Report
5-4
Table 5-2 Summary of Commercial Energy-Efficiency Measures
Cooling Interior Lighting
High-efficiency central cooling systems Compact Fluorescent Lamps (CFLs)
High-efficiency packaged units High Intensity Discharge Lamps (HID)
High-efficiency PTAC units Efficient Linear Fluorescent Lamps (T8, T5)
Energy Management System LED Lamps
Dual Enthalpy Economizer Advanced Incandescent Lamps
VSD on Water Pumps Lighting Retrofit
Advanced Design (New Construction) De-lamp
Water Temperature Reset Advanced Design (New Construction)
Programmable Thermostat Daylighting Controls
Duct Testing and Sealing Occupancy Sensors
External Shades Lighting Timers
Duct Insulation Task Lighting
Efficient Windows LED Exit Lighting
Roof Insulation Exterior Lighting
Wall Insulation Lighting Timers
Cool Roof Solar PV Outdoor Lighting
HVAC Retro-commissioning LED Lamps
Refrigeration Space Heating
Anti-Sweat Heater Controls Duct Testing and Sealing
Floating head Pressure Controls Energy Management System
Glass Doors Dual Enthalpy Economizer
High-efficiency Icemakers Programmable Thermostat
Miscellaneous Advanced Design (New Construction)
Vending Miser Duct Insulation
Efficient Escalators HVAC Retro-commissioning
Efficient Elevators Efficient Windows
Water Heating Roof Insulation
High-efficiency Water Heaters Wall Insulation
Geothermal HP Desuperheater Food Service
Ventilation Energy Star Kitchen Equipment
VSD on Fans Kitchen Schedule and Maintenance

Volume 2: Electric Potential Report Energy Efficiency Measures
5-5
Table 5-3 Summary of Industrial Energy-Efficiency Measures
Process Heating Lighting
Efficient Radio Frequency Heating Applications Compact Fluorescent Lamps (CFLs)
Optimized Electric Resistance Heating High Intensity Discharge Lamps (HID)
Motors and Drives Efficient Linear Fluorescent Lamps (T8, T5)
High-efficiency Motors HVAC
Variable-Speed Drives High-efficiency HVAC equipment
HVAC Retro-commissioning and Maintenance
Programmable Thermostat
5.2 MEASURE CHARACTERISTICS For each measure permutation considered, the following data categories were considered as part of the measure characterization:
• Energy Impacts: The energy-savings impacts represent the annual reduction in consumption (kWh of electricity) attributable to each specific measure. For the residential and commercial sectors, the BEST simulation model was used to determine the savings impacts. The key advantage of utilizing BEST is that interactive effects between HVAC measures and other measures such as lighting and building construction are captured and quantified. A key benefit of the prototype modeling is that it combines the primary market data with New York specific weather conditions in order to derive savings. In this case Typical Meteorological Year (TMY) weather data was used from LaGuardia airport in New York City. For the industrial sector, secondary data resources such as the EPRI National Potential Study and DEEM were used to develop assessments of savings at the end use level.
• Peak Demand Impacts: Savings during the peak demand periods are specified for each measure. These impacts relate to the energy savings and depend on each measure’s “coincidence” with the system peak. To accurately express the peak impacts of the energy efficiency measures considered, a combined approach of prototype simulation (BEST model) and review of secondary sources such as the Optimal Study (2003) was used.
• Full Costs: The measure characterization includes the full cost of the measure on a per-unit or per-square-foot basis for the residential and commercial sectors, respectively. These costs were developed specifically for the Con Edison territory. The process by which the cost data were developed is summarized in the section below.
• Incremental Costs: The cost difference between standard efficiency measures and equipment and the high-efficiency measures and equipment. These costs were developed specifically for the Con Edison territory. The process by which the cost data were developed is summarized in the section below.
• Applicability: This factor is an estimate of the percentage of the high efficiency measures (percent of either dwellings in the residential sector or square feet in the C&I sectors) where it is technically feasible for the specific measure to actually be implemented. These figures are based on an analysis and interpretation of several sources including the primary market data and secondary data sources such as California’s DEER database, DEEM, and others.
• Measure Lifetimes. These estimates were derived from the technical data and secondary data sources that support the measure demand and energy savings analysis. The initial values were obtained from the TecMarket Manual, with refinements based reviews of the Optimal Study (2008), California’s DEER database, and DEEM.

Energy Efficiency Measures Volume 2: Electric Potential Report
5-6
5.2.1 Measure Cost Data Development There are two elements of the energy-efficiency measure cost data development. Each element incorporates a different set of reference material. The first task is to estimate a baseline cost of installing the unit, including both material and labor costs associated with the installation. These baseline costs draw upon national construction cost averages, adjusted for New York City conditions. The second component is the incremental cost of installing more efficient equipment. Because official cost estimates from the contractor community typically ignore efficiency level as a potential option, the data for incremental cost comes from a different set of references. Principle among these is the DEER database, incorporating the results of a cost estimate survey more comprehensive than the scope of the current research. Again, to the extent that secondary data sources, adjustments were made to the extent possible to represent those costs based on New York City conditions.
The following references were used to develop the full costs:
• RS Means Facilities Maintenance and Repair Cost Data
• RS Means Mechanical Construction Costs
• RS Means Building Construction Cost Data
• DEER – California Database for Energy Efficient Resources
The following references were used to develop the incremental costs:
• USGBC - LEED New Construction & Major Renovation (2008)
• RS Means Green Buildings Project Planning & Cost Estimating Second Edition (2008)
• Grainger Catalog Volume 398, (2007-2008)
• DEER – California Database for Energy Efficient Resources
5.2.2 Representative Measure Data Inputs Tables 5-4 and 5-5 present samples of the detailed data inputs behind equipment and non-equipment measures, respectively, for the case of residential central air conditioners in single-family homes. Table 5-4 displays the various efficiency levels available as equipment measures, as well as the corresponding useful life metrics, usage and incremental cost estimates. These values all contribute to the outcome of the stock accounting model, in which the purchase of an above-standard unit is first analyzed for cost effectiveness (comparing incremental cost to lifetime benefits) and then, for the levels that pass the screen, incorporated into the new units purchased.
Table 5-4 Sample Equipment Measures for Central Air Conditioning – Single Family Home
Efficiency Level Useful Life Incremental
Savings (kWh/yr)39Incremental
Equipment Cost SEER 13 18 - -
SEER 14 18 138.06 $492.85 SEER 15 18 190.18 $985.70 SEER 16 18 234.02 $1,478.54 SEER 18 18 303.74 $2,464.18 SEER 20 18 318.72 $3,449.82 Ductless VRF 18 499.52 $5,932.50
39 Savings estimates derived from TecMarket Manual results for this measure.

Volume 2: Electric Potential Report Energy Efficiency Measures
5-7
In Table 5-5, the additional measures affecting a single-family home with central air conditioning are enumerated. These measures are also evaluated for cost effectiveness based on the lifetime benefits relative to the incremental cost of the measure. The total savings is calculated for each year of the model and depends on the base year saturation of the measure, the overall applicability of the measure, and the savings as a percentage of the relevant energy usage.
The equipment measure data tables for all energy efficiency measures assessed in this study are presented in Appendix D for the residential sector and Appendix H for the C&I sectors.
Table 5-5 Sample Non-Equipment Measures – Single Family Home
End Use Measure
Savings (%)
Electric Saturation in 200740
Applica-bility
Cost Lifetime
Cooling Programmable Thermostat 7% 17% 75% $114.42 11
Cooling AC Maintenance 10% 10% 43% $240.00 4
Cooling Infiltration Control 12% <1% 54% $354.00 12
Cooling Duct Repair 15% 12% 54% $500.00 18
Cooling External Shades 23% <1% 8% $3,060.00 15
Cooling Storm Doors 1% 32% 54% $320.00 12
Cooling Reflective Roof 3% <1% 8% $1,549.61 15
Cooling Radiant Barrier 1% <1% 90% $922.68 12
Cooling Duct Insulation 4% 21% 80% $500.00 18
Cooling High Efficiency Windows 14% 5% 8% $4,710.30 20
Cooling Ceiling Insulation 2% 1% 8% $3,072.02 20
Cooling Wall Insulation 9% 1% 8% $3,750.00 20
Cooling Foundation Insulation
4% 2% 8% $1,872.00 20
Cooling Ceiling Fan 13% 22% 54% $260.00 15
Cooling Whole-House Fan 9% 4% 13% $764.00 18
Cooling Dehumidifier 12% 13% 54% $200.00 12
Cooling Attic Fan 5% <1% 90% $115.80 18
5.3 ECONOMIC SCREENING In order to assess the achievable energy efficiency potential, it is first necessary to perform an economic screen on each individual measure. The results of the economic screen then serve as the reference point by which economic potential is derived. Within the framework of the LoadMAP model, the economic screening is performed dynamically in order to account for changing savings and cost data over time. Changes in these inputs to the economic screen can result in measures passing for some but not all of the years in the forecast.
The economic screen applied in this study is a Total Resource Cost (TRC) test that compares the lifetime benefits (both energy and peak demand) of each applicable measure with installed cost (including material, labor and administration of a delivery mechanism, such as an energy efficiency program).41
40 Note that saturation levels reflected for 2007 change over time as more measures are adopted. This is particularly the case for measures where the 2007 saturation rates are estimated at less than 1% (e.g., attic fans, reflective roofs, etc.).
The lifetime benefits are obtained by multiplying the annual energy and
41 Note that the TRC test is typically the industry standard for evaluating measure-level cost-effectiveness. There are other test perspectives that are often considered in energy efficiency potential studies. The Participant test measures the benefits and costs from the perspective of program participants as a whole. The Ratepayer Impact Measure (RIM) test measures the difference between the

Energy Efficiency Measures Volume 2: Electric Potential Report
5-8
demand savings for each measure by all appropriate avoided costs for each year, and discounting the dollar savings to the present value equivalent. The measure savings, costs and lifetimes are obtained as part of the measure characterization. For economic screening of measures, incentives are not included because they represent a simple transfer from one party to another but have no effect on the overall measure cost.
The economic screening was performed for all measures specified in this study. It is important to note the following about the economic screen:
• The economic evaluation of every measure in the screen is conducted relative to a baseline condition. For instance, in order to determine the kilowatt-hour (kWh) savings potential of a measure, its kWh consumption must be compared to the kWh consumption of a baseline condition.
• The economic screen uses either the full or the incremental cost for each measure. Incremental cost was used for situations in which the decision is between the purchase and installation of a standard efficiency unit and a high-efficiency unit. For instance, the incremental cost of an Energy Star refrigerator is the additional cost of purchasing this unit compared to a comparable unit without the Energy Star rating. Full cost was used for situations in which the measure is added to an existing end-use or process. For example, external shades are represented as full costs since they are measures that added to the building in order to enhance the cooling energy efficiency.
• The economic screening was conducted only for measures that are applicable to each building type and vintage; thus if a measure is deemed to be irrelevant to a particular building type and vintage, it is excluded from the respective economic screen table.
• In compliance with standard practice for TRC evaluations, the measure costs were increased by 10 percent to account for administrative costs related to program implementation needed to promote the measure.
5.3.1 Avoided Costs The lifetime benefits of each energy efficiency measure depend on the forecast of Con Edison avoided costs. For this study, avoided costs were taken from the NY Public Service Commission’s January 16, 2009 Order (Case 08-E-1007)42
Table 5-6 Avoided Cost and Retail Electricity Price Forecasts
regarding utility energy efficiency programs. Table 5-6 presents a summary of these costs as well as Con Edison’s forecast of average electricity retail prices.
2007 2009 2012 2015 2018 Avoided Cost of Energy ($/MWh) $81.08 $85.17 $87.26 $92.68 $99.67
Avoided Cost of Capacity ($/kW-yr)
$54.00 $56.73 $130.06 $132.01 $170.49
Avoided Cost of Transmission and Distribution ($/kW-yr) $97.85 $102.20 $109.09 $116.45 $124.31
Residential Retail Price ($/kWh)
$0.20 $0.23 $0.27 $0.29 $0.32
Business Retail Price ($/kWh) $0.17 $0.20 $0.22 $0.24 $0.26
change in total revenues paid to a utility and the change in total costs to a utility resulting from the energy efficiency and demand response programs. The Utility Cost (UC) test measures the costs and benefits from the perspective of the utility administering the program. Neither the RIM nor UC tests are typically applied in the context of measure-level economic screens, but rather in the broader context of energy efficiency programs and initiatives put into place to deliver the energy efficiency measures. 42 Note that the avoided costs in the Order did not take into account a CO2 adder. The practical effect of including such an adder is that more measures would pass the economic screen, thus raising the energy efficiency potential. Based on experience, a 10% adder to the avoided energy costs might lead to a 2-5% increase in the magnitude of the economic potential. This increase would carry forward to the maximum achievable potential and the realistic achievable potential. While the specific analysis was not conducted for avoided costs with a CO2 adder, the LoadMAP model can easily accommodate these types of scenarios.

Volume 2: Electric Potential Report Energy Efficiency Measures
5-9
5.4 RESULTS OF THE ECONOMIC SCREEN The results of the economic screen are summarized in Table 5-7. Out of the 2,049 permutations of measures considered in the study, 1,090 passed the economic screen in the first year. This is slightly greater than half the total number of measures (53%). While this result seems modest, it should be noted that many of the measure permutations in consideration embody emerging and undeveloped technologies. Although they were not found to be cost-effective at present, these technologies are likely to play a large role in shaping future energy savings.
Appendix D shows the detailed results of the economic screening process by segment, vintage, end use and measure for the residential sector. Appendix H shows the equivalent information for the commercial and industrial sectors.
Table 5-7 Summary of Economic Screen Results
Sector Criteria Number of Equipment Measures
Number of Non-
Equipment Measures
Total Number of Measures
Residential Measures Considered 468 174 642
Passed Economic Screen 326 59 385
Commercial and Industrial
Measures Considered 928 479 1,407
Passed Economic Screen 406 299 705
Total Measures Considered 1,396 653 2,049
Passed Economic Screen 732 358 1,090


6-1
CHAPTER 6
ENERGY EFFICIENCY POTENTIAL RESULTS
This chapter provides the energy efficiency potential for the years 2010 through 2018 for Con Edison markets in New York City and Westchester County. Four types of energy-efficiency potential were estimated for the residential, commercial and industrial sectors. Potential by specific end-use within each sector is also provided.
6.1 DEFINITIONS OF POTENTIAL In this study, four types of energy-efficiency potential were estimated: technical potential, economic potential, maximum achievable potential, and realistic achievable potential. Technical and economic potentials are calculated based on the level of efficiency that is available (technical potential) and a measure’s economic viability (economic potential). Maximum and realistic achievable potential embodies a set of assumptions about the decisions consumers make regarding the efficiency of purchased equipment, the maintenance and controls of energy-consuming equipment, and the elements of building construction.
As with the reference forecast, the results described in this section were developed using the LoadMAP forecasting tool. LoadMAP utilizes a bottom-up approach, which isolates customer segments, end uses, technologies (devices and controls), and efficiency levels. The results are aggregated to produce alternative “forecasts” for each type of potential.
6.1.1 Technical Potential Technical potential is defined as the theoretical upper limit of energy efficiency potential. It assumes that all feasible measures are adopted by customers, regardless of cost. Technical potential is obtained by setting all new equipment purchases at the time of equipment failure to the most efficient available option. Examples of technologies incorporated into technical potential include the following:
• Ductless “mini-split” air conditioners with variable refrigerant flow
• Ground source heat pumps, with desuperheater for water heating
• Multiple-drawer refrigerators and freezers
• Solid state (LED) lighting for general service, both interior and exterior
Technical potential also assumes the adoption of every available non-equipment measure, where applicable. For example, technical potential includes installation of high-efficiency windows in existing and new construction opportunities and repair and sealing of air ducts in existing buildings.
6.1.2 Economic Potential Economic potential represents the adoption of all cost-effective energy efficiency measures. As described in Chapter 5, an economic screen is performed to determine which measures are economically viable. The results are then incorporated into the purchase decisions to reflect the most efficient measure that passes the screen. For the analysis presented here, the Total Resource Cost (TRC) test was applied, which compares the lifetime energy and capacity benefits to the incremental cost, including the administrative costs associated with any energy efficiency

Energy Efficiency Potential Results Volume 2: Electric Potential Report
6-2
program.43
6.1.3 Maximum Achievable Potential
Like technical potential, economic potential is a theoretical construct and does not reflect any true market relevance for energy efficiency potential.
The maximum achievable potential (MAP) is a subset of economic potential that represents the upper-boundary for energy efficiency savings that a utility and/or conservation entity could achieve through its programs. MAP assumes that a set of factors are in place to ensure maximum adoption of the energy efficiency measures. What is most typically considered when looking at MAP estimates is that incentive levels must approach 100% of the customer’s cost (or conversely customer payback must approach 0 years) to motivate the maximum number of customers to make the necessary investments in energy efficiency. It is important to recognize that 100% incentives or zero-year customer paybacks should not be viewed as the sole criteria for achieving maximum participation in energy efficiency programs. Industry literature suggests that incentives explain only a portion of what motivates customers to participate in energy efficiency programs. A recent report for the California Institute for Energy Efficiency concludes that while incentives influence investment behavior, in some cases this influence was as little as 30%.44
Other factors that explain high levels of participation as represented in the MAP estimates include substantial program administration infrastructures with large numbers of personnel tending to customer needs, aggressive marketing and customer outreach campaigns that enhance customer awareness of the available energy efficiency measures, and expansive training and outreach to trade allies and equipment vendors/manufacturers in order to ensure that the energy efficiency products are available in the marketplace.
MAP is calculated by applying a set of market acceptance rates (MARs) to the economic potential estimates. For this study, the MARs from the Northeast Region of the EPRI National Potentials Study were reexamined and determined to be appropriate for use in the Con Edison territory. Accordingly, the MARs were applied to the economic potential to estimate MAP. Market acceptance rates can be updated in the LoadMap model if data regarding local and specific customer attitudes and preferences about energy efficiency become available. Additional information on the market acceptance rates used for this study is located in Appendix J.
6.1.4 Realistic Achievable Potential Realistic achievable potential (RAP) is a subset of maximum achievable potential that represents a forecast of likely customer behavior and acceptance rates of energy-efficiency technologies. It takes into account existing market, financial, political, and regulatory barriers that are likely to limit the amount of savings that might be achieved through energy efficiency programs. For example, it considers that there are other goals such as lower electric rates and customer equity in the development of final program designs and savings targets. Recent industry literature suggests that there are a number of challenges facing states that have recently enhanced their energy-efficiency policies. A recent study by the Lawrence Berkeley National Laboratory concludes that near-term issues such as the economic downturn, shortages within the energy efficiency workforce and regulatory lag all contribute to inhibit achievement of the stated legislative goals.45
RAP considers customer incentives that are representative of benchmark practices in the industry, defined marketing campaigns, and internal budget constraints. Political barriers often reflect differences in regional attitudes toward energy efficiency and its value as a resource. The RAP also takes into account recent utility industry experience and reported programmatic savings. RAP is calculated by applying a set of program implementation factors (PIFs) to
43 In addition to the TRC test, a participant test screen was also performed for measure-level analysis. The effect of the participant test was that a slightly greater number of energy-efficiency measures passed, thus resulting in a slightly higher economic savings potential. Other cost-effectiveness tests such as Ratepayer Impact Measure (RIM) and Utility Cost (UC) were not performed, as they are typically represented at a programmatic level, rather than the measure-level. 44 Peters, Jane and M. McRae. “Process Evaluation Insights on Program Implementation.” California Institute for Energy and Environment. February 2009. 45 Lawrence Berkeley National Laboratory. “The Shifting Landscape of Ratepayer-Funded Energy Efficiency in the U.S.” October 2009.
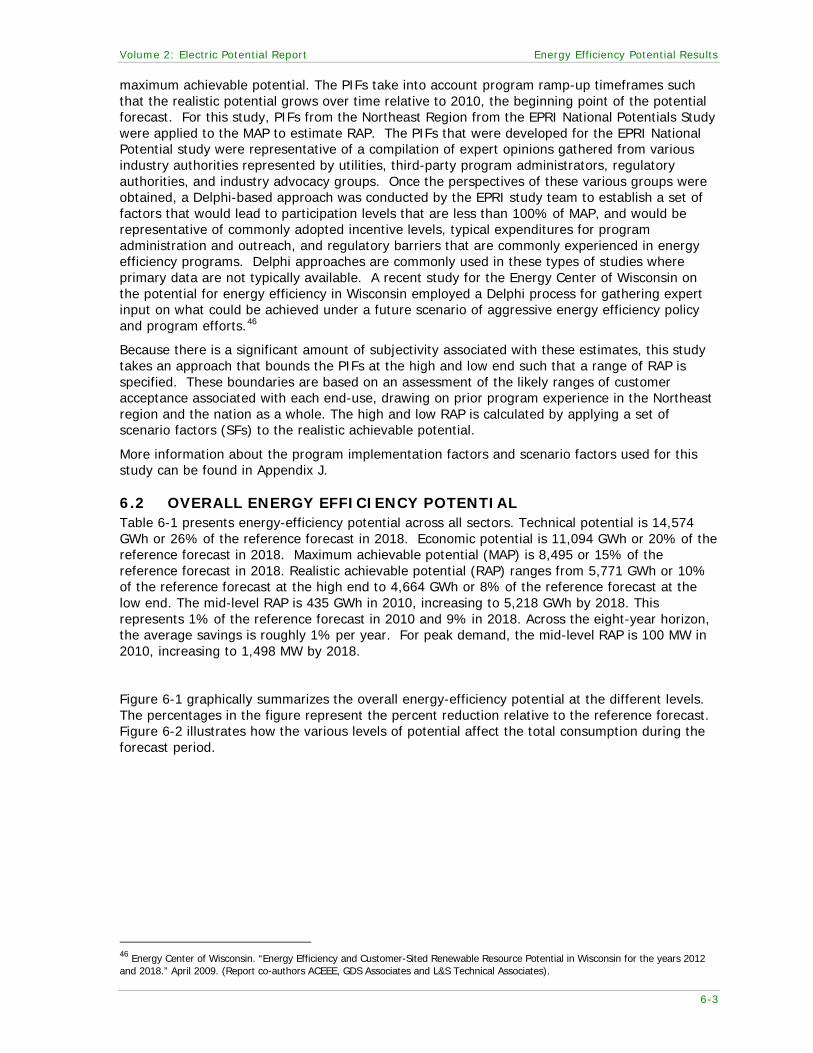
Volume 2: Electric Potential Report Energy Efficiency Potential Results
6-3
maximum achievable potential. The PIFs take into account program ramp-up timeframes such that the realistic potential grows over time relative to 2010, the beginning point of the potential forecast. For this study, PIFs from the Northeast Region from the EPRI National Potentials Study were applied to the MAP to estimate RAP. The PIFs that were developed for the EPRI National Potential study were representative of a compilation of expert opinions gathered from various industry authorities represented by utilities, third-party program administrators, regulatory authorities, and industry advocacy groups. Once the perspectives of these various groups were obtained, a Delphi-based approach was conducted by the EPRI study team to establish a set of factors that would lead to participation levels that are less than 100% of MAP, and would be representative of commonly adopted incentive levels, typical expenditures for program administration and outreach, and regulatory barriers that are commonly experienced in energy efficiency programs. Delphi approaches are commonly used in these types of studies where primary data are not typically available. A recent study for the Energy Center of Wisconsin on the potential for energy efficiency in Wisconsin employed a Delphi process for gathering expert input on what could be achieved under a future scenario of aggressive energy efficiency policy and program efforts.46
Because there is a significant amount of subjectivity associated with these estimates, this study takes an approach that bounds the PIFs at the high and low end such that a range of RAP is specified. These boundaries are based on an assessment of the likely ranges of customer acceptance associated with each end-use, drawing on prior program experience in the Northeast region and the nation as a whole. The high and low RAP is calculated by applying a set of scenario factors (SFs) to the realistic achievable potential.
More information about the program implementation factors and scenario factors used for this study can be found in Appendix J.
6.2 OVERALL ENERGY EFFICIENCY POTENTIAL Table 6-1 presents energy-efficiency potential across all sectors. Technical potential is 14,574 GWh or 26% of the reference forecast in 2018. Economic potential is 11,094 GWh or 20% of the reference forecast in 2018. Maximum achievable potential (MAP) is 8,495 or 15% of the reference forecast in 2018. Realistic achievable potential (RAP) ranges from 5,771 GWh or 10% of the reference forecast at the high end to 4,664 GWh or 8% of the reference forecast at the low end. The mid-level RAP is 435 GWh in 2010, increasing to 5,218 GWh by 2018. This represents 1% of the reference forecast in 2010 and 9% in 2018. Across the eight-year horizon, the average savings is roughly 1% per year. For peak demand, the mid-level RAP is 100 MW in 2010, increasing to 1,498 MW by 2018.
Figure 6-1 graphically summarizes the overall energy-efficiency potential at the different levels. The percentages in the figure represent the percent reduction relative to the reference forecast. Figure 6-2 illustrates how the various levels of potential affect the total consumption during the forecast period.
46 Energy Center of Wisconsin. “Energy Efficiency and Customer-Sited Renewable Resource Potential in Wisconsin for the years 2012 and 2018.” April 2009. (Report co-authors ACEEE, GDS Associates and L&S Technical Associates).

Energy Efficiency Potential Results Volume 2: Electric Potential Report
6-4
Table 6-1 Summary of Energy Efficiency Potential
2010 2012 2015 2018
Reference Forecast (GWh) 47 52,923 53,909 55,003 56,489
Energy Savings (GWh)
Technical potential 4,425 9,617 12,838 14,574
Economic potential 3,189 7,153 9,663 11,094
Maximum achievable potential 1,801 4,784 7,061 8,495
Realistic achievable (high) 481 1,800 3,882 5,771
Realistic achievable (mid) 435 1,628 3,511 5,218
Realistic achievable (low) 389 1,455 3,141 4,664
Energy Savings as % of Reference
Technical potential 8.4% 17.8% 23.3% 25.8%
Economic potential 6.0% 13.3% 17.6% 19.6%
Maximum achievable potential 3.4% 8.9% 12.8% 15.0%
Realistic achievable (high) 0.9% 3.3% 7.1% 10.2%
Realistic achievable (mid) 0.8% 3.0% 6.4% 9.2%
Realistic achievable (low) 0.7% 2.7% 5.7% 8.3%
Peak Demand Savings (MW)
Technical potential 1,329 2,632 3,437 3,995
Economic potential 967 1,936 2,563 3,025
Maximum achievable potential 508 1,336 1,980 2,383
Realistic achievable (high) 111 435 1,049 1,657
Realistic achievable (mid) 100 393 949 1,498
Realistic achievable (low) 90 352 849 1,339
47 Reference consumption for 2007 was 50,411 GWh, as reported in Table 4-17.

Volume 2: Electric Potential Report Energy Efficiency Potential Results
6-5
Figure 6-1 Summary of Energy Efficiency Potential
Figure 6-2 Energy Efficiency Potential Forecasts
Realistic
Maximum
Economic
Technical
0%
5%
10%
15%
20%
25%
30%
20102012
20152018
0.8%3.0%
6.4%9.2%
3.4%
8.9%
12.8%15.0%
6.0%
13.3%
17.6%19.6%
8.4%
17.8%
23.3%25.8%
Perc
ent o
f Ref
eren
ce F
orec
ast
-
10,000
20,000
30,000
40,000
50,000
60,000
2007 2008 2009 2010 2011 2012 2013 2014 2015 2016 2017 2018
Elec
tric
ity U
se (G
Wh)
Reference
Realistic
Maximum
Economic
Technical

Energy Efficiency Potential Results Volume 2: Electric Potential Report
6-6
Table 6-2 presents all levels of energy efficiency potential by sector. In 2010, the residential sector accounts for over 30% of the total RAP (mid-level) savings. By 2018, the commercial sector accounts for nearly 80% of the total RAP (mid-level) savings. This reflects the long term significant effects of codes and standards on the residential sector, which results in establishing the commercial sector, the office segment in particular, as the largest opportunity for energy efficiency programs in Con Edison’s territory.
Table 6-2 Energy Efficiency Potential by Sector
Case/Sector
2010 2012 2015 2018
GWh % of
Refer-ence*
GWh % of
Refer-ence*
GWh % of
Refer-ence*
GWh % of
Refer-ence*
Technical Potential
Residential 1,278 8% 3,031 18% 4,053 24% 4,210 24%
Commercial 3,111 9% 6,503 18% 8,672 24% 10,228 28%
Industrial 37 2% 83 5% 114 6% 136 8%
Total 4,425 8% 9,617 18% 12,838 23% 14,574 26%
Economic Potential
Residential 932 6% 2,273 13% 2,922 17% 2,939 17%
Commercial 2,227 6% 4,824 14% 6,665 18% 8,059 22%
Industrial 30 2% 56 3% 75 4% 95 5%
Total 3,189 6% 7,153 13% 9,663 18% 11,094 20%
Maximum Achievable
Residential 483 3% 1,344 8% 1,965 12% 2,152 12%
Commercial 1,301 4% 3,399 10% 5,036 14% 6,266 17%
Industrial 17 1% 41 2% 59 3% 76 4%
Total 1,801 3% 4,784 9% 7,061 13% 8,495 15%
Realistic Achievable – High
Residential 156 1% 506 3% 937 6% 1,242 7%
Commercial 322 1% 1,283 4% 2,919 8% 4,489 12%
Industrial 3 0% 11 1% 25 1% 39 2%
Total 481 1% 1,800 3% 3,882 7% 5,771 10%
Realistic Achievable – Mid-Level
Residential 141 1% 455 3% 842 5% 1,114 6%
Commercial 292 1% 1,163 3% 2,646 7% 4,068 11%
Industrial 3 0% 10 1% 23 1% 35 2%
Total 435 1% 1,628 3% 3,511 6% 5,218 9%
Realistic Achievable – Low
Residential 125 1% 404 2% 748 4% 985 6%
Commercial 262 1% 1,043 3% 2,373 7% 3,648 10%
Industrial 2 0% 9 0% 20 1% 31 2%
Total 389 1% 1,455 3% 3,141 6% 4,664 8%
* Note that Percent of Reference indicates the GWh savings potential as a percent of the Reference Forecast.

Volume 2: Electric Potential Report Energy Efficiency Potential Results
6-7
6.2.1 Comparison of Results A comparison of these estimates was made with other studies of a similar nature. In particular, various levels of potential are compared with the Optimal Study (2008) and the EPRI National Potential Study for the Northeast region. Table 6-3 highlights the key comparisons of total potential relative to this study.
Table 6-3 Comparison of Energy Efficiency Potential Studies (2015)
Case
Optimal 2008 Study1
(GWh and % of Reference)
EPRI 2009 National Potential Study (%
of Reference)4
Con Edison 2010 Potential Study5
(GWh and % of Reference)
2015 Reference forecast for Con Edison Territory2
64,6263 NA 55,003
2015 Maximum achievable potential
10,806 16.7% 6.8%
7,061 12.8%
2015 Realistic achievable potential NA6 3.2%
3,511 6.4%
Notes: 1. The Optimal Study forecasts potential with programs through 2015. 2. Con Edison territory covers all of Zones J and I, and part of Zone H. The Optimal Study
separates out Zone J from the rest of the state, but not Zones H or I. Figures derived for Optimal are from 2008 Optimal Study for Zone J with a 10% adder to approximate consumption and potential including Westchester County (Zone I and part of H).
3. Reference forecast for Optimal has codes and standards deducted from their baseline forecast number.
4. The EPRI study did not develop an estimate of reference forecast for the Con Edison territory since the study represents the entire DOE Northeast region. Further, the EPRI study assessed MAP and RAP at 10-year intervals – 2010 and 2020. Thus, figures for MAP and RAP are interpolated from source data for Figure A-1 Electricity Forecast by Sector, Northeast Region.
5. Figures from Table 6-1 of this study. Realistic achievable potential estimates reported for the mid-level.
6. The Optimal Study did not provide an estimate of realistic achievable potential.
The comparison yields the following insights:
• The 2008 Optimal Study reflects higher estimates of energy efficiency potential relative to the estimates from the Con Edison Study. These higher amounts are due to a variety of methodologies, calculations and assumptions in the Optimal Study that are different than the Con Edison Study.
• First, the Optimal Study baseline forecast is 17% higher than the Con Edison Study.
• Second, roughly a quarter of the energy efficiency measures in the Optimal Study are retrofit measures. Except for lighting, the Con Edison Study explicitly does not include retrofits since customers tend to replace expensive equipment like air conditioners, motors and chillers only when the equipment is at or near the end of its expected lifetime. The issue of including retrofit measures explains a significant difference in potential estimates between the Optimal and Con Edison studies (approximately 500 GWh).
• Third, many of the drivers for the Con Edison Study are drawing upon billing data and other primary market research data. Given the limited access to primary data, the Optimal Study relied largely on secondary data, especially for Zone J.

Energy Efficiency Potential Results Volume 2: Electric Potential Report
6-8
• A fourth significant difference between the studies regards the industrial sector. The Optimal Study calculated a baseline for industrial (Zone J) of 2,893 GWh, not including Westchester County, and a MAP savings of 571 GWh. The Con Edison Study’s industrial baseline, which includes Westchester County, is 1,789 and has a MAP savings of 59 GWh.
• The Optimal Study analysis framework was performed using different definitions for the various market segments in the base year drawing upon secondary data whereas the Con Edison Study applied primary data to define each of the market segments. The Optimal Study is broken down into seven segments (4 residential, 2 commercial, and 1 industrial), while the Con Edison Study has generated 17 segments (3 residential, 13 commercial and 1 industrial).
• The Con Edison Study segments the residential and commercial markets at a greater level of resolution relative to the Optimal Study. For example, this study separates out the multi-family segment such that the energy efficiency potential savings for apartments (regardless of whether they are master-metered or individually metered) are counted as part of the residential sector. Other multi-family uses for common areas and central systems are appropriately addressed in the commercial sector.
• The EPRI study and the Con Edison Study were both conducted by Global Energy Partners using the LoadMAP model. As such, they have many similarities. The reference forecast in both studies includes the effects of appliance and equipment standards and building codes that are already legislated or mandated. Both studies do not consider early replacement of major pieces of appliances and end-use equipment (e.g., air conditioners, refrigerators). Both studies utilize a similar list of energy-efficiency measures (the EPRI Study measure list was used as a foundation for the Con Edison list).
• The differences between the EPRI Study and the Con Edison Study relate to two main factors. First, much of the data supporting the Con Edison Study is rooted in primary market research and New York-specific secondary data sources. The EPRI Study relied exclusively on secondary data from U.S. Department of Energy (USDOE) and other national sources to drive the estimates. Second, in addition to the state of New York, the Northeast region includes all of the New England states as well as New York and Pennsylvania. This is a large region with a wide variety of energy efficiency histories, activities, and programs – achievements of which are already reflected in the EPRI Study reference forecast.
6.3 RESIDENTIAL SECTOR POTENTIAL Assuming that 2010 is the first full program year, RAP (mid-level) for the residential sector is 141 GWh or 0.9% of the reference forecast by the end of the year and reaches 2.7% of total residential electricity use in 2012. By 2018, the RAP (mid-level) grows to 1,114 GWh or 6.3% of total residential electricity use. Estimates for the four types of potential are presented in Table 6-4.

Volume 2: Electric Potential Report Energy Efficiency Potential Results
6-9
Table 6-4 Energy Efficiency Potential for the Residential Sector
2010 2012 2015 2018
Reference Forecast (GWh) 48 16,445 16,853 17,015 17,600
Energy Savings (GWh)
Technical potential 1,278 3,031 4,053 4,210
Economic potential 932 2,273 2,922 2,939
Maximum achievable potential 483 1,344 1,965 2,152
Realistic achievable (high) 156 506 937 1,242
Realistic achievable (mid) 141 455 842 1,114
Realistic achievable (low) 125 404 748 985
Energy Savings as % of Reference
Technical potential 7.8% 18.0% 23.8% 23.9%
Economic potential 5.7% 13.5% 17.2% 16.7%
Maximum achievable potential 2.9% 8.0% 11.6% 12.2%
Realistic achievable (high) 1.0% 3.0% 5.5% 7.1%
Realistic achievable (mid) 0.9% 2.7% 5.0% 6.3%
Realistic achievable (low) 0.8% 2.4% 4.4% 5.6%
Peak Demand Savings (MW)
Technical potential 525 1,060 1,368 1,509
Economic potential 401 807 1,032 1,140
Maximum achievable potential 199 542 809 931
Realistic achievable (high) 41 155 366 583
Realistic achievable (mid) 37 140 329 523
Realistic achievable (low) 33 124 292 463
Figure 6-3 depicts the potential estimates graphically. Figure 6-4 shows the forecasts under the four types of potential along with the reference forecast. This forecast shows a shift beginning in 2012, which results from phasing in of the lighting standard in EISA. From this point forward, potential program-related savings from lighting (such as CFLs) erode to some extent because the lighting standards play a more significant role. However, this decline does not suggest that energy efficiency program opportunities for lighting go away entirely because of EISA. The EISA standard requires an efficiency level that falls between standard incandescent and CFLs. As advanced incandescent that just meet the standard become available in the marketplace, this will leave some room for upgrading to CFLs or other high efficiency lighting technologies. Other factors reflected in the reference forecast include the future effects of non-lighting codes and standards as well as the future impacts of past energy efficiency program participants. The potential analysis in this study recognizes these factors.
48 Reference consumption for 2007 was 15,510 GWh, as reported in Table 4-17.

Energy Efficiency Potential Results Volume 2: Electric Potential Report
6-10
Figure 6-3 Residential Energy Efficiency Potential
Figure 6-4 Residential Energy Efficiency Potential Forecast
Realistic (mid)
Maximum
Economic
Technical
0%
5%
10%
15%
20%
25%
20102012
20152018
0.9%2.7%
5.0%6.3%
2.9%
8.0%
11.6% 12.2%
5.7%
13.5%
17.2%16.7%
7.8%
18.0%
23.8% 23.9%
Perc
ent o
f Ref
eren
ce F
orec
ast
-
2,000
4,000
6,000
8,000
10,000
12,000
14,000
16,000
18,000
20,000
2007 2008 2009 2010 2011 2012 2013 2014 2015 2016 2017 2018
Elec
tric
ity U
se (G
Wh)
Reference
Realistic
Maximum
Economic
Technical

Volume 2: Electric Potential Report Energy Efficiency Potential Results
6-11
6.3.1 Residential Potential by Market Segment One of the unique attributes of the Con Edison service area is the dominance of large multi-family buildings in comparison to single-family homes, townhomes and row houses, and mobile homes that are prevalent in other service territories. This distribution is evident in the total potential savings by segment, displayed in Table 6-5.
When comparing segments, large multi family homes have twice the consumption of each of the other segments and, as expected, they also have the largest absolute savings potential. On the other hand, the large multifamily segment has the lowest potential savings in terms of percentage of its baseline consumption. Differences of potential savings percentages between market segments result from different appliance and equipment saturation and housing size estimates based on the primary market data. For example, large multi-family homes tend to have fewer TV’s, refrigerators, and computers than single-family homes because of available space. Also, most large multi-family buildings have relatively less exterior lighting (balcony lighting). Finally, air conditioning usage is higher in single-family homes due to the size of the homes and the larger systems (relative to multi-family units).
Small multifamily has the greatest energy savings potential in terms of percentage; however, it also represents the smallest baseline usage in the residential market. Overall GWh savings in the small multifamily segment are the lowest, but still represent a significant opportunity in the residential electric potential market.
Table 6-5 Residential Potential by Market Segment, 2018
Forecast Single Family
Small Multi Family
Large Multi Family
Reference Forecast (GWh) 4,606 3,786 9,208
Energy Savings (GWh)
Technical Potential 1,120 1,086 2,003
Economic Potential 831 743 1,366
Maximum Achievable Potential 630 543 979
RAP (mid-level) 342 277 494
Energy Savings as % of Reference
Technical Potential 24.3% 28.7% 21.8% Economic Potential 18.0% 19.6% 14.8% Maximum Achievable Potential 13.7% 14.3% 10.6% RAP (mid-level) 7.4% 7.3% 5.4%
6.3.2 Residential Potential by End Use Table 6-6 provides a summary of technical, economic, and achievable potential for each of the primary end uses isolated in this study.
• Lighting equipment replacement accounts for the highest portion of the savings in absolute (GWh) terms as well as percentage of the reference forecast.
• Cooling and electronics also contribute significantly to the savings.
• Because of the relatively small share of homes with electric space heating and the limited opportunity for higher efficiency equipment, there are only minor contributions from this end use.
• While there are savings associated with various high efficiency appliances under all levels of potential, the reference also captures the resulting efficiencies from these appliances because federal appliance standards have been in place for a long period of time and are expected to have continued and increasing impacts.

Energy Efficiency Potential Results Volume 2: Electric Potential Report
6-12
Table 6-6 Residential Potential by End Use and Potential Type
End Use Potential Type Energy Savings (GWh)
2010 2012 2015 2018
Cooling
Technical 314 593 762 876
Economic 244 455 588 684
MAP 117 318 483 570
RAP (mid) 17 71 189 324
Space Heating
Technical 9 25 50 77
Economic 4 12 26 43
MAP 1 3 7 15
RAP (mid) 0 1 2 4
Water Heating
Technical 41 80 135 196
Economic 25 46 77 111
MAP 16 34 51 73
RAP (mid) 1 6 18 33
Interior Lighting
Technical 578 1,484 1,818 1,506
Economic 435 1,133 1,279 981
MAP 217 618 813 701
RAP (mid) 84 259 407 419
Exterior Lighting
Technical 101 264 323 264
Economic 76 213 251 192
MAP 39 111 152 140
RAP (mid) 17 51 79 84
Appliances
Technical 57 164 325 516
Economic 25 70 144 238
MAP 23 64 132 221
RAP (mid) 8 23 50 90
Electronics
Technical 159 388 596 718
Economic 105 308 512 634
MAP 63 174 295 395
RAP (mid) 12 42 85 135
Miscellaneous
Technical 19 35 46 56
Economic 19 35 46 56
MAP 7 21 32 38
RAP (mid) 0 3 12 24
6.3.3 Residential Potential by Measure Type In this section, estimates of realistic achievable potential for equipment and non-equipment measures are presented. As shown in Table 6-7 for equipment measures, interior lighting accounts for the most savings primarily due to lamp conversion from incandescent lamps to CFLs. There are also substantial opportunities in cooling and electronics. As shown in Table 6-8 for non-equipment measures, programmable thermostats, lighting timers, duct repair, and ceiling fans account for the largest share of savings. Note that lighting potential remains strong after 2015 despite the EISA legislation; however, the overall potential percentages are decreasing with time as a result.

Volume 2: Electric Potential Report Energy Efficiency Potential Results
6-13
Table 6-7 Residential RAP (mid-level) by Technology – Equipment Measures
End Use Technology Energy Savings (GWh)
2010 2012 2015 2018
Cooling
Central AC 0.1 0.4 0.8 1.4
Room AC 4.5 14.8 33.7 62.2
Heat Pump 0.1 0.4 1.1 2.7
Space Heating Heat Pump 0.2 0.7 1.9 4.5
Water Heating Water Heater 0.4 1.2 4.1 10.5
Interior Lighting Linear Fluorescent 0.02 0.1 0.2 0.2
Screw-in 83.5 246.9 362.3 344.0
Exterior Lighting Screw-in 17.3 50.8 77.6 82.4
Appliances
Refrigerator 6.8 19.4 42.1 75.4
Freezer 0.7 2.1 4.4 7.3
Clothes Dryer 0.1 0.5 1.1 2.3
Dishwasher 0.2 0.6 1.5 3.9
Cooking 0.1 0.3 0.6 1.3
Electronics
Color TV 1.2 3.8 9.2 24.5
Personal Computer 5.7 20.9 38.7 62.5
Other Electronics 0.7 2.4 10.4 15.7
Miscellaneous Furnace Fan 0.1 0.5 1.0 2.3
Total 121.9 365.4 590.8 703.0
Table 6-8 Residential RAP (mid-level) for Non-Equipment Measures
Measure Energy Savings (GWh)
2010 2012 2015 2018
Attic Fan 2.2 9.8 25.3 37.6
Ceiling Fan 2.3 12.1 39.1 69.7
Dehumidifier 0.2 1.3 5.1 12.4
Duct Repair 1.2 6.1 19.5 42.9
Faucet Aerators 0.1 0.6 1.7 2.7
Infiltration Control 0.3 1.3 4.1 8.9
Lighting Timer 0.6 9.1 34.3 58.0
Low-Flow Showerheads 0.7 3.8 11.7 18.4
Motion Detectors 0.02 0.3 1.1 1.8
Occupancy Sensor 0.2 2.8 10.2 17.0
Pipe Insulation 0.1 0.3 0.8 1.3
Pool Pump Timer 0.1 2.3 11.4 22.0
Programmable Thermostat 6.2 25.1 60.2 85.3
Reduce Standby Wattage 1.5 5.0 9.2 10.9
Smart Plug 2.9 9.6 17.4 20.8
Wall Insulation 0.01 0.1 0.4 0.9
Total 18.8 89.4 251.6 410.8

Energy Efficiency Potential Results Volume 2: Electric Potential Report
6-14
Appendix E contains detailed results of the residential potentials analysis, including year-by-year electricity and peak demand savings by end-use and technology type.
6.4 COMMERCIAL SECTOR POTENTIAL The opportunity for energy-efficiency savings is highest for the commercial sector. In 2010, realistic achievable potential (mid-level) is 292 GWh or 0.8% of the reference forecast. This increases to 4,068 GWh, or 11.0% of the reference forecast in 2018. Table 6-9 and Figure 6-5 present the savings for the four types of potential considered in this study.
The estimate of maximum achievable potential for the commercial sector from the 2008 Optimal Study for NYC in 2015 is 7,845. The Optimal estimate is significantly greater than the estimate of MAP from this study in 2015, which is 5,036 GWh; however the baseline used for the Optimal Study is also significantly greater than that used for this study and early replacement of major equipment is considered a viable option in the Optimal Study.
Table 6-9 Energy Efficiency Potential for the Commercial Sector
2010 2012 2015 2018
Reference Forecast (GWh) 49 34,674 35,259 36,199 37,109
Energy Savings (GWh)
Technical potential 3,111 6,503 8,672 10,228
Economic potential 2,227 4,824 6,665 8,059
Maximum achievable potential 1,301 3,399 5,036 6,266
Realistic achievable (high) 322 1,283 2,919 4,489
Realistic achievable (mid) 292 1,163 2,646 4,068
Realistic achievable (low) 262 1,043 2,373 3,648
Energy Savings as % of Reference
Technical potential 9.0% 18.4% 24.0% 27.7% Economic potential 6.4% 13.7% 18.4% 21.7% Maximum achievable potential 3.8% 9.6% 13.9% 16.9% Realistic achievable (high) 0.9% 3.6% 8.1% 12.1% Realistic achievable (mid) 0.8% 3.3% 7.3% 11.0% Realistic achievable (low) 0.8% 3.0% 6.6% 9.8% Peak Demand Savings (MW)
Technical potential 798 1,557 2,047 2,459
Economic potential 561 1,120 1,517 1,866
Maximum achievable potential 307 788 1,161 1,439
Realistic achievable (high) 69 278 680 1,070
Realistic achievable (mid) 63 252 617 969
Realistic achievable (low) 56 226 553 869
Figure 6-6 presents the forecasts for each type of potential in the context of the reference forecast. This chart shows that realistic achievable potential forecast fully offsets growth in other areas. Maximum achievable potential results in negative growth.
49 Reference consumption for 2007 was 33,156 GWh, as reported in Table 4-17.

Volume 2: Electric Potential Report Energy Efficiency Potential Results
6-15
Figure 6-5 Commercial Energy Efficiency Potential
Figure 6-6 Commercial Energy Efficiency Potential Forecast
Realistic (mid)
Maximum
Economic
Technical
0%
5%
10%
15%
20%
25%
30%
20102012
20152018
0.8%3.3%
7.3%
11.0%3.8%
9.6%
13.9%
16.9%
6.4%
13.7%
18.4%
21.7%
9.0%
18.4%
24.0%
27.7%Pe
rcen
t of R
efer
ence
For
ecas
t
-
5,000
10,000
15,000
20,000
25,000
30,000
35,000
40,000
2007 2008 2009 2010 2011 2012 2013 2014 2015 2016 2017 2018
Elec
tric
ity U
se (G
Wh)
Reference
Realistic
Maximum
Economic
Technical

Energy Efficiency Potential Results Volume 2: Electric Potential Report
6-16
6.4.1 Commercial Potential by Market Segment Table 6-10 shows potential estimates by segment. Offices (small plus large) are the largest segment in the Con Edison service area with over 36% of reference use in 2018. RAP in these segments combined in 2018 is over 14% of the reference forecast, and half the savings for the sector as a whole. In addition to offices, retail, education and multi-family common areas have the highest percentages, ranging from just under 10% to nearly 13%. Hospitals tend to have lower savings potential than other segments. This relates to the fact that hospitals must adhere to certain health and safety standards (e.g., illumination, temperature and ventilation) that often limit their potential relative to other segments that don’t have the same restrictions. The warehouse, nursing home and entertainment segments have the lowest potential relative to the reference forecast, between 6 and 7%.
Table 6-10 Commercial Potential by Market Segment, 2018
Small Office Large Office
Restaurant Grocery/ Super-market
Retail
Reference Forecast (GWh) 2,625 10,841 3,213 1,823 2,178
Energy Savings (GWh)
Technical Potential 833 3,136 822 455 712
Economic Potential 639 2,770 682 399 557
MAP 515 2,252 490 293 431
RAP (mid) 351 1,529 284 171 277 Energy Savings as % of Reference Technical Potential 32.0% 28.9% 25.6% 25.0% 32.7%
Economic Potential 24.3% 25.6% 21.2% 21.9% 25.6%
MAP 19.6% 20.8% 15.3% 16.1% 19.8%
RAP (mid) 13.4% 14.1% 8.8% 9.4% 12.7%
Warehouse Education Hospital Nursing Home Lodging
Reference Forecast (GWh) 1,367 3,254 2,016 1,108 895
Energy Savings (GWh)
Technical Potential 301 848 475 276 226
Economic Potential 152 632 376 168 153
MAP 120 484 285 124 111
RAP (mid) 86 309 174 76 68
Energy Savings as % of Reference
Technical Potential 22.0% 26.0% 23.6% 24.9% 25.2%
Economic Potential 11.1% 19.4% 18.6% 15.2% 17.1%
MAP 8.8% 14.9% 14.1% 11.2% 12.5%
RAP (mid) 6.3% 9.5% 8.7% 6.9% 7.6%
Entertain-ment
Miscella-neous
MF Common Area
Reference Forecast (GWh) 1,286 3,600 2,903
Energy Savings (GWh)
Technical Potential 326 931 888
Economic Potential 218 678 634
MAP 157 511 492
RAP (mid) 91 336 315
Energy Savings as % of Reference
Technical Potential 25.4% 25.8% 30.6%
Economic Potential 17.0% 18.8% 21.8%
MAP 12.2% 14.2% 16.9%
RAP (mid) 7.1% 9.3% 10.9%

Volume 2: Electric Potential Report Energy Efficiency Potential Results
6-17
6.4.2 Commercial Potential by End Use Potential estimates by end use are presented in Table 6-11. Lighting offers the greatest opportunity for energy savings, driven largely by conversion and redesign of existing lighting systems. Cooling savings are substantial, resulting from cooling equipment and cooling-specific measures, and also from the interactive effects of lighting and other equipment. As lighting consumption decreases, so too does cooling consumption. The same is true, although to a lesser degree, for office equipment.
Table 6-11 Commercial Potential by End Use and Potential Type
End Use Potential Type Energy Savings (GWh)
2010 2012 2015 2018
Cooling
Technical 759 1,388 1,779 2,137 Economic 493 909 1,189 1,455 MAP 227 611 907 1,096 RAP (mid) 38 169 476 779
Space Heating
Technical 108 180 198 200 Economic 78 130 143 145 MAP 36 103 147 152 RAP (mid) 5 26 83 141
Ventilation
Technical 138 353 798 1,356 Economic 101 290 726 1,279 MAP 32 113 364 764 RAP (mid) 7 26 103 243
Auxiliary
Technical 9 29 59 117 Economic 9 29 59 117 MAP 3 11 27 69 RAP (mid) 1 2 7 21
Water Heating
Technical 6 22 47 79 Economic 0 1 2 4 MAP 0 0 1 2 RAP (mid) 0 0 0 1
Refrigeration
Technical 75 175 298 421 Economic 64 146 247 350 MAP 24 70 136 210 RAP (mid) 4 16 45 83
Food Service
Technical 70 123 153 203 Economic 46 83 111 161 MAP 20 56 85 123 RAP (mid) 3 13 39 72
Interior Lighting
Technical 1,462 2,901 3,645 4,027 Economic 1,195 2,404 3,078 3,459 MAP 838 1,947 2,630 3,008 RAP (mid) 199 735 1,574 2,275
Exterior Lighting
Technical 282 811 1,026 996 Economic 127 527 698 662 MAP 66 301 442 493 RAP (mid) 26 133 216 287
Office Equipment
Technical 108 368 502 524 Economic 66 225 327 342 MAP 34 127 212 260 RAP (mid) 6 26 58 94
Miscellaneous
Technical 94 154 167 169 Economic 47 79 87 88 MAP 20 59 85 89 RAP (mid) 3 15 45 73

Energy Efficiency Potential Results Volume 2: Electric Potential Report
6-18
One other notable observation about this table relates to the sizable drop from MAP to RAP for office equipment. While significant technical, economic and MAP savings are projected for office equipment, RAP savings are quite low when compared to most of the other end-uses. This drop reflects an assumption of relatively low PIFs in the early years of the potential forecast (see Appendix J). Driving this result is the fact that, given the recent ramp-up in energy efficiency standards for office equipment, there are relatively few energy efficiency programs currently in place. Over time, as office equipment standards take hold and more utilities implement efficiency programs, it is expected that program adoption will increase. The PIFs, therefore, become higher in the latter years of the forecast; however, since the RAP reflects cumulative savings, the low PIFs in the early years of the forecast are reflected in low RAP savings for 2015 through 2018 relative to the MAP. This lag effect does not occur in RAP estimates for most of the other end-uses because their PIFs are higher earlier in the forecast.
6.4.3 Commercial Potential by Measure Type Table 6-12 and Table 6-13 present results by measure group: equipment and non-equipment. In the commercial sector, the equipment measures have a smaller share of the total potential than the non-equipment measures. Lighting has the largest realistic achievable potential throughout the entire study period in both the equipment and non-equipment measure groups.
Lighting is the only type of equipment that is considered appropriate for early replacement in this study due to practicality and economics. As such, lighting measures are divided into equipment and non-equipment measures. Lighting measures in the equipment group are defined as simply replacement of lighting equipment at or near the end of its useful life. Non-equipment lighting is defined as early replacement of lighting, changing the lighting design by renovation, conversion or upgrade of lighting systems or adding lighting controls. This division occurs only in the commercial sector, including multifamily common area, due to timing of replacement and characteristics of the measure in this sector.
A number of HVAC-related measures also show significant savings. These include Energy Management Systems (EMS), retrocommissioning, and variable speed drives (VSD) on fans. Packaged cooling is also substantial.
Appendix I contains detailed results of the commercial potentials analysis, including year-by-year electricity and peak demand savings by end-use and technology type.

Volume 2: Electric Potential Report Energy Efficiency Potential Results
6-19
Table 6-12 Commercial RAP (mid-level) by Technology – Equipment Measures
End Use Technology Energy Savings (GWh)
2010 2012 2015 2018
Cooling
Central Chiller 3.3 10.0 20.9 35.3
Packaged AC/HP 3.0 11.5 35.3 85.5
Packaged Terminal AC 0.4 1.2 2.8 6.0
Space Heating Heat Pump 0.02 0.1 0.2 0.4
Ventilation Ventilation 5.8 23.0 93.4 229.9
Auxiliary Pumps/fans 0.6 2.4 7.1 21.4
Water Heating Water Heater 0.02 0.1 0.4 0.9
Refrigeration Reach-in Refrigeration 0.6 2.3 6.4 13.0
Walk-in Refrigeration 1.8 6.4 17.8 36.4
Food Service Food Service 0.5 1.9 5.5 17.7
Interior Lighting Indoor Fluorescent 31.1 107.5 261.7 465.2
Indoor Screw-in 17.2 89.9 138.3 175.6
Exterior Lighting Outdoor Fluorescent 3.2 10.9 26.4 47.3
Outdoor Screw-in 23.2 121.7 189.4 239.5
Office Equipment
PC 2.4 10.0 21.2 33.3
Server 0.1 0.6 1.3 2.2
Monitor 2.9 12.6 28.2 46.5
Printer/Copier 0.6 3.2 6.9 11.6
Total 96.7 415.3 863.3 1,467.6

Energy Efficiency Potential Results Volume 2: Electric Potential Report
6-20
Table 6-13 Commercial RAP (mid-level) for Non-Equipment Measures
End Use Measure Energy Savings (GWh)
2010 2012 2015 2018
Cooling
Advanced Design 1.2 8.4 36.4 71.4
Cool Roof 0.9 5.2 17.5 30.4
De-lamp 6.7 23.6 50.6 68.4
Dual Enthalpy Economizer 3.0 15.1 46.6 77.3
Duct Insulation 0.1 0.5 1.4 2.4
Efficient Windows 1.9 9.2 28.6 47.0
EMS 0.8 3.7 10.5 16.6
External Shades 1.1 5.4 16.0 25.8
HVAC Retrocommissioning 2.0 11.9 39.1 63.9 Lighting Retrofit (interactive effects on cooling) 2.3 8.2 17.6 23.9
Programmable Thermostat 1.3 6.0 16.8 26.6
Roof Insulation 0.5 2.6 7.9 13.0
VSD on Water Pumps and Fans 0.1 0.3 0.5 0.4
Wall Insulation 0.5 2.5 7.7 12.8
Water Temperature Reset 9.1 43.7 119.6 172.3
Space Heating
Advanced Design 0.3 2.2 9.2 18.1
Efficient Windows 1.0 4.7 14.1 23.0
EMS 0.1 0.3 0.8 1.2
HVAC Retrocommissioning 0.5 3.1 10.3 17.0
Programmable Thermostat 1.1 5.4 15.3 24.6
Roof Insulation 0.2 1.1 3.6 6.2
Wall Insulation 1.8 9.1 29.4 50.7
Ventilation VSD on Fans 0.7 3.4 9.1 12.9
Refrigeration
Anti-Sweat Heater Controls 1.1 5.3 14.8 23.2
Floating Head Pressure Controls 0.3 1.7 4.8 7.8
Icemakers 0.04 0.4 1.4 2.6
Food Service Energy Star Kitchen Equipment 1.6 8.0 23.3 37.4 Kitchen Schedule and Maintenance
0.7 3.6 10.4 16.5
Interior Lighting
Advanced Design 3.0 20.6 87.4 169.8
De-lamp 52.3 185.9 400.3 542.3
LED Exit Lighting 30.1 91.8 145.5 156.5
Lighting Retrofit 32.6 115.3 247.2 334.3
Lighting Timers Indoors 3.2 11.4 24.4 33.1
Occupancy Sensors 25.7 92.6 203.2 278.9
Task Lighting 3.9 20.6 66.5 119.6
Miscellaneous Efficient Escalators 1.0 4.9 12.7 17.1
Vending Miser 2.1 10.5 32.1 55.6
Total 195.0 747.7 1,782.8 2,600.7

Volume 2: Electric Potential Report Energy Efficiency Potential Results
6-21
6.5 INDUSTRIAL SECTOR POTENTIAL The opportunity for energy-efficiency savings is low for industrial sector. This is largely driven by the fact that industrial makes up a very small portion of Con Edison’s total electricity usage. In addition, most of the equipment replacement opportunities are with motor measures, which tend to be relatively small due to the fact that the National Electrical Manufacturer’s Association (NEMA) standards for high efficiency motors tend to minimize savings potential going from high efficiency motors to premium efficiency motors. Furthermore, due to the site-specific nature of many industrial sector process energy efficiency opportunities, additional savings potential resulting from these customized approaches would need to be characterized individually. Customized potential savings were not represented in the potential estimates for the industrial sector. To further understand these site-specific opportunities, it would be appropriate to carry out site-specific engineering assessments for each customer.
In 2010, realistic achievable potential is 3 GWh or 0.1% of the reference industrial forecast. This increases to 35 GWh, or 2% of the reference forecast in 2018. Table 6-14 presents the savings for the various types of potential considered in this study. Figure 6-7 illustrates the levels of industrial energy efficiency potential. Figure 6-8 presents the forecasts for each type of potential in the context of the reference forecast. This chart shows that realistic achievable potential forecast fully offsets growth in other areas. Maximum achievable potential results in negative growth.
Table 6-14 Energy Efficiency Potential for the Industrial Sector
2010 2012 2015 2018
Reference Forecast (GWh) 50 1,804 1,797 1,789 1,780
Energy Savings (GWh)
Technical potential 37 83 114 136
Economic potential 30 56 75 95
Maximum achievable potential 17 41 59 76
Realistic achievable (high) 3 11 25 39
Realistic achievable (mid) 3 10 23 35
Realistic achievable (low) 2 9 20 31
Energy Savings as % of Reference
Technical potential 2.0% 4.6% 6.4% 7.6%
Economic potential 1.6% 3.1% 4.2% 5.3%
Maximum achievable potential 1.0% 2.3% 3.3% 4.3%
Realistic achievable (high) 0.2% 0.6% 1.4% 2.2%
Realistic achievable (mid) 0.1% 0.5% 1.3% 2.0%
Realistic achievable (low) 0.1% 0.5% 1.1% 1.8%
Peak Demand Savings (MW)
Technical potential 7 14 20 27
Economic potential 5 10 14 18
Maximum achievable potential 3 6 10 14
Realistic achievable (high) 0 1 3 6
Realistic achievable (mid) 0 1 3 6
Realistic achievable (low) 0 1 3 6
50 Reference consumption for 2007 was 1,745 GWh, as reported in Table 4-17.

Energy Efficiency Potential Results Volume 2: Electric Potential Report
6-22
Figure 6-7 Industrial Energy Efficiency Potential
Figure 6-8 Industrial Energy Efficiency Potential Forecast
Realistic (mid)
Maximum
Economic
Technical
0%
1%
2%
3%
4%
5%
6%
7%
8%
20102012
20152018
0.1%0.5%
1.3%
2.0%
1.0%
2.3%
3.3%
4.3%
1.6%
3.1%
4.2%
5.3%
2.0%
4.6%
6.4%
7.6%
Per
cent
of R
efer
ence
For
ecas
t
-
200
400
600
800
1,000
1,200
1,400
1,600
1,800
2,000
2007 2008 2009 2010 2011 2012 2013 2014 2015 2016 2017 2018
Ele
ctric
ity U
se (G
Wh)
Reference
Realistic
Maximum
Economic
Technical
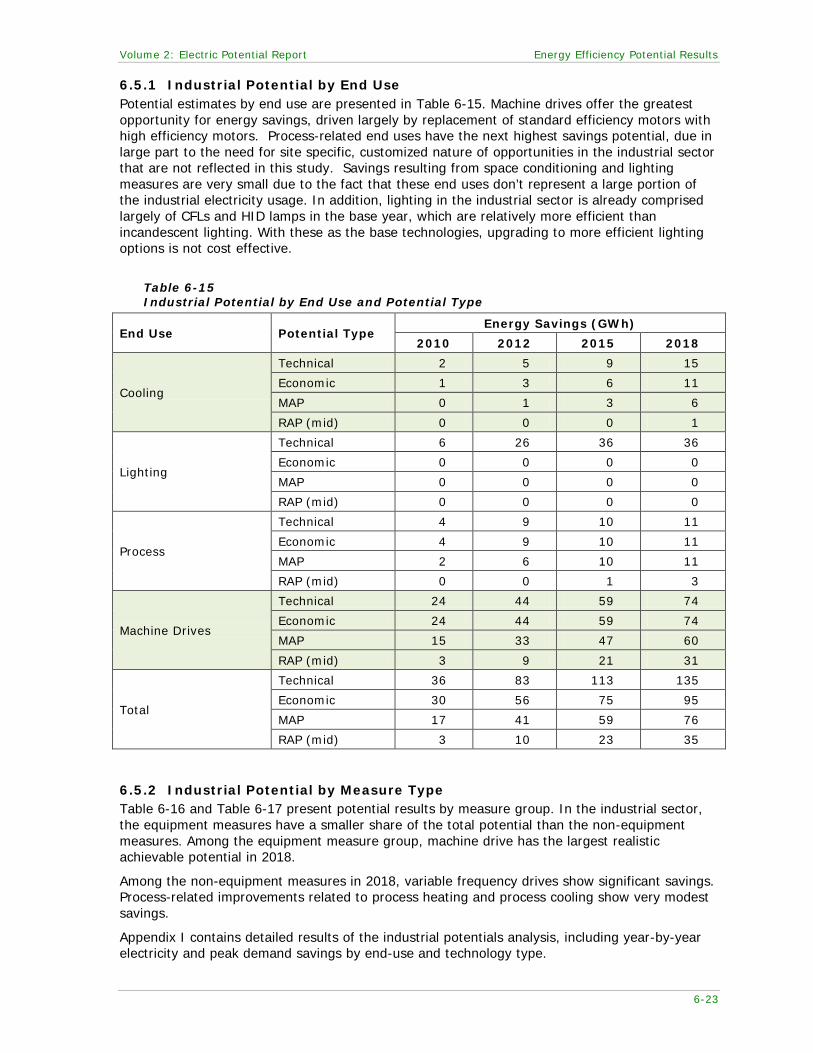
Volume 2: Electric Potential Report Energy Efficiency Potential Results
6-23
6.5.1 Industrial Potential by End Use Potential estimates by end use are presented in Table 6-15. Machine drives offer the greatest opportunity for energy savings, driven largely by replacement of standard efficiency motors with high efficiency motors. Process-related end uses have the next highest savings potential, due in large part to the need for site specific, customized nature of opportunities in the industrial sector that are not reflected in this study. Savings resulting from space conditioning and lighting measures are very small due to the fact that these end uses don’t represent a large portion of the industrial electricity usage. In addition, lighting in the industrial sector is already comprised largely of CFLs and HID lamps in the base year, which are relatively more efficient than incandescent lighting. With these as the base technologies, upgrading to more efficient lighting options is not cost effective.
Table 6-15 Industrial Potential by End Use and Potential Type
End Use Potential Type Energy Savings (GWh)
2010 2012 2015 2018
Cooling
Technical 2 5 9 15
Economic 1 3 6 11
MAP 0 1 3 6
RAP (mid) 0 0 0 1
Lighting
Technical 6 26 36 36
Economic 0 0 0 0
MAP 0 0 0 0
RAP (mid) 0 0 0 0
Process
Technical 4 9 10 11
Economic 4 9 10 11
MAP 2 6 10 11
RAP (mid) 0 0 1 3
Machine Drives
Technical 24 44 59 74
Economic 24 44 59 74
MAP 15 33 47 60
RAP (mid) 3 9 21 31
Total
Technical 36 83 113 135
Economic 30 56 75 95
MAP 17 41 59 76
RAP (mid) 3 10 23 35
6.5.2 Industrial Potential by Measure Type Table 6-16 and Table 6-17 present potential results by measure group. In the industrial sector, the equipment measures have a smaller share of the total potential than the non-equipment measures. Among the equipment measure group, machine drive has the largest realistic achievable potential in 2018.
Among the non-equipment measures in 2018, variable frequency drives show significant savings. Process-related improvements related to process heating and process cooling show very modest savings.
Appendix I contains detailed results of the industrial potentials analysis, including year-by-year electricity and peak demand savings by end-use and technology type.

Energy Efficiency Potential Results Volume 2: Electric Potential Report
6-24
Table 6-16 Industrial RAP (mid-level) by Technology – Equipment Measures
End Use Technology Energy Savings (GWh)
2010 2012 2015 2018
Cooling
Central Chiller 0.0 0.0 0.1 0.1
Pkg AC/HP 0.0 0.1 0.4 1.0
Pkg Terminal AC 0.0 0.0 0.0 0.1
Machine Drive
Less than 5 HP 0.1 0.3 0.7 1.4
5-24 HP 0.1 0.4 0.8 1.6
25-99 HP 0.1 0.4 0.9 1.8
100-249 HP 0.1 0.2 0.4 0.8
250-499 HP 0.0 0.1 0.2 0.3
500 or more HP 0.0 0.1 0.2 0.4
Total 0.5 1.6 3.8 7.4
Table 6-17 Industrial RAP (mid-level) for Non-Equipment Measures
End Use Measure Energy Savings (GWh)
2010 2012 2015 2018
Machine Drive Variable frequency drives 2.1 7.8 17.7 24.7
Process
Electrochemical process improvements 0.0 0.1 0.4 1.1
Various efficiency improvements to process cooling
0.0 0.1 0.4 1.1
Various efficiency improvements to process heating
0.0 0.1 0.4 1.1
Total 2.2 8.2 19.0 27.9
