energy efficiency in transport: successes and failures ... · a large potential of growth source:...
TRANSCRIPT
Energy efficiency in transport: successes and failures
14th April 2015
Carine Sebi and Bruno Lapillonne, Enerdata
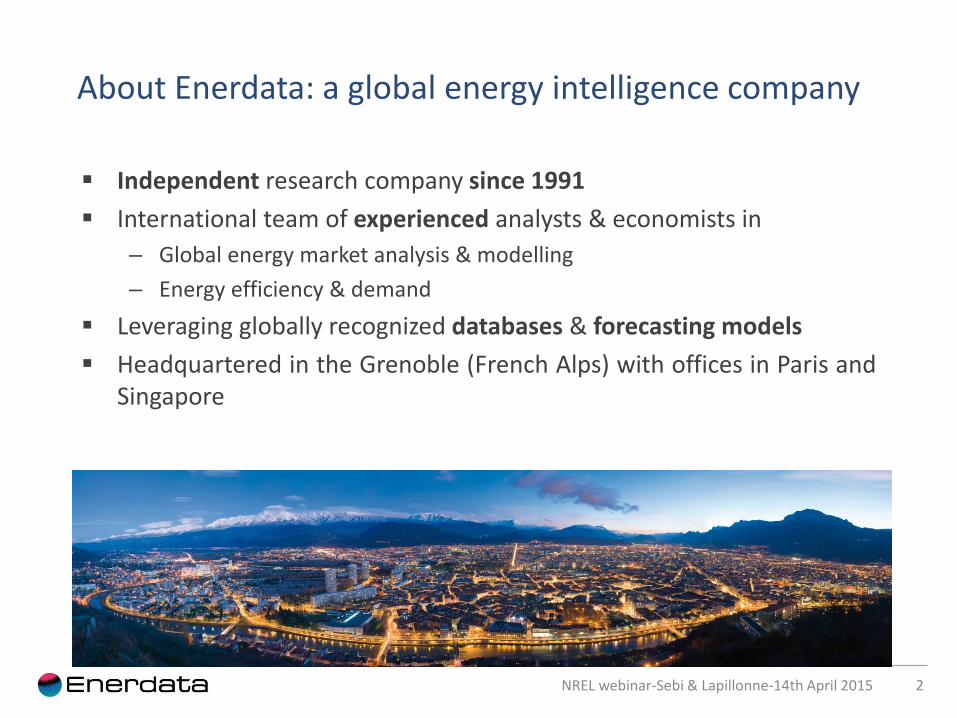
About Enerdata: a global energy intelligence company
2
Independent research company since 1991
International team of experienced analysts & economists in
– Global energy market analysis & modelling
– Energy efficiency & demand
Leveraging globally recognized databases & forecasting models
Headquartered in the Grenoble (French Alps) with offices in Paris and Singapore
NREL webinar-Sebi & Lapillonne-14th April 2015
Source of information
3
The materials gathered for the webinar relies on various projects coordinated by ADEME dealing with energy efficiency indicators and policy evaluation:
– The European ODYSSEE/MURE energy efficiency project;
– The World Energy Council (WEC) project on energy efficiency with a report and two data bases: WEC Indicators database and Policies & Measures database;
– The G20 project of IPEEC including also a data base on indicators and one on policy (G20 policy database);
– A review of EE Policies in Europe (EnR brochure).
Most of these projects include all sectors and not only transport.
NREL webinar-Sebi & Lapillonne-14th April 2015
NREL webinar-Sebi & Lapillonne-14th April 2015 4
A-Main energy efficiency trends
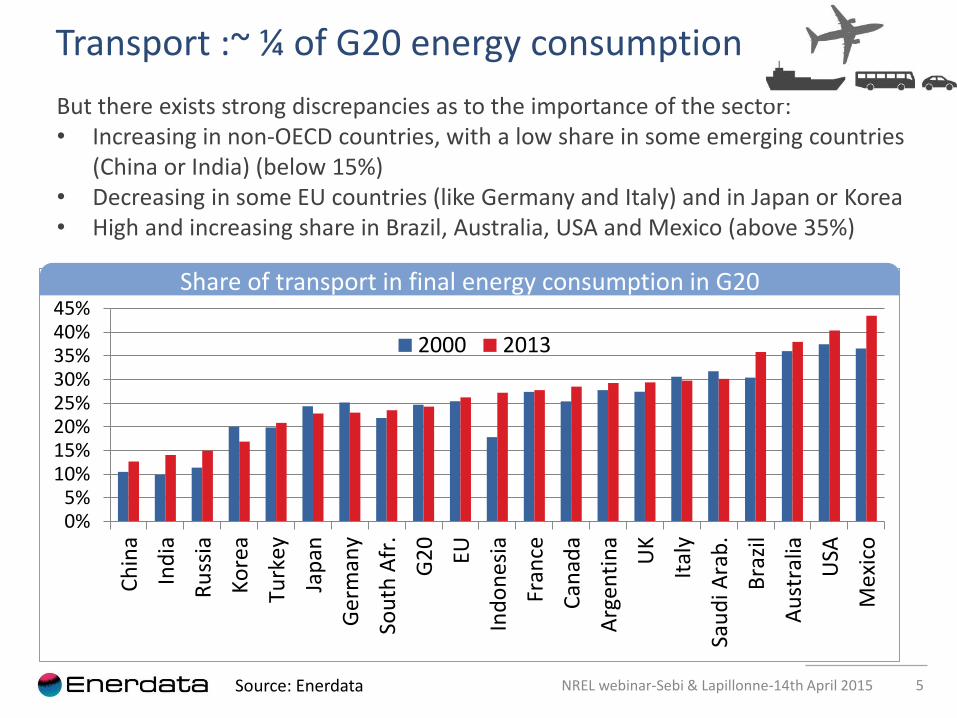
Transport :~ ¼ of G20 energy consumption
NREL webinar-Sebi & Lapillonne-14th April 2015 5 Source: Enerdata
0%5%
10%15%20%25%30%35%40%45%
Ch
ina
Ind
ia
Ru
ssia
Ko
rea
Turk
ey
Jap
an
Ger
man
y
Sou
th A
fr.
G2
0
EU
Ind
on
esia
Fran
ce
Can
ada
Arg
enti
na
UK
Ital
y
Sau
di A
rab
.
Bra
zil
Au
stra
lia
USA
Mex
ico
2000 2013
Share of transport in final energy consumption in G20
But there exists strong discrepancies as to the importance of the sector: • Increasing in non-OECD countries, with a low share in some emerging countries
(China or India) (below 15%) • Decreasing in some EU countries (like Germany and Italy) and in Japan or Korea • High and increasing share in Brazil, Australia, USA and Mexico (above 35%)
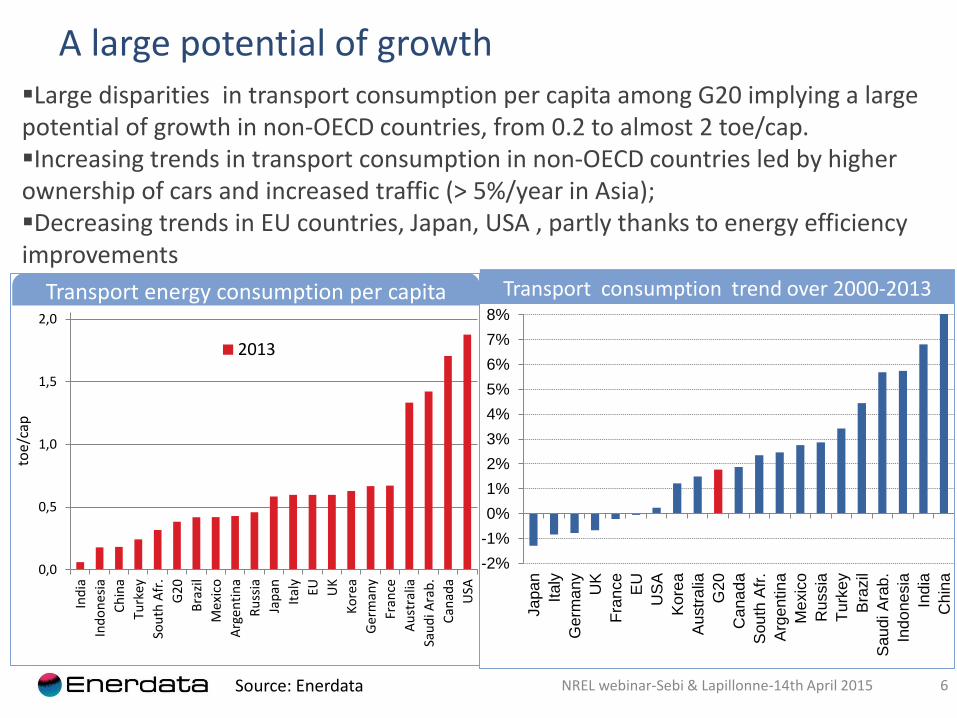
A large potential of growth
NREL webinar-Sebi & Lapillonne-14th April 2015 6 Source: Enerdata
0,0
0,5
1,0
1,5
2,0
Ind
ia
Ind
on
esia
Ch
ina
Turk
ey
Sou
th A
fr.
G20
Bra
zil
Mex
ico
Arg
enti
na
Ru
ssia
Jap
an
Ital
y
EU UK
Ko
rea
Ger
man
y
Fran
ce
Au
stra
lia
Sau
di A
rab
.
Can
ada
USA
toe
/cap
2013
Transport energy consumption per capita
Large disparities in transport consumption per capita among G20 implying a large potential of growth in non-OECD countries, from 0.2 to almost 2 toe/cap. Increasing trends in transport consumption in non-OECD countries led by higher ownership of cars and increased traffic (> 5%/year in Asia); Decreasing trends in EU countries, Japan, USA , partly thanks to energy efficiency improvements
-2%
-1%
0%
1%
2%
3%
4%
5%
6%
7%
8%
Ja
pa
n
Italy
Germ
any
UK
Fra
nce
EU
US
A
Kore
a
Austr
alia
G20
Cana
da
Sou
th A
fr.
Arg
en
tin
a
Me
xic
o
Russia
Turk
ey
Bra
zil
Sau
di A
rab
.
Ind
one
sia
Ind
ia
Chin
a
Transport consumption trend over 2000-2013
7
0% 10% 20% 30% 40% 50% 60% 70% 80% 90% 100%
Saudi Arabia
Mexico
Germany
South Korea
Argentina
EU
France
Italy
UK
Brazil
Turkey
South Africa
India
Indonesia
Japan
G20
USA
Canada
Australia
China
Russia
road rail domestic air water
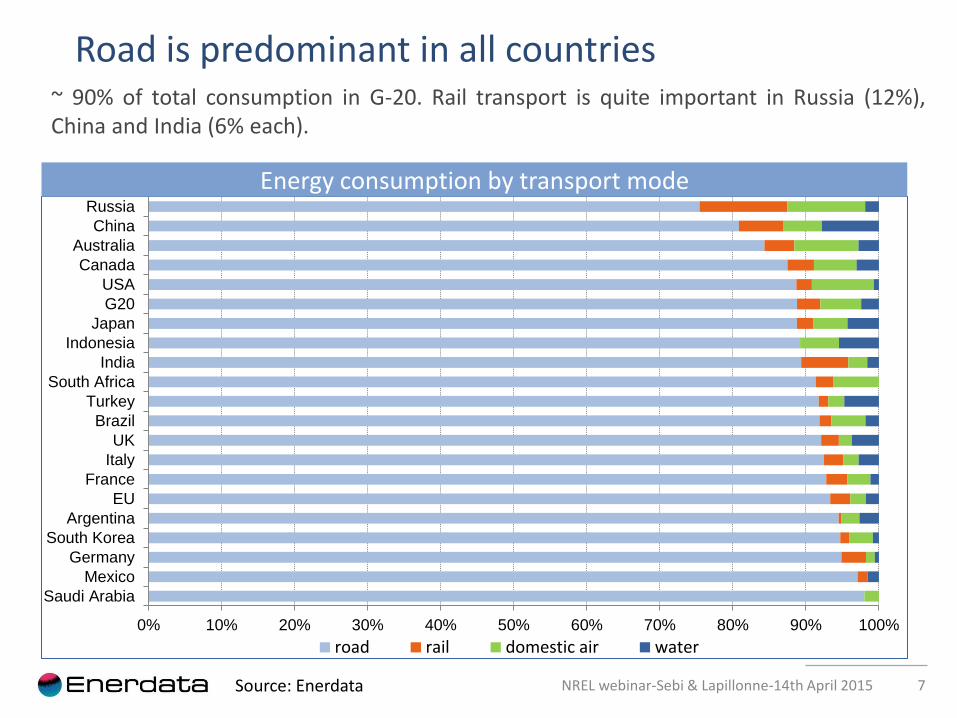
~ 90% of total consumption in G-20. Rail transport is quite important in Russia (12%), China and India (6% each).
Energy consumption by transport mode
NREL webinar-Sebi & Lapillonne-14th April 2015
Road is predominant in all countries
Source: Enerdata
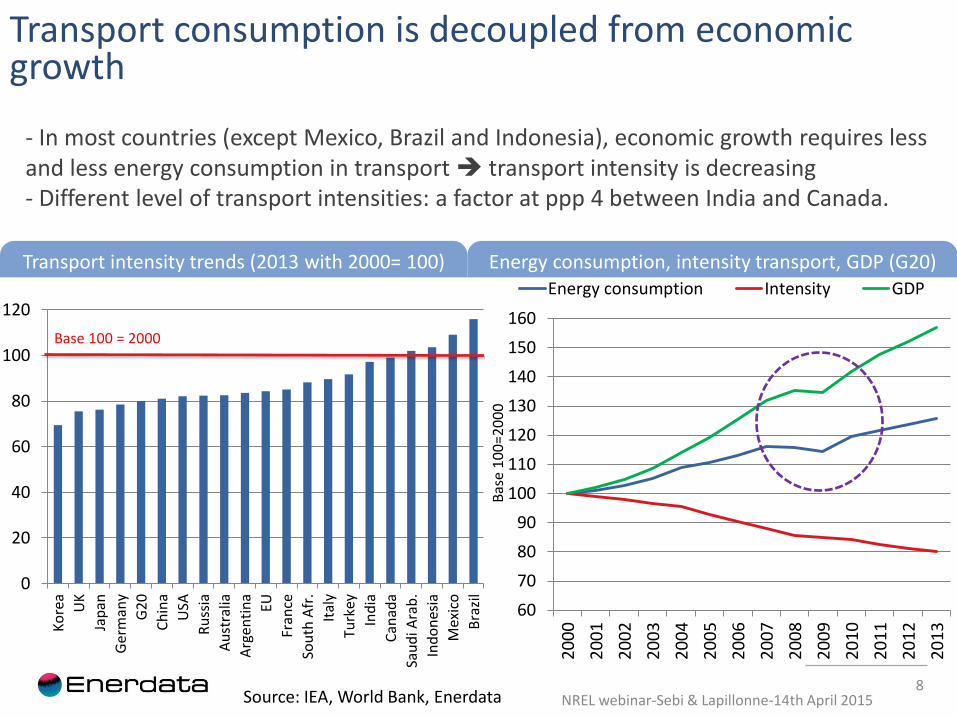
- In most countries (except Mexico, Brazil and Indonesia), economic growth requires less and less energy consumption in transport transport intensity is decreasing - Different level of transport intensities: a factor at ppp 4 between India and Canada.
8
60
70
80
90
100
110
120
130
140
150
160
20
00
20
01
20
02
20
03
20
04
20
05
20
06
20
07
20
08
20
09
20
10
20
11
20
12
20
13
Bas
e 1
00
=20
00
Energy consumption Intensity GDP
Source: IEA, World Bank, Enerdata
0
20
40
60
80
100
120
Ko
rea
UK
Jap
an
Ger
man
y
G2
0
Ch
ina
USA
Ru
ssia
Au
stra
lia
Arg
enti
na
EU
Fran
ce
Sou
th A
fr.
Ital
y
Turk
ey
Ind
ia
Can
ada
Sau
di A
rab
.
Ind
on
esia
Mex
ico
Bra
zil
Base 100 = 2000
Energy consumption, intensity transport, GDP (G20) Transport intensity trends (2013 with 2000= 100)
Transport consumption is decoupled from economic growth
NREL webinar-Sebi & Lapillonne-14th April 2015
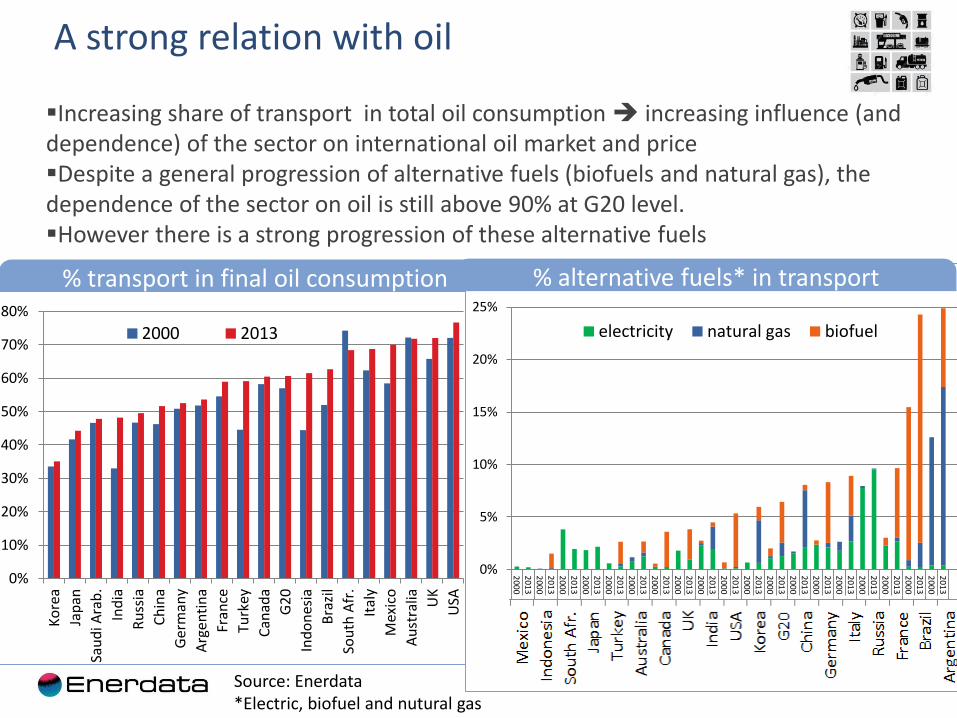
A strong relation with oil
9 Source: Enerdata *Electric, biofuel and nutural gas
0%
10%
20%
30%
40%
50%
60%
70%
80%
Ko
rea
Jap
an
Sau
di A
rab
.
Ind
ia
Ru
ssia
Ch
ina
Ger
man
y
Arg
enti
na
Fran
ce
Turk
ey
Can
ada
G2
0
Ind
on
esia
Bra
zil
Sou
th A
fr.
Ital
y
Mex
ico
Au
stra
lia UK
USA
2000 2013
% transport in final oil consumption
Increasing share of transport in total oil consumption increasing influence (and dependence) of the sector on international oil market and price Despite a general progression of alternative fuels (biofuels and natural gas), the dependence of the sector on oil is still above 90% at G20 level. However there is a strong progression of these alternative fuels
0%
5%
10%
15%
20%
25%
200
02
013
200
02
013
200
02
013
200
02
013
200
02
013
200
02
013
200
02
013
200
02
013
200
02
013
200
02
013
200
02
013
200
02
013
200
02
013
200
02
013
200
02
013
200
02
013
200
02
013
200
02
013
200
02
013
MexicoIndonesiaSouth Afr.JapanTurkeyAustraliaCanada UK India USA Korea G20 ChinaGermanyItaly RussiaFranceBrazilArgentina
electricity natural gas biofuel
% alternative fuels* in transport
NREL webinar-Sebi & Lapillonne-14th April 2015 10
B-Energy efficiency policies
and their impacts
Ou
tlin
e
1. Energy efficiency policies 2. Energy efficiency improvements:
• Cars • Transports of goods
3. Modal shift
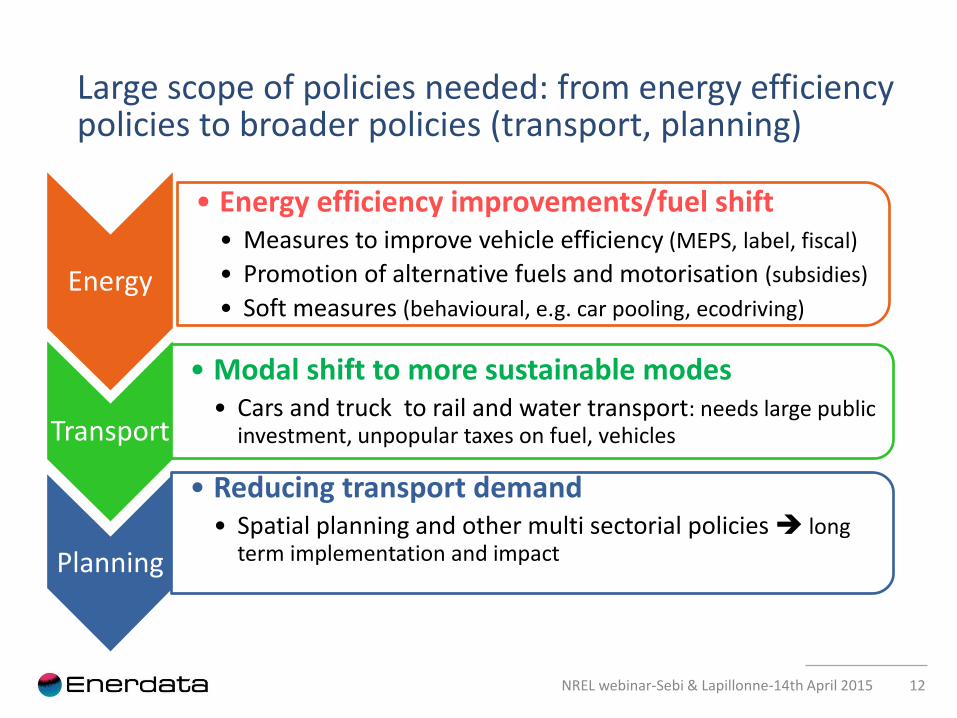
Large scope of policies needed: from energy efficiency policies to broader policies (transport, planning)
Energy
• Energy efficiency improvements/fuel shift • Measures to improve vehicle efficiency (MEPS, label, fiscal)
• Promotion of alternative fuels and motorisation (subsidies)
• Soft measures (behavioural, e.g. car pooling, ecodriving)
Transport
• Modal shift to more sustainable modes • Cars and truck to rail and water transport: needs large public
investment, unpopular taxes on fuel, vehicles
Planning
• Reducing transport demand • Spatial planning and other multi sectorial policies long
term implementation and impact
12 NREL webinar-Sebi & Lapillonne-14th April 2015
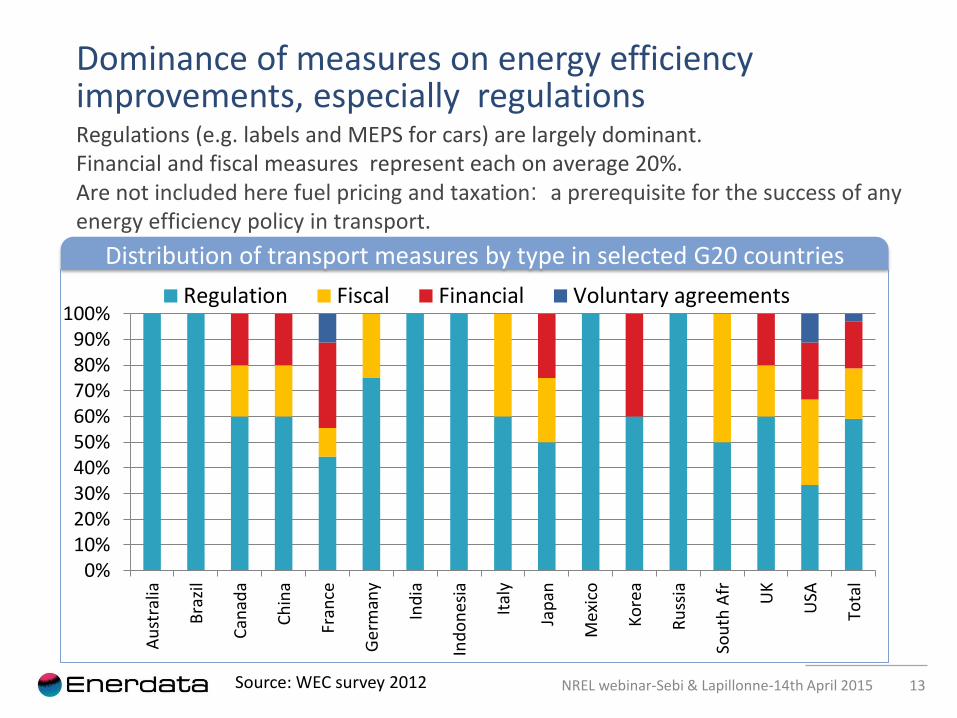
Regulations (e.g. labels and MEPS for cars) are largely dominant. Financial and fiscal measures represent each on average 20%. Are not included here fuel pricing and taxation: a prerequisite for the success of any energy efficiency policy in transport.
13
Distribution of transport measures by type in selected G20 countries
NREL webinar-Sebi & Lapillonne-14th April 2015
0%10%20%30%40%50%60%70%80%90%
100%
Au
stra
lia
Bra
zil
Can
ada
Ch
ina
Fran
ce
Ger
man
y
Ind
ia
Ind
on
esia
Ital
y
Jap
an
Mex
ico
Ko
rea
Ru
ssia
Sou
th A
fr
UK
USA
Tota
l
Regulation Fiscal Financial Voluntary agreements
Source: WEC survey 2012
Dominance of measures on energy efficiency improvements, especially regulations
14 Source: adapted from MURE data base http://www.muredatabase.org/
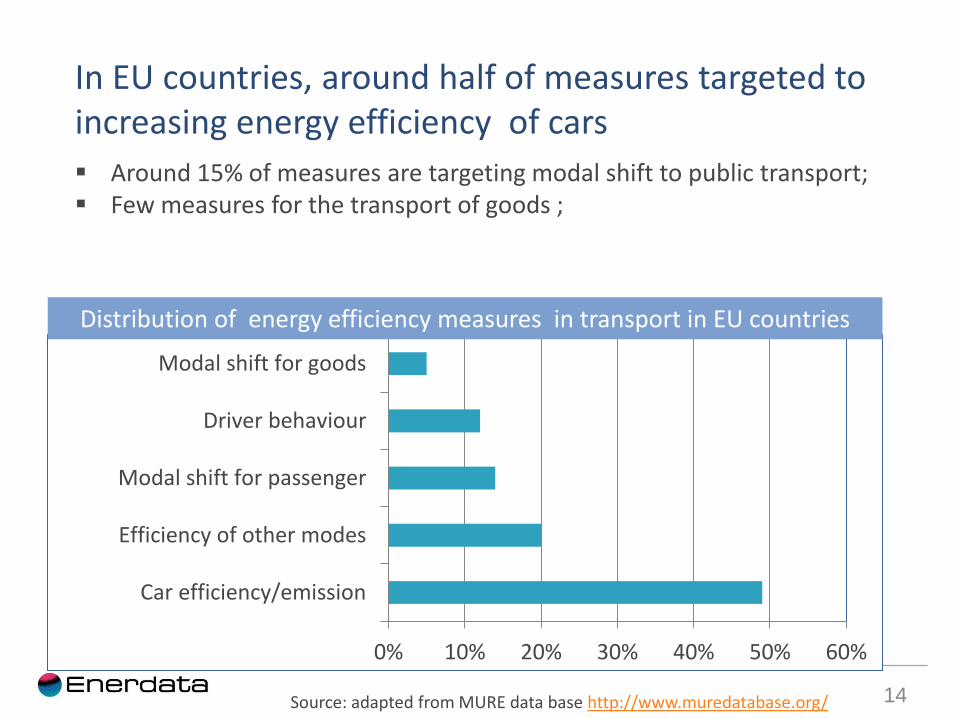
In EU countries, around half of measures targeted to increasing energy efficiency of cars
Around 15% of measures are targeting modal shift to public transport; Few measures for the transport of goods ;
0% 10% 20% 30% 40% 50% 60%
Car efficiency/emission
Efficiency of other modes
Modal shift for passenger
Driver behaviour
Modal shift for goods
Distribution of energy efficiency measures in transport in EU countries
Ou
tlin
e
1.Energy efficiency policies 2. Energy efficiency improvements:
• Cars • Transports of goods
3. Modal shift
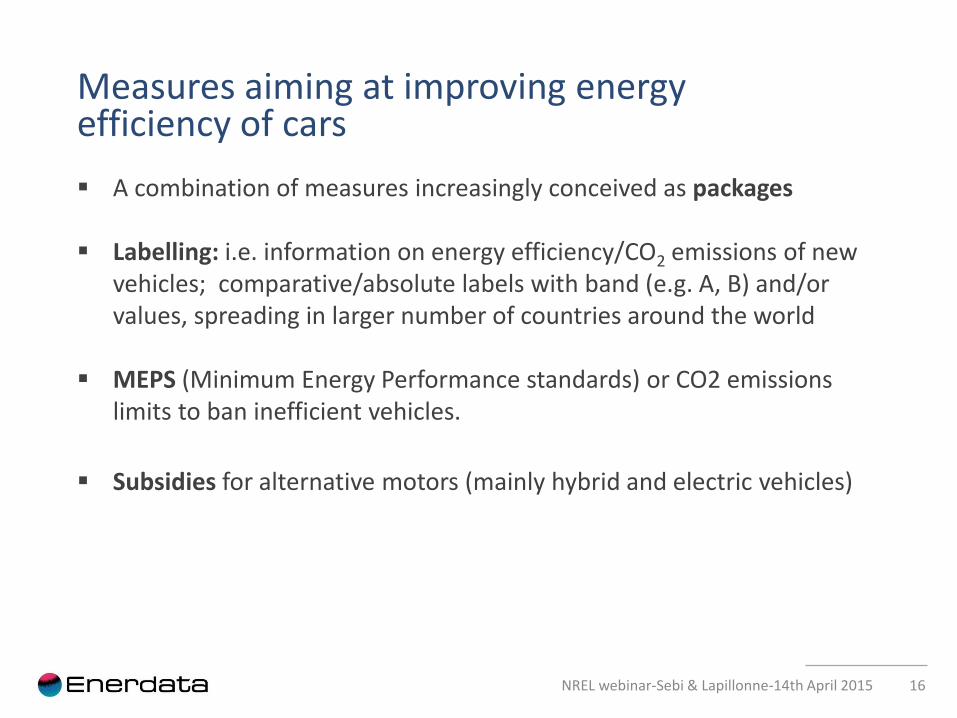
Measures aiming at improving energy efficiency of cars
A combination of measures increasingly conceived as packages
Labelling: i.e. information on energy efficiency/CO2 emissions of new vehicles; comparative/absolute labels with band (e.g. A, B) and/or values, spreading in larger number of countries around the world
MEPS (Minimum Energy Performance standards) or CO2 emissions limits to ban inefficient vehicles.
Subsidies for alternative motors (mainly hybrid and electric vehicles)
16 NREL webinar-Sebi & Lapillonne-14th April 2015
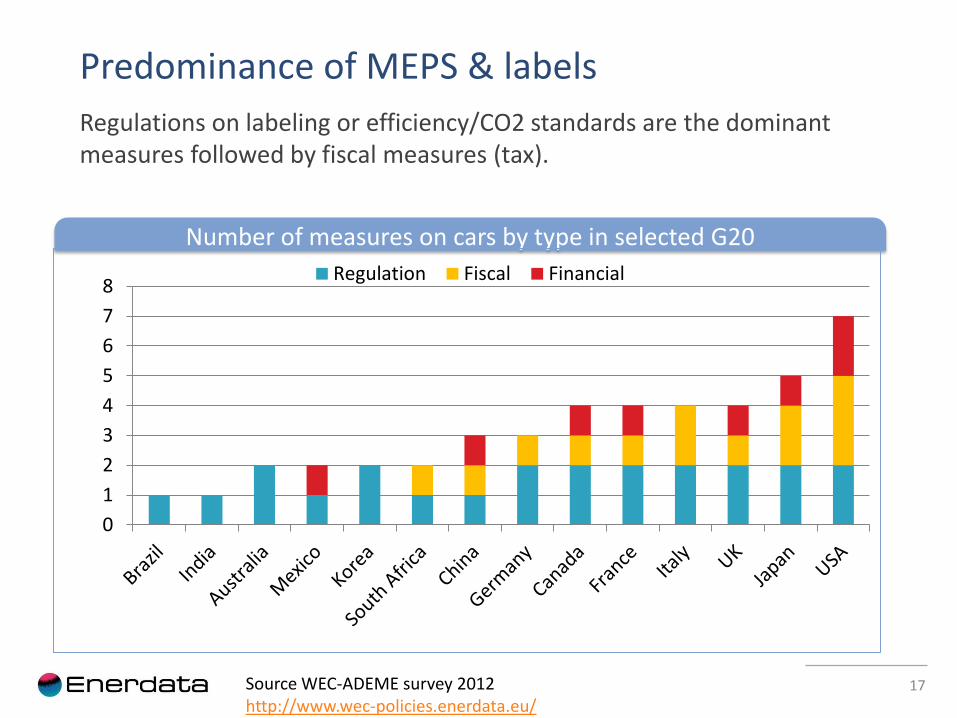
Regulations on labeling or efficiency/CO2 standards are the dominant measures followed by fiscal measures (tax).
17
Number of measures on cars by type in selected G20
0
1
2
3
4
5
6
7
8Regulation Fiscal Financial
Predominance of MEPS & labels
Source WEC-ADEME survey 2012 http://www.wec-policies.enerdata.eu/
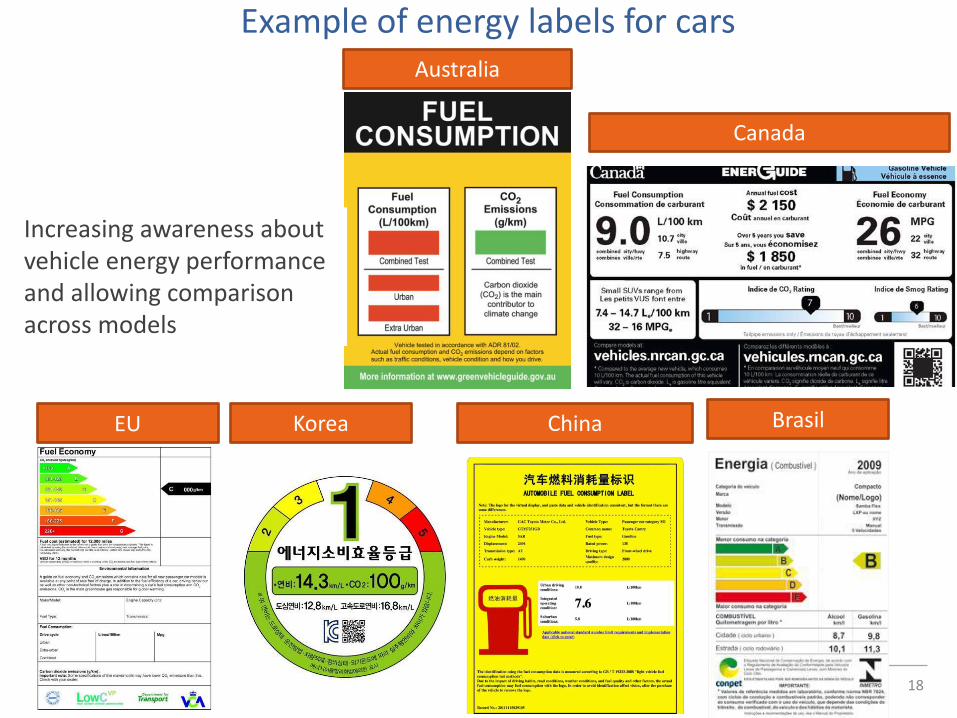
Example of energy labels for cars
18
Australia
Canada
China Korea EU Brasil
Increasing awareness about vehicle energy performance and allowing comparison across models
New developments of cars regulations
Energy/CO2 labelling o Extension to vans (e.g. Denmark and planned in France)
o Extension to used cars (e.g. voluntary in UK, Finland)
o Extension to car components (e.g. tyre in EU from 2012)
o Labelling in monetary unit (e.g. UK, New Zealand)
Other regulations: o Extension of MEPS to other vehicles than cars (e.g. vans in EU from
2017 or heavy duty vehicles in Canada, China, Japan and USA)
o Mandatory gear shift indicators, tyre pressure monitoring-TPMS (e.g. EU, USA, Korea, Russia in 2016)
19
Energy
NREL webinar-Sebi & Lapillonne-14th April 2015
Financial and fiscal incentives boost the car market
20
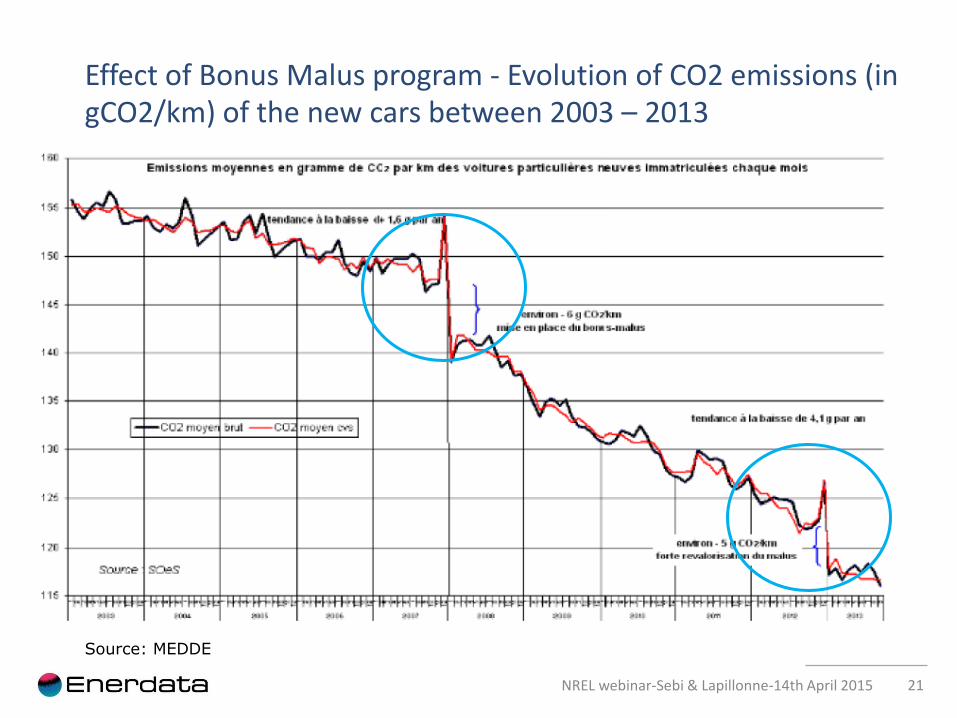
Fiscal incentives have become frequent after 2000 to promote purchase of efficient cars and discourage acquisition of cars with low fuel efficiency:
– Higher tax for the purchase of fuel-inefficient vehicles applied at purchase in many countries ;
– Combined tax and subsidy scheme (“bonus/malus” in France) : significant impact of the measure in 2008 and 2012
– Most EU countries applies a reduction of annual registration tax based on CO2 emission of the car
– Registration tax exemption applied for electric cars during 5 years in Italy
– New cars with extra emission over 120gCO2/km are taxed at a rate of US$9 per extra g/km (South Africa, since 2010)
Many countries have implemented subsidy scheme for electric and hybrid cars or even efficient cars (Japan, China, UK)
Scrappage schemes (grants offered to owners of old cars that buy new efficient ones) also accelerate efficient car market but only temporally
NREL webinar-Sebi & Lapillonne-14th April 2015
21
Effect of Bonus Malus program - Evolution of CO2 emissions (in gCO2/km) of the new cars between 2003 – 2013
Source: MEDDE
NREL webinar-Sebi & Lapillonne-14th April 2015
22
0123456789
10
Fran
ce
Ital
y
EU
Jap
an UK
Ind
ia
Ger
man
y
Mex
ico
Ko
rea
USA
Can
ada
Au
stra
lia
l/1
00
km
1995 2000 2011 2015 2020 2025
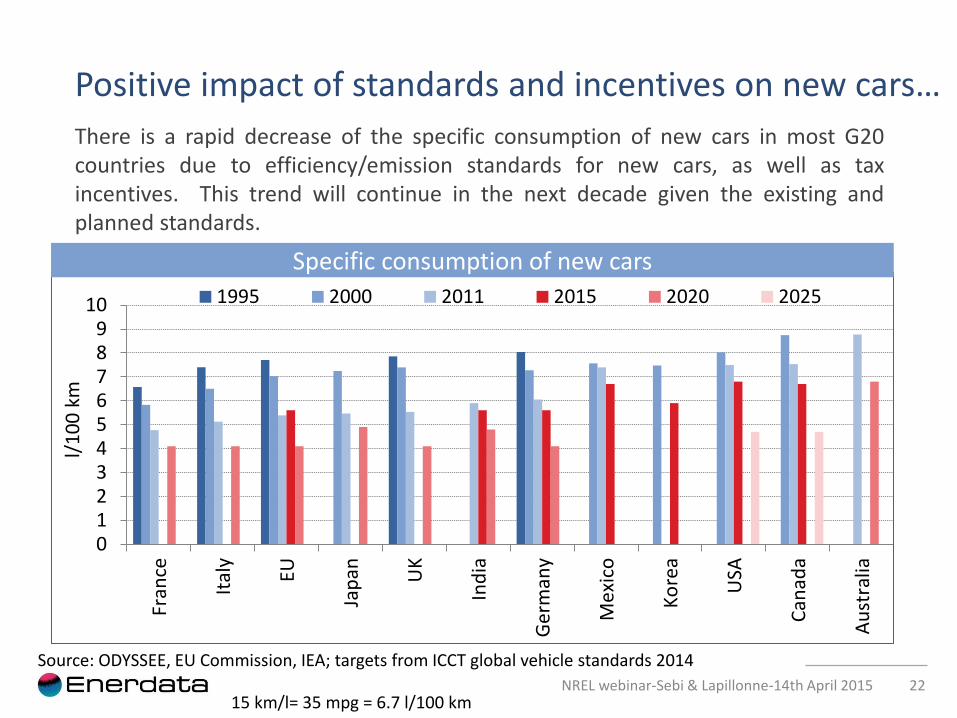
There is a rapid decrease of the specific consumption of new cars in most G20 countries due to efficiency/emission standards for new cars, as well as tax incentives. This trend will continue in the next decade given the existing and planned standards.
Specific consumption of new cars
Source: ODYSSEE, EU Commission, IEA; targets from ICCT global vehicle standards 2014
Positive impact of standards and incentives on new cars…
NREL webinar-Sebi & Lapillonne-14th April 2015 15 km/l= 35 mpg = 6.7 l/100 km
23
0
2
4
6
8
10
12
UK
Ita
ly
Ja
pa
n
Fra
nce
EU
Ge
rma
ny
Ca
na
da
US
A
l/1
00
km
2000 2011
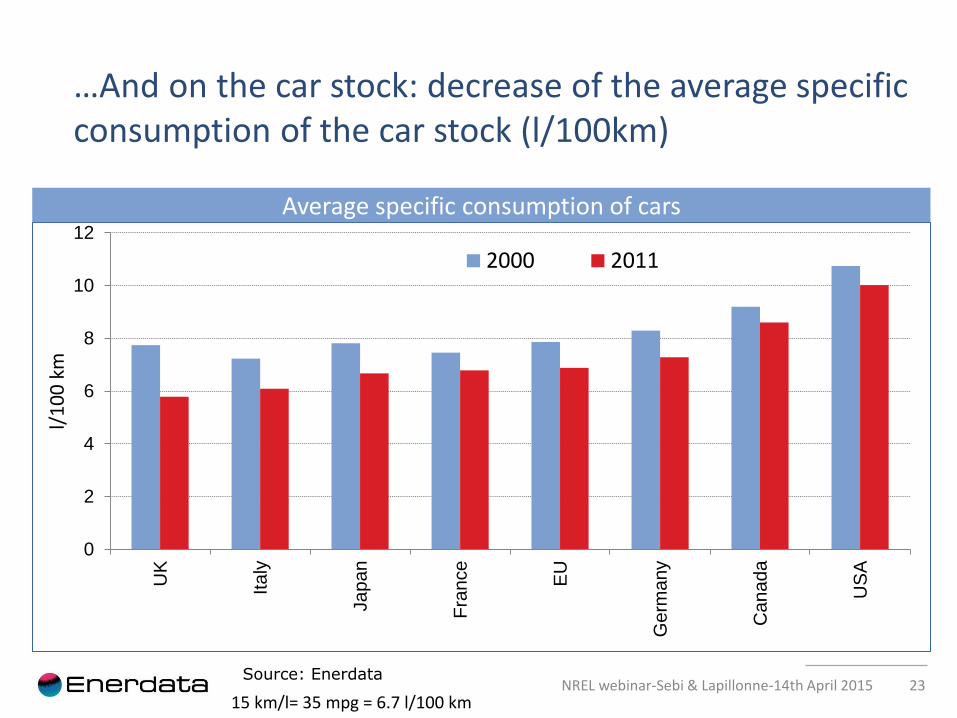
…And on the car stock: decrease of the average specific consumption of the car stock (l/100km)
Average specific consumption of cars
NREL webinar-Sebi & Lapillonne-14th April 2015 Source: Enerdata
15 km/l= 35 mpg = 6.7 l/100 km
24
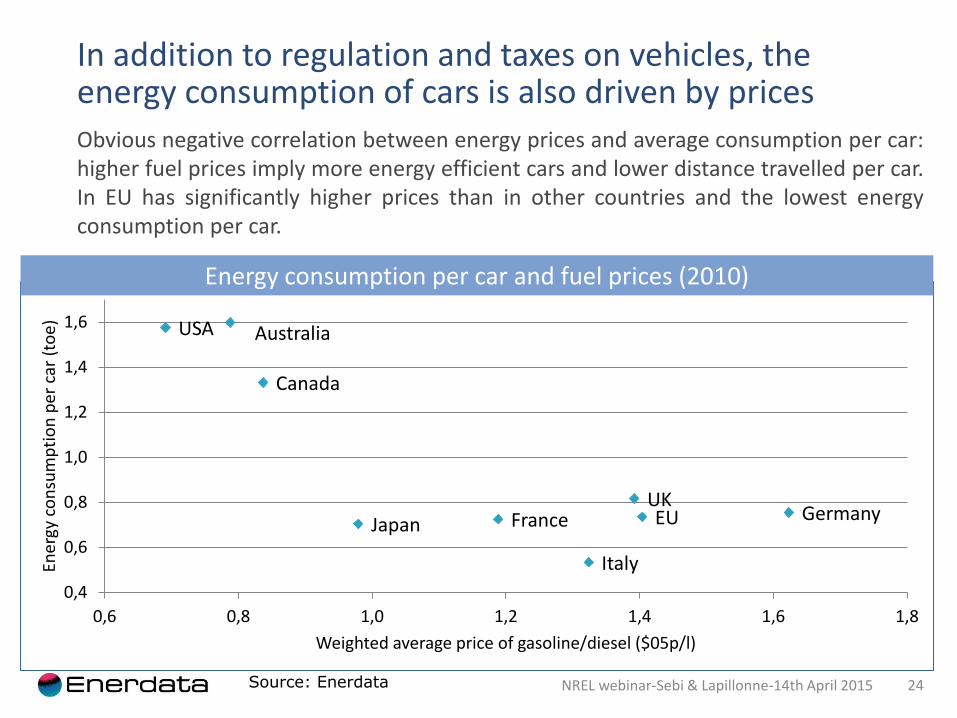
Obvious negative correlation between energy prices and average consumption per car: higher fuel prices imply more energy efficient cars and lower distance travelled per car. In EU has significantly higher prices than in other countries and the lowest energy consumption per car.
Canada
France Germany
Italy
Japan UK
USA Australia
EU
0,4
0,6
0,8
1,0
1,2
1,4
1,6
0,6 0,8 1,0 1,2 1,4 1,6 1,8
Ener
gy c
on
sum
pti
on
per
car
(to
e)
Weighted average price of gasoline/diesel ($05p/l)
NREL webinar-Sebi & Lapillonne-14th April 2015
In addition to regulation and taxes on vehicles, the energy consumption of cars is also driven by prices
Energy consumption per car and fuel prices (2010)
Source: Enerdata
Ou
tlin
e
1.Energy efficiency policies 2. Energy efficiency improvements:
• Cars • Transports of goods
3. Modal shift
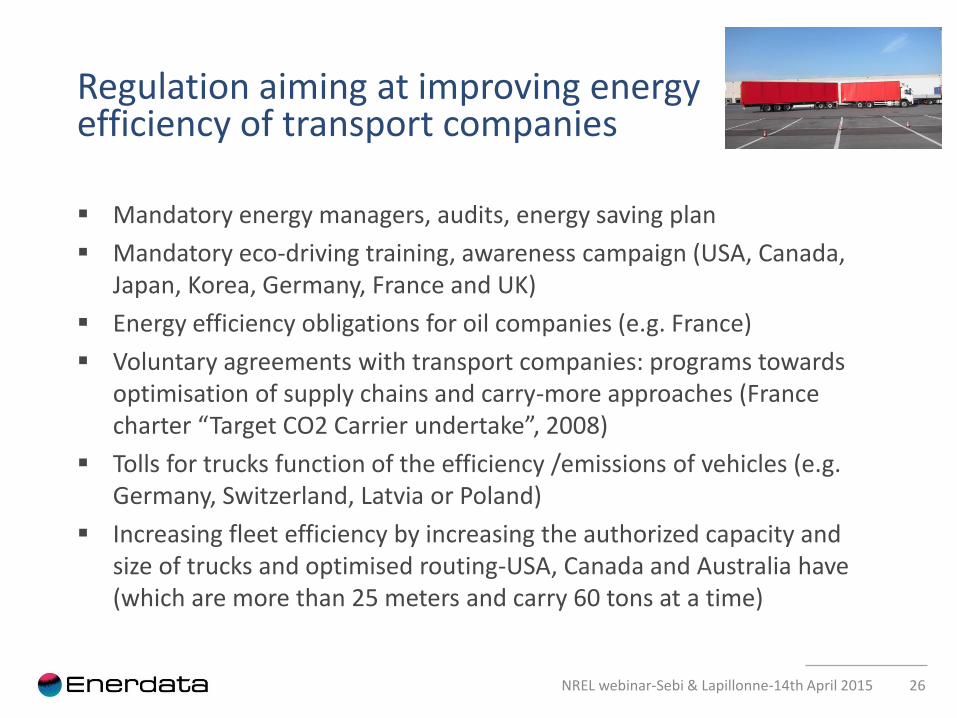
Regulation aiming at improving energy efficiency of transport companies
Mandatory energy managers, audits, energy saving plan
Mandatory eco-driving training, awareness campaign (USA, Canada, Japan, Korea, Germany, France and UK)
Energy efficiency obligations for oil companies (e.g. France)
Voluntary agreements with transport companies: programs towards optimisation of supply chains and carry-more approaches (France charter “Target CO2 Carrier undertake”, 2008)
Tolls for trucks function of the efficiency /emissions of vehicles (e.g. Germany, Switzerland, Latvia or Poland)
Increasing fleet efficiency by increasing the authorized capacity and size of trucks and optimised routing-USA, Canada and Australia have (which are more than 25 meters and carry 60 tons at a time)
26 NREL webinar-Sebi & Lapillonne-14th April 2015
27
0,00
0,02
0,04
0,06
0,08
0,10
0,12
0,14
0,16
Jap
an
Ital
y
Au
stra
lia UK
USA
Can
ada
Fran
ce
Ger
man
y
koe/
tkm
1990 2000 2011
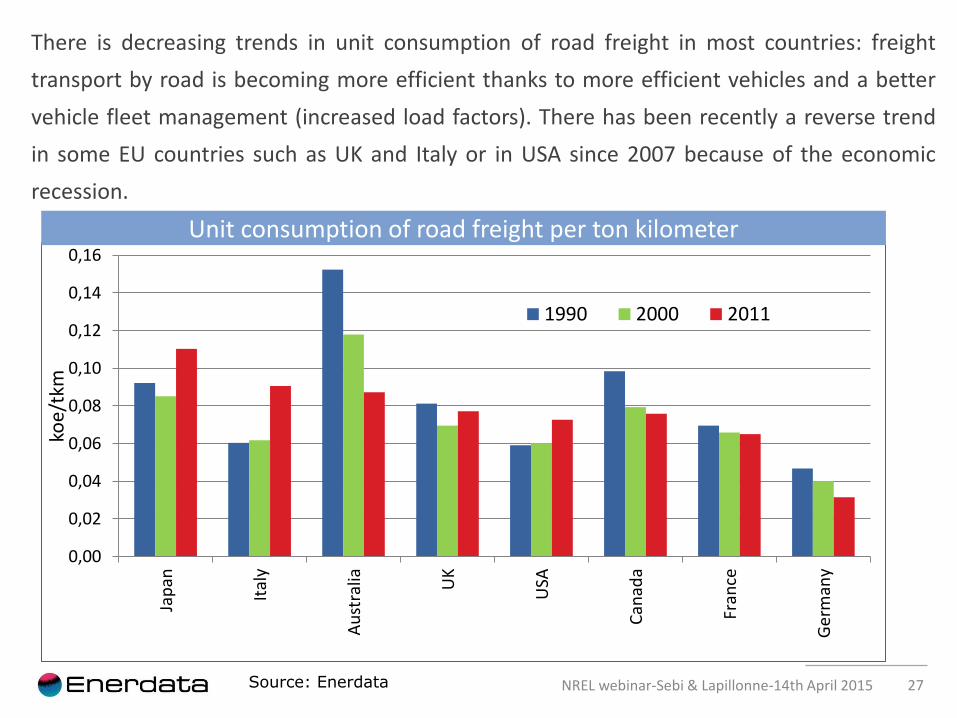
Unit consumption of road freight per ton kilometer
There is decreasing trends in unit consumption of road freight in most countries: freight
transport by road is becoming more efficient thanks to more efficient vehicles and a better
vehicle fleet management (increased load factors). There has been recently a reverse trend
in some EU countries such as UK and Italy or in USA since 2007 because of the economic
recession.
NREL webinar-Sebi & Lapillonne-14th April 2015 Source: Enerdata
Ou
tlin
e
1.Energy efficiency policies 2. Energy efficiency improvements:
• Cars • Transports of goods
3. Modal shift
Modal shift to more efficient modes
29
Many countries aim at shifting part of the passenger traffic from cars to public transport, such as development of urban rail transport (metro, tram, etc.), rapid bus systems, or high speed trains.
They also implement measures to shift part of the freight traffic from trucks to rail and water transport through the development of infrastructures for combined rail/road or water/road transport (e.g. Germany, France, Italy) but there exist strong barriers not allowing this change to happen easily.
NREL webinar-Sebi & Lapillonne-14th April 2015
Measures to promote modal shift?
30
Limit the use of cars and/or private car ownership:
o Limit cars use (e.g. fees to enter the city center (e.g. London); disincentives to cars (e.g. restricting parking, bus lanes, parking charges);
o Incentives to car pooling and car sharing (still limited but encouraging impact)
o Limiting car ownership (e.g. in in Beijing city in China with the License Plate Lottery System of very high tax in Denmark)
Incentives to water and rail transport for the transport of goods:
o Toll system for trucks (tax on per km driven) (e.g. Germany, Switzerland, Latvia or Poland);
o Incentives to companies to use railways instead of road (eg Australia);
Expansion/improvement of rail network ( e.g. development of high speed trains to substitute air transport); however some countries still have limited railway transportation given their size (Brazil, Australia).
NREL webinar-Sebi & Lapillonne-14th April 2015
31
0%
10%
20%
30%
40%
50%
60%
70%
80%
2000
2011
2000
2013
2000
2013
2000
2013
2000
2011
2000
2013
2000
2013
2000
2013
2000
2013
2000
2013
2000
2013
2000
2013
2005
2013
Turkey USA Australia Canada India UK Germany France Italy China Japan Korea Russia
Rail Bus
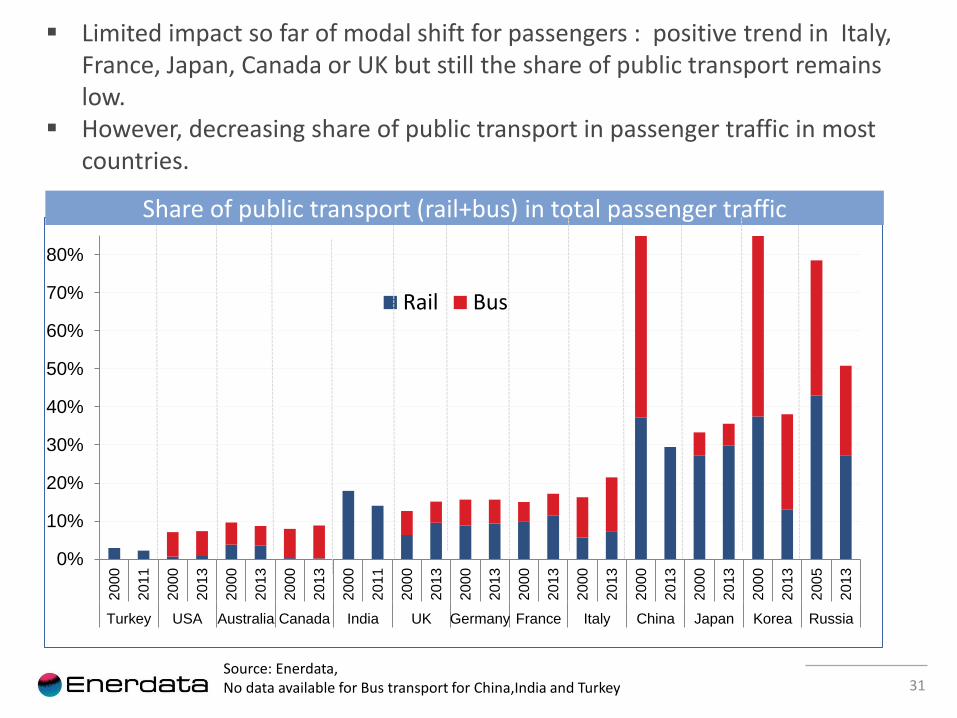
Share of public transport (rail+bus) in total passenger traffic
Source: Enerdata, No data available for Bus transport for China,India and Turkey
Limited impact so far of modal shift for passengers : positive trend in Italy, France, Japan, Canada or UK but still the share of public transport remains low.
However, decreasing share of public transport in passenger traffic in most countries.
32
0
10
20
30
40
50
60
70
80
90
100
Ru
ssia
Ko
rea
Ch
ina
Ca
na
da
Au
str
alia
US
A
Ja
pa
n
Ind
ia
Bra
zil
Ge
rma
ny
Me
xic
o
Fra
nce
Ita
ly
UK
Tu
rke
y
%
2000 2011
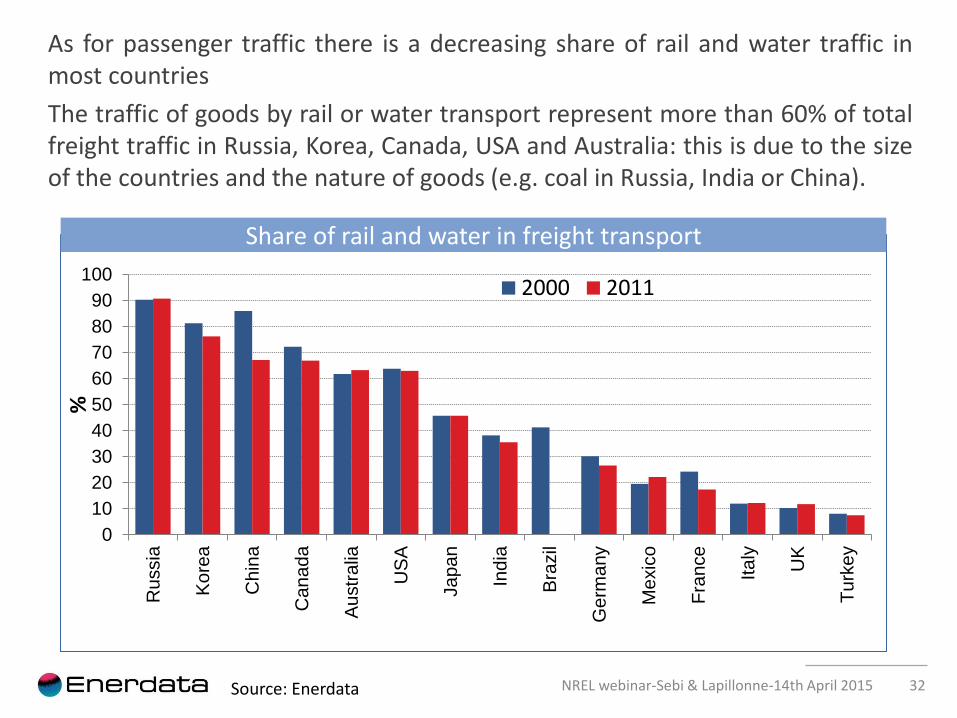
As for passenger traffic there is a decreasing share of rail and water traffic in most countries
The traffic of goods by rail or water transport represent more than 60% of total freight traffic in Russia, Korea, Canada, USA and Australia: this is due to the size of the countries and the nature of goods (e.g. coal in Russia, India or China).
Share of rail and water in freight transport
Source: Enerdata NREL webinar-Sebi & Lapillonne-14th April 2015
NREL webinar-Sebi & Lapillonne-14th April 2015 33
Conclusions
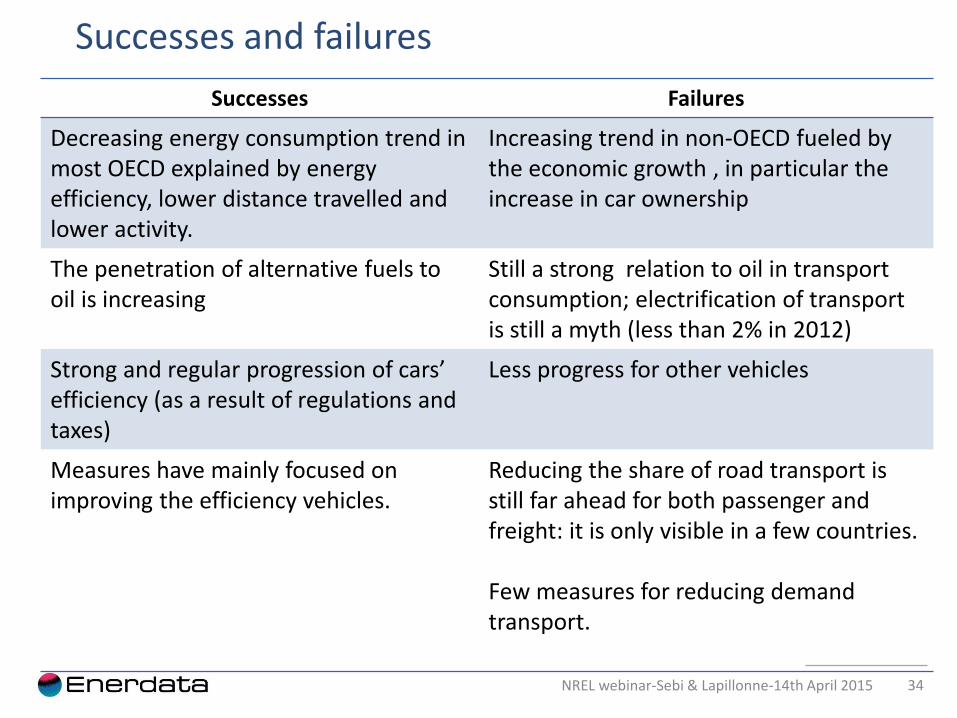
Successes and failures
34
Successes Failures
Decreasing energy consumption trend in most OECD explained by energy efficiency, lower distance travelled and lower activity.
Increasing trend in non-OECD fueled by the economic growth , in particular the increase in car ownership
The penetration of alternative fuels to oil is increasing
Still a strong relation to oil in transport consumption; electrification of transport is still a myth (less than 2% in 2012)
Strong and regular progression of cars’ efficiency (as a result of regulations and taxes)
Less progress for other vehicles
Measures have mainly focused on improving the efficiency vehicles.
Reducing the share of road transport is still far ahead for both passenger and freight: it is only visible in a few countries. Few measures for reducing demand transport.
NREL webinar-Sebi & Lapillonne-14th April 2015
35
-35
-30
-25
-20
-15
-10
-5
0
5
total goods passengers
Mto
e
consumption variation activity modal shift energy savings
Air transport included Source : ODYSSEE
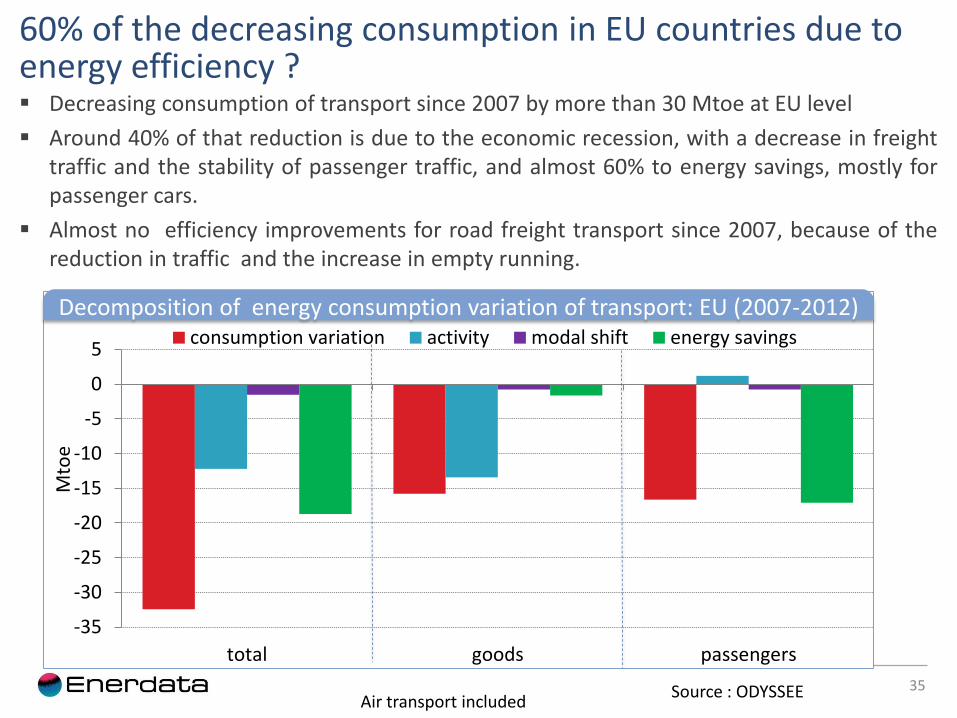
Decreasing consumption of transport since 2007 by more than 30 Mtoe at EU level
Around 40% of that reduction is due to the economic recession, with a decrease in freight traffic and the stability of passenger traffic, and almost 60% to energy savings, mostly for passenger cars.
Almost no efficiency improvements for road freight transport since 2007, because of the reduction in traffic and the increase in empty running.
60% of the decreasing consumption in EU countries due to energy efficiency ?
Decomposition of energy consumption variation of transport: EU (2007-2012)

Thank you for your attention !
www.enerdata.net
Contact:
Carine Sebi
Bruno Lapillonne
37
-20%
-15%
-10%
-5%
0%
5%
10%
15%
Ca
na
da
US
A
Fra
nce
Germ
any
Ja
pa
n
UK
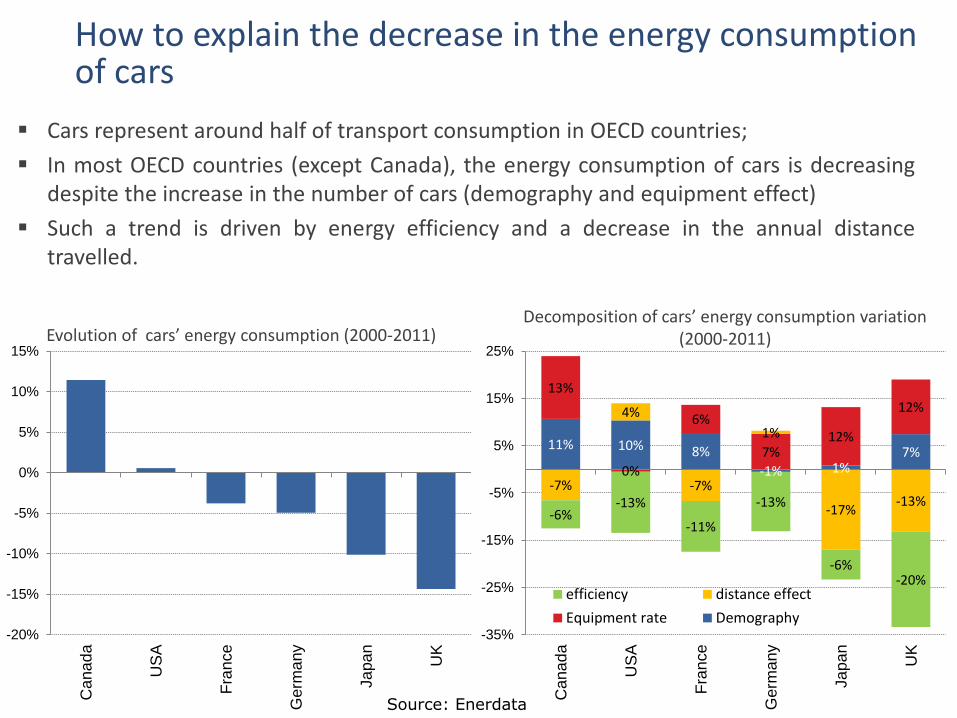
Cars represent around half of transport consumption in OECD countries;
In most OECD countries (except Canada), the energy consumption of cars is decreasing despite the increase in the number of cars (demography and equipment effect)
Such a trend is driven by energy efficiency and a decrease in the annual distance travelled.
Evolution of cars’ energy consumption (2000-2011)
11% 10% 8%
-1% 1% 7%
13%
0%
6%
7% 12%
12%
-7%
4%
-7%
1%
-17% -13%
-6% -13%
-11%
-13%
-6% -20%
-35%
-25%
-15%
-5%
5%
15%
25%
Ca
na
da
US
A
Fra
nce
Germ
any
Ja
pa
n
UK
efficiency distance effect
Equipment rate Demography
Decomposition of cars’ energy consumption variation (2000-2011)
How to explain the decrease in the energy consumption of cars
Source: Enerdata