energy efficiency at vsp -...
TRANSCRIPT

PRESENTATION
For
CII GBC NATIONAL AWARD
FOR EXCELLENCE IN
ENERGY MANAGEMENT
By
Rashtriya Ispat Nigam Limited
VISAKHAPATNAM STEEL PLANT

TEAM MEMBERS
T K DEYDGM(EMD) I/c & Energy Manager
K SudhakarDGM(O) &
Certified Energy Auditor
S KumarMgr.(EMD)

CONTENTS
COMPANY PROFILE PROCESS FLOWLIST OF PROJECTS WITH COST BENIFITSREDUCTION OF SPECIFIC ENERGY CONSUMPTIONBENCH MARKING(GLOBAL AND NATIONAL BENCH MARKING)ENCON PROJECTS TO REDUCE GAPINNOVATIVE PROJECTSENVIRONMENTAL PROJECTS & PROJECTS LINKING WITHCARBON EMISSION REDUCTION EMPLOYEE INVOLVEMENT & TEAM WORKENCON PROJECTS FOR NEXT THREE YEARSIMPLEMENTATION OF CORRECTIVE AND PREVENTIVE ACTIONSRENEWABLE ENERGY SOURCES,UTILISATION OF WASTEBEST PRACTICES IMPLEMENTED AMONG VENDORS,ASSOCIATESCONCLUSION
1
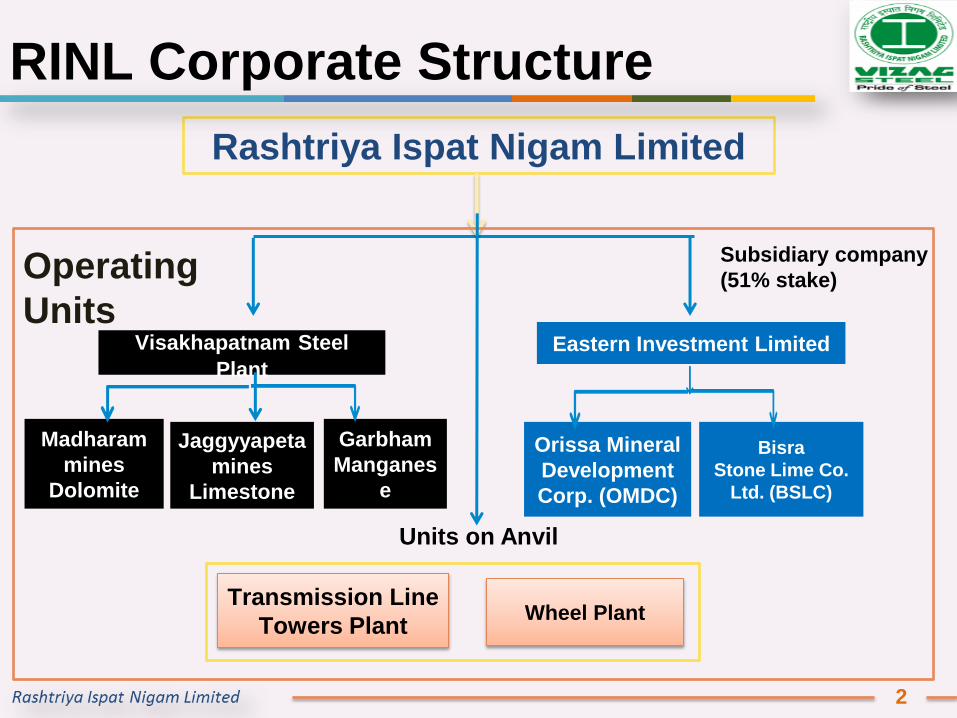
Rashtriya Ispat Nigam Limited
Eastern Investment Limited
Bisra
Stone Lime Co.
Ltd. (BSLC)
Visakhapatnam Steel
Plant
Orissa Mineral
Development
Corp. (OMDC)
Operating
Units
Madharam
mines
Dolomite
Jaggyyapeta
mines
Limestone
Garbham
Manganes
e
Subsidiary company
(51% stake)
RINL Corporate Structure
Units on Anvil
Wheel PlantTransmission Line
Towers Plant
2
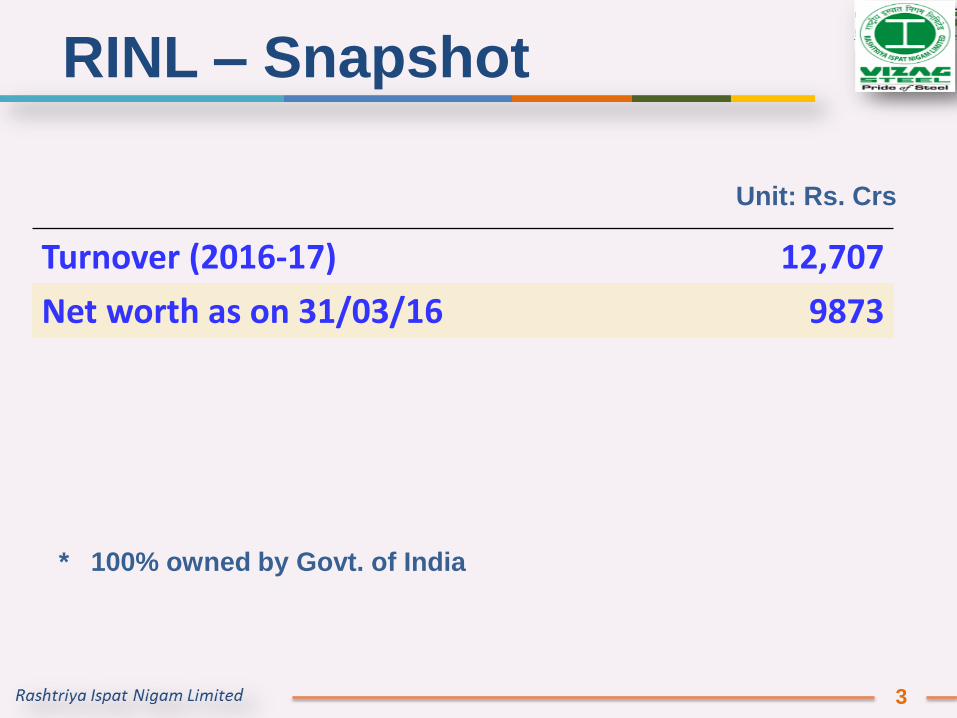
Turnover (2016-17) 12,707
Net worth as on 31/03/16 9873
Unit: Rs. Crs
* 100% owned by Govt. of India
RINL – Snapshot
3
1. 66
RINL - Snapshot
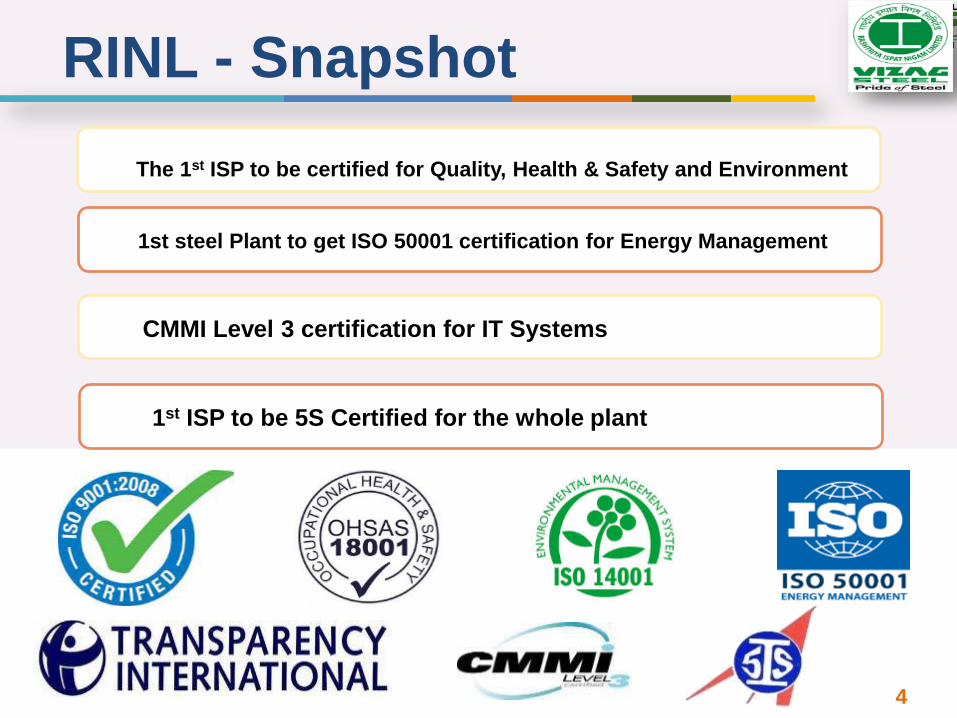
The 1st ISP to be certified for Quality, Health & Safety and Environment
1st steel Plant to get ISO 50001 certification for Energy Management
CMMI Level 3 certification for IT Systems
1st ISP to be 5S Certified for the whole plant
4
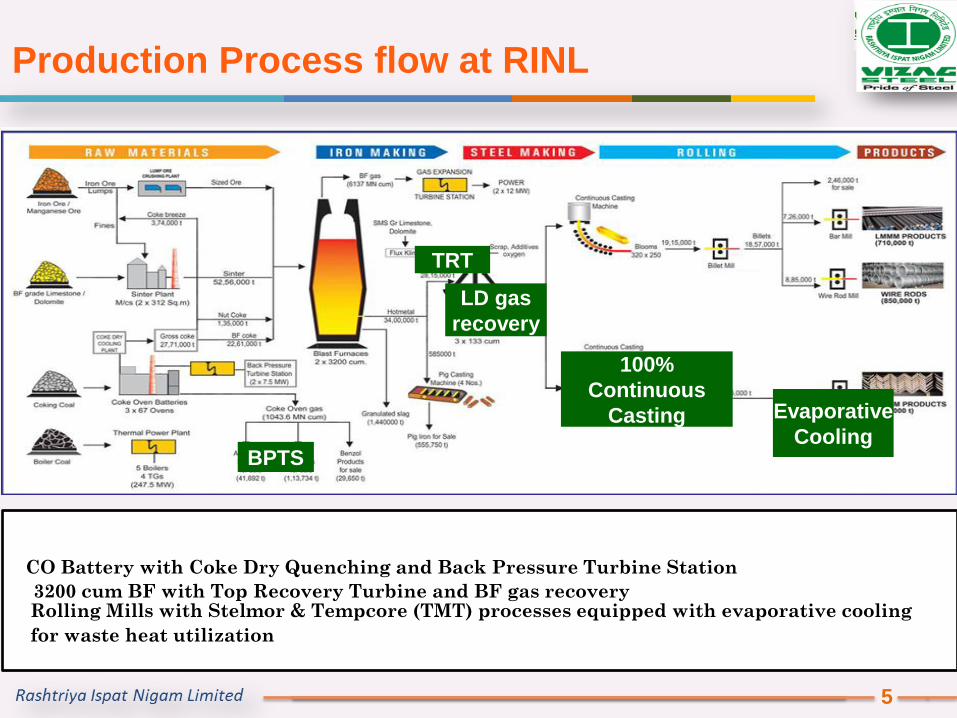
BPTS
TRT
100%
Continuous
Casting
LD gas
recovery
Evaporative
Cooling
CO Battery with Coke Dry Quenching and Back Pressure Turbine Station
3200 cum BF with Top Recovery Turbine and BF gas recoveryRolling Mills with Stelmor & Tempcore (TMT) processes equipped with evaporative cooling
for waste heat utilization
Production Process flow at RINL
5
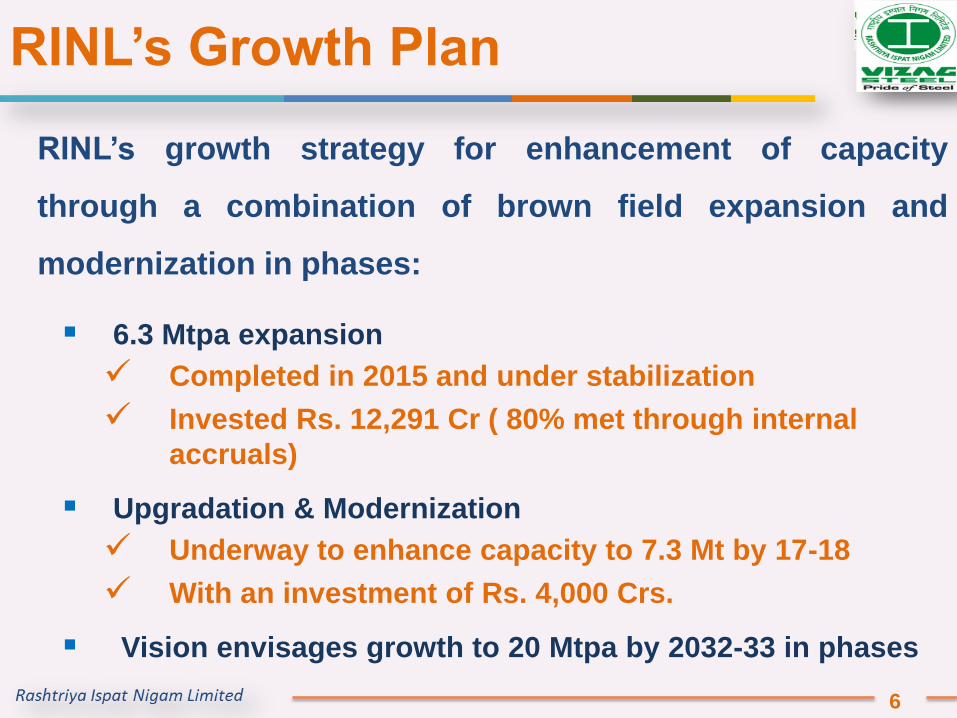
RINL’s growth strategy for enhancement of capacity
through a combination of brown field expansion and
modernization in phases:
6.3 Mtpa expansion
Completed in 2015 and under stabilization
Invested Rs. 12,291 Cr ( 80% met through internal
accruals)
Upgradation & Modernization
Underway to enhance capacity to 7.3 Mt by 17-18
With an investment of Rs. 4,000 Crs.
Vision envisages growth to 20 Mtpa by 2032-33 in phases
RINL’s Growth Plan
6

Power Generation capacity from Waste Energy (MW)
7

ENCON Projects with Investment (2016-17)
8
S.No. Title of ProjectEnergy Savings in
Investment (Rs Million)
Gcal/MKwh Rs Millions
1Improvement in Pulverized coal injectionfrom 5.1 to 23.4 Kg/tHM at Blast Furnace
128418 124.69 1350
2 Energy saving through Billet Caster 202280 196.41 5520
3Improvement in Power Generation from CPB4turbine station of Battery-4
5.87 38.94 850
4Improvement in Power Generation at TopPressure Recovery Turbine station of BF-3
41.17 273.16 800
5Improvement in Power generation from SHRPPof SP-1
4.99 33.11 2502

ENCON Projects with NO/Little Investment (2016-17)
9
S.No. Title of ProjectEnergy Savings in
Gcal/MKwh Rs Millions
1Improvement in benzol yield at coke oven from0.44% to 0.47%
11482 11.15
2Reduction of Sp. power Consumption at cokeoven from 59.97 to 49.28 Kwh/tDC
10.26 68.05
3Reduction of Sp. Power Consumption at SP-1from 61.87 to 58.88 Kwh/tGS
10.46 69.42
4Reduction of Sp. heat Consumption at SP-2 from15 to 10 Mcal/tGS
12582 12.22
5Reduction of Sp. Power Consumption at SP-2from 61.89 to 58.59 Kwh/tGS
8.30 55.10
6Reduction in fuel rate at Blast Furnace from560.9 to 537.2 Kg/tHM
380415 369.38
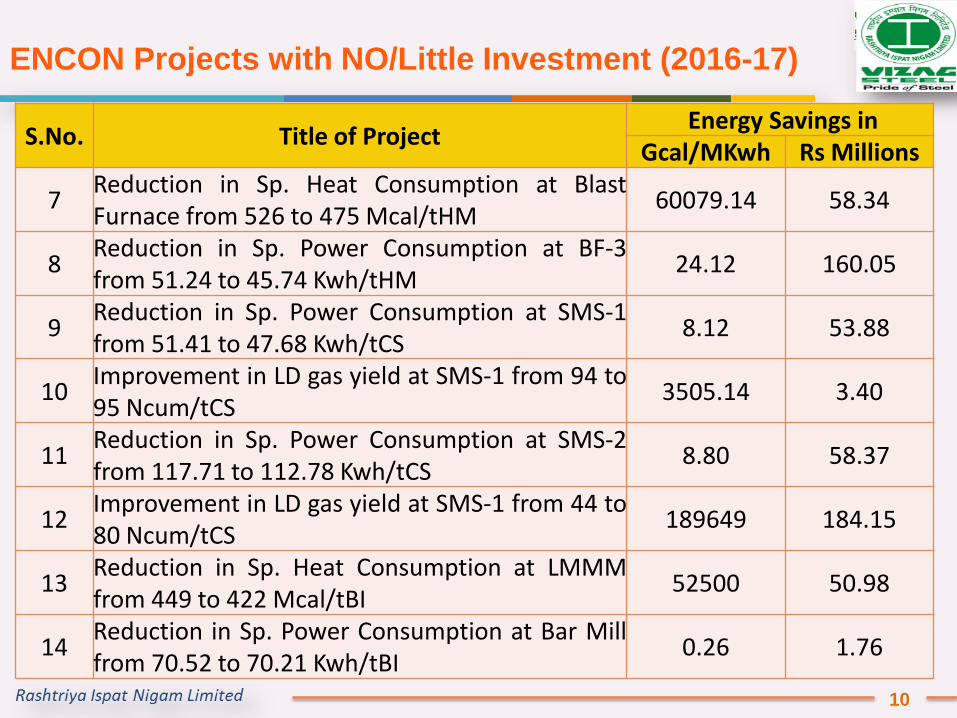
ENCON Projects with NO/Little Investment (2016-17)
10
S.No. Title of ProjectEnergy Savings in
Gcal/MKwh Rs Millions
7Reduction in Sp. Heat Consumption at BlastFurnace from 526 to 475 Mcal/tHM
60079.14 58.34
8Reduction in Sp. Power Consumption at BF-3from 51.24 to 45.74 Kwh/tHM
24.12 160.05
9Reduction in Sp. Power Consumption at SMS-1from 51.41 to 47.68 Kwh/tCS
8.12 53.88
10Improvement in LD gas yield at SMS-1 from 94 to95 Ncum/tCS
3505.14 3.40
11Reduction in Sp. Power Consumption at SMS-2from 117.71 to 112.78 Kwh/tCS
8.80 58.37
12Improvement in LD gas yield at SMS-1 from 44 to80 Ncum/tCS
189649 184.15
13Reduction in Sp. Heat Consumption at LMMMfrom 449 to 422 Mcal/tBI
52500 50.98
14Reduction in Sp. Power Consumption at Bar Millfrom 70.52 to 70.21 Kwh/tBI
0.26 1.76

ENCON Projects with NO/Little Investment (2016-17)
11
S.No. Title of ProjectEnergy Savings in
Gcal/MKwh Rs Millions
15Reduction in Sp. Heat Consumption at WRM from 250to 249 Mcal/tBl
1018 0.99
16Reduction in Sp. Power Consumption at WRM from124.8 to 122.54 Kwh/tBI
2.30 15.26
17Reduction in Sp. Heat Consumption at WRM-2 from289 to 270 Mcal/tBl
7739.61 7.52
18Reduction in Sp. Power Consumption at WRM-2 from340.9 to 287.5 Kwh/tBI
21.75 144.31
19Reduction in Sp. Power Consumption at MMSM from83.37 to 81.42 Kwh/tBI
1.53 10.15
20Reduction in Sp. Power Consumption at CRMP from67.34 to 66.36 Kwh/tBI
0.41 2.71

YEARNo of
Projects
Thermal
Savings
(Gcals)
Electrical
Savings
(Million KWH)
Saving
s in
Rs.Cr
Investm
ent
In Rs Cr
2013-14 10 145710 15.3 19.1 25
2014-15 10 54172 176.6 59.4 332
2015-16 16 1186320 50.1 144.5 410
2016-17 33 1049671 148.3 200.3 687
Summary of the Projects identified & Implemented
12

Energy Consumption
39.4538.8
36.83
2014-15 2015-16 2016-17
Thermal Energy Consumption(GJ/tCS)
719
715
697
2014-15 2015-16 2016-17
Electrical Energy Consumption(Kwh/tcS)
8.24
8.17
8.122
2014-15 2015-16 2016-17
SEC as PAT scheme(Gcal/tCS)

Sp. Energy Consumption-Gcal/tCS
6.376.40 6.39
2014-15 2015-16 2016-17
13

Benchmarking of Energy Consumption-Gcal/tCS
6.396.58
5.70
6.36
RINL SAIL-BSP TATA Steel SAIL-DSP
14

International Bench Marking of SEC(Gcal/tCS)
6.060
5.439
4.000
4.500
5.000
5.500
6.000
6.500
7.000
RINL Nippon Steel
Unit
15

Bench Marking with Nippon Steel(2009-10)
Energy(2009-10) GHG EmissionGap :0.661 Gcal/tCS
RINL NSC RINL NSC 1) Scrap usage : 200 kg/thm( As per Japanese
Industry)-RINL:80 kg/tcS
2) All Energy Conservation technologies
Coke Dry Quenching,
Top Pressure Recovery Turbine,
BOF Gas Recovery,
Sinter Cooler waste heat recovery
Pulverized Coal Injection,
BF stoves Heat Recovery,
Billet Caster,
Hot Charging,
Regenerative Burners,
Coal Moisture Control
Sensible Heat recovery from BOF gas
3) Waste Plastics Injection and tires(0.2 million tons-
6 kg/tCS)
4) Petro fuel 16 lts/Tcs
6.06 5.439 2.615 1.943
16

Energy Conservation Technologies in Expansion and
Modernization
NAME OF THE PROJECT ENERGY
SAVINGS
(GCALS)
GHG
EMISSION
REDUCTION
(tCo2)
PCI IN BLAST FURNACES 1518750 910164
POWER GEN FROM COOLING OF COKE in Batt-4 207384 124282
ENERGY EFFICIENT BURNERS AND WHR IN SP-2. 73349 89294
20.6 MW WHR ON SINTER STRAIGHT-LINE COOLER 368130 220612
BF-3 STOVES WASTE HEAT RECOVERY. 149008 43958
BILLET CASTER IN SMS-2 1807185 1083030
ENERGY EFFICIENT VERTICAL SHAFT KILN 141000 51912
ENERGY EFFICIENT AIR SEPARATION UNIT 61939 23227
SINTER PLANT 1&2 CAPACITY ENHANCEMENT 279125 167475
BF-1 &2 MODERNISATION & UPGRADATION 652800 391200
5196731 3081927
17

Sl No Name of Energy Conservation Activity Year
1Power Generation from Gas Expansion Turbine station of BF-1
2017-18
2Pulverized Coal Injection in Blast Furnace-3(upto 100 kg/tHM)
2017-18
3Capacity Utilization of 120 MW BF gas captive power plant
2017-18
4 Revamping of Sinter Machines 1&2 2017-18
5Revamping of Billet Mill Reheating furnaces (Two
Furnaces)2018-19
Energy Conservation Projects identified for next three
years
23

Environmental Projects & Projects linking with Carbon
Emission Reduction
Projects Benefits
Revamping of Burden handling & Cast House FE
system of Blast Furnace-1.
Reduce Dust emissions
Balacheruvu, Waste Water Treatment Plant -
Commissioned in July 2014.
253 Million Gallons
Commissioning of Appikonda Waste Water Treatment
Plant
220 Million Gallons
The Digital display board at Main Gate was
inaugurated by CMD on 5th June 2014 for displaying
the CAAQM and Stack analyzers.
Awareness
Dry Fog Dust Suppression System (DSS) in
Expansion area of Raw Material Handling Plant, Sinter
Plant & Blast Furnace.
Reduced fugitive emissions
Rain water harvesting scheme near 18 MLD plant Ground water recharging
18

No of Projects Registered(BF3 TRT,COB4 , BF3 WHR, BF gas based CPP-2)
4
Verification completed (COB4)* 1
* UNFCCC issued 70,516 CER to RINL
Environmental Projects & Projects linking with Carbon
Emission Reduction
19

Name of ProjectsRegistration
NumberExpected
CERS
BF3 Top Pressure Recovery Project 9613 60410
COB-4 Turbine at Battery-4 9988 68540
Waste Heat Recovery from Stoves of BF-3
10024 44932
120 MW Waste Gas Based Captive Power Plant
Under Registration
602433
Environmental Projects & Projects linking with Carbon
Emission Reduction
20
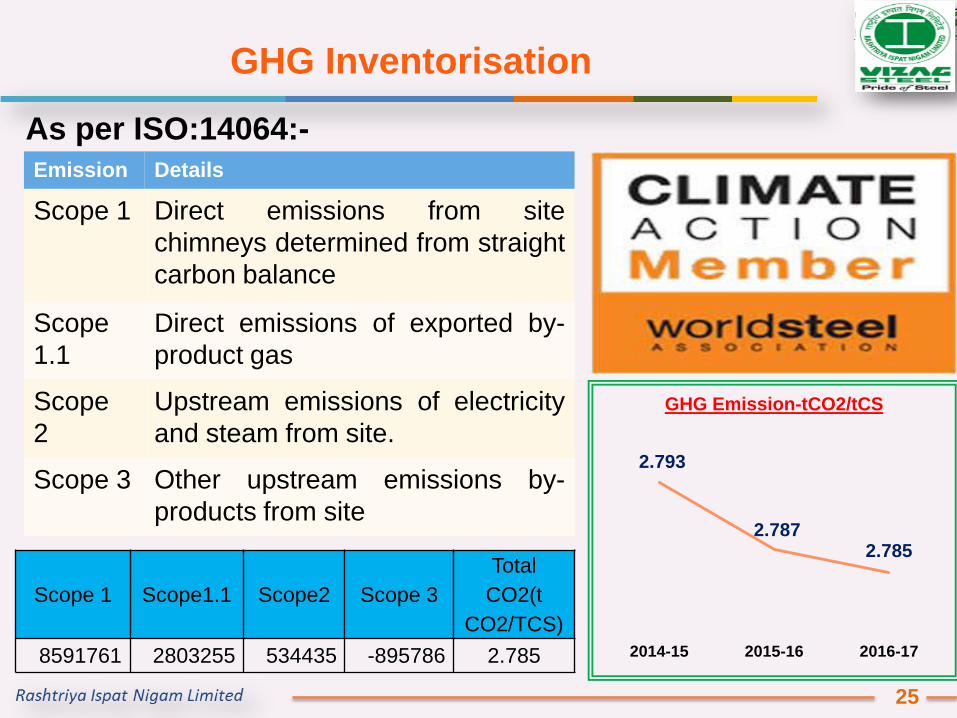
GHG Inventorisation
25
Emission Details
Scope 1 Direct emissions from site
chimneys determined from straight
carbon balance
Scope
1.1
Direct emissions of exported by-
product gas
Scope
2
Upstream emissions of electricity
and steam from site.
Scope 3 Other upstream emissions by-
products from site
Scope 1 Scope1.1 Scope2 Scope 3
Total
CO2(t
CO2/TCS)
8591761 2803255 534435 -895786 2.785
2.793
2.7872.785
2014-15 2015-16 2016-17
GHG Emission-tCO2/tCS
As per ISO:14064:-

Involvement of employees,Team Work and
Monitoring
• Employee Involvement Through
– Quality Circles, Suggestion Schemes, Department Energy
Teams, Participation in Energy Conservation Campaigns, Cost
Control Campaigns, Water Saving Campaigns
• Implementation Methods
– Low Cost/No Cost Ideas (Process Improvements, House
Keeping Measures, etc) will be Implemented by Frontline
officers
– Medium Investment Projects through AMR Schemes
– High Investment Schemes through Board Approval/COM
– Special Task Forces for Implementing Important Energy
Conservation Projects for Sinter Cooler, Steam Utilization and
By product gases usage.
21

Monitoring Format
Energy
Conservation
CellDET
DGM(EMD)I/c Daily
GM (E&U) Weekly
ED (W) Monthly
D (O) Bi-Monthly
22

Energy Management System ISO:50001
25
• Features:
Identification of significant energyaspects
Developing Energy Managementprogrammes.
Operational control of identifiedenergy aspects
Monitoring and Measurement
Internal Audit
Management Review
RINL implemented BS EN: 16001Energy Management systems at VSPwork division and certified in Dec,2010.
First PSU & Integrated Steel Plant to becertified for BS EN: 16001 energymanagement system
Certified for ISO: 50001 in Aug’12
Completed 2nd recertification in Dec’16

Implementation of Corrective/Preventive actions
24

Energy Management System ISO:50001
25
• Plant has taken up Energy Objectives and Energy Management Action
plans(360 Nos ) to reduce energy consumption.
• DEPARTMENTAL ENERGY TEAMS were constituted in various
departments. The teams identified specific projects
• Departments conducted energy audits at various equipment through
Departmental Energy Audit Teams
2010-11 2011-12 2012-13 2013-14 2014-15 2015-16 2016-17
94 89 90 89 89 85 85
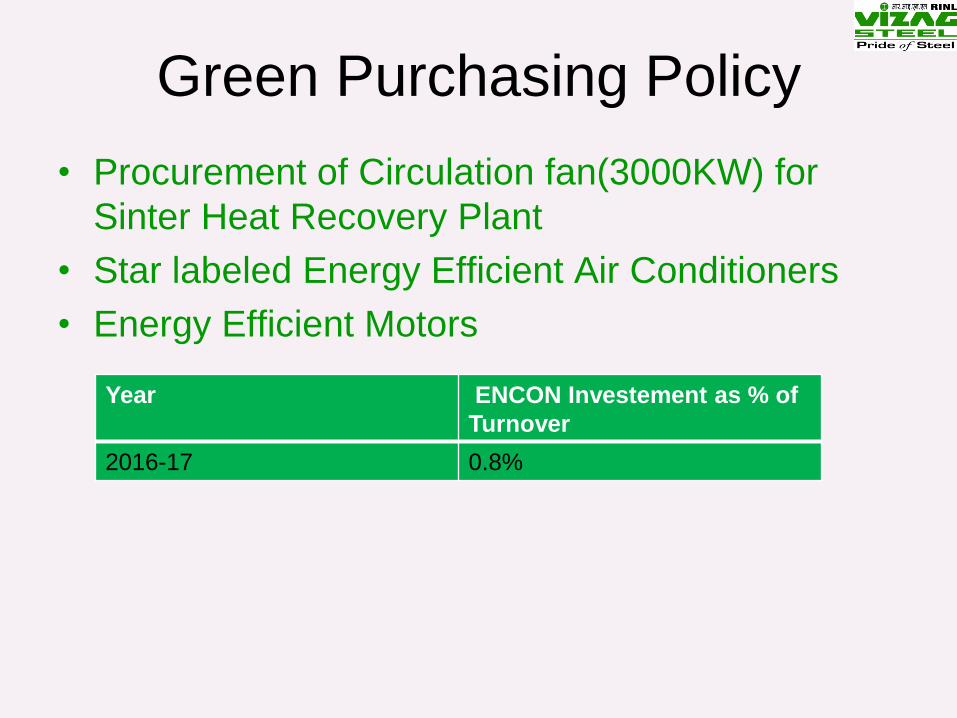
Green Purchasing Policy
• Procurement of Circulation fan(3000KW) for
Sinter Heat Recovery Plant
• Star labeled Energy Efficient Air Conditioners
• Energy Efficient Motors
Year ENCON Investement as % of
Turnover
2016-17 0.8%
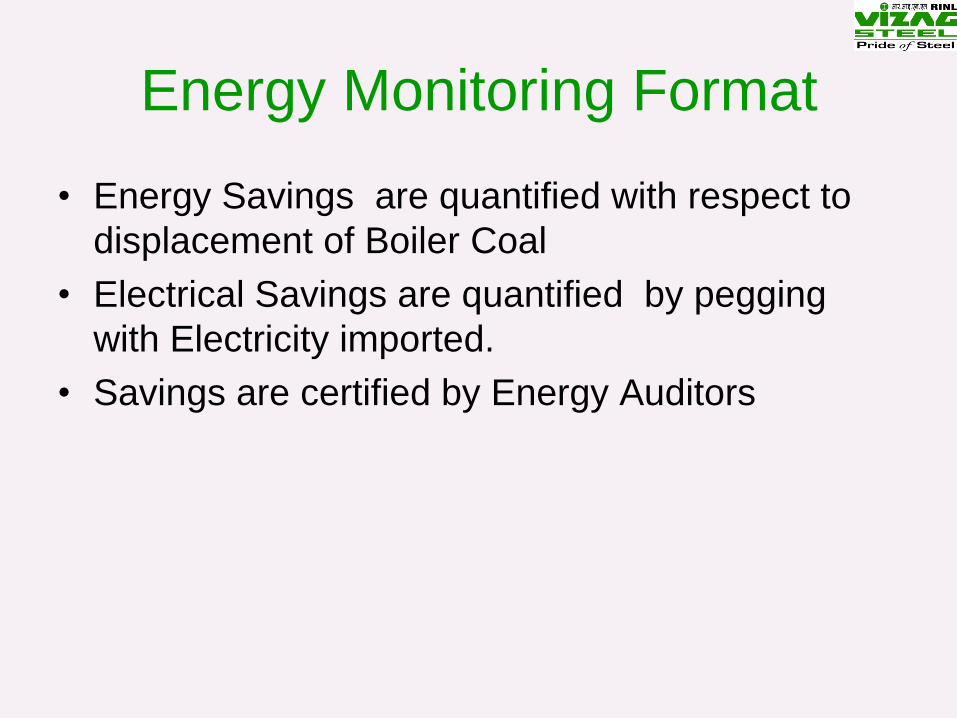
Energy Monitoring Format
• Energy Savings are quantified with respect to
displacement of Boiler Coal
• Electrical Savings are quantified by pegging
with Electricity imported.
• Savings are certified by Energy Auditors

Renewable Energy Utilization
RINL commissioned
5 MW Solar Power
Plant
Investment: Rs 36 cr
Installing 1MW Roof Top
Solar Power Plant at
various Building
26

Utilization of Waste
Type of Waste
Material used
Quantity of
waste
material
used (Tons
or any other
eqvt Unit)
Equivalent of
Conventional
energy used (kWh
of electricity or
Tons of Coking
Coal)
Gcal
Waste fuel
as % of
total
energy
Coke Dust 460 440 3125
23.32%
LD Slag 36202 5099 36202
Met Waste 416333 29319 208167
Tar sludge 3289 3289 23352
Benzol muck 785 785 5574
ASP sludge 276 276 1960
BF gas 7106270 774684 5500253
LD gas 348360 80515 571659
Coke dust(sold) 68291 7454 52926
Granulated Slag 1434882 216243 1535324
25
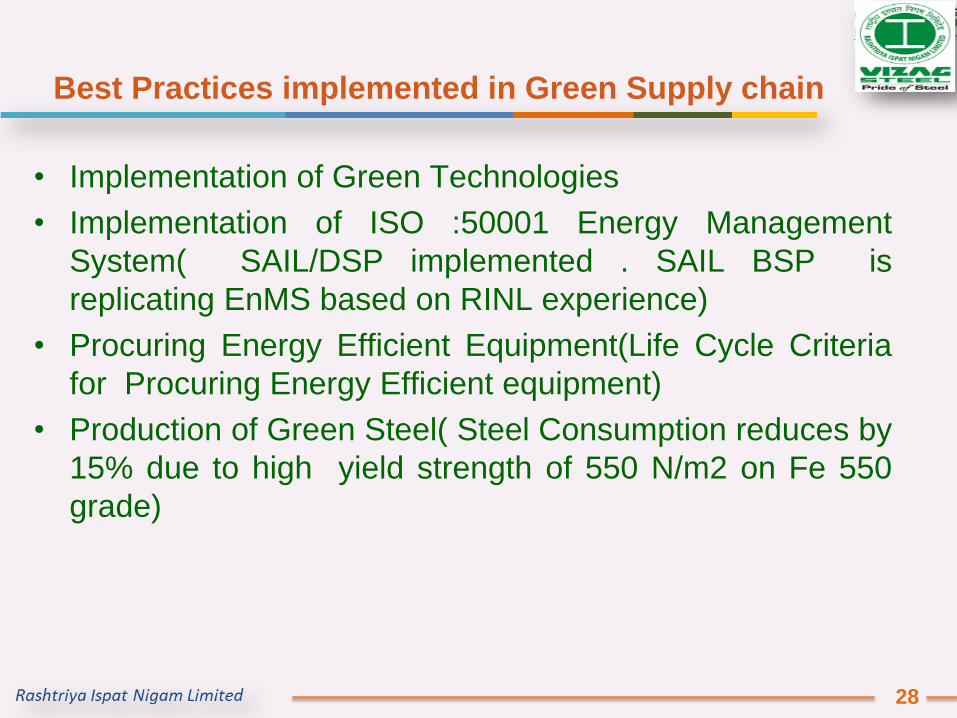
Best Practices implemented in Green Supply chain
• Implementation of Green Technologies
• Implementation of ISO :50001 Energy Management
System( SAIL/DSP implemented . SAIL BSP is
replicating EnMS based on RINL experience)
• Procuring Energy Efficient Equipment(Life Cycle Criteria
for Procuring Energy Efficient equipment)
• Production of Green Steel( Steel Consumption reduces by
15% due to high yield strength of 550 N/m2 on Fe 550
grade)
28
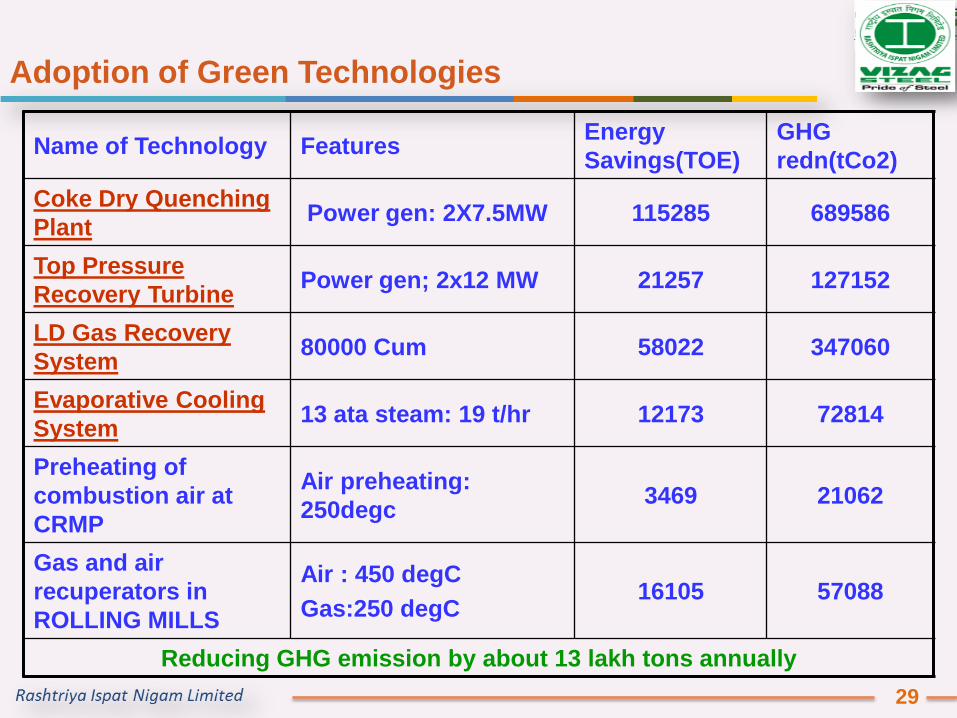
Adoption of Green Technologies
Name of Technology FeaturesEnergy
Savings(TOE)
GHG
redn(tCo2)
Coke Dry Quenching
Plant Power gen: 2X7.5MW 115285 689586
Top Pressure
Recovery Turbine Power gen; 2x12 MW 21257 127152
LD Gas Recovery
System 80000 Cum 58022 347060
Evaporative Cooling
System 13 ata steam: 19 t/hr 12173 72814
Preheating of
combustion air at
CRMP
Air preheating:
250degc3469 21062
Gas and air
recuperators in
ROLLING MILLS
Air : 450 degC
Gas:250 degC16105 57088
Reducing GHG emission by about 13 lakh tons annually
29

Adoption of Energy Efficient Technologies-Unique
Features of RINL
Name of Technology Level of
Diffusion
Coke Dry Quenching
Plant
First Time in
India(1990)
13.5%
Top Pressure Recovery
Turbine
First Time In
India(1993)
13.9%
LD Gas Recovery System First Time in
India(1991-93)
50%
Evaporative Cooling
System
First Time in
India(1993)
25%
Sinter Cooler Waste Heat
Recovery(Power Gen)
First Time in
India(2014)
5%
30

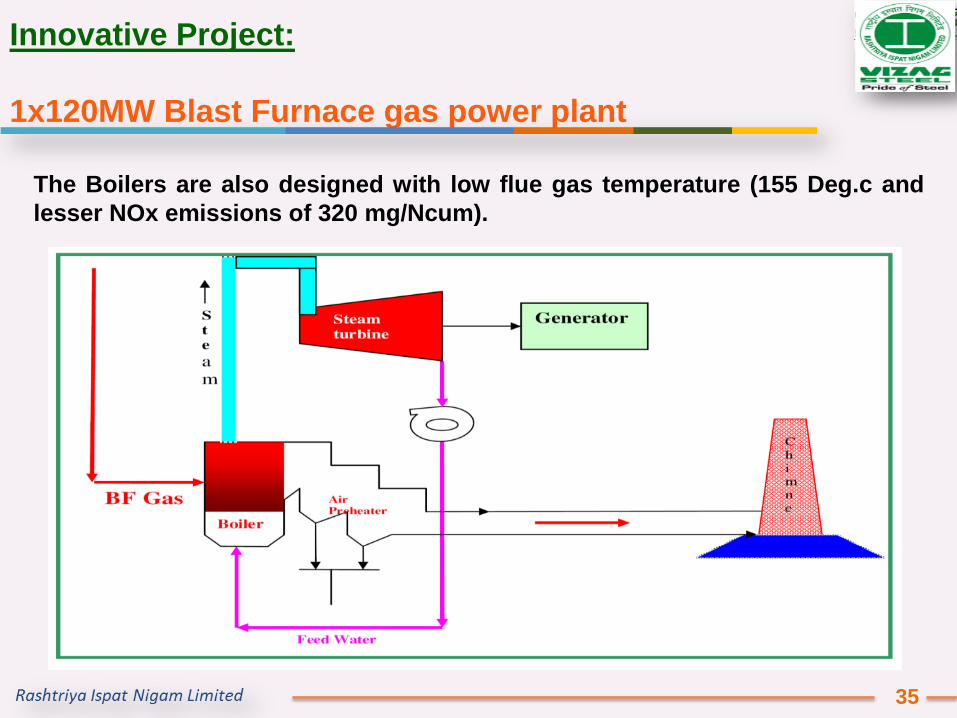
Innovative Project:
1x120MW Blast Furnace gas power plant
RINL has three blast furnaces
having annual production capacity
of 7.5 MTPA of Hot metal (Iron) after
adding 1no. Blast Furnace
(2.5MTPA) and revamping of 2 nos.
existing blast furnace from 1.7MTPA
to 2.5MTPA each.
During the process of iron making
blast furnace gas is generated as by
product gas and used in various
metallurgical units.
Blast Furnace gas is a lean gas
having heat value 750 Kcal/Ncum.
There is surplus BF gas to the
extent of 4,50,000 Nucm/hr after
expansion
31
BF Gas Gen&Distribution
Shop/Unit
Value
(Ncum/hr)
Generation 14,84,000
Consumption (Ncum/hr)
BF-1&2 3,34,000
BF-3 1,79,000
CO&CCP,SP,
Rolling Mills 2,01,000
CPP-1 3,18,000Surplus 4,52,000

Innovative Project:
1x120MW Blast Furnace gas power plant
Innovative Design of BoilersImproved burner design in boilers.
The boilers are designed in such a way
that low volumetric heat release rate
with larger boiler furnace results in higher
residence time & higher heat surface
area.The boilers are envisaged with Scroll type
burner which provides spin to the BFG at the
point of air fuel mixing and adequate
refractory lining on water wall tubes of
furnace heat surface which will reradiate
heat into the flame. 34
Flue gas generation in
Ncum/Gcal
Co Gas 1200
BF gas 2000
Boiler Coal 1300
Present Scenario:
Burning of blast furnace gas generates
huge volume of flue gases and results in
high flue gas temperature due to high
furnace pressure.
Parameters Existing
Boilers
New
Boilers
Flue Gas
temp(deg.c)
200 155
Boiler
Efficiency
<80 89.5
Innovative Project:
1x120MW Blast Furnace gas power plant
The Boilers are also designed with low flue gas temperature (155 Deg.c and
lesser NOx emissions of 320 mg/Ncum).
35

Innovative Project:
1x120MW Blast Furnace gas power plant
Technical Details:
Parameter Unit Value
No of Boilers Nos 2
No of Steam Turbine Nos 1
Steam flow t/hr 223
Steam pressure ATA 115
Steam Temperature Deg.c 540+/-5
BF gas flow to Boiler Ncum/hr 219846*2
Calorific Value Kcal/Ncum 700
Steam Turbine Capacity MW 120 MW
Steam flow to turbine t/hr 443
Condenser pressure ATA 0.1
Auxiliary Power Consumption MW 5.392
Flue Gas Temp. at inlet of ID
fan
Deg.c 155
Boiler efficiency % 89.5 Turbine Heat rate Kcal/Kw 2137 Investment Rs Cr 677
36

Innovative Project:
1x120MW Blast Furnace gas power plant
Estimated Benefits:
• Reduction of BF gas bleeding
• Reduction of GHG emission by 12,00,000 tons
37

Thank you
राष्ट्रीय इस्पात निगम लऱलमटेडRASHTRIYA ISPAT NIGAM LIMITED