energy efficiency and - energy studies institute
TRANSCRIPT

Company
LOGO
Energy efficiency and conservation in China’s power
sector
Opportunities and Challenges in China’s
Energy development
Jiahai Yuan, NCEPU

Outline
Brief overview on power sector in China
• EE&C in power sector: drivers and policy
• EE&C in power sector: overall progress
• EE&C in power sector: prospective

Brief history of power system in China
Period Guiding policies Description
1949–1985 Centrally planned and
administered system
Vertical integrated SRE; government agencies
plan, finance, manage, and operate the
system; oscillations between centralized and
decentralized management
1985–1997 Decentralization to provinces;
opening of investment
Opening up of the sector to provincial
government, private, and foreign investment;
guaranteed investment return on generation
investment
1997–2002 Separation of government and
business
Corporatization of the sector through the
creation of the State Power Corporation (SPC);
Ministry of Electric Power dissolved, functions
transferred to the State Economic and Trade
Commission (SETC) and the State
Development and Planning Commission
(SDPC), later merged into the NDRC
2002– Separation of generators and grid
companies
Dismantling of the SPC into 5 national SOE
generating companies, 2 national grid
companies; creation of SERC (merged into
NEA in 2013) and NEA
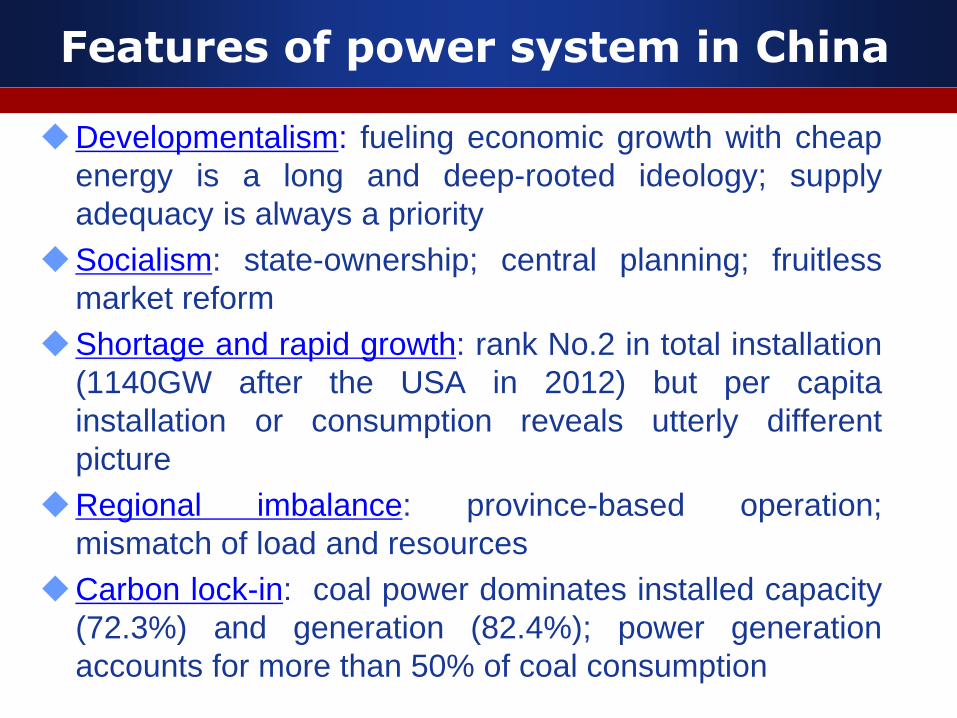
Features of power system in China
Developmentalism: fueling economic growth with cheap
energy is a long and deep-rooted ideology; supply
adequacy is always a priority
Socialism: state-ownership; central planning; fruitless
market reform
Shortage and rapid growth: rank No.2 in total installation
(1140GW after the USA in 2012) but per capita
installation or consumption reveals utterly different
picture
Regional imbalance: province-based operation;
mismatch of load and resources
Carbon lock-in: coal power dominates installed capacity
(72.3%) and generation (82.4%); power generation
accounts for more than 50% of coal consumption

Features of power system in China
%
coal consumed for
power generation
electricity over primary
energy
electricity over end-
use energy
1985 19.6 21.32 7.43
1990 26.9 24.68 9.05
1995 35.05 29.58 12.38
2000 45.54 41. 72 17.89
2005 53.72 41.39 19.22
2010 54.32 43.43 21.26
Table: share of electricity over primary and end-use energy in China
Source: China Electricity Council

Outline
• Brief overview on power sector in China
※EE&C in power sector: drivers and policy
• EE&C in power sector: overall progress
• EE&C in power sector: prospective
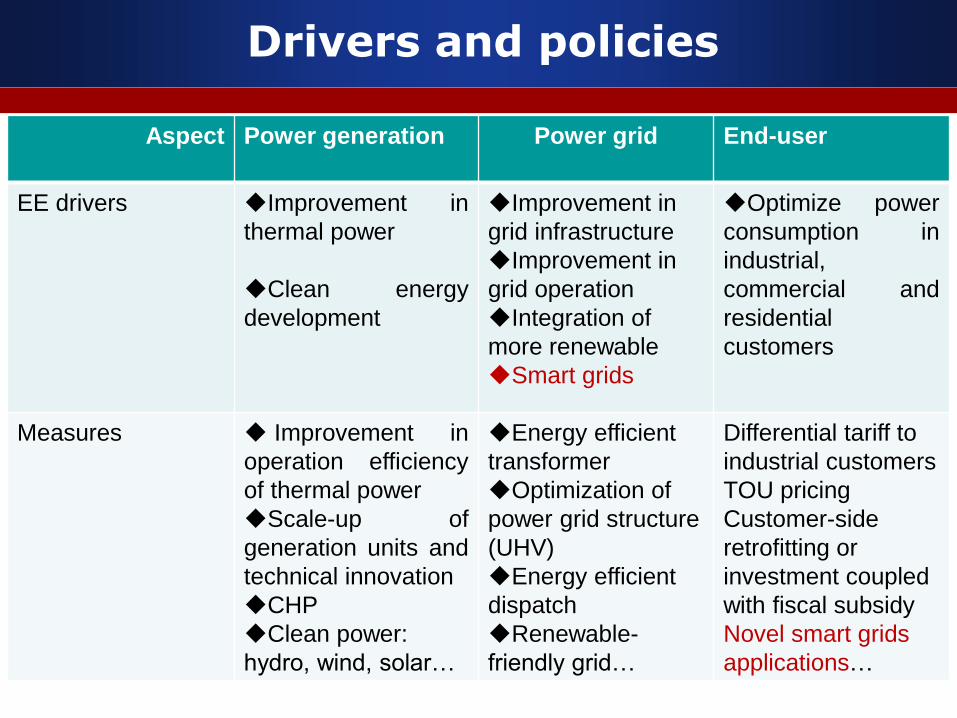
Drivers and policies
Aspect
Power generation Power grid End-user
EE drivers
Improvement in
thermal power
Clean energy
development
Improvement in
grid infrastructure
Improvement in
grid operation
Integration of
more renewable
Smart grids
Optimize power
consumption in
industrial,
commercial and
residential
customers
Measures Improvement in
operation efficiency
of thermal power
Scale-up of
generation units and
technical innovation
CHP
Clean power:
hydro, wind, solar…
Energy efficient
transformer
Optimization of
power grid structure
(UHV)
Energy efficient
dispatch
Renewable-
friendly grid…
Differential tariff to
industrial customers
TOU pricing
Customer-side
retrofitting or
investment coupled
with fiscal subsidy
Novel smart grids
applications…

Replacement of small coal power units with
large ones
1999-2003: mandatory closure of generation units
at 50MW and below
2006-2010: plan to close a total of 50GW units at
100MW and below (NDRC and NEA)
Progress: 76.83 GW(2010); 80 GW(2011)
Improvement in thermal power

(sce
gram/KWh) 100MW unit 300MW unit
600MW unit
(SC)
600MW unit
(USC)
1GW
unit
coal
consumption
rate of power
supply
380 330 310-320 310 290
• Replacement of small thermal power with large units
(Cont.)
Assume an reduction of 70 gce in heat rate and annual
operation of 4700 hours (2011), 80GW replacement
results to an annual conservation of 26.3 Mtce primary
energy.
Improvement in thermal power

• Technology investment in efficient generation units
• In the 1990s, most of the thermal power generators
above 300 MW/unit were imported; now 600MW(SC)
and 1GW(USC) generators can be produced in China
• In 2011, 300MW and above units accounted for 74.5%
of total thermal power plants in China; but in 1993 the
share was only 23%.
• However, there are still about 80GW small units in
operation.
% 1GW 600MW 300MW 200MW
200MW and
below
share 5.3 33.5 35.6 7.0 18.5
Table China’s coal power structure in 2011
Improvement in thermal power

Energy efficiency benchmarking in SOE
generators(NDRC,2007)
In 2007 NDRC introduced EE benchmarking in
SOE generators, including evaluation system,
enforcement body and annual information
disclosure mechanism
Progress: The generation efficiency levels of
TOP5 improved continuously and converged at
315 gce/KWh power supply in 2012
Improvement in thermal power

290
300
310
320
330
340
350
360
370
HUANENG DATANG HUADIAN GUODIAN CHINA POWER INV.
2006
2007
2008
2009
2010
2011
2012
Fig. coal consumption rate of power supply in China’ TOP5 SOE generators
Improvement in thermal power

• Energy-saving dispatch (NDRC, 2007): “Rank
various power generators according to the energy
consumption and emission level”
1 Renewable
• Unadjustable like wind and solar
• Adjustable like hydro and biomass…
2 Clean
3 Efficent
• Nuclear power
4 Gas and other coal
• Gas power
• Other coal power
• CHP thermal power
Improvement in thermal power

Energy-saving dispatch (NDRC, 2007)
“Conduct pilot test in five provinces and then
implement it throughout the country”
In essence, this policy can result in what happened
in countries where market mechanism has been
introduced.
Result: pilot test reveals remarkable conservation
potential. But it was strongly opposed by
generators and local governments. Without a
strong determination on market reform, it is
suspended with no follow-up.
Improvement in thermal power
• Economic policies
• Regional benchmark price (NDRC, 2004)
• Though competitive bidding was terminated, regional
benchmark price introduced by NDRC in 2004 acted as
“power pool” and contributed to efficiency improvement
in power generation
• Before benchmark price, generation pricing was
complicated in China. In 1980s and 1990s, in order to
attract investment in power sector and solve the
headache of serious power shortage, the government
even set generation price on a unit-by-unit base.
Improvement in thermal power

• Economic policies
• Co-movement of coal price and wholesale power
generation price (NDRC, 2005):
• “In no less than 6 months, if coal price increases by 5% or more,
then NDRC will adjust generation price accordingly”. But actual
implementation reveals that generators have to burden part of the
coal price increase.
• A transitional “quasi-market and quasi-planning” measure: coal
price is determined by market (profit-seeking) but wholesale
power price is strictly regulated by the government (developmental
and other social purposes) .
• But the hike of coal price (1000RMB/ton in 2008 vs. 200RMB/ton
in 2003) and the co-movement mechanism does provide incentive
for the generators to improve energy efficiency.
Improvement in thermal power

Comprehensive policy package from legislation,
to medium-and-long-term renewable energy
planning and specific implementation measures
Key points of developing policies in China
• Renewable generation quota for generators (>5GW)
• Mandatory purchase of renewable power accessed to
power grid
• Creation of special fund to promote renewable power
• Feed-in-tariff for wind power (2009) and solar power
(2013)
Clean energy development

Table installed capacity and power generation in China, 2012
Clean energy development

Results
• Largest developer of hydropower (249GW) and wind
power (75.6GW)
• Possible take-off of solar power (newly installation of
3GW in 2011 and 2012)
Challenges
• Serious curtailment of wind power (and hydropower)
• Difficulty of integrating renewable into the grid
• Inadequacy of supporting fund: 1.5 cent/KWh surcharge
is not enough to sustain the FIT scheme
Clean energy development

The share of non-
hydropower renewable in
total power generation is
small in China
Wind share in total
generation
Denmark: 34%
Portugal: 21%
Spain: 17%
Ireland: 16%
Germany: 7%
China: 2.67%
Clean energy development

thermal
(Xingjiang)
On-grid price: RES-E V.S. Thermal power
in China, 2010 (Unit: CNY/kWh)
wind
solar PV
bio-energy
solar
thermal
geo-, ocean-
thermal
Power source
thermal
(Guangdong)
Clean energy development

Improved grid infrastructure
• UHV (AC 1000 KV; DC 800KV), to transport electric power,
instead of coal in long distance
• Standardized planning, design and operation of power system
• Pilot Smart grids projects
Improved grid operation and dispatch • Trans-regional transaction of power sources
• Implementation of Generation Rights Trade
Results during 2006-2010 • Directly saving 11 Mtce by reducing line loss
• Indirectly saving 54 Mtce by improving grid operation and dispatch
Improvement in power grid

Key measures
• Differential tariff to large industrial users(差别电价)
(NDRC, 2004): higher price for energy-intensive industry
• Demand-side management (DSM) (NDRC, 2010)
• Tiered tariff in residential users (阶梯电价) (NDRC, 2012)
Results and comments
• The potential of DSM is vast in China, but its actual
implementation is very limited in China;
• Differential tariff in industrial sectors is largely industrial
policy, not for energy efficiency;
• It is too early to judge the actual effect of tiered tariff
Improvement in end-user

Outline
• Brief overview on power sector in China
• EE&C in power sector: drivers and policy
※EE&C in power sector: overall progress
• EE&C in power sector: prospective

Overall progress
Year Line
loss (%)
Heat rate (generation)
(gce/KWh)
Heat rate (supply)
(gce/KWh)
1985 8.18 398 431
1990 8.06 392 427
1995 8.77 379 412
2000 7.70 363 392
2005 7.21 343 370
2011 6.52 308 329
Table energy efficiency in China’ s power sector
CEC, 2013

Overall progress
Table Comparison of CO2 emission from coal power plants
Grams
CO2/kWh 1995 2000 2005 2006 2007
World 883 879 909 910 903
European
Union—27 818 813 814 828 835
United
States 938 916 914 903 920
Japan 1006 961 911 917 910
United
Kingdom 880 906 935 923 927
China 987 911 937 930 893
Brazil 1543 1464 1585 1616 1605
India 1213 1203 1244 1247 1252
OECD (2011)

Overall progress
Table International comparison of line loss
SGCC (2010)
% 1980 1990 2000 2005 2011
Korea 6.97 5.62 4.71 4.51
Japan 5.80 5.70 5.20 5.10
US 9.35 6.68 6.34 6.47
France 6.81 7.87 6.88 6.59
China 8.50 7.23 7.26 7.12 6.52
Australia 10.45 7.37 7.75 7.15
Canada 9.43 7.29 8.57 7.82
UK 8.12 8.06 8.48 8.46
Russia 8.38 8.86 12.41 12.62
Brazil 11.91 12.99 16.49 15.36
India 17.89 20.45 29.23 26.35

Overall progress
Overall comments China can catch up with industrialized countries in both
generation efficiency of thermal power and line loss of the
power grid
The resulted progress mainly comes from
• Scale economy in thermal power, mainly by command-and-control
and partly driven by competition in generators and coal price hike.
But its future potential is rather limited
• Clean generation quota requirement for main generators and a FIT
scheme. But the conflicts between “coal power based macro-grid”
and “renewable-based distributed and micro-grid” will exacerbate
under the existing institutional arrangement
DSM, or Contracting energy performance (CEP), has yet to
develop into a mainstream market in China

Outline
• Brief overview on power sector in China
• EE&C in power sector: drivers and policy
• EE&C in power sector: overall progress
※ EE&C in power sector: prospective

prospective
Improvement in thermal power Scale of economy: little to moderate
Operation efficiency improvement: little to moderate
CHP or other combined process: moderate to large
Renewable energy Wind : large
Solar : little in 3-5 years, but moderate to large in 10 years
biomass and others: little to moderate
Power grid Energy-saving dispatch: large
Smart grid: vast
DSM Effective pricing mechanism: vast
CEP: vast

policy implication
Transition
Technical progress: from generation side to
grid and customer side
Overall contribution: from technical efficiency
to economic efficiency
Change in mechanism: from regulation (CAC,
technical standard etc) to market-based
incentive

Policy implication
Institutional arrangement • Re-defining the role of power grid company (public utility,
separation of T&D, SO with power supply business)
• A level playground for all investors in renewable and
energy efficiency market
Market reform
• Generation bidding and bilateral contracting: proper price
signing the scarcity of resource
• Independent T&D pricing: regulated cost-based pricing
• Renewable power: pre-competitive
Integrated infrastructure (smart grids)
• Active customer involvement
• DG and micro-grid

Company
LOGO
Thanks for your attention!