energy efficient wifi display - university of california...
TRANSCRIPT

Energy Efficient WiFi DisplayChi Zhang and Xinyu Zhang
University of Wisconsin-MadisonRanveer ChandraMicrosoft Research
ABSTRACTWiFi Display, also called Miracast, is an emerging technology
that allows a mobile device (source) to duplicate its screen contentto an external display (sink) via a peer-to-peer WiFi link. Despiteits diverse application scenarios and growing popularity, Miracastconsumes substantial power due to a combination of video encod-ing/decoding and transmission. In this paper, we first conduct ameasurement study to quantify and model key parameters that scaleMiracast’s power consumption. We then propose a set of opti-mization mechanisms to bypass redundant codec operations, reducevideo tail traffic, and relocate the Miracast channel dynamicallyto maximize transmission efficiency. We have implemented thisenergy-efficient Miracast framework on an Android smartphone. Ex-perimental results show that the legacy Miracast system costs 1.3 to2.4 Watts. Our framework reduces the power consumption by 29%to 61%, depending on the Miracast application’s video traffic pat-terns. Our optimization mechanisms do not affect the video quality,and can even reduce the latency of certain Miracast applications.
Categories and Subject DescriptorsC.2.1 [Computer-Communication Networks]: Network Archi-
tecture and Design—Wireless communication
KeywordsWiFi Direct; WiFi Display; Miracast; energy efficiency; mobile
phones
1. INTRODUCTIONContemporary mobile devices feature a one-to-one binding with
small display units. Amid the insufficient display real-estate, manyapplication scenarios (e.g., gallery sharing, collaborative editing,presentation) call for a dynamic binding towards extraneous, largedisplays, such as PC monitors, TV screens and wall-projectors.Urged by such demands for screencasting, the Miracast standard(also referred to as WiFi Display) was recently developed by the WiFiAlliance. Acting like a wireless HDMI cable, Miracast allows a userto, for example, echo display plus audio from a smartphone onto anexternal screen in real-time. Unlike proprietary video-cast solutionssuch as Apple Airplay or Google Chromecast, once Miracast isenabled, every UI component – from the general interface to videos– will be duplicated on the screen. Thus, no modification is requiredfor applications.
Permission to make digital or hard copies of all or part of this work for personal orclassroom use is granted without fee provided that copies are not made or distributedfor profit or commercial advantage and that copies bear this notice and the full cita-tion on the first page. Copyrights for components of this work owned by others thanACM must be honored. Abstracting with credit is permitted. To copy otherwise, or re-publish, to post on servers or to redistribute to lists, requires prior specific permissionand/or a fee. Request permissions from [email protected]’15, May 18–22, 2015, Florence, Italy.Copyright is held by the owner/author(s). Publication rights licensed to ACM.ACM 978-1-4503-3494-5/15/05 ...$15.00.http://dx.doi.org/10.1145/2742647.2742654.
WiFi-Direct, also referred to as WiFi P2P, serves as an enablingnetworking technology for Miracast. The Miracast source can mirrorits local content via a peer-to-peer link with the sink, e.g., a WiFi-enabled HDMI dongle connected to a TV screen. Meanwhile, itallows tethered streaming, i.e., downloading content from an accesspoint (AP) while streaming it to the sink. Such features offer easycompatibility with existing WiFi devices. In fact, latest mobileoperating systems like Android [1] and Windows Phone [2] alreadyhave built-in support for Miracast. Corresponding sink adaptersfrom Microsoft [3], Amazon [4], etc., have recently witnessed alarge consumer market.
However, for a battery-operated Miracast source like a smart-phone, maintaining a wireless external display can be very costly.The source has to stream video frames through WiFi with highbit-rate towards the external display. Prior to sending, it has to en-code (compress) the video stream so that the WiFi link is capableof handling the bit-rate. During tethered streaming, it also has todecode the downloaded content before compression and transmis-sion. These activities together make Miracast power-hungry evenwhen the mobile device is idle. The Miracast standard devised anoptional energy-saving feature called video frame skip, which allowsthe source to stop generating/transmitting video frames if its screencontent is static and not updating. However, this mechanism alonebarely helps taming the energy cost, especially during continuousvideo streaming.
From a high level perspective, Miracast’s power consumptioninvolves many parts of the mobile device, including processing andnetworking, none of which can be trivially ignored. Despite a richliterature on mobile energy efficiency, Miracast necessitates newmechanisms to jointly optimize two aspects. First, existing workon mobile multimedia delivery (see [5] and the references therein)focused on curtailing the receiver- or client-side power consumptionby reshaping the video server’s traffic, thereby creating sleepingopportunities that can be harnessed by WiFi’s Power Saving Mode(PSM). In contrast, Miracast’s dominating operations reside on thesource or transmitter side. Second, Miracast incurs substantial codecpower consumption, especially in tethered streaming that requiresreal-time decoding and reencoding. It is the intersection betweenvideo-dominated application content generation and transmitter-centric network optimization that calls for a new, holistic approachtowards energy-efficient Miracast.
This paper marks a first step towards systematic understanding andoptimization of Miracast power consumption. We conduct a mea-surement of Miracast-compatible smartphones to obtain application-specific and component-wise power profile. The measurement re-sults pinpoint key parameters such as screen resolution, video bit-rate, channel selection, which help establishing a power consumptionmodel, later used in devising power-reduction strategies.
Grounded on the measurement insights, we explore a set of systemoptimizations to tame processing and networking related energy costat the Miracast source node. First, for bursty screencast applicationslike slide show, we identify a video tail phenomenon that reflectsa tradeoff between video quality and the source’s traffic load thatin turn affects its power consumption. We design an adaptive tail-

cutting algorithm that reduces the power cost without noticeablyimpairing video quality.
Second, we explore a video pass-through mechanism that allowsthe source to circumvent decoding/reencoding of video frames, thusevading the power-hungry codec operations. For both encoded localcontent and network content downloaded via the AP (in tetheredstreaming mode), the source directly passes the video frames, andoffloads the decoding tasks to the sink. This mechanism also enablesbatching and speculative transmission of video frames to the sink,without incurring the latency that used to appear when waiting forthe codec to output frames at a slow, constant pace.
Third, observing that network contention affects the idle listeningtime and hence power efficiency of the source, we propose an off-channel Miracast scheme that opportunistically migrates the source-sink link to an energy-efficient channel. This so-called off-channelmay differ from the AP-source channel in tethered streaming mode.Selection of the most energy-efficient channel is guided by the modelthat we have developed through measurement and calibration.
Besides, we have identified and curtailed background Miracasttraffic due to silent audio generation and hidden image layers, whichaccount for substantial energy wastage in certain applications withbursty video traffic patterns.
We have implemented the above power optimization mechanismson Galaxy Nexus, a Miracast-compatible Android phone. The im-plementation is application transparent. Our experimental evalua-tion uses the Vanilla Android Miracast framework as a benchmark.The results demonstrate that the total system power savings rangefrom 29% to 61% depending on application use cases and Mira-cast operation mode. Adaptive tail-cutting alone saves 2.3% to19.6% for bursty applications. Video pass-through, combined withbatching/prefetching, can save 52% to 61% for continuous videostreaming. Off-channel miracasting can further add up to 8% fortethered streaming case under intensive contending traffic.
The main contribution of this work lies in a framework to optimizethe overall system-level power consumption of a mobile deviceserving as Miracast source. This is feasible because when it isrunning, Miracast tends to dominate a mobile device’s activities andcomputation/networking resources. Our specific contributions canbe summarized as follows:
• Characterize Miracast power consumption in a component-wise manner, and develop a model to profile the impact ofcomputation/network factors.
• Explore a set of power-optimization principles, includingvideo tail cutting, video-frame pass-through, and energy-aware off-channel selection/switching. These principles alsomake it possible to execute conventional system-design princi-ples, such as batching and prefetching, without hurting latencyperformance.
• Implement and evaluate the optimization mechanisms on topof Android’s Miracast framework, in an application-transparentmanner. Promising performance gains justify the proposedmechanisms, and demonstrate their potential as general guide-lines for an energy-efficient Miracast system.
The remainder of this paper exposits each of the above contribu-tions. Following background information about Miracast (Section2), Section 3 describes our measurement and modeling of Mira-cast power consumption. Section 4 presents the power-optimizationmechanisms with implementation, followed by Section 5 where weevaluate the energy savings. We discuss certain unexplored direc-tions in Section 6, related works in Section 7, and finally concludethe paper in Section 8.
Source
Sink AP
Source
Sink
(a) (b)
Figure 1: Network topologies for WiFi Display: (a) P2P topol-ogy for source’s local content streaming; (b) Two-hop topologyfor tethered streaming.
2. BACKGROUND
2.1 WiFi DirectWiFi Direct is a standard from the WiFi Alliance [6]. It enables
devices to communicate by establishing P2P groups. Within thegroup, the device implementing AP functionality is called the GroupOwner (GO), whereas others are P2P clients. Group members nego-tiate roles during initial setup through a handshake with randomizedranking.
Two new power saving mechanisms are introduced for the GO.Opportunistic power saving mode allows the GO to sleep once allclients are asleep. Another mechanism, called the Notice of Absence,allows a GO to proactively announce time intervals where it powersdown to save energy. In contrast to the GO, a WiFi Direct client isallowed to use legacy 802.11 Power Saving Mode (PSM).
2.2 Miracast: Wireless Display Over WiFi Di-rect
2.2.1 General ArchitectureWiFi Display or Miracast [7] is another standard from the WiFi
Alliance. It mirrors the screen of a device by streaming it as a livevideo over WiFi Direct to an external screen. Miracast enables adiverse set of use cases, such as: (i) Presentation slide or picturegallery show. (ii) Projecting GPS application in vehicles [8]. (iii)Mirroring videos to a TV screen or monitor. (iv) Multi-user gaming.
WiFi Direct’s logical GO/client role assignment eases the deploy-ment of two Miracast network topologies, as shown in Figure 1.In the local streaming topology, a mobile source node can mirrorlocally generated screen content, e.g., general UI, game scenes, pic-tures and videos, towards the sink via a peer-to-peer connection.In the tethered streaming topology, the source downloads Internetcontent via the WiFi AP, renders it on the screen and casts it towardsthe sink. For compressed online video, the source needs to decodebefore rendering and casting. In both topologies, the source can actas either a GO or client w.r.t. the sink, but must be a client w.r.t. theinfrastructure WiFi AP.
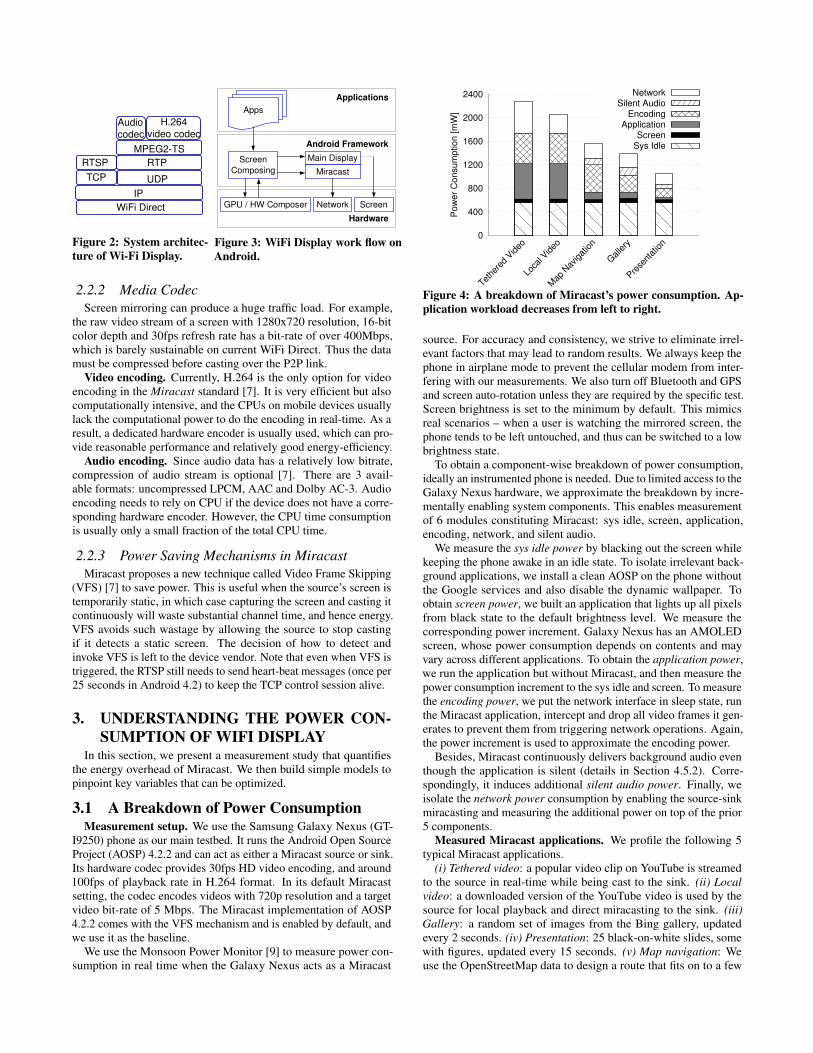
Miracast consists of multimedia protocols on top of the WiFinetwork stack as shown in Figure 2. The architecture is the samefor the Miracast source and sink. The screen content is compressedinto video frames and, along with audio frames, encapsulated in anMPEG2-TS container, and sent using UDP-based RTP. The TCP-based RTSP protocol provides session and playback control.
Figure 3 illustrates the source’s workflow during a Miracast ses-sion on Android. Applications can generate screen content, whichis composed with GPU and displayed on the UI. We emphasizethat Miracast itself does not directly “capture” the screen. Instead,it leverages a media routing module to acquire the screen pixelsdirectly, encodes them, and delivers them through the WiFi NIC.Whenever the screen rendering stops (e.g., due to user turning offthe screen), Miracast is also suspended.
WiFi Direct
IP
TCP UDP
RTSP RTP
MPEG2-TS
Audio
codec
H.264
video codec
Figure 2: System architec-ture of Wi-Fi Display.
Hardware
Applications
Android Framework
Apps
ScreenComposing
GPU / HW Composer
Main Display
Miracast
Network Screen
Figure 3: WiFi Display work flow onAndroid.
2.2.2 Media CodecScreen mirroring can produce a huge traffic load. For example,
the raw video stream of a screen with 1280x720 resolution, 16-bitcolor depth and 30fps refresh rate has a bit-rate of over 400Mbps,which is barely sustainable on current WiFi Direct. Thus the datamust be compressed before casting over the P2P link.
Video encoding. Currently, H.264 is the only option for videoencoding in the Miracast standard [7]. It is very efficient but alsocomputationally intensive, and the CPUs on mobile devices usuallylack the computational power to do the encoding in real-time. As aresult, a dedicated hardware encoder is usually used, which can pro-vide reasonable performance and relatively good energy-efficiency.
Audio encoding. Since audio data has a relatively low bitrate,compression of audio stream is optional [7]. There are 3 avail-able formats: uncompressed LPCM, AAC and Dolby AC-3. Audioencoding needs to rely on CPU if the device does not have a corre-sponding hardware encoder. However, the CPU time consumptionis usually only a small fraction of the total CPU time.
2.2.3 Power Saving Mechanisms in MiracastMiracast proposes a new technique called Video Frame Skipping
(VFS) [7] to save power. This is useful when the source’s screen istemporarily static, in which case capturing the screen and casting itcontinuously will waste substantial channel time, and hence energy.VFS avoids such wastage by allowing the source to stop castingif it detects a static screen. The decision of how to detect andinvoke VFS is left to the device vendor. Note that even when VFS istriggered, the RTSP still needs to send heart-beat messages (once per25 seconds in Android 4.2) to keep the TCP control session alive.
3. UNDERSTANDING THE POWER CON-SUMPTION OF WIFI DISPLAY
In this section, we present a measurement study that quantifiesthe energy overhead of Miracast. We then build simple models topinpoint key variables that can be optimized.
3.1 A Breakdown of Power ConsumptionMeasurement setup. We use the Samsung Galaxy Nexus (GT-
I9250) phone as our main testbed. It runs the Android Open SourceProject (AOSP) 4.2.2 and can act as either a Miracast source or sink.Its hardware codec provides 30fps HD video encoding, and around100fps of playback rate in H.264 format. In its default Miracastsetting, the codec encodes videos with 720p resolution and a targetvideo bit-rate of 5 Mbps. The Miracast implementation of AOSP4.2.2 comes with the VFS mechanism and is enabled by default, andwe use it as the baseline.
We use the Monsoon Power Monitor [9] to measure power con-sumption in real time when the Galaxy Nexus acts as a Miracast
0
400
800
1200
1600
2000
2400
Tethe
red
Video
Loca
l Video
Map
Nav
igat
ion
Gallery
Prese
ntat
ion
Po
we
r C
on
su
mp
tio
n [
mW
]
NetworkSilent Audio
EncodingApplication
ScreenSys Idle
Figure 4: A breakdown of Miracast’s power consumption. Ap-plication workload decreases from left to right.
source. For accuracy and consistency, we strive to eliminate irrel-evant factors that may lead to random results. We always keep thephone in airplane mode to prevent the cellular modem from inter-fering with our measurements. We also turn off Bluetooth and GPSand screen auto-rotation unless they are required by the specific test.Screen brightness is set to the minimum by default. This mimicsreal scenarios – when a user is watching the mirrored screen, thephone tends to be left untouched, and thus can be switched to a lowbrightness state.
To obtain a component-wise breakdown of power consumption,ideally an instrumented phone is needed. Due to limited access to theGalaxy Nexus hardware, we approximate the breakdown by incre-mentally enabling system components. This enables measurementof 6 modules constituting Miracast: sys idle, screen, application,encoding, network, and silent audio.
We measure the sys idle power by blacking out the screen whilekeeping the phone awake in an idle state. To isolate irrelevant back-ground applications, we install a clean AOSP on the phone withoutthe Google services and also disable the dynamic wallpaper. Toobtain screen power, we built an application that lights up all pixelsfrom black state to the default brightness level. We measure thecorresponding power increment. Galaxy Nexus has an AMOLEDscreen, whose power consumption depends on contents and mayvary across different applications. To obtain the application power,we run the application but without Miracast, and then measure thepower consumption increment to the sys idle and screen. To measurethe encoding power, we put the network interface in sleep state, runthe Miracast application, intercept and drop all video frames it gen-erates to prevent them from triggering network operations. Again,the power increment is used to approximate the encoding power.
Besides, Miracast continuously delivers background audio eventhough the application is silent (details in Section 4.5.2). Corre-spondingly, it induces additional silent audio power. Finally, weisolate the network power consumption by enabling the source-sinkmiracasting and measuring the additional power on top of the prior5 components.
Measured Miracast applications. We profile the following 5typical Miracast applications.
(i) Tethered video: a popular video clip on YouTube is streamedto the source in real-time while being cast to the sink. (ii) Localvideo: a downloaded version of the YouTube video is used by thesource for local playback and direct miracasting to the sink. (iii)Gallery: a random set of images from the Bing gallery, updatedevery 2 seconds. (iv) Presentation: 25 black-on-white slides, somewith figures, updated every 15 seconds. (v) Map navigation: Weuse the OpenStreetMap data to design a route that fits on to a few

100
200
300
400
0 1 2 3 4 5 6 7 8 9 10
Ne
two
rk P
ow
er
co
nsu
m.
(mW
)
Video Bitrate (Mbps)
5.2GHz Tx5.2GHz Rx2.4GHz Tx2.4GHz Rx
Figure 5: Measured dynamic power fromMiracast network interface.
100
200
300
400
0 5 10 15 20
Ne
two
rk p
ow
er
co
nsu
m.
(mW
)
Contending traffic (Mbps)
ExperimentalCurve fit
Figure 6: Measured network power con-sumption vs. contention intensity.
100
200
300
0 1 2 3 4 5 6Ne
two
rk p
ow
er
co
nsu
m.
(mW
)
Miracast Video Bitrate (Mbps)
ExperimentModel
Figure 7: Measured network power con-sumption vs. Miracast video traffic load.
roads with at least 2 turns, covering middle to west part of the UW-Madison campus. We built an app that stitches, pans and rendersthe map tiles in real-time with 1Hz update rate, typical for GPSapplications. Each tile has a resolution of 256×256 pixels and theroute covers 100 tiles.
Breakdown of Miracast power consumption. Figure 4 presentsthe averaged power numbers. System idling consumes approxi-mately 557±10 mW, which accounts for a nontrivial fraction in the3 applications with intermittent, bursty Miracast traffic (map, galleryand presentation). The screen power consumption falls in the rangeof 40 - 100mW, a relatively small fraction in all test scenes1.
The application power consumption is negligible (35 mW or3.2%) in the Presentation, but increases with the application’s work-load. Between the bursty application and continuous video appli-cation that involves a hardware codec, there is a drastic increaseof application power (from below 120 mW to around 600 mW).This trend implies that the majority of the application power may beattributed to the codec’s decoding operations, since other hardwarecomponents (e.g., CPU and memory) are only handling lightweighttasks (e.g., audio encoding and occasional user interaction).
The encoding power shows a similar increasing trend, accountingfor 162 mW, 291 mW, 465 mW, 519 mW and 519 mW in the 5applications with increasing work load. Accordingly, the Miracastvideo traffic becomes more intensive, resulting in increasing networkpower consumption (192 to 315 mW). Also note that the silentaudio accounts for a non-negligible fraction in the 3 bursty videoapplications.
Overall, aside from the sys idle and screen power that is inde-pendent of Miracast, other modules together account for 450 mWto 1656 mW, or 43% to 73% depending on applications – therebyproviding sufficient opportunities for power optimization.
3.2 Modeling WiFi Display Power Consump-tion
We aim to build a coarse model to highlight the key factors thatdominate Miracast’s asymptotic power consumption at the source.We focus on the local streaming mode. The tethered streamingdiffers only by adding a legacy (AP-source) WiFi link. Our modelaccounts for two major power consumers: network and codec.
3.2.1 Network FactorsOur network model estimates the energy overhead when perform-
ing Miracast on different channels (with different contention levelsand hardware profile). This estimation will later facilitate our off-channel miracasting scheme. In contrast to prior analytical work that1However, at full brightness with all pixels being white, theAMOLED screen can consume 765.9±1.3mW.
focused on 802.11 MAC layer [10, 11] or cognitive radios [12, 13],our model is measurement-driven and explicitly accounts for theimpact of channel selection on power consumption.
Model. For a given channel and traffic load on the source-sinklink, mean power consumption of the source can be dissected into2 parts: Pstatic, the average static power or idle power to keep thenetwork interface ready for transmission/receiving, and Pdynamic, thedynamic power, or power increment on top of Pstatic when the sourceis actively transmitting/receiving. The total network power is thesum of Pstatic and Pdynamic:
Pnetwork(Ch,Bi) = Pstatic(Ch,Bi)+Pdynamic(Ch,Bi) (1)
where Bi (i = t,r) denotes the traffic load in bps, for transmittingand receiving, respectively. For simplicity, we represent the totaltraffic load as B = ∑
i=t,rBi = Bt +Br.
The static part can be further decomposed as follows:
Pstatic(Ch,B) = Pbs(Ch) ·Ractive(Ch,B)
= Pbs(Ch) ·(
Rwait(Ch)+B
BPHY ·ηMAC
)(2)
where Ractive denotes duty-cycle, or the fraction of time the NICis not sleeping. Pbs(Ch) is the base power, which only depends onWiFi hardware and may vary as it is tuned to different channels. Theduty-cycle consists of the fraction of idle time Rwait(Ch) plus thefraction in transmission/receiving. The former mainly depends oncontention intensity on a given channel Ch. The latter depends ontraffic load B, WiFi bit-rate BPHY, as well as MAC efficiency ηMAC(i.e., ratio between MAC throughput and PHY bit-rate). In practice,since the source-sink distance tend to be short, and both tend to berelatively stationary, BPHY usually remains stable. Thus, the fractionof time in transmission/reception only depends on traffic load B.
For the dynamic component, suppose Ei(Ch) is the additionalenergy per bit needed on top of static power for channel Ch, then,
Pdynamic(Ch,Bi) = ∑i=t,r
[Ei(Ch)×Bi] (3)
This component also accounts for related CPU power budget. Ei(Ch)(i = t,r) can be obtained by running a constant-bit-rate UDP ses-sion with PSM disabled, and subtracting measured Pbs(Ch) fromaggregate power.
Combining Eq. (2) and (3), we can pinpoint 4 factors to determinethe network power consumption: B, Pbs(Ch), Rwait(Ch) and Ei(Ch).For the 3 channel-dependent factors, only Rwait(Ch) depends oncontention intensity in the radio environment. Pbs(Ch) and Ei(Ch)can be measured and tabulated for each device model during factorycalibration. Note that this model ignores the sleeping power. In

300
320
340
360
380
400
0 1 2 3 4 5 6 7 8
Co
de
c p
ow
er
co
nsu
m.
(mW
)
Video bitrate (Mbps)
MeasurementModel
Figure 8: Measured decoding power vs.video bit-rate.
0
100
200
300
400
144p
240p
360p
480p
540p
720pC
od
ec p
ow
er
co
nsu
m.
(mW
)
Video Resolution (total pixel number)
1:1 PARnon-1:1 PARModel
Figure 9: Decoding power vs. video resolu-tion. Video bit-rate is 1.5 Mbps.
100
200
300
400
500
1 5 15 10 20 30 40 50Co
de
c p
ow
er
co
nsu
m.
(mW
)
Video Frame Rate (fps)
MeasurementModel
Figure 10: Measured decoding power vs.frame-rate.
addition, it does not explicitly model PSM, but the impact of PSMis to reduce idle listening power, which is indirectly reflected inRwait(Ch).
Validation and observations. We validate the above modelingapproach on Galaxy Nexus. We first calibrate the Pbs(Ch) andEi(Ch) parameters for this hardware model. Pbs(Ch) is obtained bymeasuring the power difference between the case when the NIC issleeping and when it is idle. Idle mode is created by disabling PSMwhile no packet transmission is going on. To obtain Ei(Ch), we setup a WiFi Direct link between two phones on channel Ch, and runthe iperf utility to generate a specific traffic load B. We then obtainPdynamic(Ch,Bi) by measuring the power increment on top of thePbs(Ch). Ei(Ch) is taken as the first-order derivative of Pdynamic withrespect to Bi. Our experiments are done in late night to minimizethe impact from ambient traffic.
The dynamic power model assumes a linear relation betweenEi(Ch) and Pdynamic, which we verify through measurement (Figure5). We observe that Pbs(Ch,Bt) is roughly linear w.r.t. Bt , exceptwhen Bt falls between 4 and 5 Mbps, likely because of boundaryeffects caused by frame fragmentation. Pbs(Ch,Br) is close to linearwhen Br < 5 Mbps, but levels off afterwards, likely because ofinterrupt aggregation for the network I/O. However, for a Miracastsource, transmission traffic dominates and Br typically falls wellbelow 5 Mbps. From Figure 5, we also note that 5.2GHz bandconsumes more dynamic power than 2.4GHz, which is attributed toradio hardware. We also observe that different channels within the5 GHz band or 2.4 GHz band show similar dynamic power (curveomitted here). Thus, Ei(Ch) only needs to be calibrated for onechannel on each band.
To verify the static power model, we measure the network powerunder different contention intensity and hence Rwait values, gen-erated by varying the traffic load of an external link on the samechannel. The traffic of Miracast is held constant at 5Mbps, such thatthe dynamic power remains constant and the power increase onlycomes from the static part. From the measurement results (Figure6), we see contention intensity and Pstatic fit a linear relation, con-sistent with the model in Eq. (2). In Section 4.4.1, we will developa channel surveying mechanism that enables a Miracast source toestimate Rwait directly.
Finally, Figure 7 depicts the Miracast source’s total networkpower consumption Pnetwork as video transmission traffic Bt in-creases (the source’s receiving traffic Br is negligible). Due tolinear relation between Bt and static/dynamic power, the total powerfits a linear relation as well.
Since Pdynamic(Ch,Bt) is already measured, we can subtract itfrom Pnetwork(Ch,Bt) to obtain Pstatic(Ch,Bt). Based on Eq. (2), we
know the slope of the measured curve in Figure 7 equals Pbs(Ch)/(BPHYηMAC). Since Pbs(Ch) and BPHY are known, we can also ob-tain ηMAC. By now, all stationary parameters have been calibratedand the model (1) can be used to compare the relative power con-sumption when the Miracast source runs a different Ch and videobit-rate Bt .
3.2.2 Codec FactorsModel. We model the codec power consumption as:
Pcodec(Ri,Bi) = ∑i=e,d
(E f i(W ×H) ·Ri +Ebi ·Bi
)(4)
where Ri, Bi and W ×H represent the video frame-rate, bit-rate,and resolution, respectively. When VFS is enabled, we take thetime-averaged values for Ri and Bi. Also, E f i (i = e,d) is the en-ergy per frame that the codec consumes for encoding and decoding,respectively. Ebi (i = e,d) is the overhead energy per bit, mainlyassociated with memory movements and extra CPU computations.Note that audio codec is omitted by this model considering therelatively small power consumption.
Validation and observations. By playing a set of video clipsencoded with different W ×H, Ri and Bi from the same losslessvideo source, we can measure the decoding power and therebycalibrating E f i and Ebi (i = d). The measurement methodologyfollows Section 3.1.
Figure 8 shows that the decoding power consumption indeedfollows a linear relation with Bi as modeled in Eq. 4, but theslope Ebi is less than 3mW/Mbps. For a typical 720p video stream,corresponding bit-rate ranges from 2 to 8 Mbps. Within this range ofbit-rate, Ebi only contributes to a small fraction of the energy cost.
In contrast, the video resolution W ×H affects the power con-sumption much, as shown in Figure 9. This is because the amountof computation scales non-linearly with number of pixels. In effect,the E f i fits a square function with resolution. Notably, the additionalprocessing power is needed for videos with a pixel aspect ratio (PAR)other than 1:1. For example, 480p video with a 16:9 display aspectratio can not have a square pixel shape since (480/9)×16 is not aninteger. Thus, it consumes even more power than 540p.
Consistent with our model, measurement results in Figure 10verify that decoding power grows linearly with frame rate, sincethe codec needs to sustain more workload per unit time. The basepower component caused by the playback (CPU, GPU, screen, etc.)is estimated to be about 145.1mW.
We have observed similar trend in encoding power w.r.t. Bi, Riand W ×H, albeit with different model parameters. We omit themeasurement details due to space constraint. Notably, the Miracastencoder on Android defaults to a fixed resolution of 720p, target

bit-rate 5 Mbps and frame rate 30fps. Time-averaged Bi and Ridiffer across applications and corresponding encoding power hasbeen discussed in Section 3.1.
4. ENERGY EFFICIENT MIRACAST SYS-TEM
4.1 Overview of Solution SetWe follow a set of simple principles to optimize the Miracast
source’s power consumption: when idle, maximize sleeping time;when busy, work in the most efficient way and cut unnecessarytransmissions; amortize the cost of other states and offload tasksto the energy-insensitive sink node. Table 1 summarizes our spe-cific designs and the applications, categorized according to networktopology as local/tethered streaming, and according to traffic patternas continuous/bursty video.
Our first solution mechanism, adaptive video tail cutting, reducesredundant transmissions that follow each traffic burst in intermittentscreen-update applications (e.g., map, gallery or slide show). Suchredundancy is used to refine the quality of video frames, but at thecost of substantial traffic load and hence power consumption.
The second mechanism, video pass-through, applies to continuousvideo traffic. It allows the source to bypass the H.264 encoding andoffload the decoding task as well to the sink node. Rather thanwaiting for the codec, the source can also batch a group of alreadycoded frames and send them to the sink in a speculative manner.
In addition, we explore an off-channel Miracast mechanism, thatexecutes an energy-aware channel selection scheme for the source-sink WiFi Direct link, based on the model in Section 3.2. In tetheredstreaming scenario, the source can alternate between the channelwith AP (which may not be controllable), and the energy-efficientchannel it selects. With this measure, it also avoids self-contentionbetween the AP-source link and source-sink link, allowing for moreefficient video data transportation.
In our system, the Miracast source acts as a client w.r.t. the sinkand/or the AP. Thus, all the above mechanisms need to work coher-ently with the PSM protocol. Yet PSM itself is unaware of Miracasttraffic patterns. We design a PSMlock mechanism, to manage PSMin a fine-grained manner following the typical clustered patterns ofMiracast video traffic, thus creating more sleeping opportunities.Besides, background audio/video frames, invisible but presented tothe Miracast source due to oblivious screen rendering driver, can besuppressed to save substantial power.
4.2 Cutting Video Tails
4.2.1 Video Tail: Quality and Power TradeoffThe VFS allows a Miracast source to pause encoding and casting
video frames when there are no updates on the screen. However,it is left to the vendor to decide when to pause. A trivial way isto encode one video frame for a still screen, and stop immediatelyafterwards. However, this may significantly impair video quality.For a sophisticated scene, the H.264 codec is unable to compressall the details into a single frame. Thus, the “encode-and-stop”approach may result in an incomplete or low-quality image deliveredto the sink.
To deal with the problem, the Miracast source needs to add a “tail”after each sudden scene transition to gracefully refine the imagequality. It keeps the encoder running and generating new framesuntil there are enough details in the image for human observation.In Android’s Miracast framework, the tail is fixed to 30 frames perscreen, lasting 1 second after each screen transition.
0.2
0.4
0.6
0.8
1
20 25 30 35 40 45
Fra
ctio
n o
f fr
am
es
PSNR (dB)
No tail1s tail
Figure 11: PSNR distribution with and without inserting videotail.
26
27
28
29
30
31
32
33
34
3 6 9 12 15 18 21 24 27 30 1000
1050
1100
1150
1200
1250
1300
1350
1400
PS
NR
(d
B)
Po
we
r co
nsu
mp
tio
n (
mW
)
Frames
Pres. PSNRPres. Power
Gallery PSNRGallery Power
Figure 12: Additional power consumption due to video tail, andthe resulting PSNR increase.
To gain a quantitative understanding of impact of tail on videoquality, we rerun the gallery application with 0.5 Hz picture transi-tion rate, using another Galaxy Nexus as sink node. We dump thesink’s screen image data when each screen is encoded by one frame(“no tail” case) or 30 frames (“1s tail” case). Then we compute thePSNR by comparing with the original image at source side. Figure11 plots the CDF of PSNR across all pictures. We see a medianPSNR improvement of 1.1 dB and best case 5 dB, which upgradesthe corresponding perceived picture quality at the sink.
On the other hand, a video tail generates additional frames thattranslate into energy cost. Figure 12 plots the average power con-sumption and PSNR as a function of tail length. For the galleryapplication, whereas PSNR increases by up to 3 dB, power con-sumption increases quickly – by 280 mW as tail length grows from1 to 30 frames. For the presentation slide show, the power consump-tion increase is less obvious due to long idle period between 2 slides,within which network management overhead (e.g., beacons and idlewaiting) dominates the additional tail energy.
Note that for fast-changing scenes, like a 30fps continuous videocasting, tails are not needed, as human eyes can not capture finedetails before each next scene is displayed. However, for burstyvideo casting like slide show, we can identify much more detailssince each scene will be displayed for an extended amount of timeto become discernible.
4.2.2 Adaptive Tail CuttingGiven the tradeoff between video quality and power consump-
tion for certain bursty miracasting traffic, an adaptive algorithm ispreferred that cuts the video tail but without hampering PSNR. Astraightforward solution is to compute PSNR on-the-fly for each tailframe output by the codec, and stop encoding once PSNR plateaus.However, the computational cost is formidable. Alternatively, wecan monitor the codec’s output frame size to gauge how much in-formation is included in the frame and whether more details needto be added to the picture. However, the relationship of encoded

Adaptive videotail cutting
Videopass-through
batching &prefetching
off-channelmiracast PSMlock
backgroundsuppression
Local streaming X X X X X X
Tethered streaming X X - X X X
Continuous video - X X X X X
Bursty video X - - X X X
Table 1: Solution space for energy efficient Miracast.
16
20
24
28
32
0 60 120 180 240 300
4
8
12
16
20
PS
NR
(d
B)
Lo
g10(V
aria
nce
of
Siz
e)
Frame index
PSNR Log10(Var)
Figure 13: PSNR and variance of tail frame size, across 10 ex-ample video scenes with 30 tail frames each, lasting 1 sec. Thedash line indicates the threshold for cutting tail.
frame data size with the room of PSNR improvement is not straight-forward – we found that absolute frame size is not monotonicallydecreasing as more tail frames are added.
Fortunately, we empirically observed that the variance of the out-put frame sizes will drop when PSNR stops growing. Figure 13 plotsthe PSNR growth with the tail length, in contrast to how variance offrame sizes changes over time, which testifies our observation. Wesuspect the phenomenon is caused by the interaction between thecodec’s bit-rate control and quantization. The H.264 encoder worksto meet a fixed target video bit-rate constraint in Miracast (defaultto 5 Mbps in Android 4.2). Under this constraint, immediately aftera scene change, the encoder oscillates between low/high quantiza-tion level and large/small frame size. The oscillation stops afterPSNR saturates, because there is insufficient difference to encodeto generate a large frame, and thus the frame size remains roughlyconsistent.
Our adaptive tail cutting algorithm uses the variance of tail framesize as a decision metric. We keep a moving window to calculatethe size variance of 5 most recent frames, and cut the tail once thevariance drops below a threshold. We found an empirical thresholdof 250000 (corresponding to standard deviation 500 bits) worksacross a wide range of tested applications, although online tuningmay yield even better quality/power tradeoff. Also, we upper-boundthe tail length to 30 frames, corresponding to the 1 second tail inAndroid’s Miracast framework. Figure 14 illustrates the integra-tion between our algorithm and modules inside Android’s Miracastframework, where a repeater keeps feeding the encoder with framesuntil tail ends. Decision of tail cutting in our algorithm is made bythe encoder which notifies the repeater via a message interface.
4.3 Video Pass-ThroughIn this section, we describe the video pass-through mechanism
that opportunistically offloads the source’s codec tasks to the sink,while allowing batching and speculative transmission of videos asraw data.
4.3.1 Workflow and ImplementationOur pass-through design is application-transparent: it detects
H.264 coded video data from application, intercepts the frames, andpasses them directly to the Miracast module without involving the
Tail FrameRepeater
Encoder
Age of Screen Frame< Frame Interval
Screen
Repeat
SendNew Frame
Repeated 30 FramesOR Notified Tail Cut
Wait Until Timefor Next Frame
Wait Until NewFrame Available
TRUE FALSE
FALSE TRUE
Enqueue OutputFrame Size in FIFO
Calculate Varianceof Frame Sizes
Variance > ThresholdTRUE FALSE
NotifyTail Cut
Wait forNext Frame
Data
Data
Data
Msg.
Figure 14: Work flow of the adaptive tail cutting implementa-tion.
codec. We note that this scheme precludes the casting of screenelements other than the video.
To understand how video pass-through works, we first introducethe source’s default way of mirroring local/online video (Figure15(a)). An application typically calls a multimedia player frameworkto read coded video data from either local file or network I/O. Theplayer further leverages a codec interface to invoke the hardwarecodec which decodes the video data. The video frames are renderedon the source’s screen and mixed with other UI elements, if any,through a composer module. The composite frames are passed tothe Miracast module as screen content. Then, Miracast follows itsstandard procedure to encode the content using the hardware codec,and eventually deliver the coded data to the sink.
In the pass-through design, we add a format checker on the codecinterface, and pause the hardware codec whenever an H.264 video isplayed (Figure 15(b)). Then, the video data are packetized directlyand fast-tracked to the network interface, as if they are the codecoutput under the command of Miracast. However, before that, weneed two manipulations over the video frames on behalf of the legacyMiracast module, so as to hide the pass-through operation from thesink, allowing it to play video as usual.
First, the passed-through video frames have their native times-tamps relative to the video start point. To cast the video in a Miracastsession, we need to replace the native timestamps with the Miracasttimestamp, such that the video can be played in the correct ordertogether with other screen-generated frames before/after the video.
Second, the passed-through frames also have their native sequencenumbers. Ideally, these should be modified as well to match theMiracast video sequence. However, we found the sequence numbercan have variable length, from 4 bits used in Internet videos to 16bits in Galaxy Nexus. Worse still, the offset of the sequence numberwithin each video frame is unknown, because H.264 uses Golombcoding to encode the parameters field prior to the sequence numberin a video frame’s header.
We overcome this hurdle by forcing the source to execute cer-tain reset operations. Specifically, when pass-through starts, thesource composes an end-of-sequence frame to tell the sink to resetthe sequence number, and a parameter frame to inform it of a newsequence number length. Both frames are standard configurationframes in H.264. When the pass-through video ends and the Mira-cast session switches back to the screen UI, we execute the same

Miracast
Application
PlayerFramework
CodecInterface
Codec Driver & Hardware
Display Buffer
Composer
UI Video
MPEG2TS
RTP
Network
RawImage
Video
Packets
Screen
Codec Interface
(a)
Miracast
Application
PlayerFramework
CodecInterface
Display Buffer
Composer
UI Video
MPEG2TS
RTP
Network
Video
Packets
Screen
Throttle
Format Check
(b)Figure 15: Work flow of video pass-through (b) in contrast tothe default Miracast (a).
operation and request the codec to generate an I-frame2 to start anew sequence of stream, without wrongly referring to frames in thepass-through stream. The overhead in delay caused by the resettingoperation is minimal since most of the frames involved are withoutvideo data and are generated instantly, and the sink only needs verylittle extra time to process these frames.
4.3.2 Enabling Batching and Prefetching in LocalVideo Miracast
Video pass-through enables locally coded video data to be castmore efficiently, following two classical schemes: (i) Batched trans-mission; (ii) Prefetching of batched frames to the sink well beforeplayback. Although we can enforce such schemes without videopass-through, the resulting playback latency will grow proportion-ally with batch size, because the codec outputs video frames at aconstant pace (e.g., 30fps) commensurate with the sink’s playbackframe-rate. For instance, our experiments show that aggregatingmerely 12 frames entails 1.2 seconds of waiting time (Section 5.1),apparently undesirable in practice.
To enable batching, we add a throttling function in the codecinterface (Figure 15(b)), such that video frames are passed to theMPEG2-TS only if their number exceeds a batch size threshold.Meanwhile, we run a simple prefetching scheme: an entire batchof frames is sent once the due time of the first among them comes.To configure the batch size properly, we first need to understand theimpact of batching/prefetching on power consumption and relevanttradeoffs.
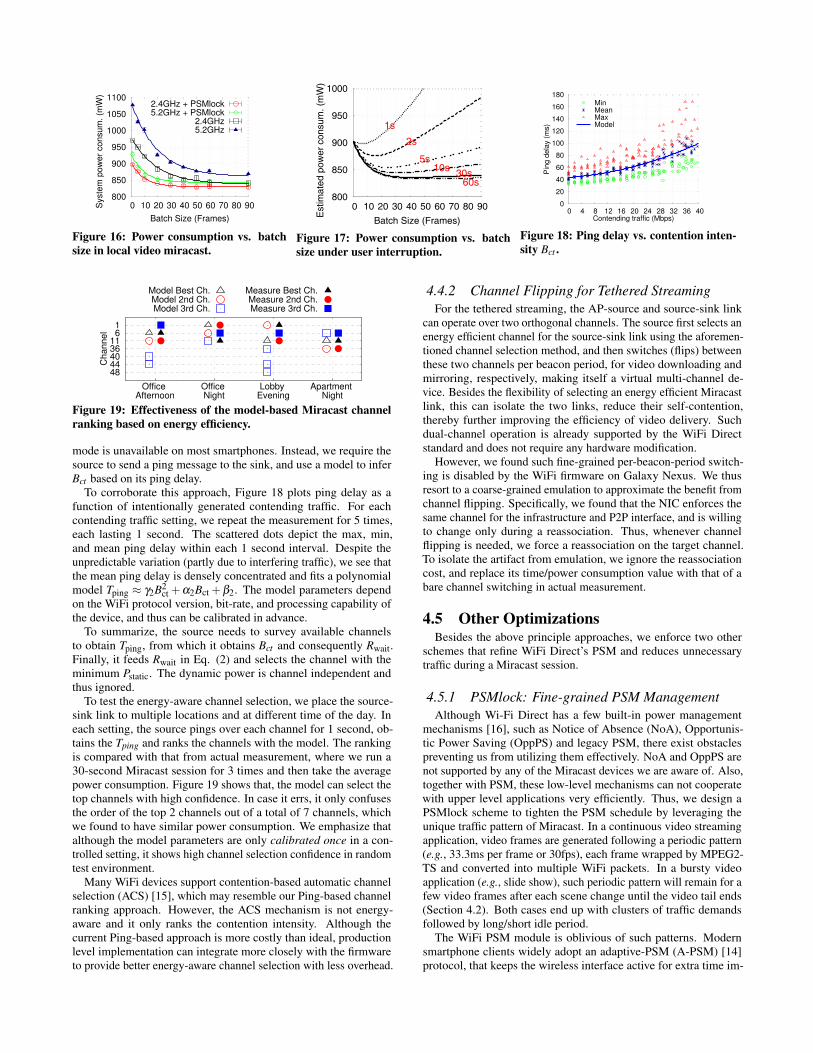
Impact of batching on power consumption. We first cast alocal video with pass-through and measure the power consumptionunder different batch sizes. Figure 16 plots the results. We evaluatea 2.4 GHz, 5.2 GHz channel, with and without our optimized PSMmanagement scheme (Section 4.5.1). For all 4 settings, we observethe power consumption drop fits an exponential relation with batchsize Sbatch:
Ptotal = Ae−B×Sbatch +P0 (5)
where the first term is the overhead and P0 the energy truly spent ondata processing/transmission. Sbatch denotes batch size as in numberof aggregated video frames. A and B are empirical parametersdefining how large the initial overhead is and how quickly it dies outwith frame aggregation.
With the vanilla WiFi Direct PSM, substantial overhead still existsdue to a tail effect: the Miracast source keeps the network interfacealive after each batch of transmission [14]. Such overhead is con-2In H.264, an I-frame is a self-contained frame whose encodingdoes not depend on other frames.
sistently amortized as batch size increases, leading to consistentpower consumption drop. In contrast, PSMlock cuts the PSM tail,so marginal power saving is observed (< 10 mW beyond a batchsize of 10).
It might seem that latency will still grow with batch size (albeitmore slowly than the case without video pass-through), due to thegrowth in batch download time, and thus it will depend on theoutput video bit-rate and WiFi Direct link throughput. However, inpractice the player will always buffer substantial video data beforethe playback starts, in order to counteract the jitter effects. So theadditional latency from batching may be merged with the initialbuffering delay. We will quantify such latency effects in Section 5.1.
Impact of prefetching. An inherent tradeoff exists when the sinkprefetches batches of video frames: if the user interrupts and stopsthe video, the prefetched but undisplayed frames will be wasted.Thus, the actual power saving from prefetching depends on not onlybatch size, but also frequency of user intervention.
Figure 17 shows this tradeoff quantitatively. We used the priormodel from Figure 16 to compute power saving, and then subtractthe cost from wasted transmitting, assuming user interrupts theplayback periodically. The results verify that power consumptiondrops to a valley with batch size, but increases afterwards. The lessfrequently user interrupts the video display, the larger the “sweetspot” batch size is. Although user behavior is hard to predict, lessthan 5 seconds of holding time is not common in practice. Also, thepower saving trend is similar among all user holding period largerthan 5 s, as long as the batch size is not excessively large (below20).
Based on observations from the above experiments, we can seethat a batch size of 10 to 20 is sufficient to harvest the majoritypower saving from batching/prefetching. We thus adopt a fixedbatch size of 20 in our implementation. For different devices, thesuitable range of batch size may be calibrated separately followingthe above approach.
4.4 Energy-Aware Off-channel MiracastWiFi-Direct allows a Miracast source to freely select wireless
channels independent of any infrastructure. Our off-channel Mira-cast leverages this property, incorporating a model-driven, energy-aware channel selection/switching scheme.
4.4.1 Energy-Aware Off-Channel SelectionConsidering the strong dependency of power consumption on
network contention, the Miracast source can pick the least congestedchannel. Real-world wireless environment is highly dynamic andexact traffic intensity is hard to predict. However, it is feasible todistinguish two channels based on their long-term (e.g., second orminute-scale) contention intensity and static power. Our off-channelselection scheme follows this principle – we require the source toquickly survey available channels, and then use a model-drivenapproach to rank them according to their potential for saving energy.
The power consumption model in Section 3.2.1 indicates that theonly contention-dependent parameter is Rwait, whereas others can beobtained through factory calibration. We approximate Rwait in a lin-ear relation with Bct , an intermediate parameter indicating intensityof contending traffic on the same channel, i.e., Rwait = α1Bct +β1.The linear model is calibrated in a controlled environment, wherewe generate different levels of contention traffic Bct , follow the ap-proach in Section 3.2.1 to measure all parameters in Eq. (2) exceptRwait which can be easily extrapolated. Given Bct and Rwait, α1 andβ1 can be easily calibrated.
In an uncontrolled environment, Bct may be obtained if the sourcecan monitor and average the ambient traffic, yet the monitoring
800
850
900
950
1000
1050
1100
0 10 20 30 40 50 60 70 80 90Syste
m p
ow
er
co
nsu
m.
(mW
)
Batch Size (Frames)
2.4GHz + PSMlock5.2GHz + PSMlock
2.4GHz5.2GHz
Figure 16: Power consumption vs. batchsize in local video miracast.
800
850
900
950
1000
0 10 20 30 40 50 60 70 80 90
Estimated
powerconsum
.(mW)
Batch Size (Frames)
1s
2s
5s10s 30s
60s
Figure 17: Power consumption vs. batchsize under user interruption.
0
20
40
60
80
100
120
140
160
180
0 4 8 12 16 20 24 28 32 36 40
Pin
g d
ela
y (
ms)
Contending traffic (Mbps)
MinMeanMaxModel
Figure 18: Ping delay vs. contention inten-sity Bct .
484440361161
Office Afternoon
Office Night
Lobby Evening
Apartment Night
Ch
an
ne
l
Model Best Ch.Model 2nd Ch.Model 3rd Ch.
Measure Best Ch.Measure 2nd Ch.Measure 3rd Ch.
Figure 19: Effectiveness of the model-based Miracast channelranking based on energy efficiency.
mode is unavailable on most smartphones. Instead, we require thesource to send a ping message to the sink, and use a model to inferBct based on its ping delay.
To corroborate this approach, Figure 18 plots ping delay as afunction of intentionally generated contending traffic. For eachcontending traffic setting, we repeat the measurement for 5 times,each lasting 1 second. The scattered dots depict the max, min,and mean ping delay within each 1 second interval. Despite theunpredictable variation (partly due to interfering traffic), we see thatthe mean ping delay is densely concentrated and fits a polynomialmodel Tping ≈ γ2B2
ct +α2Bct +β2. The model parameters dependon the WiFi protocol version, bit-rate, and processing capability ofthe device, and thus can be calibrated in advance.
To summarize, the source needs to survey available channelsto obtain Tping, from which it obtains Bct and consequently Rwait.Finally, it feeds Rwait in Eq. (2) and selects the channel with theminimum Pstatic. The dynamic power is channel independent andthus ignored.
To test the energy-aware channel selection, we place the source-sink link to multiple locations and at different time of the day. Ineach setting, the source pings over each channel for 1 second, ob-tains the Tping and ranks the channels with the model. The rankingis compared with that from actual measurement, where we run a30-second Miracast session for 3 times and then take the averagepower consumption. Figure 19 shows that, the model can select thetop channels with high confidence. In case it errs, it only confusesthe order of the top 2 channels out of a total of 7 channels, whichwe found to have similar power consumption. We emphasize thatalthough the model parameters are only calibrated once in a con-trolled setting, it shows high channel selection confidence in randomtest environment.
Many WiFi devices support contention-based automatic channelselection (ACS) [15], which may resemble our Ping-based channelranking approach. However, the ACS mechanism is not energy-aware and it only ranks the contention intensity. Although thecurrent Ping-based approach is more costly than ideal, productionlevel implementation can integrate more closely with the firmwareto provide better energy-aware channel selection with less overhead.
4.4.2 Channel Flipping for Tethered StreamingFor the tethered streaming, the AP-source and source-sink link
can operate over two orthogonal channels. The source first selects anenergy efficient channel for the source-sink link using the aforemen-tioned channel selection method, and then switches (flips) betweenthese two channels per beacon period, for video downloading andmirroring, respectively, making itself a virtual multi-channel de-vice. Besides the flexibility of selecting an energy efficient Miracastlink, this can isolate the two links, reduce their self-contention,thereby further improving the efficiency of video delivery. Suchdual-channel operation is already supported by the WiFi Directstandard and does not require any hardware modification.
However, we found such fine-grained per-beacon-period switch-ing is disabled by the WiFi firmware on Galaxy Nexus. We thusresort to a coarse-grained emulation to approximate the benefit fromchannel flipping. Specifically, we found that the NIC enforces thesame channel for the infrastructure and P2P interface, and is willingto change only during a reassociation. Thus, whenever channelflipping is needed, we force a reassociation on the target channel.To isolate the artifact from emulation, we ignore the reassociationcost, and replace its time/power consumption value with that of abare channel switching in actual measurement.
4.5 Other OptimizationsBesides the above principle approaches, we enforce two other
schemes that refine WiFi Direct’s PSM and reduces unnecessarytraffic during a Miracast session.
4.5.1 PSMlock: Fine-grained PSM ManagementAlthough Wi-Fi Direct has a few built-in power management
mechanisms [16], such as Notice of Absence (NoA), Opportunis-tic Power Saving (OppPS) and legacy PSM, there exist obstaclespreventing us from utilizing them effectively. NoA and OppPS arenot supported by any of the Miracast devices we are aware of. Also,together with PSM, these low-level mechanisms can not cooperatewith upper level applications very efficiently. Thus, we design aPSMlock scheme to tighten the PSM schedule by leveraging theunique traffic pattern of Miracast. In a continuous video streamingapplication, video frames are generated following a periodic pattern(e.g., 33.3ms per frame or 30fps), each frame wrapped by MPEG2-TS and converted into multiple WiFi packets. In a bursty videoapplication (e.g., slide show), such periodic pattern will remain for afew video frames after each scene change until the video tail ends(Section 4.2). Both cases end up with clusters of traffic demandsfollowed by long/short idle period.
The WiFi PSM module is oblivious of such patterns. Modernsmartphone clients widely adopt an adaptive-PSM (A-PSM) [14]protocol, that keeps the wireless interface active for extra time im-

mediately after each burst of transmission, so as to avoid frequentmode switching [5]. As a byproduct, a PSM “tail” is introduced.
Our PSMlock scheme cuts the PSM tail after each burst of Mira-cast traffic, as we know deterministically when the next burst willcome. PSMlock is application-transparent. It establishes a signalingchannel between the MPEG2-TS module and WiFi Direct interface.Whenever a new video frame is generated, MPEG2-TS informs thenetwork module that it will packetize a new cluster of RTP/UDPpackets. Afterwards, the network module polls the packet transmis-sion queue in the kernel associated with the Wi-Fi Direct interfaceat 1 ms interval, and switches the NIC into sleep mode immediatelyonce the queue is empty (implying the transmission is finished).The switching operation requires the PSM client (Miracast source)to send a null frame containing a “PM=1” flag to inform the GO(Miracast sink) that it will sleep. The NIC is turned on again upon anew signal from MPEG2-TS.
4.5.2 Reducing Invisible Background TrafficWe have also identified two redundant background traffic sources
in Android, likely caused by lack of interaction between applicationand the Miracast framework.
Silent background audio. First, during Miracast, the audiocodec is being fed audio data constantly, no matter whether theaudio is silent or not. While local speakers will be put into standbyby the system during absence of useful audio, Miracast code is notnotified. The additional computational power and network trafficload in casting such audio data can be substantial in bursty videocasting (e.g., slide show) that is not associated with any audio track.We have modified the MPEG2-TS module such that it can skip silentaudio. This has not affected the non-silent audio playback at thesink side.
Background image layers. Many mobile devices’ screens havea status bar indicating time, WiFi download/upload activities, bat-tery status, as well as cellular link quality. In Android, the screencomposer treats the status bar as a separate layer of pixels even ifit is hidden by a full-screen video. Such behavior is desired forcertain applications that need both layers. In a full-screen Miracast,the status bar is invisible, but it keeps triggering new frames andtraffic periodically. We found that when displaying a still image,such hidden traffic can escalate the power consumption by multiplefolds.
5. EVALUATIONIn this section, we present an experimental evaluation of the
energy-efficient Miracast framework. The evaluation starts witha micro-benchmark profiling of the effectiveness and cost of eachindividual power-optimization mechanism in Table 1, followed by asummary accounting of the contribution of each mechanism acrossthe 5 typical Miracast applications (Section 3.1).
5.1 Micro-benchmarksOur micro-benchmark experiments are conducted in a student of-
fice during day time. Around 5 WiFi APs coexist on our experimentchannel. The Miracast system on Galaxy Nexus (Android 4.2) isused as a baseline system. We disable the background image layer asits artifact unnecessarily magnifies the baseline power cost (Section4.5.2). Since Galaxy Nexus is a single-stream 802.11n device, andin our test setup the source and the sink is just a few meters apartand without blockage in between, the PHY rate remains 65Mbpsmost of the time.
PSMlock. We first verify the PSMlock as other mechanisms areimplemented on top of it. Figure 20 plots the power saving fromPSMlock. Continuous video applications leave little chance for
0
20
40
60
80
100
Tethe
red
Video
Loca
l Video
Map
Nav
igat
ion
Gallery
Prese
ntat
ion
Po
we
r S
avin
gs (
mW
)
0.7%0.9%
5.2%
3.0%3.3%
Figure 20: Power saving from PSMlock.
finer-grained PSM control (Section 4.5.1), and hence only 17.6 mWand 16.8 mW of saving on average, for local and tethered streaming,respectively. For bursty video applications, Map benefits most interms of absolute (80 mW) power saving values, followed by Galleryand Presentation. This is consistent with the relative video trafficintensity they generate. Overall, the relative saving is 3% to 5.2%.
All our follow-on micro-benchmarks run on top of the PSMlock-optimized system.
Video Tail Cutting. We focus on the power saving from adaptivetail cutting in the local-streaming case. Tethered streaming differsonly in base power. Figure 21 plots measurement results across 3applications with bursty video traffic. Saving for presentation isonly 2.3%, since the interval between video scenes is long and staticsystem idle power dominates. Due to shorter interval, saving for thegallery application is more noticeable (5.6%). Map benefits most(19.6%) because of its short display interval and simple images thatlead to more space for tail cutting.
We now evaluate the impact on video quality, focusing on themap application that experienced the most aggressive tail cutting.Figure 22 shows that PSNR is almost unaffected compared withthe baseline 1-second fixed tail in Android. Thus, our adaptive tailcutting algorithm can effectively reduce video tail traffic withouthurting user experience.
Video Pass-through, batching and prefetching. Since batch-ing/prefetching needs to be enabled together with pass-through, weevaluate their joint impact on power consumption. In this exper-iment, the source plays a 1-minute video clip locally while mira-casting. To quantify the power saving across different video con-figurations, the video clip has multiple versions with resolutionfrom 144p to 720p, corresponding to bit-rate of 100 Kbps to 3Mbps. We first measure the power saving from pass-through. Batch-ing/prefetching’s saving is measured as the additional power reduc-tion after enabling them.
Figure 24 shows that pass-through saves 48% to 54% of powercompared with the baseline system, and batching/prefetching savesadditional 3% to 7% atop. It might seem counter-intuitive that thesaving is insensitive to video resolution and bit-rate configurations,considering the codec power increases proportionally with videotraffic load (Section 3.2). Note however that this measurementinvolves both codec and network power consumption. For a lowresolution video, whereas pass-through saves less codec power, itsaves more network power since much less video traffic is passedto the NIC. Without pass-through, the Miracast codec outputs at aconstant bit-rate irrespective of the input video resolution.
To quantify the latency due to batching, we run a stopwatchapplication on the source and cast its UI on the sink. The timer onthe sink’s screen always lags behind the sources’, and the differenceequals Miracast’s end-to-end latency. This measurement approach

0
100
200
300
Gallery
Prese
ntat
ion
Map
Po
we
r sa
vin
g (
mW
)
5.6%
2.3%
19.6%
Figure 21: Power saving from adaptive tailcutting.
0.2
0.4
0.6
0.8
1
25 30 35 40
Fra
ctio
n o
f fr
am
es
PSNR (dB)
No Tail1s Tail
Adaptive
Figure 22: Distribution of PSNR acrosstiles in the Map application.
0
200
400
600
800
1000
1200
1400
0 2 4 6 8 10 12
La
ten
cy (
ms)
Batch Size (Frames)
AggregationPass-through, No User
Pass-through, With User
Figure 23: Impact of batching/aggregationon latency.
0
20
40
60
144p 240p 360p 480p 540p 720p900
1000
1100
1200
1300
Pow
erSavings
(%)
Pow
erSavings
(mW)
Batching (%)
Passthrough (%)
Batching+passthrough (mW)
Passthrough (mW)
Figure 24: Power saving from pass-through and batch-ing/prefetching (batch size 20) for local video Miracast.
does not work when pass-through is enabled, since the source doesnot display the video. We thus synchronize the source and sink bysynchronizing them to the same NTP server prior to the start ofeach test, and then measure the time it takes from user’s playbackcommand to the time when the sink starts playback. Similarly, whenuser intervention occurs, the latency equals the time it takes from theuser’s stop command to the time the sink stops playback. The errorintroduced by NTP is measured to be less than 10ms, and keepsconsistent over a period of 10 minutes, which is long enough foreach test to be done.
Using a similar measurement approach as in batching, we canquantify the latency of the straightforward aggregation approach(Sec. 4.3.2), which waits for the codec output and aggregatesvideo frames together. Figure 23 shows that, without pass-through,straightforward aggregation increases latency linearly. Even an ag-gregation of 3 video frames results in an unacceptable latency of 1second. Note that even without aggregation (aggregation size = 1)the baseline system experiences 400 ms latency, due to the codec’sprocessing overhead and associated queuing delay.
Remarkably, with pass-through, the latency is reduced from 400ms to around 26 ms with a batching/prefetching size of 1 frame. Asthe batch size increases, the increase of air-time cost is negligible,and further absorbed by the buffering at the sink side. Even with userintervention, we observe only 400 ms of latency when 12 frames arebatched.
Off-channel Miracast. We verify the model-based channel se-lection (Section 4.4.1) directly in the office environment with naturalcontending traffic. Our energy-aware approach is compared with themost power consuming channel, and a random selection that picks 3channels arbitrarily and take the average power consumption. TheMiracast link setup is the same as in Section 4.4.1. Table 2 lists themeasured power consumption. For local video, our approach furthersaves 49 mW (2.3%) and 36 mW (1.8%), compared with worst andrandom case, respectively. The small percentage is mainly attributedto the low contending traffic during the test period (below 1 Mbps).Since power consumption increases linearly with contention traffic,
Energy-aware Worst-case Random
Local (mW) 1955.5 2004.6 1991.1
Tethered (mW) 2424.4 2440.5 2427.9
Table 2: Effectiveness of energy-aware channel selection. Testsdone in an office environment during day time.
0
50
100
150
200
0 5 10 15 20 0
2
4
6
8
10
Pow
er
savin
g (
mW
)
Mean s
avin
g r
atio (
%)
Contention Bitrate (Mbps)
(mW)(%)
Figure 25: Power saving from off-channel Miracast for tetheredvideo.
the saving will increase in environment where the worst-case chan-nel is heavily congested. For tethered video, the saving is smallerdue to self-contention between the AP-source and source-sink links.
We further evaluate the coarse-grained channel flipping protocolby injecting different levels of contention traffic on the AP-sourcechannel, and allowing the source-sink link to flexibly select/switchchannels. Experimental results in Figure 25 show that the sav-ing from channel flipping increases with contention intensity, andplateaus at 8% when the AP-source channel becomes saturated bycontention. Even if no external contention exists, channel flippingcan still save 37 mW (1.3%) owing to reduction of self-contention.
5.2 System-Level EvaluationWe present a comprehensive evaluation of our energy-efficient
Miracast system in two different contention environment: (i) se-vere contention, where we try to saturate the wireless channel bygenerating 42 Mbps of UDP traffic from a separate link, whichmakes the coexisting Miracast link extremely laggy. (ii) no con-tention, an environment with a completely idle 5 GHz channel. Allother Miracast parameter settings are configured to the default inthe baseline system (Section 3.1). We break down the power sav-ing by incrementally enabling each optimization mechanism, in thefollowing order: PSMlock, tail-cutting, pass-through, batching/pre-fetching/aggregation and background suppression. Contribution ofeach mechanism is the power saving incremental on top of previousones. Since the experiment fixes on one channel, we disable theoff-channel Miracast.
The results in Figure 26 show that, compared to the baselinesystem, the overall power saving ranges from 29% to 61% dependingon application traffic patterns. Notably, contention intensity plays a

0
20
40
60
80
100
Tethe
red
Video
Loca
l Video
Map
Nav
igat
ion
Gallery
Prese
ntat
ion
Po
we
r S
avin
gs (
%)
Silent Audio
Tail Cut
Aggregation
Prefecting
Passthrough
PSM Lock
A
A
A
AA
B
B
B
BB
Figure 26: Power saving breakdown for different applications,in two contention environment. A: under severe contention. B:without contention.
marginal role on the overall percentage of power saving, althoughit affects the absolute value of power consumption by up to 100mW (Section 3.2). However, contention does vary the relativecontribution of different optimization mechanisms.
For continuous video applications, power saving comes predomi-nantly from pass-through (42-54%), followed by batching/prefetching(3-7%). PSMlock barely helps in severe contention as each clusterof traffic is broken by contending transmissions, yet still offers 5%of saving when the channel is idle.
For bursty video applications, PSMlock exhibits similar behavior.The main contribution comes from tail cutting, frame aggregation,and background audio suppression. Tail cutting shows consistentsavings as in our microbenchmark evaluation. By reducing redun-dant background traffic, silent audio suppression can save 5% to 9%of power. For frame aggregation, we configure the batch size to 3video frames, which adds 200 ms of latency on top of the baseline(Section 5.1), and saves 17-21% in an idle environment, and 7% to16% under severe contention.
We emphasize that the power saving evaluation involves an en-tire smartphone system, instead of the Miracast application poweralone. Among all contributing factors, only the off-channel miracast-ing mechanism adopts a model-driven approach, and is evaluatedseparately in Section 5.1.
6. DISCUSSION AND FUTURE WORKOur implementation and experiments have been conducted on
the Galaxy Nexus Android phone. However, the Miracast poweroptimization mechanisms are not restricted to any hardware model.They do require modifications to the Miracast software inside thesource node and may result in different power savings across differ-ent models.
Although Miracast is envisioned to support highly interactiveapplications like mobile gaming, we have not found any of suchapplications tailored to Miracast. Due to the 400 ms of end-to-endlatency (Figure 23), we contend that the current Miracast frame-work is unsuitable for mobile gaming. Though pass-through andprefetching can reduce latency by an order of magnitude, they onlyhelp applications that provide encoded video frames. Improving theresponsiveness/energy of interactive Miracast requires a joint opti-mization of codec and queuing operations between system models,which is left as our future work.
Due to limitation of the available firmware, we have not exploredalternative WiFi Direct power saving protocols (e.g., NoA) which,
compared with PSMlock, enables more fine-grained control of thesource’s sleeping schedule. Similarly, the off-channel WiFi Direct,once enabled in firmware, will provide more power saving than thecoarse-grained emulation approach that we evaluated. With newgeneration of WiFi, transmission cost may decrease. However, wenote that the main power cost in Miracast lies in codec process-ing, plus the idle listening power caused by redundant traffic thatkeeps the NIC alive. Thus, we expect video pass-through, prefetch-ing/batching and tail cutting to be useful even if WiFi evolves tomuch higher rate.
There are also some practical concerns for production level im-plementation of the video pass-through mechanism. For example,some users or applications may wish to pass-through full screenvideos only, thus it is possible for other elements on the screento be displayed together with the video side by side on the sink.We should allow users and applications to control their preferencesabout the behavior. Also, it is possible that multiple video elementscan be present simultaneously while Miracast is in use. In this case,it might be favorable to disable video pass-through temporarily, orto employ extra algorithm to determine which video is the “main”one and should enforce pass-through.
7. RELATED WORKQuality-aware mobile video streaming. Echoing the fast pen-
etration of mobile devices in the past decade, substantial researchwork has focused optimizing video quality over wireless networks.The overarching goals involve minimizing startup latency, contain-ing jitter under bandwidth fluctuation, etc. [17]. To date, commer-cial deployment has adopted many solution mechanisms [18], e.g.,video bit-rate adaptation, caching [19], and Dynamic Streaming overHTTP (DASH). The same server may enforce different mechanismsover different mobile devices or applications to balance between amatrix of practical factors such as video traffic profile and networkcondition.
Energy-aware mobile video streaming. Apart from performanceoptimization, energy cost reduction has been a parallel theme. Mostsolutions shape the downlink video traffic to create intermittentsleeping opportunities for the mobile client, while respecting videoquality constraints. Depending on the vantage point of execution,the solutions can be classified as follows. (i) Client-side protocolsallow a mobile video receiver to proactively pull contents from thestreaming server based on playback buffer status [20] or predictionof demand [21]. (ii) Proxy-based protocols act on behalf of theserver to reshape video traffic into bursts, and harnesses WiFi’s PSMfor clients’ sleep scheduling [22]. (iii) Server-assisted protocolscustomize the traffic scheduler at streaming servers. For instance, ithas been observed that YouTube, Vimeo and DailyMotion serverstrigger a chunk-mode strategy [18] to create periodic bursts. Ulti-mately, the power saving depends on how aggressive the client’sPSM decides to harnesses the sleeping opportunities.
At the application layer, content adaptation offers a flexible meansof trading video quality for energy saving. The H.264 scalable videocoding standard [23] compresses video data into a low-rate base-layer plus enhancement layers that can be gracefully added. It allowsa client to inform the server of its video quality choice according todecoding capability and power budget [24]. The server is ready forsuch customized requests when running DASH [25].
System-level power optimization for mobile video. From a mo-bile system perspective, a variety of strategies exist to optimize thepower consumption, some applicable beyond mobile video play-back. For software codecs, dynamic voltage/frequency scaling canbe executed based on observation of video workload [26]. For ASICcodecs, power consumption is closely related with the computational

cost in compression. By modeling the relation between computa-tional cost and rate-distortion (quality reduction), and leveragingextraneous information (e.g., motion prediction from sensors [27]),it is possible to customize a set of codec parameters to optimize thepower-quality tradeoff [28]. Yet to our knowledge, such customiza-tion is not supported by commercial smartphone video codecs. Inaddition, adaptive algorithms have been proposed that change back-light level or image brightness [29, 30], to curtail the huge displaypower cost during video playback. On the other hand, caution hasbeen posed w.r.t. fidelity loss due to aggressive screen content-awareoptimization [31].
Network interface power optimization. Many energy savingprotocols that are application-independent have been proposed toaddress the inherent limitations of the WiFi PSM. For example,NAPman [32] and SleepWell [33] isolate the traffic bursts of differ-ent APs/clients, to reduce the idle listening power due to contention.Many COTS smartphones use A-PSM (Section 4.5.1), but it is shownto nullify the energy saving of PSM during video streaming, as ittends to keep the client in active mode [34]. Further improvement tohas been proposed that cuts A-PSM’s keep-alive or tail time [14]. Incellular networks, the mobile network interface also bears a keep-alive period after each transmission, which incurs substantial tailenergy when traffic is bursty [35]. The video tail problem that wehave identified bears similar spirit, but a different tradeoff – betweenenergy saving and video quality rather than network performance.
New protocols have also been designed to optimize the powerconsumption of mobile hotspots. DozyAP [36], for example, in-troduces a coarse sleep scheduling mechanism to 802.11 softAP.Cool-Tether [37] aggregates the cellular connections from multiplesmartphones as a single backhaul, and employs a reverse-tetheringarchitecture, requesting the smartphones to act as clients of a mobilehost, thus enabling their PSM. The latest WiFi-direct power-savingschemes may fundamentally simplify such protocols.
Optimizing screen sharing applications. Screen sharing is arelatively new mobile application that garnered little attention in theresearch literature. Most recent work [38,39] focused on maintainingvideo quality. Ha et al. [40] simulated a frame-rate adaptationscheme that reduces Miracast traffic load by analyzing the dynamismof screen content. This approach involves substantial computationaloverhead and the practical power saving remains unknown.
Unlike Miracast, Chromecast [41] allows the sink side to directlydownload videos from the Internet, at the cost that each App mustbe modified accordingly, whereas Miracast provides a application-transparent solution. Also, in some situations the sink might nothave Internet access, or the source has access to a private networkwhile the sink does not, making it impossible for the Chromecastapproach to work properly. Thus, the Miracast approach is moreuniversal.
8. CONCLUSIONIn this paper, we have conducted the first systematic measurement
study on the power consumption of Miracast. The measurementenables a modeling framework that associates network/codec powerwith the Miracast channel selection as well as video traffic load.Insights from the measurement lead to a set of optimization mecha-nisms which uncover and remove redundant Miracast traffic, curtailunnecessary computations, and improve transmission efficiency viabatching/prefetching. Our implementation on a Miracast-compatiblesmartphone consolidates these mechanisms and demonstrates sub-stantial power savings.
AcknowledgementWe appreciate insightful comments and feedback from the shep-
herd, Romit Roy Choudhury, and the anonymous reviewers. Thework reported in this paper was supported in part by the NSF un-der Grant CNS-1318292, CNS-1343363, CNS-1350039 and CNS-1404613.
9. REFERENCES[1] Android Nexus Device, “Project Your Android Device’s
Screen,” 2014. [Online]. Available:https://support.google.com/nexus/answer/2865484
[2] Microsoft, “Project to a wireless display with Miracast,”http://windows.microsoft.com/en-us/windows-8/project-wireless-screen-miracast,2014.
[3] ——, “Microsoft Wireless Display Adapter,”http://www.microsoft.com/hardware/en-us/p/wireless-display-adapter,2014.
[4] Amazon.com, Inc., “Use Amazon Fire TV as a DisplayMirroring Destination,” 2014. [Online]. Available:http://www.amazon.com/gp/help/customer/display.html?nodeId=201453020
[5] M. Kennedy, A. Ksentini, Y. Hadjadj-Aoul, and G. Muntean,“Adaptive Energy Optimization in Multimedia-CentricWireless Devices: A Survey,” IEEE Communications Surveys& Tutorials, vol. 15, no. 2, 2013.
[6] D. Camps-Mur, X. Pérez-Costa, and S. Sallent-Ribes,“Designing Energy Efficient Access Points with Wi-Fi Direct,”Computer Networks, vol. 55, no. 13, 2011.
[7] Wi-Fi Alliance, “Wi-Fi Display Technical Specification v1.2,”2011.
[8] Richard Lai, “CarKarPlay Display Mirrors Your Smartphoneon Your Dashboard,” 2014. [Online]. Available:http://www.engadget.com/2014/08/22/ipazzport-carkarplay-wireless-display/
[9] Monsoon Solutions, Inc., “Monsoon Power Monitor,”http://www.msoon.com/LabEquipment/PowerMonitor/.
[10] A. Garcia-Saavedra, P. Serrano, A. Banchs, and G. Bianchi,“Energy Consumption Anatomy of 802.11 Devices and ItsImplication on Modeling and Design,” in Proc. of CoNEXT,2012.
[11] M. Carvalho, C. Margi, K. Obraczka, andJ. Garcia-Luna-Aceves, “Modeling Energy Consumption inSingle-hop IEEE 802.11 Ad Hoc Networks,” in Proc. of IEEEICCCN, 2004.
[12] L. Zappaterra and H.-A. Choi, “Efficient Power-awareMulti-Channel Selection for Dynamic Cognitive RadioNetworks,” in Proc. of IEE WCNC.
[13] B. Yang, Y. Shen, X. Guan, and W. Wang, “Energy-awareOpportunistic Channel Access With Decentralized ChannelState Information,” in Proc. of IEEE CDC, 2011.
[14] A. J. Pyles, X. Qi, G. Zhou, M. Keally, and X. Liu, “SAPSM:Smart Adaptive 802.11 PSM for Smartphones,” in Proc. ofACM UbiComp, 2012.
[15] Linux Wireless, “Automatic Channel Selection,” 2014.[Online]. Available:http://wireless.wiki.kernel.org/en/users/documentation/acs
[16] D. Camps-Mur, A. Garcia-Saavedra, and P. Serrano,“Device-to-Device Communications With Wi-Fi Direct:Overview and Experimentation,” IEEE WirelessCommunications, vol. 20, no. 3, 2013.

[17] L. Guo, E. Tan, S. Chen, Z. Xiao, O. Spatscheck, andX. Zhang, “Delving into Internet Streaming Media Delivery:A Quality and Resource Utilization Perspective,” in Proc. ofACM IMC, 2006.
[18] M. Hoque, M. Siekkinen, J. Nurminen, and M. Aalto,“Dissecting Mobile Video Services: An Energy ConsumptionPerspective,” in Proc. of IEEE WoWMoM, 2013.
[19] S.-H. Shen and A. Akella, “An Information-awareQoE-centric Mobile Video Cache,” in Proc. of ACMMobiCom, 2013.
[20] D. Bertozzi, L. Benini, and B. Ricco, “Power Aware NetworkInterface Management for Streaming Multimedia,” in Proc. ofIEEE WCNC, 2002.
[21] Y. Wei, S. M. Bhandarkar, and S. Chandra, “A Client-sideStatistical Prediction Scheme for Energy Aware MultimediaData Streaming,” IEEE Trans. on Multimedia, vol. 8, no. 4,2006.
[22] S. Chandra and A. Vahdat, “Application-Specific NetworkManagement for Energy-Aware Streaming of PopularMultimedia Formats,” in Proc. of USENIX ATC, 2002.
[23] H. Schwarz, D. Marpe, and T. Wiegand, “Overview of theScalable Video Coding Extension of the H.264/AVC Standard,”IEEE Transactions on Circuits and Systems for VideoTechnology, vol. 17, no. 9, 2007.
[24] K. Choi, K. Kim, and M. Pedram, “Energy-Aware MPEG-4FGS Streaming,” in Proc. of Design Automation Conference(DAC), 2003.
[25] S. Akhshabi, A. C. Begen, and C. Dovrolis, “An ExperimentalEvaluation of Rate-adaptation Algorithms in AdaptiveStreaming over HTTP,” in Proc. of ACM Multimedia, 2011.
[26] Z. Cao, B. Foo, L. He, and M. van der Schaar, “Optimalityand Improvement of Dynamic Voltage Scaling Algorithms forMultimedia Applications,” IEEE Transactions on Circuits andSystems, vol. 57, no. 3, 2010.
[27] X. Chen, Z. Zhao, A. Rahmati, Y. Wang, and L. Zhong,“SaVE: Sensor-assisted Motion Estimation for EfficientH.264/AVC Video Encoding,” in Proc. of ACM Multimedia,2009.
[28] E. Akyol and M. van der Schaar, “Compression-Aware EnergyOptimization for Video Decoding Systems With PassivePower,” IEEE Transactions on Circuits and Systems for VideoTechnology, vol. 18, no. 9, 2008.
[29] P.-C. Hsiu, C.-H. Lin, and C.-K. Hsieh, “Dynamic BacklightScaling Optimization for Mobile Streaming Applications,” inProc. of IEEE ISLPED, 2011.
[30] B. Anand, K. Thirugnanam, J. Sebastian, P. G. Kannan, A. L.Ananda, M. C. Chan, and R. K. Balan, “Adaptive DisplayPower Management for Mobile Games,” in Proc. of ACMMobiSys, 2011.
[31] S. Chandra, J. T. Biehl, J. Boreczky, S. Carter, and L. A.Rowe, “Understanding Screen Contents for Building a HighPerformance, Real Time Screen Sharing System,” in Proc. ofACM Multimedia, 2012.
[32] E. Rozner, V. Navda, R. Ramjee, and S. Rayanchu, “NAPman:Network-assisted Power Management for WiFi Devices,” inProc. of ACM MobiSys, 2010.
[33] J. Manweiler and R. Roy Choudhury, “Avoiding the RushHours: WiFi Energy Management via Traffic Isolation,” inProc. of ACM MobiSys, 2011.
[34] E. Tan, L. Guo, S. Chen, and X. Zhang, “PSM-throttling:Minimizing Energy Consumption for Bulk DataCommunications in WLANs,” in IEEE InternationalConference on Network Protocols, 2007.
[35] F. Qian, Z. Wang, A. Gerber, Z. M. Mao, S. Sen, andO. Spatscheck, “Characterizing Radio Resource Allocation for3G Networks,” in Proc. of ACM IMC, 2010.
[36] H. Han, Y. Liu, G. Shen, Y. Zhang, and Q. Li, “DozyAP:Power-efficient Wi-Fi Tethering,” in Proc. of ACM MobiSys,2012.
[37] A. Sharma, V. Navda, R. Ramjee, V. N. Padmanabhan, andE. M. Belding, “Cool-Tether: Energy Efficient On-the-FlyWiFi Hot-spots Using Mobile Phones,” in Proc. of ACMCoNEXT, 2009.
[38] C.-F. Hsu, D.-Y. Chen, C.-Y. Huang, C.-H. Hsu, and K.-T.Chen, “Screencast in the Wild: Performance and Limitations,”in Proc. of ACM Multimedia, 2014.
[39] S. Chandra, J. Boreczky, and L. A. Rowe, “High PerformanceMany-to-many Intranet Screen Sharing with DisplayCast,”ACM Trans. Multimedia Comput. Commun. Appl., vol. 10,no. 2, 2014.
[40] J. Ha, P. Bae, K.-W. Lim, J. Ko, and Y.-B. Ko, “Poster abstract:Mobile contents on the big screen: Adaptive frame filtering formobile device screen sharing,” in Proc. of ACM SenSys, 2014.
[41] B. Johnson, “How Chromecast Works,” 2014. [Online].Available:http://electronics.howstuffworks.com/chromecast.htm