energy demand is expected to double to 1,464 mtoe by 2035
TRANSCRIPT
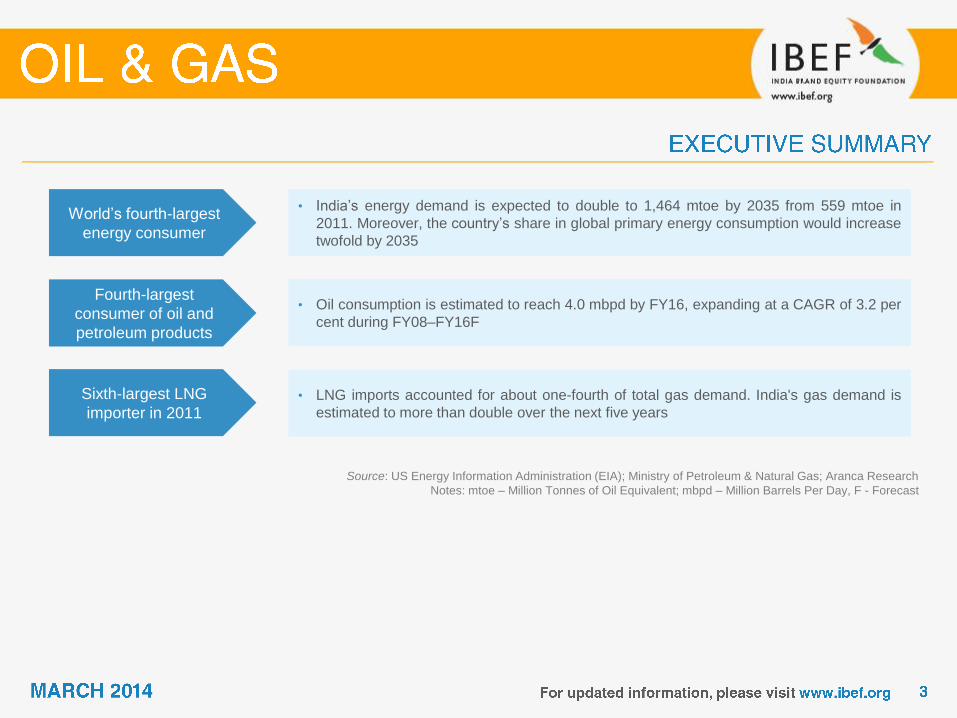
World’s fourth-largest
energy consumer
• India’s energy demand is expected to double to 1,464 mtoe by 2035 from 559 mtoe in
2011. Moreover, the country’s share in global primary energy consumption would increase
twofold by 2035
Fourth-largest
consumer of oil and
petroleum products
• Oil consumption is estimated to reach 4.0 mbpd by FY16, expanding at a CAGR of 3.2 per
cent during FY08–FY16F
Sixth-largest LNG
importer in 2011 • LNG imports accounted for about one-fourth of total gas demand. India's gas demand is
estimated to more than double over the next five years
Source: US Energy Information Administration (EIA); Ministry of Petroleum & Natural Gas; Aranca Research
Notes: mtoe – Million Tonnes of Oil Equivalent; mbpd – Million Barrels Per Day, F - Forecast
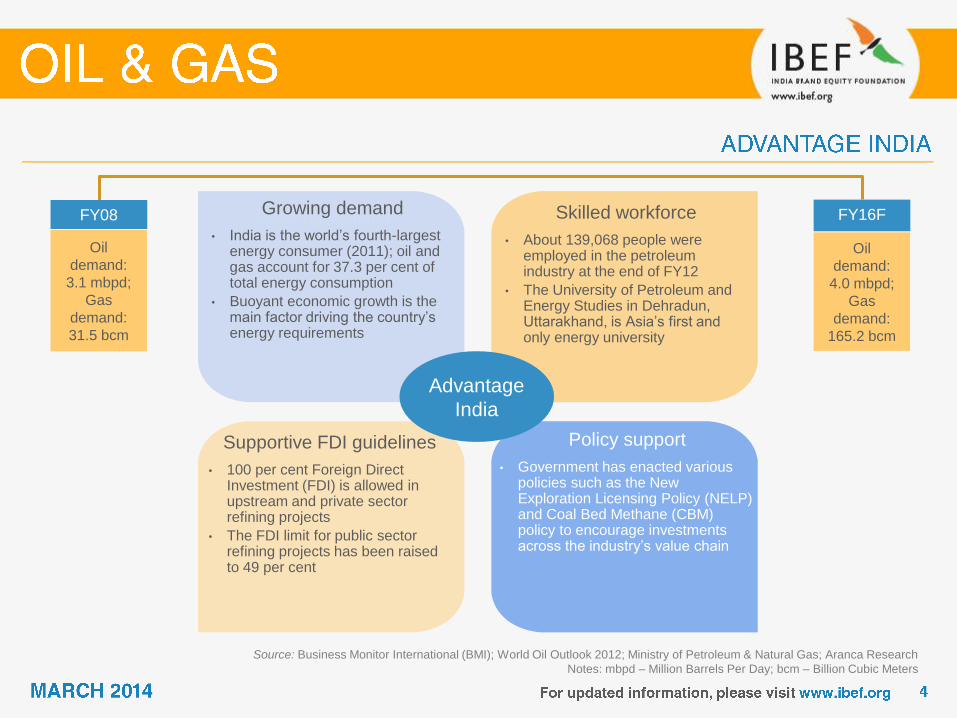
Growing demand
Source: Business Monitor International (BMI); World Oil Outlook 2012; Ministry of Petroleum & Natural Gas; Aranca Research
Notes: mbpd – Million Barrels Per Day; bcm – Billion Cubic Meters
Growing demand
• India is the world’s fourth-largest energy consumer (2011); oil and gas account for 37.3 per cent of total energy consumption
• Buoyant economic growth is the main factor driving the country’s energy requirements
Skilled workforce
• About 139,068 people were employed in the petroleum industry at the end of FY12
• The University of Petroleum and Energy Studies in Dehradun, Uttarakhand, is Asia’s first and only energy university
Policy support
• Government has enacted various policies such as the New Exploration Licensing Policy (NELP) and Coal Bed Methane (CBM) policy to encourage investments across the industry’s value chain
Supportive FDI guidelines
• 100 per cent Foreign Direct Investment (FDI) is allowed in upstream and private sector refining projects
• The FDI limit for public sector refining projects has been raised to 49 per cent
FY08
Oil
demand:
3.1 mbpd;
Gas
demand:
31.5 bcm
FY16F
Oil
demand:
4.0 mbpd;
Gas
demand:
165.2 bcm
Advantage
India
Source: US Energy Information Administration, Ministry of Petroleum & Natural Gas; Aranca Research
Notes: bcm – Billion Cubic Meters; tcf – Trillion Cubic Feet; mbpd – Million Barrels Per Day; mmscmd – Million Metric Standard Cubic Meter Per Day,
ONGC – Oil & Natural Gas Corporation of India; IOCL – Indian Oil Corporation Ltd
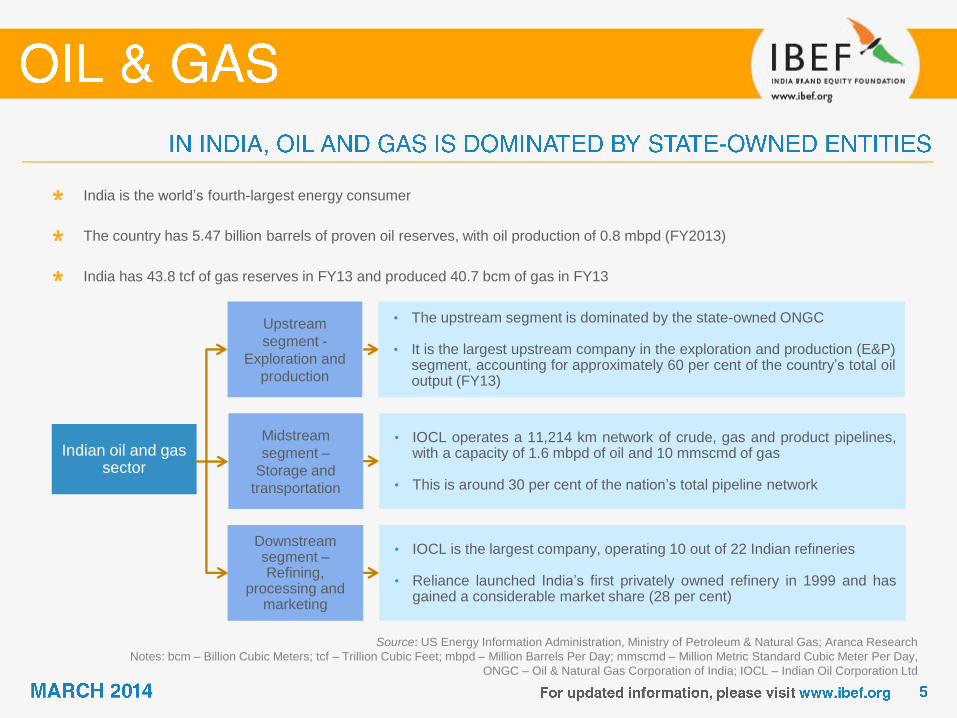
India is the world’s fourth-largest energy consumer
The country has 5.47 billion barrels of proven oil reserves, with oil production of 0.8 mbpd (FY2013)
India has 43.8 tcf of gas reserves in FY13 and produced 40.7 bcm of gas in FY13
Indian oil and gas sector
Midstream
segment –
Storage and
transportation
Downstream segment – Refining,
processing and marketing
• IOCL operates a 11,214 km network of crude, gas and product pipelines, with a capacity of 1.6 mbpd of oil and 10 mmscmd of gas
• This is around 30 per cent of the nation’s total pipeline network
• IOCL is the largest company, operating 10 out of 22 Indian refineries
• Reliance launched India’s first privately owned refinery in 1999 and has gained a considerable market share (28 per cent)
Upstream
segment -
Exploration and
production
• The upstream segment is dominated by the state-owned ONGC • It is the largest upstream company in the exploration and production (E&P)
segment, accounting for approximately 60 per cent of the country’s total oil output (FY13)

Oil consumption in India and current reserves
Source: Ministry of Oil & Natural Gas; BMI forecasts; Aranca Research
Notes: F – Forecast; CAGR – Compound Annual Growth Rate;
mbpd – Million Barrels Per Day; mn bbl – Million Barrels; * - Provisional
Oil consumption is estimated to expand at a CAGR of 3.4
per cent during FY2008–16F to 4.0 mbpd by 2016
Owing to this strong expected growth in demand, India’s
dependency on oil imports is expected to increase further
3.1
3.2
3.9
4.1 4.3
3.5
3.7 3.9 4.0
4,800
4,900
5,000
5,100
5,200
5,300
5,400
5,500
5,600
5,700
5,800
0.0
1.0
2.0
3.0
4.0
5.0
FY08 FY09 FY10 FY11 FY12* FY13F FY14F FY15F FY16F
Oil Consumption (mbpd) - LHS
Proven Oil Reserves (mn bbl) - RHS

Imports and domestic oil production in India
Source: Ministry of Oil & Natural Gas; BMI forecasts; Aranca Research
Notes: F – Forecast; mbpd – Million Barrels Per Day; * - Provisional
In FY13, imports accounted for approximately 80 per cent of
the country’s total oil demand
Backed by new oil fields, domestic oil output is anticipated
to grow to 1.0 mbpd by FY16
0.7 0.7 0.7 0.8 0.8 0.8 1.0 1.0 1.0
2.5 2.7 3.2
3.3 3.4 3.7
2.7 2.9 3.0
0.0
0.5
1.0
1.5
2.0
2.5
3.0
3.5
4.0
4.5
5.0
FY08 FY09 FY10 FY11 FY12* FY13* FY14F FY15F FY16F
Oil Production (mbpd) Oil Imports (mbpd)

Proven reserves and total gas consumption in the
country (bcm)
Source: PPAC, Ministry of Oil & Natural Gas; Aranca Research
Notes: F – Forecast; bcm – Billion Cubic Meters;
CAGR – Compound Annual Growth Rate,
* - Provisional
With India developing gas-fired power stations,
consumption is up more than 160 per cent since 1995
Demand is not likely to simmer down any time soon, given
strong economic growth and rising urbanisation; during
FY2008–17F, gas consumption is likely to expand at a
CAGR of 21.0 per cent
31
32
47
51
46
40
13
7
15
0
16
5
17
5
1,0
90
1,1
15
1,1
49
1,2
78
1,3
30
1,3
30
1,3
30
1,3
30
1,3
30
1,3
30
0
200
400
600
800
1,000
1,200
1,400
FY08 FY09 FY10 FY11 FY12* FY13* FY14F FY15F FY16F FY17F
Gas Consumption Proven Gas Reserves
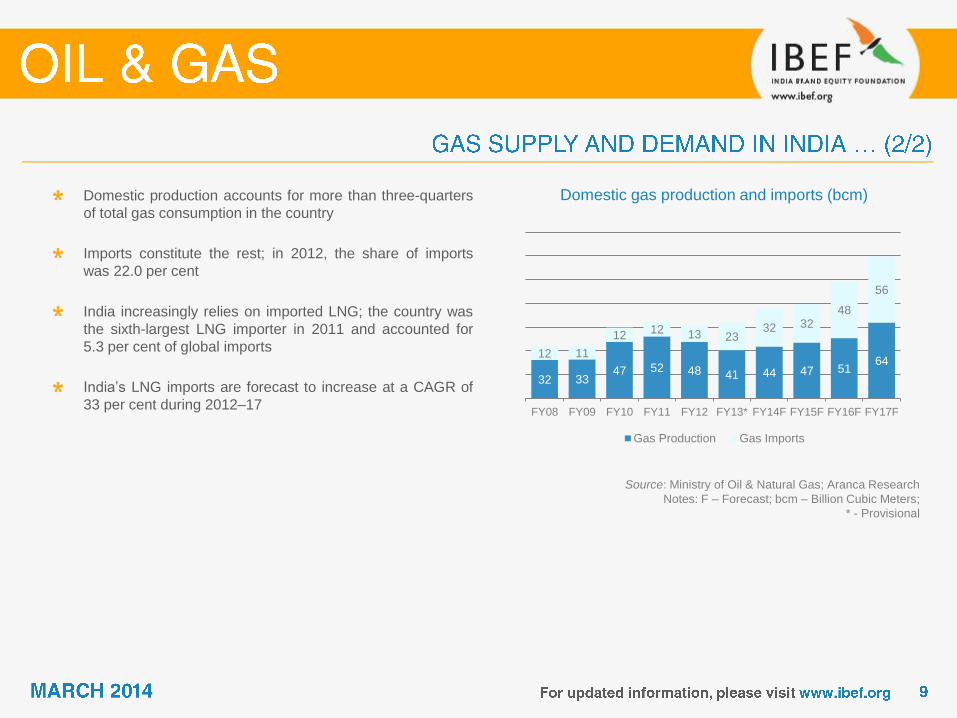
Domestic gas production and imports (bcm)
Source: Ministry of Oil & Natural Gas; Aranca Research
Notes: F – Forecast; bcm – Billion Cubic Meters;
* - Provisional
Domestic production accounts for more than three-quarters
of total gas consumption in the country
Imports constitute the rest; in 2012, the share of imports
was 22.0 per cent
India increasingly relies on imported LNG; the country was
the sixth-largest LNG importer in 2011 and accounted for
5.3 per cent of global imports
India’s LNG imports are forecast to increase at a CAGR of
33 per cent during 2012–17
32 33 47 52 48 41 44 47 51
64 12 11
12 12 13 23
32 32 48
56
FY08 FY09 FY10 FY11 FY12 FY13* FY14F FY15F FY16F FY17F
Gas Production Gas Imports

Crude oil production (mmt)
Source: Ministry of Petroleum & Natural Gas; Aranca Research
Notes: mmt – Million Metric Tonne; JV – Joint Venture
Total crude oil production was 37.9 mmt during FY13
ONGC accounted for 59.5 per cent of total crude oil
production in India
24.4 26.1 25.9 25.4 24.9 24.4 23.7 22.6
3.2 3.1 3.1 3.5 3.6 3.6 3.8 3.7
4.6 4.8 5.1 4.7 5.3
9.7 10.5 11.6
0
5
10
15
20
25
30
35
40
FY06 FY07 FY08 FY09 FY10 FY11 FY12 FY13
ONGC OIL Private/JV
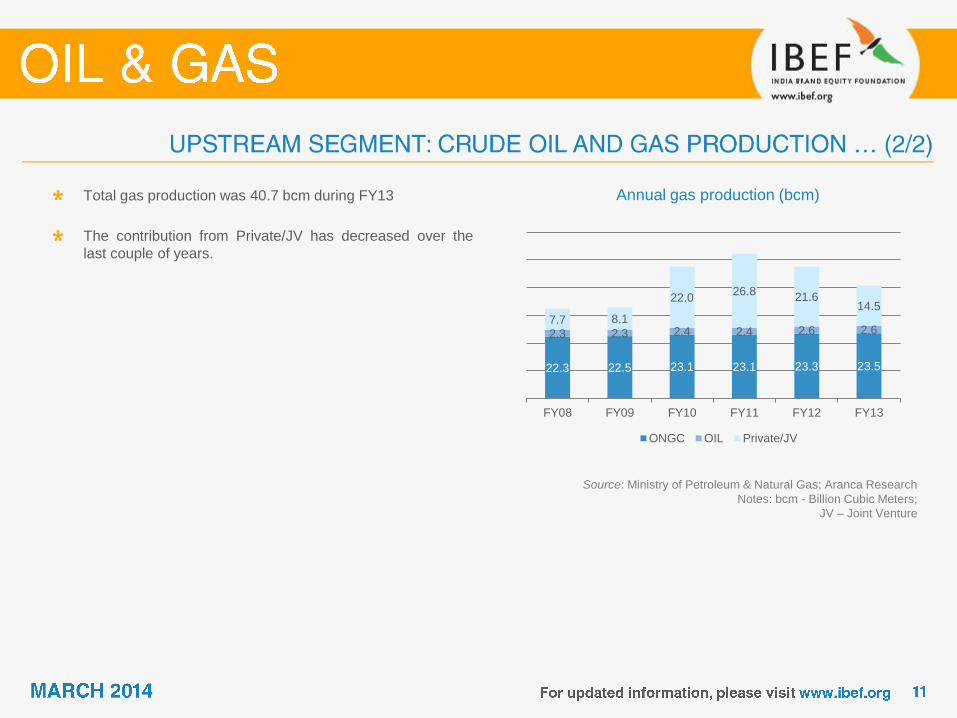
Annual gas production (bcm)
Source: Ministry of Petroleum & Natural Gas; Aranca Research
Notes: bcm - Billion Cubic Meters;
JV – Joint Venture
Total gas production was 40.7 bcm during FY13
The contribution from Private/JV has decreased over the
last couple of years.
22.3 22.5 23.1 23.1 23.3 23.5
2.3 2.3 2.4 2.4 2.6 2.6 7.7 8.1
22.0 26.8
21.6 14.5
FY08 FY09 FY10 FY11 FY12 FY13
ONGC OIL Private/JV

Exploration activities (FY12*) (‘000 meters)
Source: Ministry of Petroleum & Natural Gas; Aranca Research
Note: * - Provisional
During FY12, 1,631,000 meters of wells were explored and developed in India
During the same period, 756 wells were drilled in the country
Most upstream drilling and exploration work is undertaken by state-owned oil companies
ONGC is the leader in the upstream segment and accounts for 62 per cent of total crude oil output in India
Development drilling activities (FY12*)
(‘000 meters)
198
467 87
295
Wells MetreageOnshore Offshore
409
740 62
129
Wells Metreage
Onshore Offshore
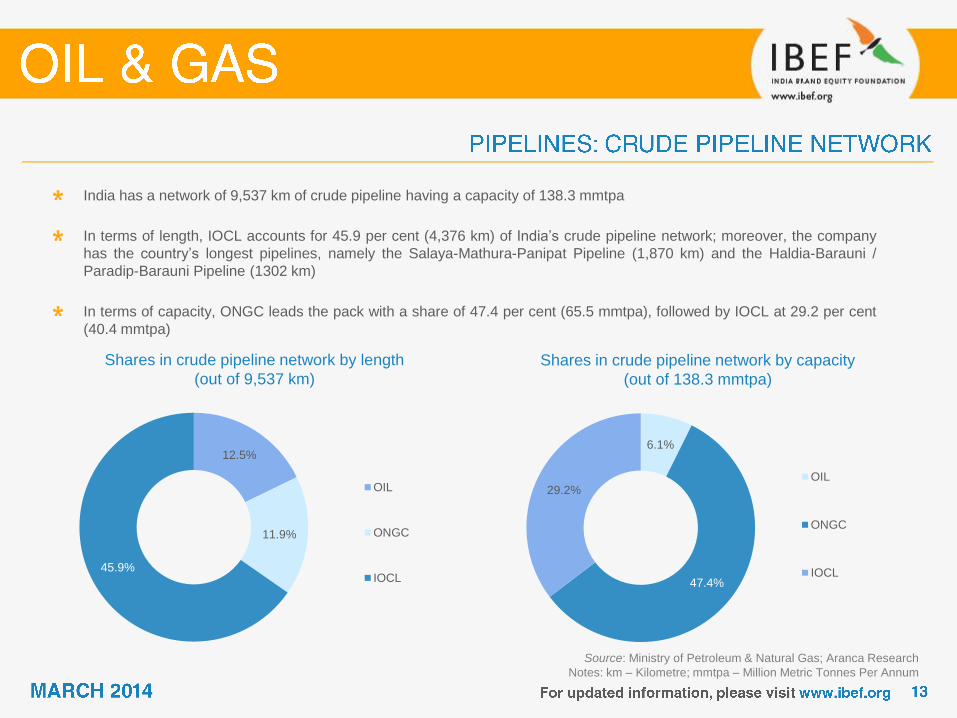
Shares in crude pipeline network by length
(out of 9,537 km)
Source: Ministry of Petroleum & Natural Gas; Aranca Research
Notes: km – Kilometre; mmtpa – Million Metric Tonnes Per Annum
India has a network of 9,537 km of crude pipeline having a capacity of 138.3 mmtpa
In terms of length, IOCL accounts for 45.9 per cent (4,376 km) of India’s crude pipeline network; moreover, the company
has the country’s longest pipelines, namely the Salaya-Mathura-Panipat Pipeline (1,870 km) and the Haldia-Barauni /
Paradip-Barauni Pipeline (1302 km)
In terms of capacity, ONGC leads the pack with a share of 47.4 per cent (65.5 mmtpa), followed by IOCL at 29.2 per cent
(40.4 mmtpa)
Shares in crude pipeline network by capacity
(out of 138.3 mmtpa)
12.5%
11.9%
45.9%
OIL
ONGC
IOCL
6.1%
47.4%
29.2% OIL
ONGC
IOCL
Shares in product pipeline network under
operation by length (out of 11,274 km)*
Source: Ministry of Petroleum & Natural Gas; Aranca Research
Notes: km – Kilometre; mmtpa – Million Metric Tonnes Per Annum, LPG - Liquefied Petroleum Gas, IOC - Indian Oil Corporation,
HPCL - Hindustan Petroleum Corporation Ltd, BPCL - Bharat Petroleum Corporation Ltd, OIL - Oil India Limited, PMHB - Mangalore Hasan Bangalore,
PCCK - Cochin-Coimbatore-Karur
* - As on 30th September 2012
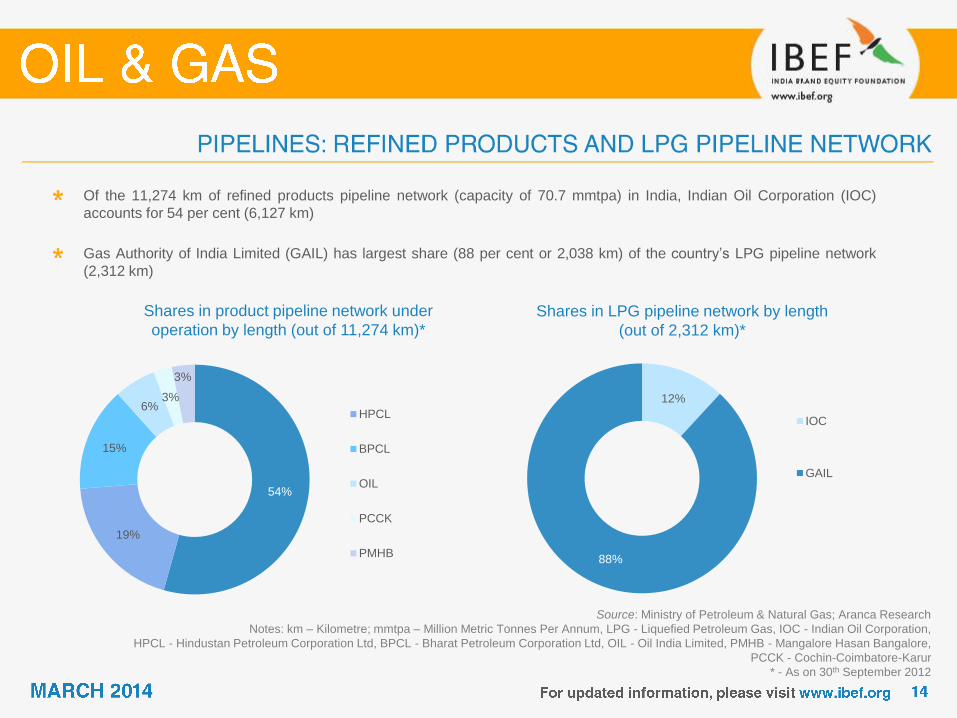
Of the 11,274 km of refined products pipeline network (capacity of 70.7 mmtpa) in India, Indian Oil Corporation (IOC)
accounts for 54 per cent (6,127 km)
Gas Authority of India Limited (GAIL) has largest share (88 per cent or 2,038 km) of the country’s LPG pipeline network
(2,312 km)
Shares in LPG pipeline network by length
(out of 2,312 km)*
12%
88%
IOC
GAIL
54%
19%
15%
6% 3%
3%
HPCL
BPCL
OIL
PCCK
PMHB
Refinery crude throughput (mmt)
Source: Ministry of Petroleum & Natural Gas; Aranca Research
Note: mmt – Million Metric Tonne
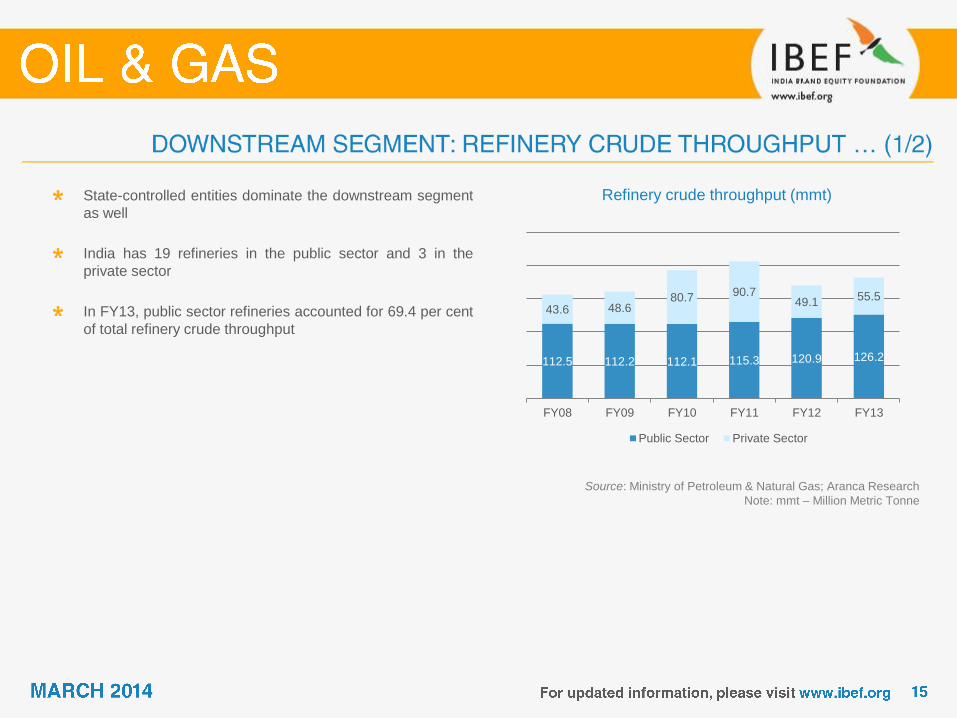
State-controlled entities dominate the downstream segment
as well
India has 19 refineries in the public sector and 3 in the
private sector
In FY13, public sector refineries accounted for 69.4 per cent
of total refinery crude throughput
112.5 112.2 112.1 115.3 120.9 126.2
43.6 48.6 80.7 90.7
49.1 55.5
FY08 FY09 FY10 FY11 FY12 FY13
Public Sector Private Sector
Shares in India's total refining capacity
(FY’13)
Source: Ministry of Petroleum & Natural Gas; PPAC; Aranca Research
Notes: mmt – Million Metric Tonne; * - Provisional, HPCL - Hindustan Petroleum Corporation Ltd, BPCL - Bharat Petroleum Corporation Ltd,
OIL - Oil India Limited, ONGC - Oil and Natural Gas Corporation, IOCL - Indian Oil Corporation Ltd, CPCL - Chennai Petroleum Corporation Limited,
NRL - Numaligarh Refinery Limited, MRPL - Mangalore Refinery and Petrochemicals Limited, RPL - Renegade Petroleum Ltd, EOL - Essar Oil Ltd
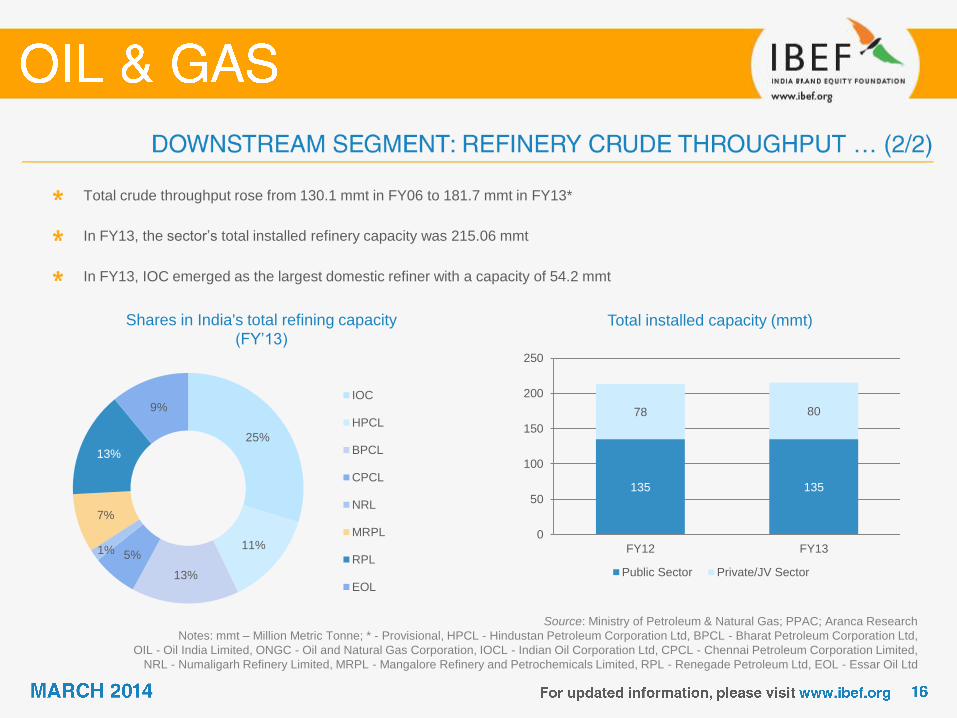
Total crude throughput rose from 130.1 mmt in FY06 to 181.7 mmt in FY13*
In FY13, the sector’s total installed refinery capacity was 215.06 mmt
In FY13, IOC emerged as the largest domestic refiner with a capacity of 54.2 mmt
Total installed capacity (mmt)
25%
11%
13%
5% 1%
7%
13%
9% IOC
HPCL
BPCL
CPCL
NRL
MRPL
RPL
EOL
135 135
78 80
0
50
100
150
200
250
FY12 FY13
Public Sector Private/JV Sector
Petroleum products from crude oil (mmt)
Source: Ministry of Petroleum & Natural Gas; Aranca Research
Notes: mmt – Million Metric Tonne; * - Provisional
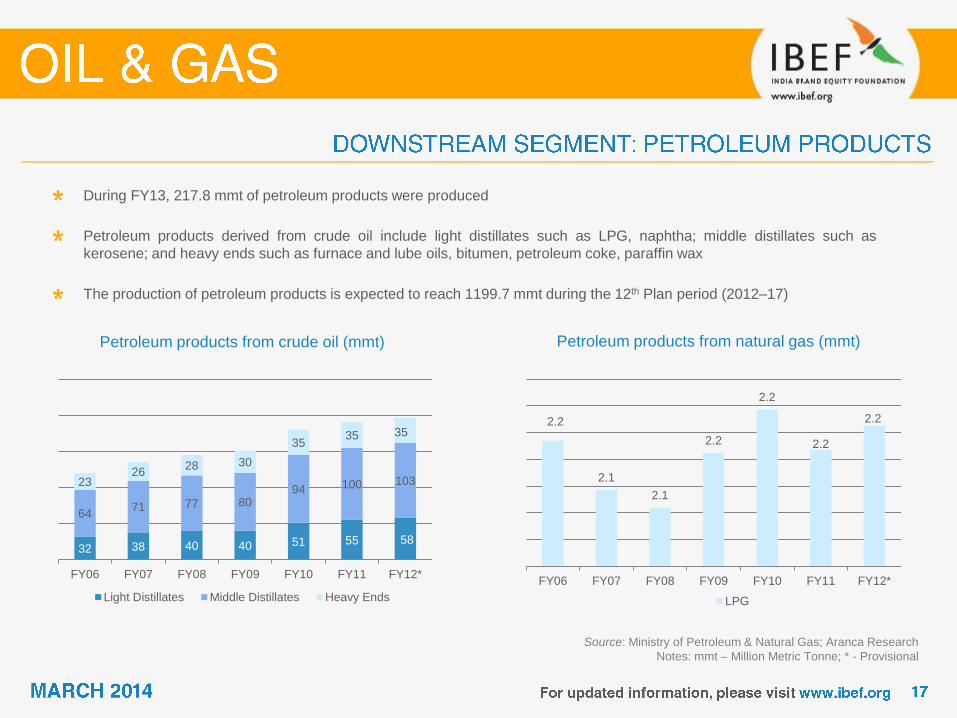
During FY13, 217.8 mmt of petroleum products were produced
Petroleum products derived from crude oil include light distillates such as LPG, naphtha; middle distillates such as
kerosene; and heavy ends such as furnace and lube oils, bitumen, petroleum coke, paraffin wax
The production of petroleum products is expected to reach 1199.7 mmt during the 12th Plan period (2012–17)
Petroleum products from natural gas (mmt)
32 38 40 40 51 55 58
64 71 77 80
94 100 103 23 26
28 30
35 35 35
FY06 FY07 FY08 FY09 FY10 FY11 FY12*
Light Distillates Middle Distillates Heavy Ends
2.2
2.1
2.1
2.2
2.2
2.2
2.2
FY06 FY07 FY08 FY09 FY10 FY11 FY12*
LPG
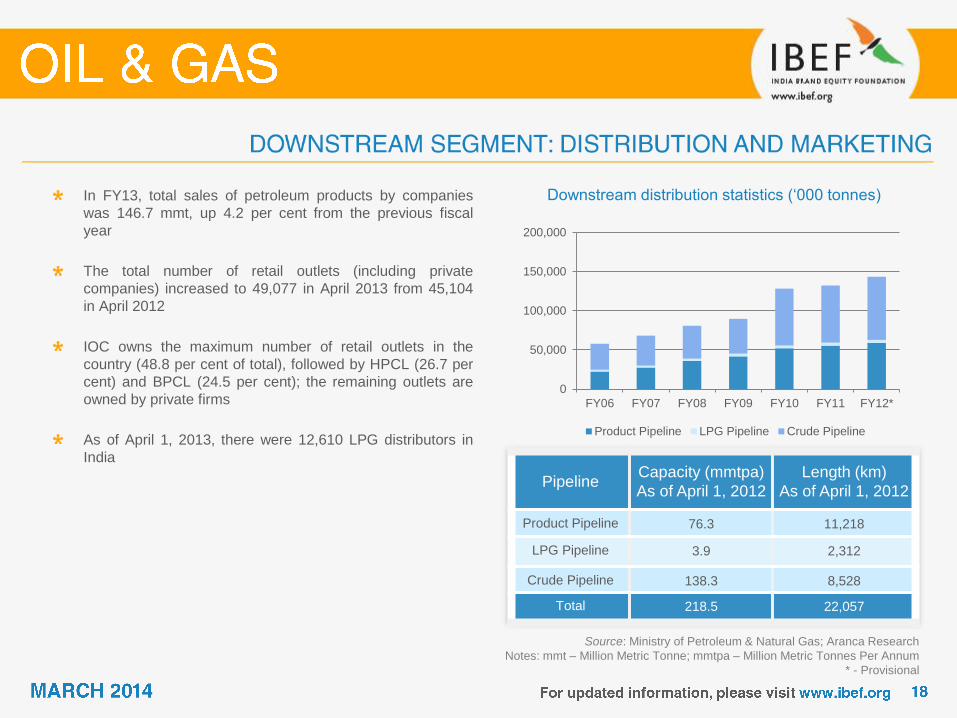
Downstream distribution statistics (‘000 tonnes)
Source: Ministry of Petroleum & Natural Gas; Aranca Research
Notes: mmt – Million Metric Tonne; mmtpa – Million Metric Tonnes Per Annum
* - Provisional
In FY13, total sales of petroleum products by companies
was 146.7 mmt, up 4.2 per cent from the previous fiscal
year
The total number of retail outlets (including private
companies) increased to 49,077 in April 2013 from 45,104
in April 2012
IOC owns the maximum number of retail outlets in the
country (48.8 per cent of total), followed by HPCL (26.7 per
cent) and BPCL (24.5 per cent); the remaining outlets are
owned by private firms
As of April 1, 2013, there were 12,610 LPG distributors in
India
0
50,000
100,000
150,000
200,000
FY06 FY07 FY08 FY09 FY10 FY11 FY12*
Product Pipeline LPG Pipeline Crude Pipeline
Pipeline Capacity (mmtpa)
As of April 1, 2012
Length (km)
As of April 1, 2012
Product Pipeline 76.3 11,218
LPG Pipeline 3.9 2,312
Crude Pipeline 138.3 8,528
Total 218.5 22,057
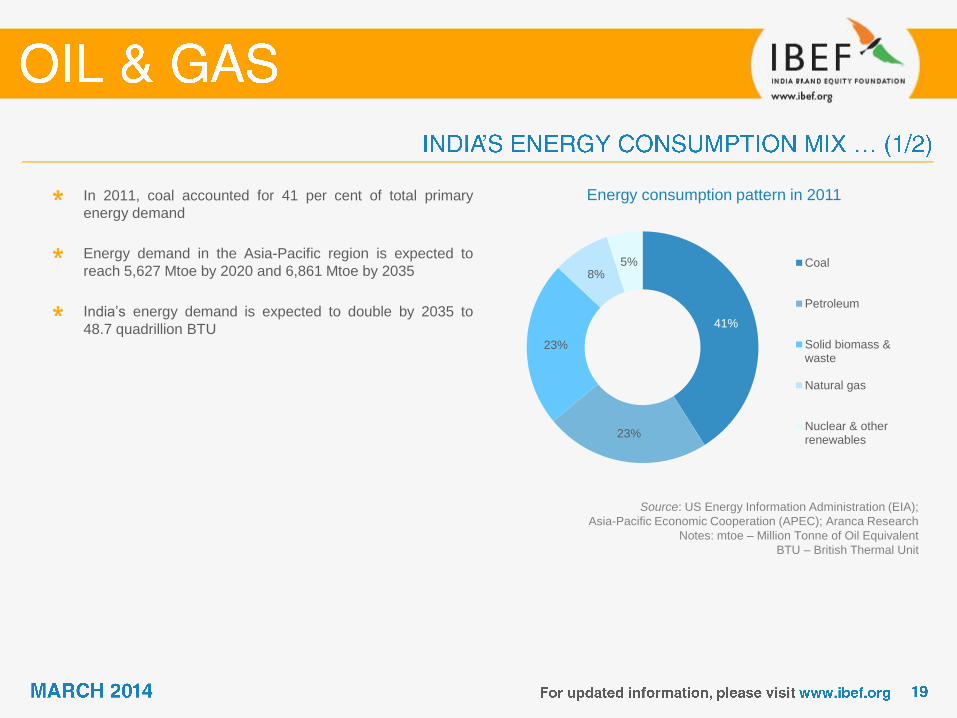
Energy consumption pattern in 2011
Source: US Energy Information Administration (EIA);
Asia-Pacific Economic Cooperation (APEC); Aranca Research
Notes: mtoe – Million Tonne of Oil Equivalent
BTU – British Thermal Unit
In 2011, coal accounted for 41 per cent of total primary
energy demand
Energy demand in the Asia-Pacific region is expected to
reach 5,627 Mtoe by 2020 and 6,861 Mtoe by 2035
India’s energy demand is expected to double by 2035 to
48.7 quadrillion BTU 41%
23%
23%
8% 5% Coal
Petroleum
Solid biomass &waste
Natural gas
Nuclear & otherrenewables

Consumption pattern expected in 2035
Source: International Energy Agency (IEA); 12th Five-Year Plan;
Aranca Research
Over the next few years, the dependence on gas, hydro
power and nuclear power is expected to increase relative to
oil and coal
The government aims to quadruple India’s nuclear power
generation capacity to 20 GW by 2020; currently, seven
nuclear power reactors of 4,930 MWe capacity are under
construction 42%
24%
15%
11%
8% Coal
Petroleum
Solid biomass &waste
Natural gas
Nuclear & otherrenewables
Source: Bloomberg; Aranca Research
Notes: FY – Indian Financial Year, April–March
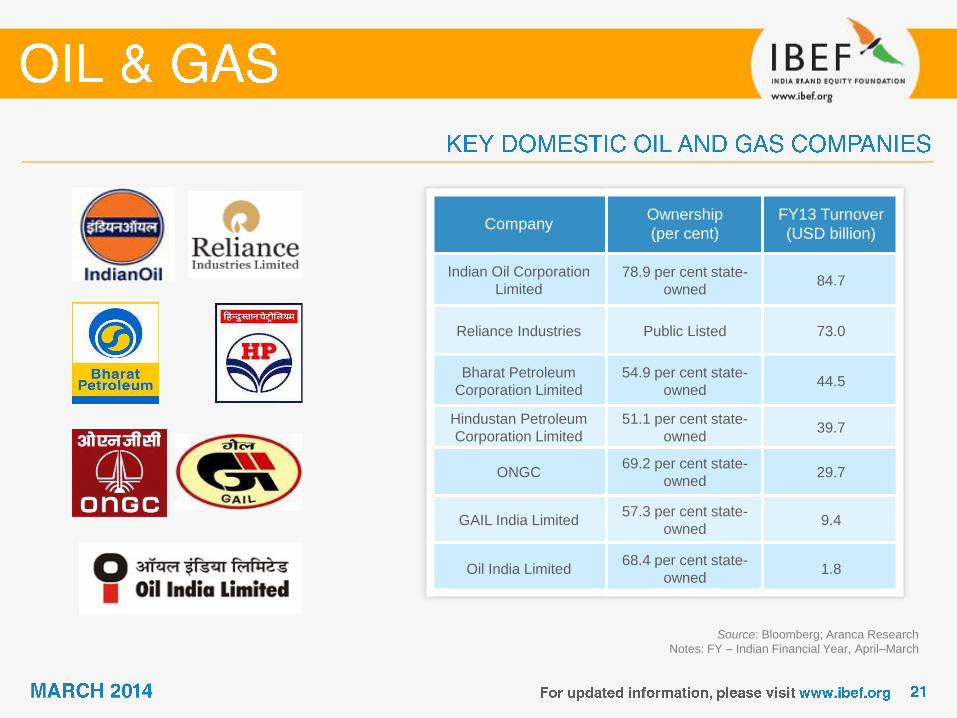
Company Ownership
(per cent)
FY13 Turnover
(USD billion)
Indian Oil Corporation
Limited
78.9 per cent state-
owned 84.7
Reliance Industries Public Listed 73.0
Bharat Petroleum
Corporation Limited
54.9 per cent state-
owned 44.5
Hindustan Petroleum
Corporation Limited
51.1 per cent state-
owned 39.7
ONGC 69.2 per cent state-
owned 29.7
GAIL India Limited 57.3 per cent state-
owned 9.4
Oil India Limited 68.4 per cent state-
owned 1.8

Source: Bloomberg; Aranca Research
Company Ownership
(per cent)
Global Turnover
(USD billion)
Cairn Energy India Pvt
Ltd Private Sector 1.5 (H114)
Shell Private Sector 341.9
(Nine months 2013)
BG Group Private Sector 13.7
(Nine months 2013)
BP Private Sector 285.4
(Nine Months 2013)
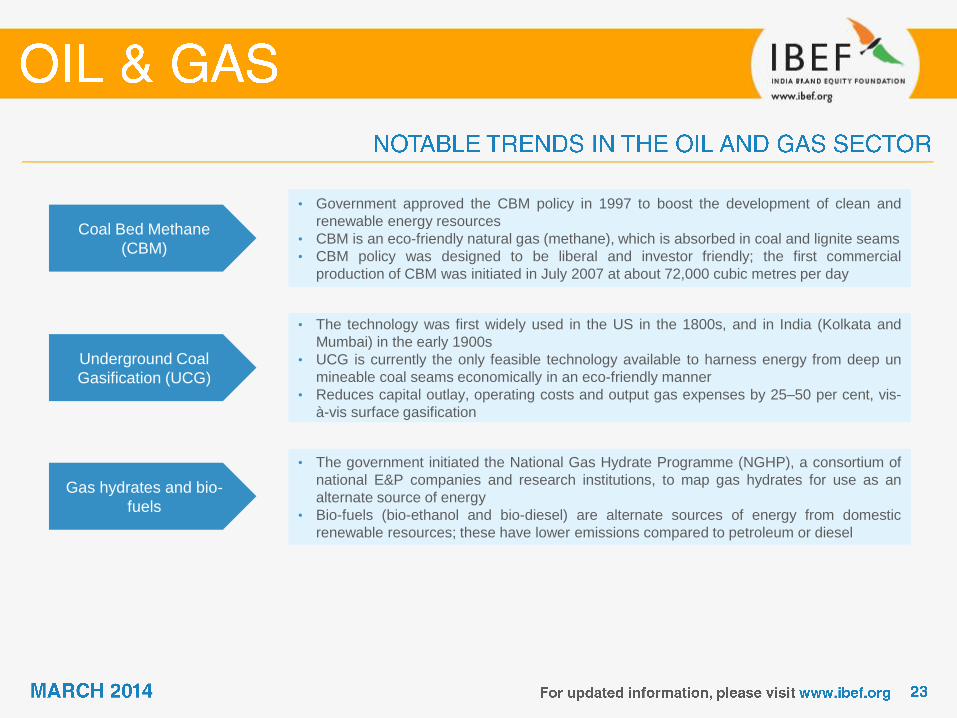
Coal Bed Methane
(CBM)
• Government approved the CBM policy in 1997 to boost the development of clean and
renewable energy resources
• CBM is an eco-friendly natural gas (methane), which is absorbed in coal and lignite seams
• CBM policy was designed to be liberal and investor friendly; the first commercial
production of CBM was initiated in July 2007 at about 72,000 cubic metres per day
Underground Coal
Gasification (UCG)
• The technology was first widely used in the US in the 1800s, and in India (Kolkata and
Mumbai) in the early 1900s
• UCG is currently the only feasible technology available to harness energy from deep un
mineable coal seams economically in an eco-friendly manner
• Reduces capital outlay, operating costs and output gas expenses by 25–50 per cent, vis-
à-vis surface gasification
Gas hydrates and bio-
fuels
• The government initiated the National Gas Hydrate Programme (NGHP), a consortium of
national E&P companies and research institutions, to map gas hydrates for use as an
alternate source of energy
• Bio-fuels (bio-ethanol and bio-diesel) are alternate sources of energy from domestic
renewable resources; these have lower emissions compared to petroleum or diesel
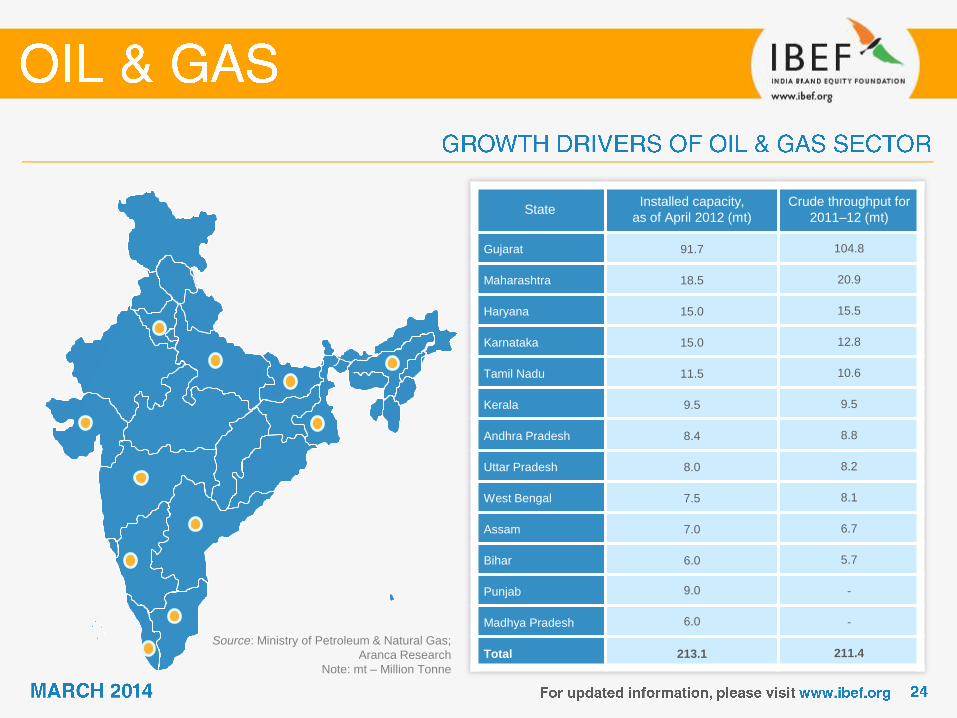
Source: Ministry of Petroleum & Natural Gas;
Aranca Research
Note: mt – Million Tonne
State Installed capacity,
as of April 2012 (mt)
Crude throughput for
2011–12 (mt)
Gujarat 91.7 104.8
Maharashtra 18.5 20.9
Haryana 15.0 15.5
Karnataka 15.0 12.8
Tamil Nadu 11.5 10.6
Kerala 9.5 9.5
Andhra Pradesh 8.4 8.8
Uttar Pradesh 8.0 8.2
West Bengal 7.5 8.1
Assam 7.0 6.7
Bihar 6.0 5.7
Punjab 9.0 -
Madhya Pradesh 6.0 -
Total 213.1 211.4
Source: Ministry of Petroleum & Natural Gas; Aranca Research
Notes: * - Provisional; # - April 2000–September 2013
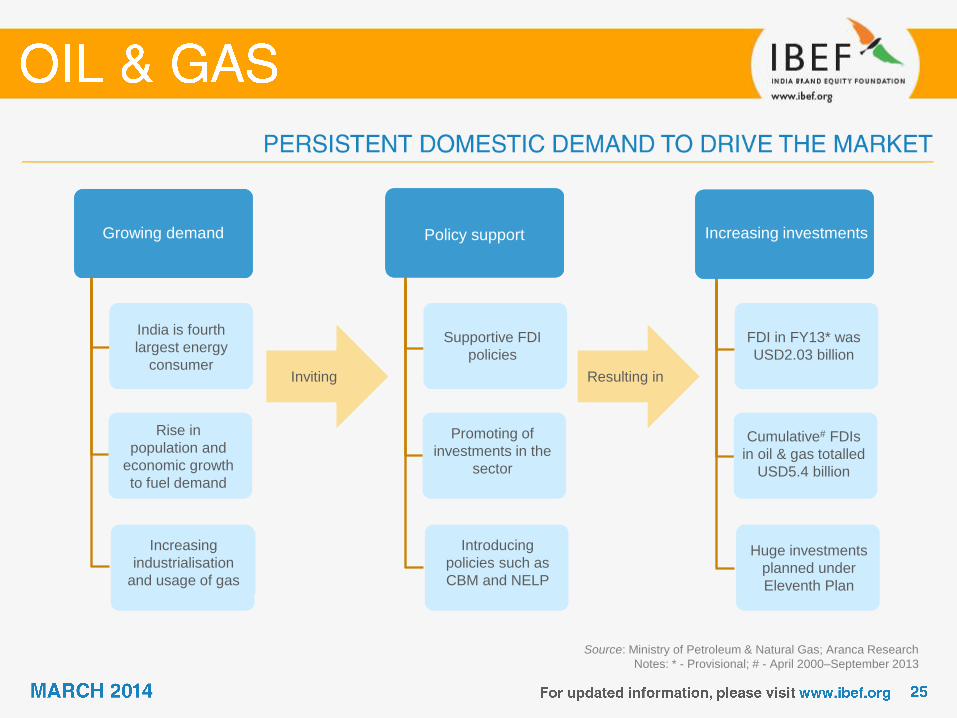
Growing demand
Inviting Resulting in
Growing demand Increasing investments Policy support
India is fourth
largest energy
consumer
Rise in
population and
economic growth
to fuel demand
Increasing
industrialisation
and usage of gas
Supportive FDI
policies
Promoting of
investments in the
sector
Introducing
policies such as
CBM and NELP
FDI in FY13* was
USD2.03 billion
Cumulative# FDIs
in oil & gas totalled
USD5.4 billion
Huge investments
planned under
Eleventh Plan
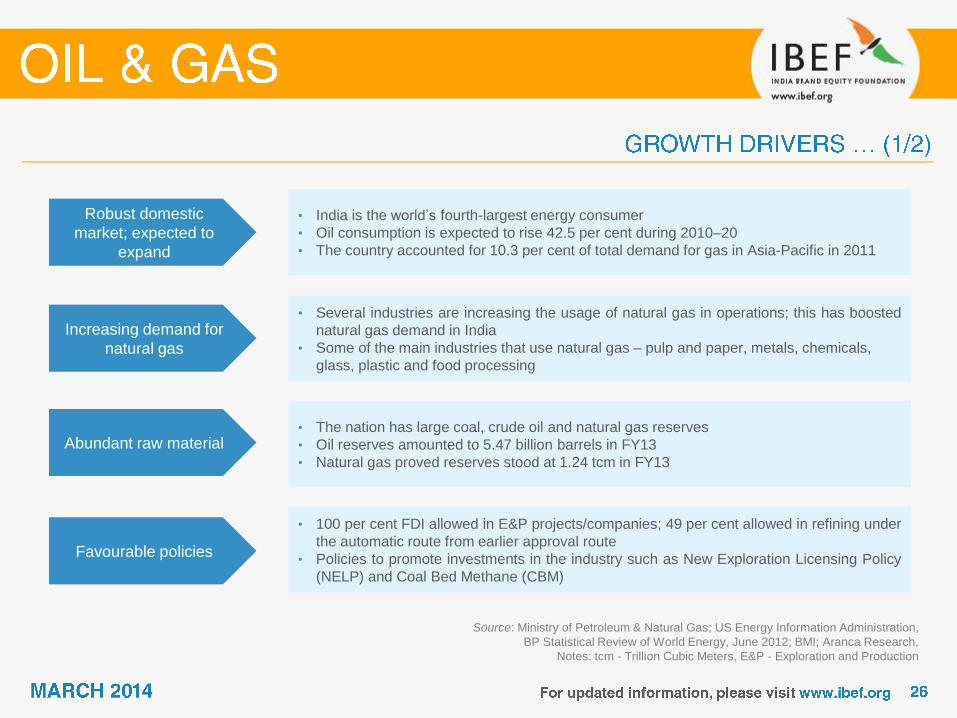
Robust domestic
market; expected to
expand
• India is the world’s fourth-largest energy consumer
• Oil consumption is expected to rise 42.5 per cent during 2010–20
• The country accounted for 10.3 per cent of total demand for gas in Asia-Pacific in 2011
Increasing demand for
natural gas
• Several industries are increasing the usage of natural gas in operations; this has boosted
natural gas demand in India
• Some of the main industries that use natural gas – pulp and paper, metals, chemicals,
glass, plastic and food processing
Abundant raw material • The nation has large coal, crude oil and natural gas reserves
• Oil reserves amounted to 5.47 billion barrels in FY13
• Natural gas proved reserves stood at 1.24 tcm in FY13
Source: Ministry of Petroleum & Natural Gas; US Energy Information Administration,
BP Statistical Review of World Energy, June 2012; BMI; Aranca Research,
Notes: tcm - Trillion Cubic Meters, E&P - Exploration and Production
Favourable policies
• 100 per cent FDI allowed in E&P projects/companies; 49 per cent allowed in refining under
the automatic route from earlier approval route
• Policies to promote investments in the industry such as New Exploration Licensing Policy
(NELP) and Coal Bed Methane (CBM)
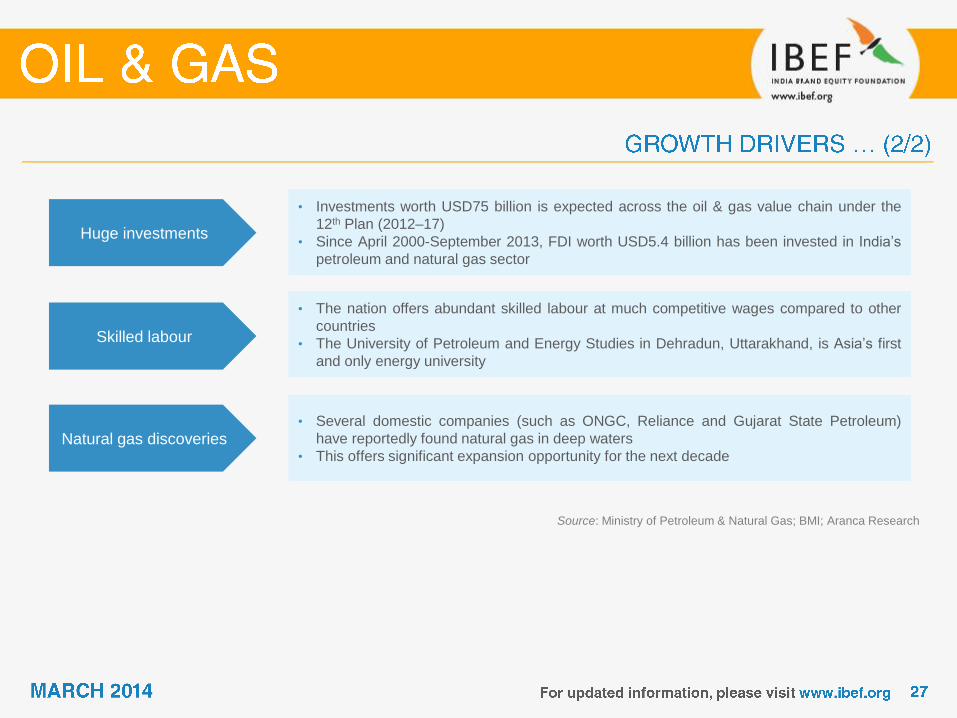
Huge investments
• Investments worth USD75 billion is expected across the oil & gas value chain under the
12th Plan (2012–17)
• Since April 2000-September 2013, FDI worth USD5.4 billion has been invested in India’s
petroleum and natural gas sector
Skilled labour
• The nation offers abundant skilled labour at much competitive wages compared to other
countries
• The University of Petroleum and Energy Studies in Dehradun, Uttarakhand, is Asia’s first
and only energy university
Natural gas discoveries • Several domestic companies (such as ONGC, Reliance and Gujarat State Petroleum)
have reportedly found natural gas in deep waters
• This offers significant expansion opportunity for the next decade
Source: Ministry of Petroleum & Natural Gas; BMI; Aranca Research

Integrated Energy
Policy (IEP), 2006 • Outlines goals for dealing with challenges faced by India’s energy sector
Petroleum and Natural
Gas Regulatory Board
(PNGRB) Act, 2006
• To regulate refining, processing, storage, transportation, distribution, marketing and sale of
petroleum, petroleum products and natural gas
Auto Fuel Policy, 2003 • To provide a roadmap to comply with various vehicular emission norms and corresponding
fuel quality upgrading requirements over a period of time
Source: Ministry of Petroleum & Natural Gas; Aranca Research
Note: NELP - New Exploration Licensing Policy
National Biofuel Policy,
2002 • To promote bio-fuel usage, the GoI has provided a 16 per cent concession on the excise
duty on bio-ethanol and exempted bio-diesel from excise duty
Freight Subsidy (for far-
flung areas) Scheme,
2002
• To compensate public sector Oil Marketing Companies (OMCs) on the freight incurred to
distribute subsidised products in far-flung areas
NELP, 1999 • To provide a contract framework for E&P of hydrocarbons; licenses for exploration are
awarded through a competitive bidding system; nine rounds of bidding completed till 2011

FDI Policies • The E&P segment’s FDI limit is 100 per cent, and the refining segment’s limit is 49 per
cent
Coal Bed Methane
(CBM) Policy, 1997 • To encourage exploration and production of CBM gas as a new eco-friendly source of
energy
Petroleum Rules, 1976 • Provisions for regulations governing pollution, safety, and other operating standards
Source: Ministry of Petroleum & Natural Gas; Aranca Research
Oil Industry
(Development) Act,
1974
• An act establishing a board to develop the oil industry and levy excise duty on crude and
natural gas
Petroleum and Minerals
Pipelines Act, 1962 • Acquisition of user’s rights by the government of India on land demarcated for laying
pipelines to transport petroleum and other minerals from one area to another
Petroleum and Natural
Gas Rule, 1959 • Regulates the grant of petroleum and natural gas exploration licenses and mining leases,
which belong to the government
Oil Field (Regulation
and Development) Act,
1948 • An act to regulate oilfields and develop mineral oil resources
Source: Ministry of Petroleum & Natural Gas; Aranca Research
FDI inflows into petroleum and natural gas
(USD million)
Source: Department of Industrial Policy & Promotion; Aranca Research
Notes: * - Provisional
** - Data for the period April-September 2013
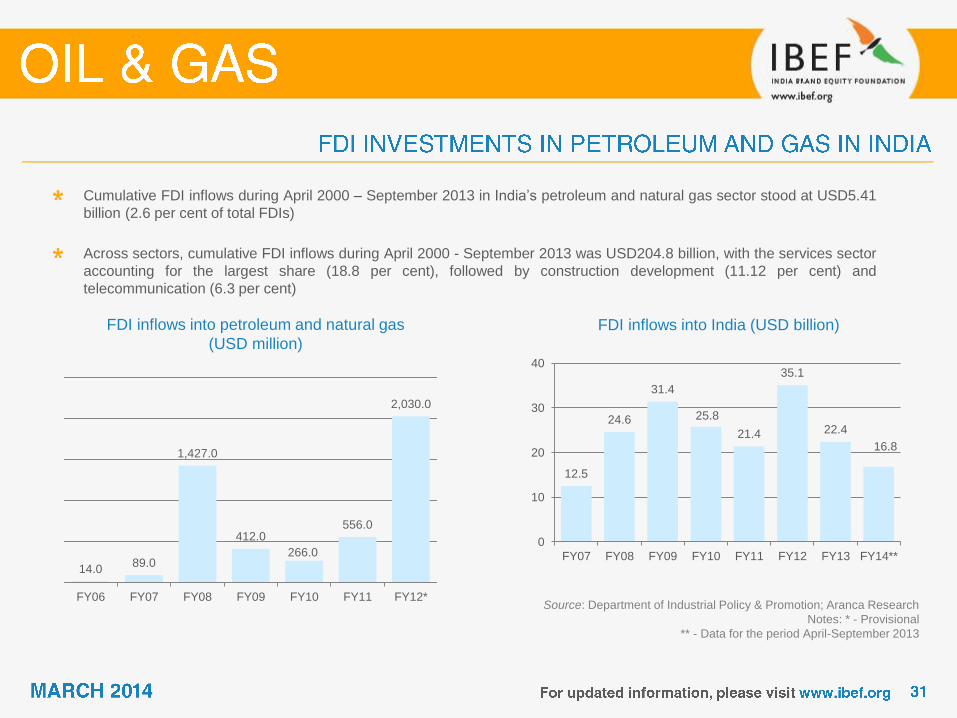
Cumulative FDI inflows during April 2000 – September 2013 in India’s petroleum and natural gas sector stood at USD5.41
billion (2.6 per cent of total FDIs)
Across sectors, cumulative FDI inflows during April 2000 - September 2013 was USD204.8 billion, with the services sector
accounting for the largest share (18.8 per cent), followed by construction development (11.12 per cent) and
telecommunication (6.3 per cent)
FDI inflows into India (USD billion)
14.0 89.0
1,427.0
412.0
266.0
556.0
2,030.0
FY06 FY07 FY08 FY09 FY10 FY11 FY12*
12.5
24.6
31.4
25.8
21.4
35.1
22.4
16.8
0
10
20
30
40
FY07 FY08 FY09 FY10 FY11 FY12 FY13 FY14**

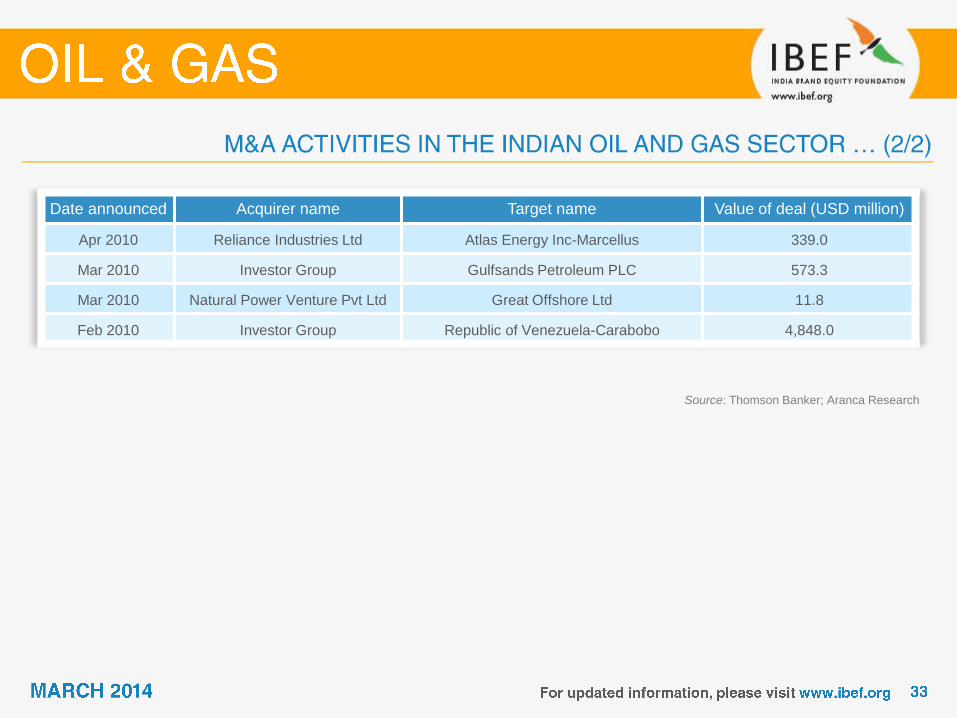
Source: Thomson Banker; Aranca Research
Date announced Acquirer name Target name Value of deal (USD million)
Oct 2013 ONGC Videsh Ltd Parque das Conchas, Brazilian Oilfield 529
Jun 2013 ONGC Videsh Ltd
(in partnership with Oil India Ltd) Rovuma Area 1 Offshore Block 2640
Nov 2012 ONGC Videsh ConocoPhillips (Kashagan Field) 5000.0
Nov 2012 Inpex Corp Oil and Natural Gas Corp’s exploration block
KG-DWN-2004/6 Not disclosed
Sep 2012 ONGC Videsh Hess Corp (Azrei oilfield) 1000.0
Apr 2012 Trafigura Pte Ltd Nagarjuna Oil Co Ltd 130.0
Apr 2011 Sesa Goa Ltd Calm India Ltd 1492.0
Feb 2011 BP PLC Reliance Industries Ltd 9,000.0
Aug 2010 BPRL EP413 13.4
Aug 2010 Sesa Goa Ltd Cairn India Ltd 1,180.8
Aug 2010 Vedanta Resources PLC Cairn India Ltd 6,568.5
Aug 2010 Reliance Industries Ltd Marcellus Shale Natural Gas 391.6
Jun 2010 Reliance Industries Ltd Infotel Broadband Svcs Ltd 1,026.7
Apr 2010 Sim Siang Choon Hardware Interlink Petroleum Ltd 17.8
Source: Thomson Banker; Aranca Research
Date announced Acquirer name Target name Value of deal (USD million)
Apr 2010 Reliance Industries Ltd Atlas Energy Inc-Marcellus 339.0
Mar 2010 Investor Group Gulfsands Petroleum PLC 573.3
Mar 2010 Natural Power Venture Pvt Ltd Great Offshore Ltd 11.8
Feb 2010 Investor Group Republic of Venezuela-Carabobo 4,848.0

ONGC’s position in the Indian market
• ONGC is the largest upstream oil company
• ONGC accounts for 60 per cent of India’s total crude
oil output and 57 per cent of total gas production
(FY13)
ONGC revenue growth (USD billion)
Source: Company Reports; BMI, Aranca Research
Note: TOE - Tonne of Oil Equivalent
• ONGC
registered
highest-
ever oil
production
• Highest
reserve
accretion
in the last
two
decades
– 83.5
million
toe
• Domestic
crude
production
up 2.1 per
cent
• ONGC
reported net
profit of
USD3.9
billion in
2011
• Highest-
ever
dividend
payout of
USD1.6
billion
• ONGC
recorded
net profit of
USD3.6
billion in
2013
13.0
15.3 14.2
13.1
15.3 15.9
15.2
FY07 FY08 FY09 FY10 FY11 FY12 FY13

Source: Company Reports; Aranca Research
Reliance Industries is a leading company in the petrochemical, refining and oil & gas industry
The company was ranked 99th in the Fortune Global 500 list 2012
It contributes 14 per cent to India's exports (Mar 2011) and 4.6 per cent of total market capitalisation in the country
FY12
Net Profit USD3.9 billion USD3.9 billion
EBITDA USD7.3 billion USD7.1 billion
Turnover USD66.8 billion USD68.4 billion
FY13 • Turnover increased by 9.2 per
cent in FY13
• Exports increased by 15 per cent to USD44.1 billion
• Record crude throughput at 68.5 million tonnes
• US shale: FY13 revenue and EBITDA at USD616 million and USD483 million respectively
Reliance Industries has entered into JVs with various companies across segments to align growth opportunities; it signed JVs
with Atlas, Pioneer, Carrizo SIBUR, and D.E. Shaw as well as entered into a strategic alliance with BP recently.
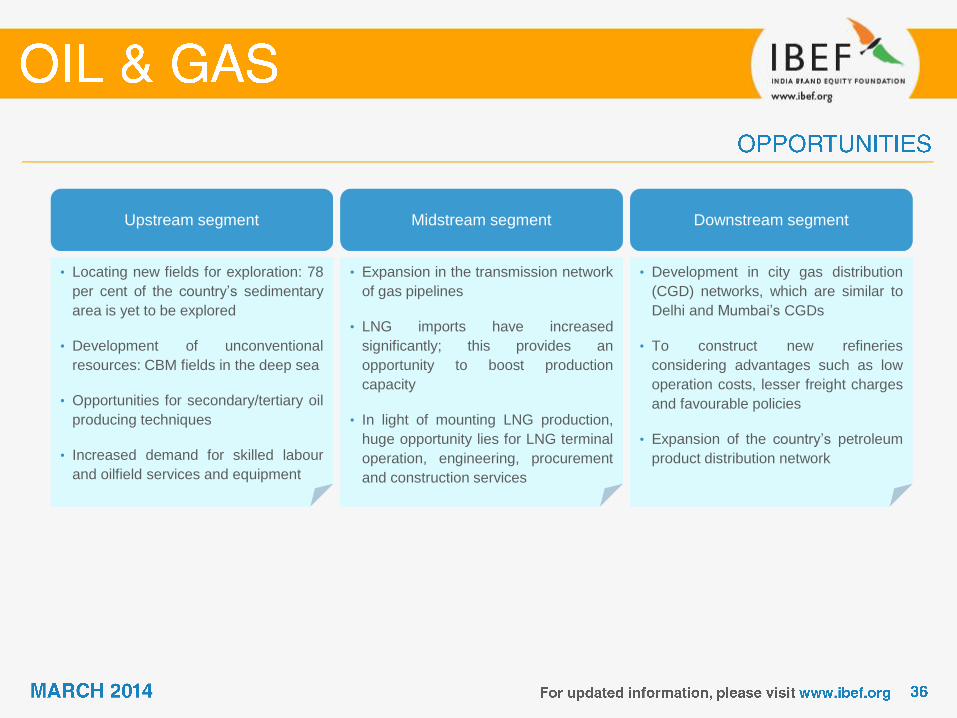
Upstream segment Midstream segment Downstream segment
• Locating new fields for exploration: 78
per cent of the country’s sedimentary
area is yet to be explored
• Development of unconventional
resources: CBM fields in the deep sea
• Opportunities for secondary/tertiary oil
producing techniques
• Increased demand for skilled labour
and oilfield services and equipment
• Expansion in the transmission network
of gas pipelines
• LNG imports have increased
significantly; this provides an
opportunity to boost production
capacity
• In light of mounting LNG production,
huge opportunity lies for LNG terminal
operation, engineering, procurement
and construction services
• Development in city gas distribution
(CGD) networks, which are similar to
Delhi and Mumbai’s CGDs
• To construct new refineries
considering advantages such as low
operation costs, lesser freight charges
and favourable policies
• Expansion of the country’s petroleum
product distribution network
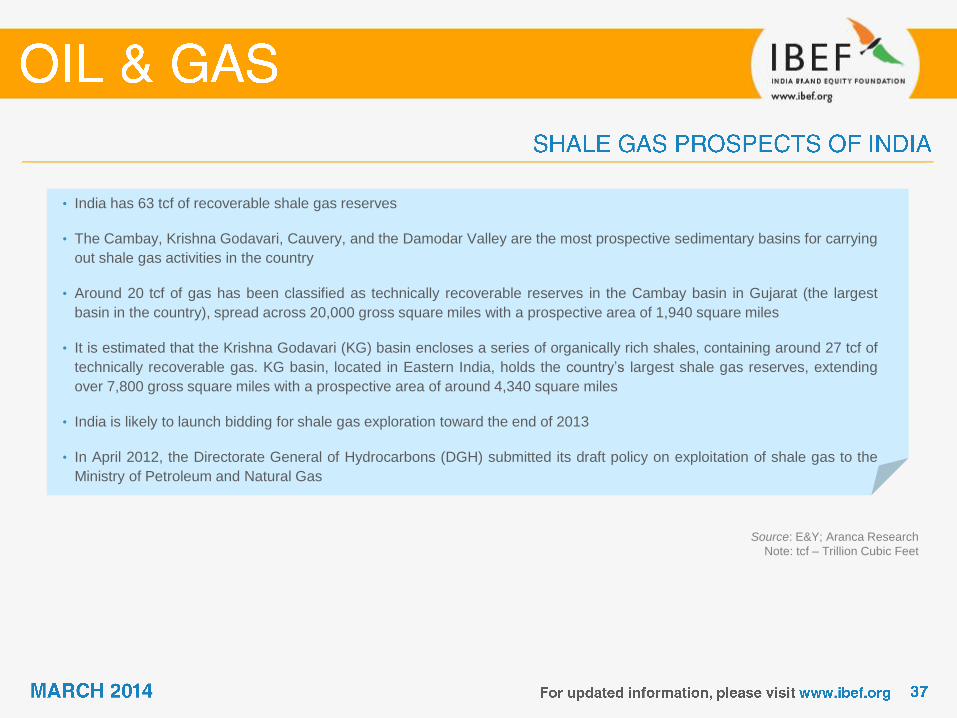
• India has 63 tcf of recoverable shale gas reserves
• The Cambay, Krishna Godavari, Cauvery, and the Damodar Valley are the most prospective sedimentary basins for carrying
out shale gas activities in the country
• Around 20 tcf of gas has been classified as technically recoverable reserves in the Cambay basin in Gujarat (the largest
basin in the country), spread across 20,000 gross square miles with a prospective area of 1,940 square miles
• It is estimated that the Krishna Godavari (KG) basin encloses a series of organically rich shales, containing around 27 tcf of
technically recoverable gas. KG basin, located in Eastern India, holds the country’s largest shale gas reserves, extending
over 7,800 gross square miles with a prospective area of around 4,340 square miles
• India is likely to launch bidding for shale gas exploration toward the end of 2013
• In April 2012, the Directorate General of Hydrocarbons (DGH) submitted its draft policy on exploitation of shale gas to the
Ministry of Petroleum and Natural Gas
Source: E&Y; Aranca Research
Note: tcf – Trillion Cubic Feet
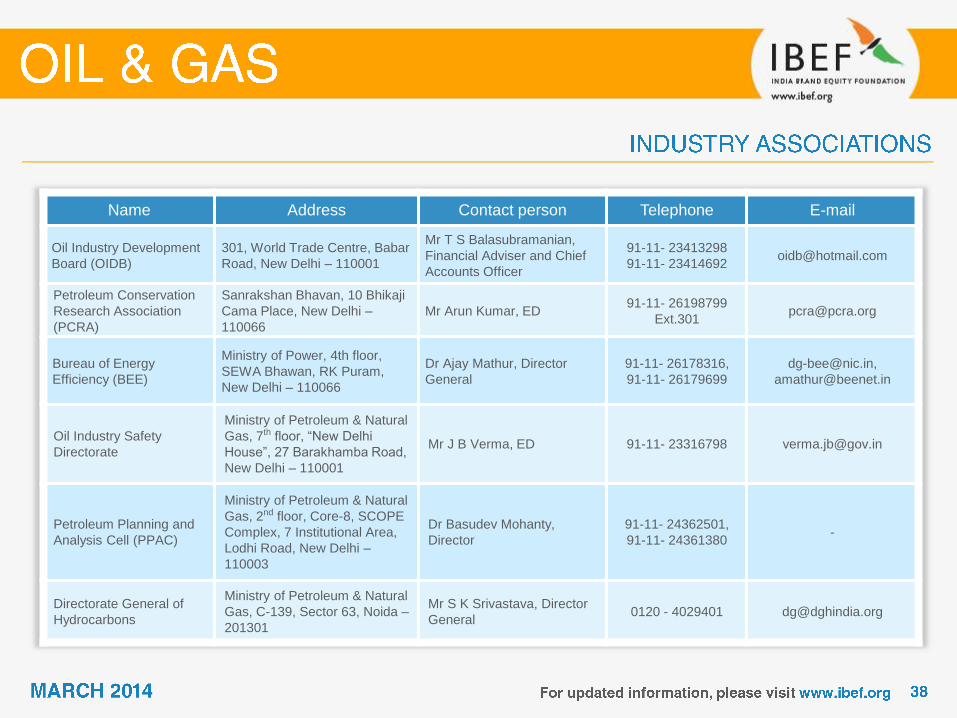
Name Address Contact person Telephone E-mail
Oil Industry Development
Board (OIDB)
301, World Trade Centre, Babar
Road, New Delhi – 110001
Mr T S Balasubramanian,
Financial Adviser and Chief
Accounts Officer
91-11- 23413298
91-11- 23414692 [email protected]
Petroleum Conservation
Research Association
(PCRA)
Sanrakshan Bhavan, 10 Bhikaji
Cama Place, New Delhi –
110066
Mr Arun Kumar, ED 91-11- 26198799
Ext.301 [email protected]
Bureau of Energy
Efficiency (BEE)
Ministry of Power, 4th floor,
SEWA Bhawan, RK Puram,
New Delhi – 110066
Dr Ajay Mathur, Director
General
91-11- 26178316,
91-11- 26179699
Oil Industry Safety
Directorate
Ministry of Petroleum & Natural
Gas, 7th floor, “New Delhi
House”, 27 Barakhamba Road,
New Delhi – 110001
Mr J B Verma, ED 91-11- 23316798 [email protected]
Petroleum Planning and
Analysis Cell (PPAC)
Ministry of Petroleum & Natural
Gas, 2nd floor, Core-8, SCOPE
Complex, 7 Institutional Area,
Lodhi Road, New Delhi –
110003
Dr Basudev Mohanty,
Director
91-11- 24362501,
91-11- 24361380 -
Directorate General of
Hydrocarbons
Ministry of Petroleum & Natural
Gas, C-139, Sector 63, Noida –
201301
Mr S K Srivastava, Director
General 0120 - 4029401 [email protected]
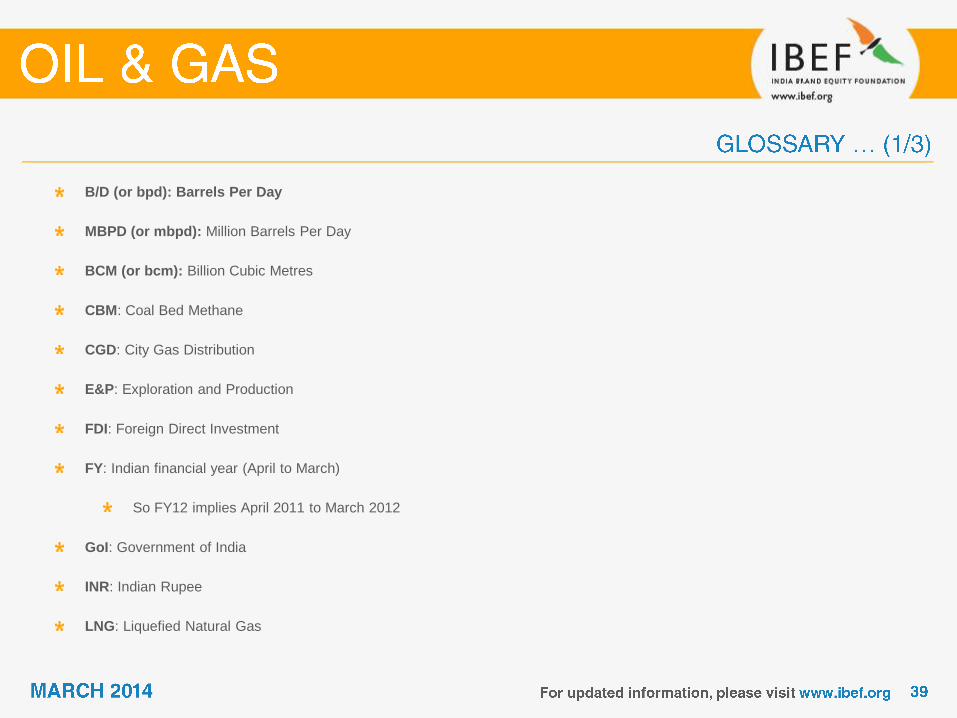
B/D (or bpd): Barrels Per Day
MBPD (or mbpd): Million Barrels Per Day
BCM (or bcm): Billion Cubic Metres
CBM: Coal Bed Methane
CGD: City Gas Distribution
E&P: Exploration and Production
FDI: Foreign Direct Investment
FY: Indian financial year (April to March)
So FY12 implies April 2011 to March 2012
GoI: Government of India
INR: Indian Rupee
LNG: Liquefied Natural Gas
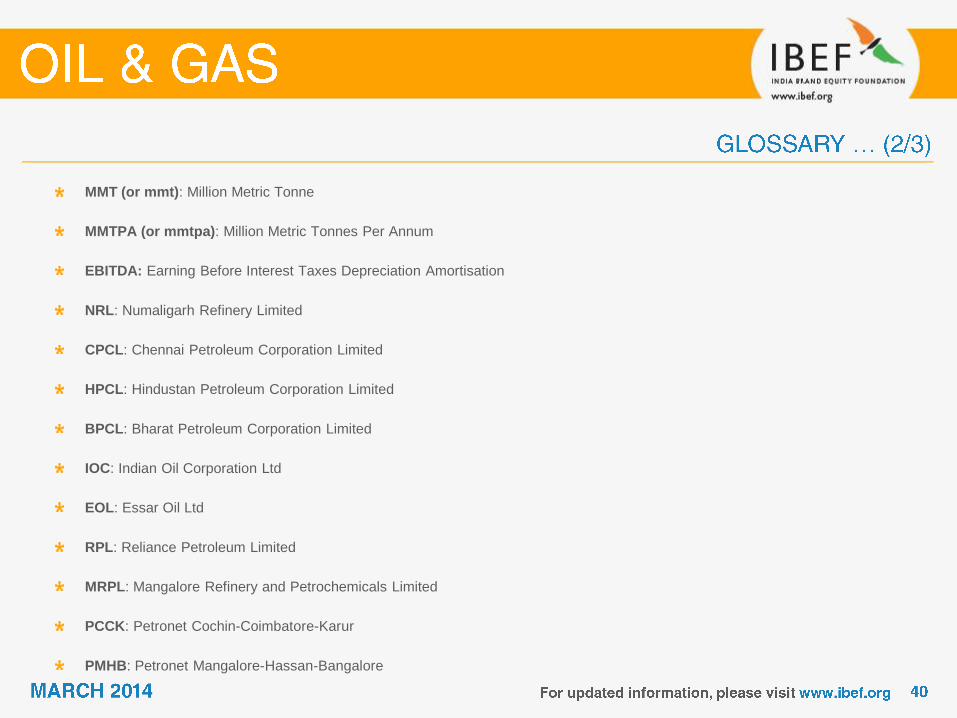
MMT (or mmt): Million Metric Tonne
MMTPA (or mmtpa): Million Metric Tonnes Per Annum
EBITDA: Earning Before Interest Taxes Depreciation Amortisation
NRL: Numaligarh Refinery Limited
CPCL: Chennai Petroleum Corporation Limited
HPCL: Hindustan Petroleum Corporation Limited
BPCL: Bharat Petroleum Corporation Limited
IOC: Indian Oil Corporation Ltd
EOL: Essar Oil Ltd
RPL: Reliance Petroleum Limited
MRPL: Mangalore Refinery and Petrochemicals Limited
PCCK: Petronet Cochin-Coimbatore-Karur
PMHB: Petronet Mangalore-Hassan-Bangalore

NELP: New Exploration Licensing Policy
TOE (or toe): Tonnes of Oil Equivalent
USD: US Dollar
ONGC: Oil and Natural Gas Corporation of India
IOCL: Indian Oil Corporation Limited
mn bbl: Million Barrels
CAGR: Compound Annual Growth Rate
JV: Joint Venture
UCG: Underground Coal Gasification
NGL: Natural Gas Liquids
OMCs: Oil Marketing Companies
NHGP: National Gas Hydrate Programme
Wherever applicable, numbers have been rounded off to the nearest whole number

Year INR equivalent of one USD
2004-05 44.95
2005-06 44.28
2006-07 45.28
2007-08 40.24
2008-09 45.91
2009-10 47.41
2010-11 45.57
2011-12 47.94
2012-13 54.31
2013-14 59.23
Exchange rates (Fiscal year)
Year INR equivalent of one USD
2005 45.55
2006 44.34
2007 39.45
2008 49.21
2009 46.76
2010 45.32
2011 45.64
2012 54.69
2013 57.72
Exchange rates (Calendar year)
Average for the year
India Brand Equity Foundation (“IBEF”) engaged Aranca to prepare this presentation and the same has been prepared
by Aranca in consultation with IBEF.
All rights reserved. All copyright in this presentation and related works is solely and exclusively owned by IBEF. The
same may not be reproduced, wholly or in part in any material form (including photocopying or storing it in any medium
by electronic means and whether or not transiently or incidentally to some other use of this presentation), modified or in
any manner communicated to any third party except with the written approval of IBEF.
This presentation is for information purposes only. While due care has been taken during the compilation of this
presentation to ensure that the information is accurate to the best of Aranca and IBEF’s knowledge and belief, the
content is not to be construed in any manner whatsoever as a substitute for professional advice.
Aranca and IBEF neither recommend nor endorse any specific products or services that may have been mentioned in
this presentation and nor do they assume any liability or responsibility for the outcome of decisions taken as a result of
any reliance placed on this presentation.
Neither Aranca nor IBEF shall be liable for any direct or indirect damages that may arise due to any act or omission on
the part of the user due to any reliance placed or guidance taken from any portion of this presentation.