energy consumption study on school uniform ironing: a case...
TRANSCRIPT

International Journal of Education and Research Vol. 1 No. 9 September 2013
1
Energy consumption study on school uniform ironing: A case study in Malaysia
1*NorzanahRosmin, 2Muhammad ZulkifliYusof, 3Aede Hatib Musta’amal 1*Centre of Electrical Energy Systems (CEES), Universiti Teknologi Malaysia (UTM), 81310 Johor
Bahru, Johor, Malaysia. 2Faculty of electrical Engineering, Universiti Teknologi Malaysia (UTM), 81310 Johor Bahru,
Johor, Malaysia. 3Faculty of Education, Universiti Teknologi Malaysia (UTM), 81310 Johor Bahru, Johor, Malaysia.
1* Corresponding author: NorzanahRosmin ([email protected]). Tel: +607-5557174
The authors would like to thank RMC, FKE and CEES, Universiti Teknologi Malaysia and the Ministry of Higher Education of Malaysia for the financial support provided under RUG(05H18)
and FRGS(4F108) to carry out this research.
Abstract
Almost all children in Malaysia wear ironed uniform when they go to school, following the standard dress code that is issued by Malaysian Education Ministry. Indirectly, this school uniform ironing contributes to the energy consumption in residential sector in Malaysia. This paper attempts to investigate the status of energy used due to this activity, and to predict the amount of energy savings in the residential sector in Malaysia through the use of the un-iron uniform material. The energy measurements are based on the data reading on the smart meter during the ironing. For the energy saving prediction, the calculations are based on the population growth data in Malaysia. By retaining the school uniform ironing, about 3819 GWh can be saved from year 2010 to 2030. Therefore, this effort could assist in delaying the process of energy sources depletion and could extend the energy security in Malaysia for a longer time.
Keywords: school uniform, ironing, energy saving, energy security

ISSN: 2201-6333 (Print) ISSN: 2201-6740 (Online) www.ijern.com
2
1. Introduction Electricity plays a vital role in development in Malaysia. Since past few years, the
demand for energy has escalated in Malaysia as a result of rapid economic growth. Fig.1 shows the energy consumption or energy demand in Malaysia from year 2000 to 2012 (Department Of Statistics Malaysia, 2010). From Fig.1, it can be seen that the energy consumption has risen by 56% from 53.42 billion kWh to 93.8 billion kWh during these years. Malaysia’s electricity consumption is estimated to boost by about 30% from its present value by the year 2020 (Christopher, 2010).
Fig.1 Energy consumption in Malaysia from year 2000 to 2012
Fig.2 shows the electrical energy consumption scenario in Malaysia, based on 2008 data (Christopher, 2010). The total energy used by consumers was about 8.4 million kWh. As shown in Fig.2, the industrial sector consumes the highest electrical energy in Malaysia. From that number, industrial consumers contribute the most, with a percentage of 47.43 %, followed by commercial (32.18%), domestic (18.96%) and others (1.44%). The number of all consumers in the industrial sector also increases every year. Therefore, the demand of electricity also increases.
Fig.2 Electricity consumer of TNB according to sector in year 2008
One of the factors that influence the electricity demand in Malaysia is the population growth (Mahlia, Masjuki,Saidur,Choudhury, &NoorLeha, 2003). Demographic changes, economic developments and increases of household income also escalate the electricity consumption globally (Malaysia Energy Information Hub, Suruhanjaya Tenaga , 2008). People affordability in purchasing goods increases year after year; which also covers purchasing the electrical appliances, leading to more consumption of electricity. Rather than using rain water for shower and gardening, using woods for cooking, using fan for cooling, using coals for ironing, people nowadays tend to have shower from the water heater, use auto-watering plant system for watering plants, use gas/electricity for cooking, use air-conditioner for cooling and use electricity for ironing clothings.
As a developing country, Malaysia is experiencing the increment of energy use every year. According to the statistics provided by the National Energy Balance (2008), it was reported that Malaysia recorded an increase of energy consumption at a rate of 6.1% yearly from 2000 to 2008 (Malaysian investment development authority, 2003). It is anticipated that Malaysia needs to supply more electricity in the next coming years. In 2012, the economy of Malaysia was noted as the third largest economy in South East Asia. This is due to the fact that the electrical and electronics (E&E) industry is one of the major manufacturing sectors that help to increase the total gross domestic product (Mahlia et al., 2003). Note that the gross manufacturing product is closely related to the gross domestic product.
Being a developed country is a goal for all countries in the world. However, since economic growth and energy consumption have a strong interconnected impacts and long-term mingled relationship (Fei, 2011),(Energy and Development Group, Cape Town, South Africa, 2013),(Shaari, Hussain, & Ismail, 2013), this will contribute to more negative greenhouse effects, global warming, carbon dioxide emissions and air pollutions. The air pollutions and gas emissions happen when the carbon dioxide and other gases get thick enough to form a 'gas blanket' around the earth, causing the earth to heat up more than usual (Tan, Maragatham, & Leong, 2013). This leads to global warming. The global warming then leads to worse scenarios such as polar ice melting, rising sea levels, drought, heat waves,
International Journal of Education and Research Vol. 1 No. 9 September 2013
3
hurricanes and others (United States Environmental Protection Agency, 2013). Though United States is said to be the largest source of global warming pollution by producing 25 percent of the carbon dioxide pollution from fossil fuel combustion, while Malaysia is not listed as one of the major contributors of the list, it should not mean that Malaysia should not have concern regarding this issues. We, as one of the developing country in the world, should participate in searching strategies on how to find supports for our fossil fuels, so that this energy source can be used for a longer time and energy security is promised as longer as possible. In Malaysia, electricity generation is mostly based on the fossil fuels such as natural gas, coal and oil. Burning coal and oil produce hazardous gas emissions, for instance CO2, SO2 and COx (Al-Amin, Siwar, &Jaafar, 2009)(Yumrutas&Unsal, 2012). These gasses are responsible to the global warming.
Other than population growth, demographic changes, economic developments and increase of household incomes, people’s behaviour/attitude is one of the reasons why electricity consumption being increases. The term ‘behavior’ discussed here is related to conscious and unconscious choices that are made by consumers within a classified framework such as legislation, regulations, provisions and what is available in the market (Al-Mofleh, Taib, Abdul Mujeebu, &Wael Salah, 2009). People’s behavior and attitude are involved in determining higher consumption of energy in daily life, particularly domestically (Muhammad Ery Wijaya, &Tetsuo Tezuka, 2013). There are many examples which show Malaysian ruthless behavior/attitude. For example, to provide a comfort and safety environments, many people will leave the lights on during the night, particularly in the bedroom, front yard and back yard. The attitude of switching on lights for no specific reason and switching on the fans and air-condition without using timer at home are also a common routine at night. Besides that, many people prefer to buy cheaper home appliances which have low efficiency rather than purchasing the higher efficiency home appliances which are usually more expensive. These happen because of lack of awareness about the importance of energy conservation among Malaysians. Many people do realize that they have to pay more for the electricity bills if they use more electricity. By that reason, parents will try their best to use the electricity for specific purposes only if they really need them, but, for the children, they never concern about the bills. The worst case the lack of the awareness about the energy sources depletion and gases emissions. Not many people know that the sources of energy that they use daily are non-renewable. They do not know what will happen if the sources have depleted. They also do not know that household appliances also emit dangerous greenhouse gases (Imran Rasul, Hollywood, 2012)(Natural Resources Defense Council, 2005) which may cause heart attacks, heat stroke and others (Meier, &Hill, 1997). This is supported by Maeir et al (1997)that residential electricity accounts for 40% of global energy-related CO2 emissions and predicts that it will grow to 58% globally by 2030. In term of appliances, the refrigerator-freezer is the major energy-consuming appliance, followed by air conditioner, washing machine, fan, rice cooker, and iron (Bansal, Vineyard, &Abdelaziz, 2011).
Many energy policies regarding efficient use, adequacy, security, cost-effective and negative impact minimization of energy supply can be widely found in the literature. However, most of the discussions are only related to the scope of building (Deering, Newborough, &Probert, 1993)(Rodolfo, Zubi, &Fracastoro, 2012)(Aydinalp, Ugursal, &Fung, 2002), transportation (Akisawa, 1998)(Chen, Ding, Li, Zhang, & Kay, 2011)(Imaseki, 1998)(Maughan, Price,Probert,&Rushton, 1997)(Lakhani, 1981) and household appliances (Kilpatrick, Banfill, &Jenkins, 2011)(Cardoso, Nogueira, &Haddad, 2010)(Cezar,Negrão, &Christian, 2011)(Mansouri, Newborough, &Probert, 1996) management. Hence, this paper presents an investigation regarding the status of energy consumption due to school uniform ironing. By realizing the aim of this study, the amount of

ISSN: 2201-6333 (Print) ISSN: 2201-6740 (Online) www.ijern.com
4
energy savings in the residential sector can be reduced, if a policy of wearing un-iron school uniform material is imposed in Malaysia.
2.0 Input data
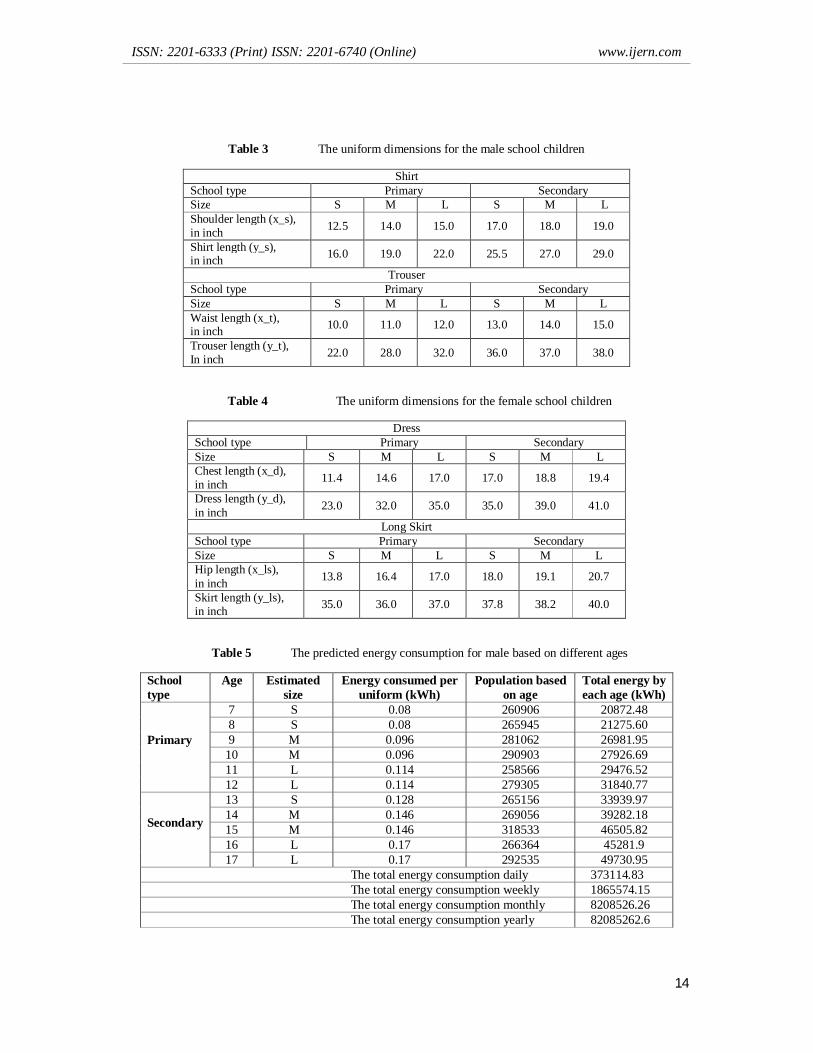
Residential population growth and residential population census data are needed for this study analysis. These data have been obtained from Malaysia Statistics Department in (Department Of Statistics Malaysia, 2010). Table 1 shows the population growth in Malaysia from the year 2000 to the year 2012, whereby Table 2 presents the population census comprising different school children ages (from 7 to 17 years), races and gender. It can be seen from Table 1 that the number of population in Malaysia increases from year to year, about 2.2% each year. Table 2 shows that Malay is the majority ethnic living in Malaysia.
Table 1
Malaysia population growth
Table 2
Malaysia population census
3.0 Methodology
Several steps had been considered before estimating the energy consumption due to school uniform ironing. The body structure size among the school children is different, particularly between primary and secondary school. To ease the estimation, the estimation was done based on different uniform size, gender, uniform material and iron brand.
3.1 Determination of school uniform size
In this study, three different sizes were chosen, based on different gender; male and female. The sizes considered were L (large), M (medium) and S (small). For male, shirt and trousers had been considered, whereby for the female, the dress (‘baju kurung’) and long skirt had been chosen (see Fig. 3). The uniform dimensions for the male and female, for the primary and secondary school can be seen in Table 3 and Table 4, respectively.
Fig.3 School uniform based on gender (a) Male (b) Female
Table 3
The uniform dimensions for the male school children
Table 4
The uniform dimensions for the female school children
3.2 Determination of school uniform material
In this study, the types of cloth chosen were cotton and synthetic only. These types were chosen because they are the most common materials sold in the market in Malaysia for school uniform. The type of uniform material is usually printed on the size label.
3.3 Determination of iron brand
Four types/brands of common and widely used iron in the market were selected to study and reveal their impact. The iron brands selected were Panasonic (A), ELBA (B), Philips (C) and Khind (D). Similar power rating and iron type for all brands were chosen; 1000 W and
International Journal of Education and Research Vol. 1 No. 9 September 2013
5
dry iron. The iron that consumes the most energy will be considered for the final energy estimation.
3.4 Determination of ironing method
The method of ironing the male and female uniform is different. Before energy measurement is executed, three things must be done: set the ironing board to the comfortable height, followed by checking the type of cloth (cotton or synthetic), and then setting the iron temperature level based on the fabric type to get the optimum temperature or proper care that is suggested by the iron’s manufacturer.
3.4.1 Ironing male uniform
For ironing the shirts, several steps had been undertaken. Firstly, the collar was laid out flat on the ironing board. The iron was then pressed from the points of the collar inward to the back of the neck. Then, the underside of the collar was ironed. The iron was then pressed on the yoke and shoulders. The ironing board was positioned inside the shirt. The sleeve of the shirt was then put on top of the ironing board, both sides together flat, and then ironed. Then, the shirt was turned to iron the backside. The shirt was then repositioned to iron the opposite shoulder. After that, the shirt was turned, and the rear side of the yoke and shoulders were ironed. The shirt was then turned to press the other side. One sleeve was laid out flat on the ironing board. The sleeve was aligned following the bottom seam. The sleeve was pressed carefully, moving both layers of fabric flat as the iron was glided across the front surface of sleeve. This was repeated for the other sleeve. The shirt was turned to iron the other side of sleeve. The body of the shirt was positioned on the square end of the ironing board, the buttonhole panel first. It was pressed from the bottom tail progressing upward to the collar. The shirt was then turned to iron the inside of the body of shirt also. Next, the shirt position was moved to the next body panel, half of the back. The shirt was then pressed from the tail progressing upward to the collar. After that, the shirt position was moved to the last body panel, to the other half of the front, marked by the button panel. This was repeated similar to the previous procedure.
For the trousers, they were laid out flat along the length of the ironing board. One of the legs was positioned over the other. Plain water was sprinkled to iron the creases easier. One leg was ironed at a time. One leg was then flipped back. The leg on the left was concentrated by focusing on the small sections of the leg. It was ensured not to iron the leg in one motion. The ironing was done down from the pocket in slow motion slowly. This would avoid stretching the trouser. Next, the second leg was ironed. The other leg was brought back to ensure the inseams to be lined up. The ironing motion was repeated on this leg. Next, the trousers were turned over on the ironing board and the other side of the leg. They were handled with care to keep the inseams line up. As before, the top leg was flipped back. The first leg was then ironed, followed by the second leg. Finally, the front and back crease were created by positioning both seams directly over each other. The iron was pressed, and the ironing motion was repeated.
3.4.2 Ironing female uniform
To iron the dress (baju kurung), the sleeve parts were ironed first. One of the sleeves was chosen to be laid on the iron board. The iron was pressed from the top where the sleeve was sewn to the body and then down to the cuff. The same process was repeated to the bottom side, and was also repeated onto the other sleeve. Next, the front side of the dress body was ironed. This was started from the top to the bottom side of the left side of the dress.

ISSN: 2201-6333 (Print) ISSN: 2201-6740 (Online) www.ijern.com
6
The process was repeated for the right body side. Then, the dress was turned from the front side to the back side of the dress. The similar process was repeated.
To iron the long skirt, the front skirt was placed horizontally on the iron board. The left side was chosen to iron first. The skirt was ironed from the top to the down side. Then, the same process was repeated for the right side, followed by the middle side to make sure the entire skirt was ironed properly. The same process was repeated for the back skirt.
3.5 Measurement of energy consumption
In this study, the energy consumption during the school uniform ironing was measured by using a SY1012 plug and smart socket power monitor. The smart meter can record and display the data of the voltage (V), current (A), frequency (Hz) and the total running time. It can also calculate current power consumption (W), highest power consumption (Hi W), lowest power consumption (Lo W), and also total K.M. energy (kWh) with cost, the unit price of electricity ($/kWh) and has many other functions.
To measure the energy used, before starting the ironing process, the energy meter was plugged into the wall socket. Then, the electrical iron socket was plugged to the meter socket. The devices were then switched on. The smart meter would start recording when the iron was switched on and stop reading when the iron was switched off.
3.6 Estimation of energy consumption based on the population data
To obtain the actual population data, particularly the specific age, gender, race and body size is very difficult for the analysis. Hence, to estimate the total yearly energy consumption based on the ironing activities, the population data for each year was estimated. The number of population from 2011 to 2030 was calculated by using an equation that was created by using polynomial curve fitting. This equation was created by using MATLAB software. To produce this equation, the population data based on year 2000 to 2012 was used.
To calculate the energy usage daily, weekly, monthly and yearly, Eq.1, Eq.2, Eq.3 and Eq.4 were used, respectively.
Total energy used daily = Total energy used by students (7 to 17 years old) (Eq.1)
Total energy used weekly = Total energy used daily x 5 days (Eq.2)
Total energy used monthly = Total energy used daily x 22 days (Eq.3)
Total energy used monthly = Total energy used monthly x 10 months (Eq.4)
Since only population census data for year 2010 was available, an assumption was made to estimate the energy used for the remaining years from 2013 to 2030. By using the proportion number of people aged from 7 to 17 years, to the others, based on the population data in 2010, the total energy consumption for ironing school uniform from 2013 to 2030 was estimated.
4.0 Results and Discussions
The school uniform made from the synthetic cloth is more cost saving compared to the cotton cloth. This is because the wrinkles or creases of the synthetic clothes can be loosened easier than those on the cotton clothes. Besides that, synthetic cloth has a smooth and thin surface compared to the cotton cloth. From the energy measurement, ironing cotton cloth consumed for about 0.074 kWh of electrical energy, whereby synthetic cloth used about

International Journal of Education and Research Vol. 1 No. 9 September 2013
7
0.032 kW. Since cotton cloth is usually preferred and widely worn by students, the energy estimation was made based on the cotton type.
Based on the data shown in Table 1 and Table 2, and using the created polynomial curve fitting, the population data for the year 2013 to 2030 was estimated using the following equation:
= 5.1 − 9.965 (Eq.5)
The predicted energy consumption for male and female students based on the population data on 2010 are shown in Table 5 and Table 6, respectively. The energy consumption based on each size and its total energy used based on the number of population for each age (from 7 to 17 years old) were measured. For primary school level, children age from 7 to 8, 9 to 10 and 11 to 12 years old were considered to be wearing size S, M and L respectively. For the secondary school level, children with age 13 years old, from 14 to 15 and from 16 to 17 years old were considered to be wearing size S, M and L, respectively.
Table 5
The predicted energy consumption for male students based on different ages
Table 6
The predicted energy consumption for female students based on different ages
From Table 5, the energy consumed to iron a uniform for primary male student was 0.08, 0.096 and 0.114 kWh for each size of S, M and L, respectively. In the meantime, for the secondary male student, the electric consumptions were 0.128, 0.146 and 017 kWh when ironing uniform size S, M and L, respectively. From the data in Table 2, the total children aged from 7 to 17 years old in 2010 was 260906. Based on the population ratio among these years, the total energy predicted for primary male students ranged from 20872.48 kWh to 31840.77 kWh for size S, M and L, whereby for secondary male students, the energy used was between 33939.97 to 49730.95 kWh for each size, respectively. This accounted the energy used daily about 373114.832 kWh. The total of electrical energy used for weekly, monthly and yearly were 1865574.15, 8208526.26 and 82085262.60 kWh, respectively.
From Table 6, the total electrical energy used per day by female students was 328539.82 kWh. The total of electrical energy used weekly, monthly and yearly were 1642669, 7227875.95 and 72278759.5 kWh, respectively. The difference of energy consumed between primary and secondary female was about 32300 kWh daily.
However, in term of energy comparison between two genders, male students used about 44575 kWh of energy more than female to completely iron the uniform, daily. Since the number of male population for each year was higher than female, the energy difference between them could reach up to 9806503 kWh, yearly.
The predicted energy used for school uniform ironing from the year 2010 to 2030 is shown in Table 7. The population data for 2013 to 2030 was predicted by using Eq.5. From the table, it can be said that the population growth was proportional to the year. Since the population in Malaysia increases year by year, the total energy used yearly also increases. By the year of 2030, the total number of residents in Malaysia is estimated to reach up to 38800000, where the total of energy used to iron the school uniform in year 2030 would be 209520000 kWh. In total, for 20 years, from 2010 to 2030, about 3.819 x 10⁹ kWh would be consumed for ironing school uniform.

ISSN: 2201-6333 (Print) ISSN: 2201-6740 (Online) www.ijern.com
8
Table 7
The result of energy prediction
Though domestic consumers in Malaysia only use for about 20% of the total energy consumption, the effort to improve human behavior/attitude (in reducing electricity consumption) is a must. An attempt must be made to reduce and minimize the energy consumption in Malaysia, which in future can delay the process of energy sources depletion, lowering the carbon supply chain and may extend the energy security longer. Therefore, by pushing Malaysian Education Ministry to impose a new policy for the school dress code, this will reduce electricity consumption in the residential sector. This can be achieved by changing the commonly used cotton and synthetic materials to the un-ironed cloth materials e.g. collar cotton t-shirt, and also by improving the Malaysian people behavior, attitude and energy conservation awareness in reducing the energy used.
5.0 Conclusions and Recommendations
The energy consumption for ironing school uniforms has been studied. The estimation of energy consumption during ironing school uniform from year 2010 to 2030 has been done by estimating Malaysia population for each year using polynomial fitting curve. From the finding, it can be concluded that the:
- Ironing synthetic fabric consumes less energy than ironing cotton fabric by 45.3%. - The energy consumption ratio between the different size of L, M and S among the
male student is 1.3:1.1:1, whereas for female student is 1.2:1.1:1. - To iron male uniform, 44575 kWh of energy will be consumed more compared to the
female uniform, daily. This is due to the longer time needed to iron male’s trousers according to the difficulty to make the trouser look smooth.
- By using the proportion number of people aged from 7 to 17 years, to the others, based on population data in 2010, the total energy consumption during ironing school uniform is predicted to be up to 3819 GWh from 2013 to 2030.
From this research, several recommendations are listed here to reduce the energy consumption towards the uniform ironing activity, such as
- The awareness campaign regarding energy saving should be advertised widely in Malaysia. Electronics media such as television, radio, newspaper, pamphlet and website should play their role in terms of providing correct information about the energy status (reserves, consumption), how energy are being wasted and how to save energy in daily life to the public.
- It is also suggested that Malaysia Government should change their policy code from wearing cotton fabric to wearing other fabrics that do not need ironing. If this can be done, a lot of energy can be saved and the depletion of the natural fossil fuels can be delayed.
- People should be encouraged to use high energy efficient iron to save energy. When ironing cloth, it is better to damp the cloth lightly to smoothen the fabric and lessen the ironing time rate.
- Ironing school uniforms as a bundle at one time can provide less energy used than ironing single uniform one at a time.

International Journal of Education and Research Vol. 1 No. 9 September 2013
9
References
AbulQuasem Al-Amin1, ChamhuriSiwar, & Abdul Hamid Jaafar. (2009). Energy Use and Environmental Impact of New alternative fuel mix in electricity generation in Malaysia. The Open Renewable Energy Journal, 2, 25-32.
Anwar Al-Mofleh, Soib Taib, M. Abdul Mujeebu, & Wael Salah. (2009). Analysis of sectoral energy conservation in Malaysia. Energy, 34(6), 733–739.
Atsushi Akisawa, Y. (1998). Two model analyses of the urban structure of minimal transportation energy consumption. Applied Energy, 61(1), 25-39.
Cezar O.R. Negrão, & Christian J.L. Hermes. (2011). Energy and cost savings in household refrigerating appliances: A simulation-based design approach. Applied Energy 88(9),3051-3060.
Christopher , (2010), Electricity demand, economic growth, and sustainable energy resources in Malaysia. [Online] Available: http://christopherteh.com/blog/2010/09/electricity-demand/ (March 1, 2013)
Deering, M. Newborough, & S.D. Probert. (1993). Rescheduling electricity demands in domestic buildings. Applied Energy, 44(1), 51-62.
Department Of Statistics Malaysia, (2010), Population distribution and basic demographic characteristic report 2010. [Online] Available: http://www.statistics.gov.my/portal/index.php?option=com_content&view=article&id=1215%3Apopulation-distribution-and-basic-demographic-characteristic-report-population-and-housing-census-malaysia-2010-updated-2972011&catid=130%3Apopulation-distribution-and-basic-demographic-characteristic-report-population-and-housing-census-malaysia-2010&Itemid=154&lang=en ( March 15, 2013)
Energy and Development Group, Cape Town, South Africa, (2013), South African Environment: Energy used and global warming (n.d). [Online] Available:http://www.botany.uwc.ac.za/inforeep/energy3.htm (February 3, 2013)
Fei L. etal. (2011). Energy consumption-economic growth relationship and carbon dioxide emissions in China. Energy Policy,39, 568–574.
Haisheng Chen, Yulong Ding, Yongliang Li, Xinjing Zhang, &Chunqing Tan oichi Kaya. (2011). Air fuelled zero emission road transportation: A comparative study. Applied Energy , 88(1), 337-342.
Hyder G. Lakhani. (1981). Forecasting the cost of energy conservation in the transportation sector. Applied Energy, 9(2),139-151.
Iman Mansouri, Marcus Newborough, & Douglas Probert. (1996). Energy consumption in UK households: Impact of domestic electrical appliances. Applied Energy, 54(3), 211-285.
Imran Rasul, & Hollywood D. (2007). Behavior change and energy use: ‘nudge’ enough. Carbon Management, 3(4), 349-351.

ISSN: 2201-6333 (Print) ISSN: 2201-6740 (Online) www.ijern.com
10
Kilpatrick, R.A.R, Banfill, P.F.G, & Jenkins, D.P. (2011). Methodology for characterising domestic electrical demand by usage categories. Applied Energy, 88(3), 612-621.
Mahlia T.M.I, Masjuki, H.H, Saidur,R, Choudhury, I.A, &NoorLeha, A.R. (2003). Projected electricity savings from implementing minimum energy efficiency standard for household refrigerators in Malaysia. Energy, 28, 751–754.
Malaysia Energy Information Hub, Suruhanjaya Tenaga, (2008), National energy balance: Electricity Supply Industry in Malaysia –Performance and Statistical Information; 2008. [Online] Available: http://meih.st.gov.my/ (February 2, 2013)
Malaysian investment development authority, (2003), Industries in Malaysia. [Online] Available: http://www.mida.gov.my/env3/index.php?page=ee (January 24, 2013)
Maughan, G,Price,T.J, Probert,S.D, & Rushton, G. (1997). Transportation policy—How acting locally can be beneficial: The Rhymney Valley, South Wales as an example. Applied Energy, 58(1), 5 1-56.
Meier AK, & Hill JE. (1997). Energy test procedure for appliances. Energy and Building, 26(1), 23–34.
Merih Aydinalp, V. IsmetUgursal, & Alan S. Fung. (2002). Modeling of the appliance, lighting, and space-cooling energy consumptions in the residential sector using neural networks. Applied Energy, 71(2), 87-110.
MohdShahidanShaari , Nor ErmawatiHussain, & Mohammad Shariff Ismail. (2013). Relationship between Energy Consumption and Economic Growth: Empirical Evidence for Malaysia. Business Systems Review , 2(1),17-28.
Muhammad Ery Wijaya, & Tetsuo Tezuka. (2013). Measures for improving the adoption of higher efficiency appliances in Indonesian households: An analysis of lifetime use and decision-making in the purchase of electrical appliances. Applied Energy, In press, corrected proof.
Natural Resources Defense Council, (2005), Global Warming Basics: What it is, how it's caused, and what needs to be done to stop it. [Online] Available: http://www.nrdc.org/globalwarming/f101.asp (April 4, 2013)
PradeepBansal, Edward Vineyard, & Omar Abdelaziz . (2011). Advances in household appliances. Applied Thermal Engineering, 31(17-18),3748–3760.
Rafael Balbino Cardoso, E., Luiz Augusto HortaNogueira, &Jamil Haddad. (2010). Economic feasibility for acquisition of efficient refrigerators in Brazil. Applied Energy, 8(1),28-37.
Rodolfo Dufo-López, GhassanZubi, & Gian Vincenzo Fracastoro. (2012). Tecno-economic assessment of an off-grid PV-powered community kitchen for developing regions. Applied Energy,91(1), 255-262.
Saidur, R & et al. (2007). Energy and associated greenhouse gas emissions from household appliances in Malaysia. Energy Policy, 35(3),1648–1657.
Takashi Imaseki. (1998). Japanese automotive transportation sector’s impact upon Global warming Applied Energy, 59(2), 175-185.

International Journal of Education and Research Vol. 1 No. 9 September 2013
11
Tan, C.S, Maragatham, K, & Leong, Y.P. (2013). Electricity energy outlook in Malaysia. 4th International Conference on Energy and Environment 2013 (ICEE 2013),IOP Conf. Series: Earth and Environmental Science, 16, 2-12.
United States Environmental Protection Agency, (2013), Sources of greenhouse gas emissions. [Online] Available: http://www.epa.gov/climatechange/ghgemissions/sources/electricity.html (March 5, 2013)
Yumrutas R, &Unsal M. (2012). Modeling and performance, analysis of a house heating system with a ground coupled heat pump. Energy EducSciTechnol Part A, 28(2), 669-682.
Fig.1 Energy consumption in Malaysia from year 2000 to 2012
Fig.2 Energy consumption in Malaysia from year 2000 to 2012
32.18
47.43
1.44
18.96
Electricity Consumers of TNB According to Sectors in Year 2008
Commercial
Industrial
Other
Domestic
Energy consumption (billion kWh)

ISSN: 2201-6333 (Print) ISSN: 2201-6740 (Online) www.ijern.com
12
Fig.3 School uniform based on gender (a) Male (b) Female
Table 1 The total number of residents in Malaysia for year 2000 to 2012
Year Population
2000 23494000
2001 24030000
2002 24542000
2003 25038000
2004 25541000
2005 26046000
2006 26549000
2007 27058000
2008 27567000
2009 28081000
2010 28588000
2011 28964000
2012 29336800

International Journal of Education and Research Vol. 1 No. 9 September 2013
13
Table 2 Malaysia population census
Age Total
Indigenous Chinese Indian Others Non-
indigenous Malay
Other indigenous
5908988 3230190 804722 1134856 378761 47761 312698 7 506038 279696 71935 92651 31540 3881 26335 8 516954 285913 72072 93875 31807 4351 28936 9 540161 299118 75472 101672 34219 4217 25463 10 565994 310570 76261 110545 36496 4628 27494 11 500081 282746 70155 90169 32257 3674 21080 12 543782 299794 73788 102700 35094 4146 28260 13 517981 286405 69434 99941 34221 4024 23956 14 524324 283836 72494 103101 34035 4901 25959 15 610774 320873 78616 123372 39293 5693 42927 16 517711 279037 70302 105750 34688 4161 23773 17 565188 302202 74195 111080 35111 4085 38515
Mal
e
7 260906 143525 37168 47830 16036 1910 14437 8 265945 146521 36704 47743 16424 2298 16255 9 281062 154193 39665 53035 17302 2225 14642 10 290903 159309 38716 56620 18392 2305 15561 11 258566 144447 35520 47188 16403 1921 13087 12 279305 153665 37317 52715 17694 2152 15762 13 265156 147133 35136 51063 17211 2054 12559 14 269056 145580 36380 52103 17322 2813 14858 15 318533 165888 40630 64256 20348 2917 24494 16 266364 142949 35945 54679 17709 2145 12937 17 292535 152074 37714 57979 17726 2136 24906
Fem
ale
7 245132 136171 34767 44821 15504 1971 11898 8 251009 139392 35368 46132 15383 2053 12681 9 259099 144925 35807 48637 16917 1992 10821 10 275091 151261 37545 53925 18104 2323 11933 11 241515 138299 34635 42981 15854 1753 7993 12 264477 146129 36471 49985 17400 1994 12498 13 252825 139272 34298 48878 17010 1970 11397 14 255268 138256 36112 50998 16713 2088 11101 15 292241 154985 37986 59116 18945 2776 18433 16 251347 136088 34357 51071 16979 2016 10836 17 272653 150128 36481 53101 17385 1949 13609
ISSN: 2201-6333 (Print) ISSN: 2201-6740 (Online) www.ijern.com
14
Table 3 The uniform dimensions for the male school children
Shirt School type Primary Secondary Size S M L S M L Shoulder length (x_s), in inch 12.5 14.0 15.0 17.0 18.0 19.0
Shirt length (y_s), in inch 16.0 19.0 22.0 25.5 27.0 29.0
Trouser School type Primary Secondary Size S M L S M L Waist length (x_t), in inch 10.0 11.0 12.0 13.0 14.0 15.0
Trouser length (y_t), In inch 22.0 28.0 32.0 36.0 37.0 38.0
Table 4 The uniform dimensions for the female school children
Dress School type Primary Secondary Size S M L S M L Chest length (x_d), in inch 11.4 14.6 17.0 17.0 18.8 19.4
Dress length (y_d), in inch 23.0 32.0 35.0 35.0 39.0 41.0
Long Skirt School type Primary Secondary Size S M L S M L Hip length (x_ls), in inch 13.8 16.4 17.0 18.0 19.1 20.7
Skirt length (y_ls), in inch 35.0 36.0 37.0 37.8 38.2 40.0
Table 5 The predicted energy consumption for male based on different ages
School type
Age
Estimated size
Energy consumed per uniform (kWh)
Population based on age
Total energy by each age (kWh)
Primary
7 S 0.08 260906 20872.48 8 S 0.08 265945 21275.60 9 M 0.096 281062 26981.95
10 M 0.096 290903 27926.69 11 L 0.114 258566 29476.52 12 L 0.114 279305 31840.77
Secondary
13 S 0.128 265156 33939.97 14 M 0.146 269056 39282.18 15 M 0.146 318533 46505.82 16 L 0.17 266364 45281.9 17 L 0.17 292535 49730.95
The total energy consumption daily 373114.83 The total energy consumption weekly 1865574.15 The total energy consumption monthly 8208526.26 The total energy consumption yearly 82085262.6

International Journal of Education and Research Vol. 1 No. 9 September 2013
15
Table 6 The predicted energy consumption for female based on different ages
School type
Age
Estimated size
Energy consumed per uniform (kWh)
Population based on age
Total energy by each age (kWh)
Primary
7 S 0.086 245132 21081.35 8 S 0.086 251009 21586.77 9 M 0.097 259099 25132.60 10 M 0.097 275091 26683.83 11 L 0.106 241515 25600.59 12 L 0.106 264477 28034.56
Secondary
13 S 0.123 252825 31097.48 14 M 0.133 255268 33950.64 15 M 0.133 292241 38868.05 16 L 0.146 251347 36696.60 17 L 0.146 272653 39807.34
The total energy consumption daily 328539.82 The total energy consumption weekly 1642669.1 The total energy consumption monthly 7227875.95 The total energy consumption yearly 72278759.5

ISSN: 2201-6333 (Print) ISSN: 2201-6740 (Online) www.ijern.com
16
Table 7 The result of energy prediction from year 2010 to the year 2030
Year Population Total Energy (kWh) 2010 28588000 154364022 2011 28964000 156405600 2012 29336800 158418720 2013 30130000 162702000 2014 30640000 165456000 2015 31150000 168210000 2016 31660000 170964000 2017 32170000 173718000 2018 32680000 176472000 2019 33190000 179226000 2020 33700000 181980000 2021 34210000 184734000 2022 34720000 187488000 2023 35230000 190242000 2024 35740000 192996000 2025 36250000 195750000 2026 36760000 198504000 2027 37270000 201258000 2028 37780000 204012000 2029 38290000 206766000 2030 38800000 209520000
Total energy in 20 year
3.819 x10⁹