energy book final for press
DESCRIPTION
ENERGYTRANSCRIPT

Engineering in Development:Energy
EWB-UK
Jon Sumanik-Leary, Milan Delor, Matt Little, Martin Bellamy,
Arthur Williams & Sam Williamson
ENERGY BOOK PRESS.indb 1 02/09/2014 14:54:51

Copyright © 2014 EWB-UK
Published under Creative Commons Licence: Attribution-NonCommerical-ShareAlike 4.0 International
To view a copy of this licence visit http://creativecommons.org/licenses/by-nc-sa/4.0/ or send a letter to Creative Commons, 444 Castro Street, Suite 916, Mountain View, CA 94041
First edition published 2014
Notice of Liability While every precaution has been taken in the preparation of this book, neither the authors,
nor EWB-UK shall have any liability to any person or entity with respect to any loss or damage caused or alleged to have been caused directly or indirectly by the instructions
contained in this book. The aim of this book is to assist the development process, however we strongly advise all readers to consult an expert and community leaders before making
decisions about a project. Any omissions or errors should be reported to: [email protected] or write to:
Engineers Without Borders UK
1 Great George Street
London
SW1P 3AA
United Kingdom
Printed in the UK by printondemand-worldwide, Peterborough
First Printing, 2014
Further copies of this book and others in the series can be ordered from EWB-UK. Visit their website http://www.ewb-uk.org/
Paper used in the production of this book is a natural recyclable product made from wood grown in sustainable forests.
ENERGY BOOK PRESS.indb 2 02/09/2014 14:54:51

Contents Contents in detail i
Index of case studies iv
Acknowledgements vi
About the authors vii
A word from EWB-UK ix
About this book x
PART I
Chapter 1 Introduction 1
PART II
Chapter 2 The basics 53
PART III
Chapter 3 The details 131
Chapter 4 Further reading 375
Chapter 5 Bibliography 386
ENERGY BOOK PRESS.indb 3 02/09/2014 14:54:51
Energy – Contents in detail
– i –
Contents in detailPart I
1 Introduction 1
1.1 The importance of access to energy services 1
1.2 What necessary services does energy bring? 2
1.3 Data availability, indicators and identifying needs 5
1.4 Energy access for earning a living 11
1.5 Capacity building and the role of community involvement 12
1.6 Thinking holistically 16
1.7 Reaching scale 26
1.8 Accesstofinance 28
1.8.1 Funding types 28
1.9 How to use this book – the energy systems design process 34
1.9.1 Introducing energy pathways 34
1.9.2 Choosing an energy pathway 38
1.9.3 Worked example 46
1.10 Final remarks 52
Part II2 The basics 53
2.1 Assessing energy demands – the basics 53
2.1.1 Baseline and basic demand assessments 53
2.1.2 More information 55
2.2 Energy resources – the basics 55
2.2.1 Resource assessment 55
ENERGY BOOK PRESS.indb 1 02/09/2014 14:54:51
Energy – Contents in detail
– ii –
Part III3 The details 131
3.1 Assessing energy demands – the details 131
3.1.1 Example: lighting 132
3.1.2 Load spreadsheets 134
3.1.3 Energyefficiency 136
3.1.4 Summary 143
3.2 Energy resources – the details 144
3.2.1 Solar resource – the details 144
3.2.2 Wind resource – the details 149
3.2.3 Hydro resource – the details 160
3.3 Conversion technologies – the details 168
3.3.1 Solar PV – the details 168
2.2.2 Solar resource – the basics 56
2.2.3 Wind resource – the basics 60
2.2.4 Hydro resource – the basics 67
2.2.5 Biomass resource for cooking – the basics 68
2.3 Conversion technologies – the basics 73
2.3.1 Solar PV – the basics 73
2.3.2 Small Wind Turbines – the basics 80
2.3.3 Pico- and micro-hydro – the basics 89
2.3.4 Improved cookstoves – the basics 98
2.4 Practical system design – the basics 106
2.4.1 Practical considerations for working inthefield 106
2.4.2 Electrical systems 115
ENERGY BOOK PRESS.indb 2 02/09/2014 14:54:52
Energy – Contents in detail
– iii –
3.3.2 Small Wind Turbines (SWTs) – the details 198
3.3.3 Pico- and micro-hydropower – the details 219
3.3.4 Improved cookstoves – the details 252
3.4 Practical system design – the details 264
3.4.1 Electrical system design 264
3.4.2 Detailed electrical system 266
3.4.3 System monitoring & involving the user 362
3.4.4 Tools for electrical systems 371
3.4.5 Troubleshootingandfaultfinding electrical systems 373
4 Further reading 375
4.1 Energy access 375
4.1.1 General 375
4.1.2 Accesstofinance 376
4.2 Accessing energy demand 376
4.3 Energy resources and conversion technologies 377
4.3.1 Solar 377
4.3.2 Wind 378
4.3.3 Hydro 379
4.3.4 Improved cookstoves 381
4.4 Practical system design 383
4.4.1 Diesel generators 383
4.4.2 Stand-alone power supply 383
4.4.3 Computer simulation tools 383
4.4.4 Batteries 384
4.4.5 Other 385
5 Bibliography 386
ENERGY BOOK PRESS.indb 3 02/09/2014 14:54:52
– iv –
Energy – Case study contents
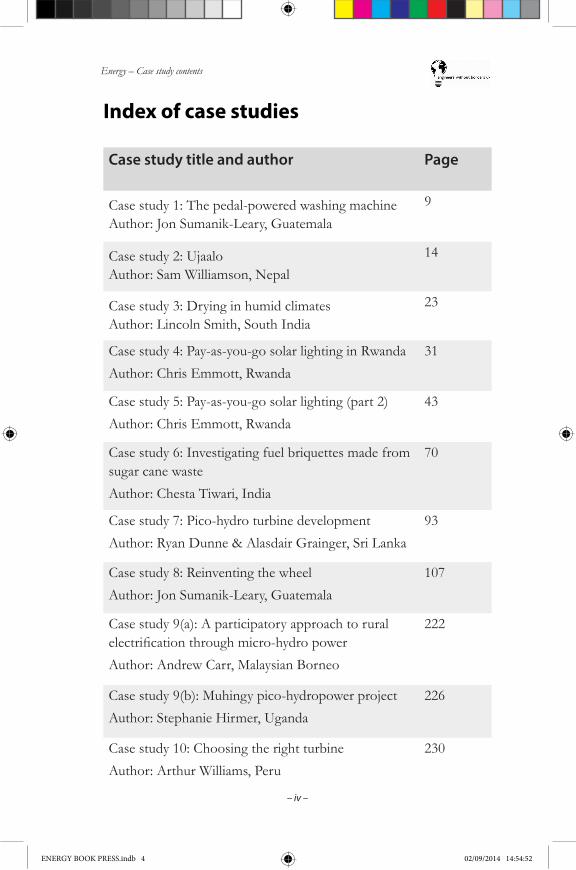
Case study title and author Page
Case study 1: The pedal-powered washing machineAuthor: Jon Sumanik-Leary, Guatemala
9
Case study 2: UjaaloAuthor: Sam Williamson, Nepal
14
Case study 3: Drying in humid climatesAuthor: Lincoln Smith, South India
23
Case study 4: Pay-as-you-go solar lighting in RwandaAuthor: Chris Emmott, Rwanda
31
Case study 5: Pay-as-you-go solar lighting (part 2)Author: Chris Emmott, Rwanda
43
Case study 6: Investigating fuel briquettes made from sugar cane wasteAuthor: Chesta Tiwari, India
70
Case study 7: Pico-hydro turbine developmentAuthor: Ryan Dunne & Alasdair Grainger, Sri Lanka
93
Case study 8: Reinventing the wheelAuthor: Jon Sumanik-Leary, Guatemala
107
Case study 9(a): A participatory approach to rural electrificationthroughmicro-hydropowerAuthor: Andrew Carr, Malaysian Borneo
222
Case study 9(b): Muhingy pico-hydropower projectAuthor: Stephanie Hirmer, Uganda
226
Case study 10: Choosing the right turbineAuthor: Arthur Williams, Peru
230
Index of case studies
ENERGY BOOK PRESS.indb 4 02/09/2014 14:54:52

Case study title and author Page
Casestudy11:Ruralelectrificationthroughmicro-hydropower: dealing with siltationAuthor: Andrew Carr, Malaysian Borneo
245
Case study 12: Heat retention cookersAuthor: Aoife Wilson, Uganda
256
Case study 13: The importance of marketing for micro energy enterprises in East AfricaAuthor: Laura Clough, Kenya
261
Case study 14: An interdisciplinary research study of off-grid solar PV systems in Rwandan Health Centres and SchoolsAuthor: Andrew Crossland, Oghenetejiri Harold Anuta, Bronwyn McNeil, United Kingdom
287
Case study 15: Importance of long-term sustainabilityAuthor: Matthew Little, Philippines
306
ENERGY BOOK PRESS.indb 5 02/09/2014 14:54:52

– vi –
Energy – Acknowledgements
AcknowledgementsThis book could not have been produced without the collaborative efforts of many individuals, the vast majority of them volunteers who gave up their time and effort for free to help in its production.
The Engineering in Development project as a whole was coordinated by Muhammad Tahir, who brought us all together to bring the idea into reality. Throughout the Engineering in Development process, our actions were guided by the steering committee, which was chaired by Muhammad Tahir and consisted of Drew Corbyn, Andy McLoughlin, Robin Lovelace, Arthur Williams, Jon Sumanik-Leary, Milan Delor and Andrew Lamb.
The Energy volume was coordinated by Jon Sumanik-Leary and Milan Delor and the main body of the book was written and edited by Jon Sumanik-Leary, Milan Delor, Matt Little, Martin Bellamy, Arthur Williams and Sam Williamson. The case studies were written by multiple authors and were collated and edited by Jon Sumanik-Leary and Milan Delor.
Jon Sumanik-Leary would like to thank Michel Mapoux, Hugh Piggott,KostasLatoufisandJayHudnallfromWindEmpowermentfor peer-reviewing the wind sections and Neil Noble, Matteo Ranaboldo and Laia Ferrer-Martí for the use of their materials. Matt Little would like to thank Edward Little for proofreading the practical system design sections. Milan Delor would like to thank Jonathan Rouse (Director, HED Consulting Ltd) for his contribution to the improved cookstoves chapter, and Practical Action Consulting for permission to use materials from the Poor People’s Energy Outlook series.
Some content of this Engineering in Development initiative resulted from the research of E-Futures PhD students, funded by theEPSRCattheUniversityof Sheffield.WewouldliketothankE-Futuresforfinancingtheinitialprintrunandillustratorcosts.
We would also like to extend our thanks to Steve Evans for a number of illustrations he produced specially for this book and to Emma-Louise Carroll for the cover design.
Finally, a special thanks goes to Judith Paskin, who volunteered her time for this project and managed to turn a bunch of disorganised Wordfilesintoacoherentandpublishedbook.
ENERGY BOOK PRESS.indb 6 02/09/2014 14:54:52
– vii –
Energy – About the authors
About the authors
Milan DelorMilan Delor is a PhD student at the E-Futures Doctoral Training Centre, Universityof Sheffield.Hisinterdisciplinaryresearchfocusesonnovelsolarenergytechnologies.Memberof theEWB-Sheffieldcommitteesince2010,firstasinternationalprojectsco-ordinatorandthenbranchprojects manager, he has initiated projects on improved cookstoves and urban agriculture, helped integrate several EWB projects into the Faculty of Engineering’s curriculum, and set up international collaborations with partner NGOs. Milan also collaborated with Practical Action Consulting on the Energy Access Ecosystems approach published in the Poor People’s Energy Outlook 2012.
Jon Sumanik-LearyJonSumanik-LearyisaresearchfellowattheUniversityof Sheffield.Jonisamultidisciplinaryresearcherinthefieldof smallscalerenewableenergytechnologies to improve access to energy in developing countries. He is the co-ordinator of the WindEmpowerment network and has recently completedhisPhDonsmallwindforruralelectrification.Jonhasbeeninvolved with EWB-UK since 2008 when he received a bursary to travel to rural Guatemala to put into practice his research on the design of a pedal powered water pump.
Sam WilliamsonSam Williamson is a Research Assistant at the University of Bristol in the Electrical Energy Management Group. Sam’s work is mainly focussed on pico-hydropower for developing countries, looking at the mechanical and electrical aspects, as well as understanding the implementation and end uses of thepowerinruralelectrification.SamspentayearworkinginNepalon hydropower, energy and community projects before completing his PhD, which was supported by EWB-UK. Sam has run a number of energy workshops with EWB-UK at festivals and on courses for students and professionals, as well as supporting the Innovation Hub’s ‘Pico in Nepal’ competition.
ENERGY BOOK PRESS.indb 7 02/09/2014 14:54:52

– viii –
Energy – About the authors
Martin BellamyMartin Bellamy has over 25 years of engineering experience, with the last 15 working directly within the solar photovoltaics industry. His focus is the design of off-grid energy products and solutions and the development of emerging Thin-Film PV, particularly non-glass technologies. He is an independent PV specialist who provides training, product design and strategic business advice to national stakeholders, PV manufacturers and the international investment sector. He has designed and implemented complex stand-alone PV systems for urban environments, extreme climates, and highly specialized applications. His product designs include award-winningLEDsolarlights,intelligentcontrolsandtheworld’sfirstbuilding-integrated off-grid lighting system. Martin holds an honours degree in engineering physics and is chartered as a physicist, engineer andscientist.Hehasoriginated11patentsrelatingtoThin-filmPVtechnologies.
Matthew LittleMatthew Little is a freelance electrical engineer at Renewable Energy Innovation. He has worked exclusively on renewable energy projects for the past 14 years with a focus on stand-alone power supply systems. He has worked on design, installation, testing and monitoring of photovoltaic systems of all sizes and types including stand-alone and grid-connected. His teaching work has included training for electricians, lectures for students and hands-on solar workshops for all. In 2007–8, with EWB-UK funding, he went on a placement with a Filipino NGO installing small wind turbines, micro-hyrdo and solar PV systems in remote rural locations.
Arthur WilliamsArthurWilliamshasover25yearsof experienceworkinginthefieldof renewable energy, especially small-scale technologies. He completed a PhD in micro-hydropower in 1992 and has been involved in projects to develop anddisseminatecost-effectivetechnologiesforruralelectrification,oftenworking in collaboration with Practical Action. He is currently associate professor at the University of Nottingham where he runs an MSc in Sustainable Energy Engineering. Although based in the Department of Electrical and Electronic Engineering, he is a Chartered Mechanical Engineer. He has been supporting EWB-UK since 2010.
ENERGY BOOK PRESS.indb 8 02/09/2014 14:54:52

– ix –
Energy – A word from EWB-UK
A word from EWB-UKThere are many excellent books about technologies that are appropriate for developing country contexts. But this book is unique. It has been written not just by engineers but by engineers without borders; by the new generation of engineers that are supported by the Engineers Without Borders UK organisation and who are part of a global movement for change.
Engineering in Development is also unique because it will never be a finishedproduct.Rather,itisaprocess.Itscontenthasbeencreatedby the people who use it. And as a process, each edition allows for newmaterialtoemergeandexistingcontenttoberefined.Thoughany given edition will never be comprehensive – because the work of EWB-UK’s volunteers will never cover every type of technology – each edition marks a new iteration, or new milestone, that gathers the best know-how of the EWB-UK community.
In fact, each edition contains just a selection of all the expertise that is gathered and available on www.engineeringindevelopment.org.
Unlike knowledge, ‘know-how’ is very hard to transcribe. Craftsmanshipistrickytocommunicate.Skillsaredifficulttoshare.Because of this, EWB-UK struggles to get its volunteers to write down the experience they gain from their work around the world. The core purpose of the Engineering in Development process is to transform the act of writing down this ‘know-how’ into a bite-size project. Without shame, it draws on the inspiration and universal admiration of another book called Engineering in Emergencies and its contributors aspire to achieve a similar standard of work.
Engineering in Development can be shared freely and openly, removing barriers to access and enabling others to identify how to use technology to determine their own development.
With considered judgement, the humility to listen and learn about context, and a degree of manual competence, the ‘know-how’ contained in these pages becomes a very powerful force for good indeed.
Andrew Lamb, former CEO, EWB-UK
ENERGY BOOK PRESS.indb 9 02/09/2014 14:54:52

Energy – About This Book
– x –
About this bookThe overall aim of the Energy book is to provide a cohesive, concise andpracticalguidetohelpfieldpractitioners(suchasEngineersWithout Borders placement volunteers) maximise the positive impact of energy-related projects. To do this, the book will:
1. Provide an overview of the importance of access to energy for development.
2. Outline a standard engineering design process with which it is possible to identify appropriate pathways to achieve energy access in a development context.
3. Give detailed descriptions of the most common energy resources and conversion technologies appropriate in a development context, and practical guides on how to implement these technologies.
4. Outline pitfalls and caveats that often occur in energy related development projects and partnerships. This will be complemented with tips from practitioners on how they can be avoided.
5. Provide case studies as real-world examples of energy projects for development.
6. Provide a list of useful resources and contacts for more in-depth information on each topic.
While the aim of the book is to assist the development process, we strongly advise all readers to consult an expert and local champion before making crucial decisions about their project.
ENERGY BOOK PRESS.indb 10 02/09/2014 14:54:53
Energy Part I chapter 1 – Introduction
– 1 –
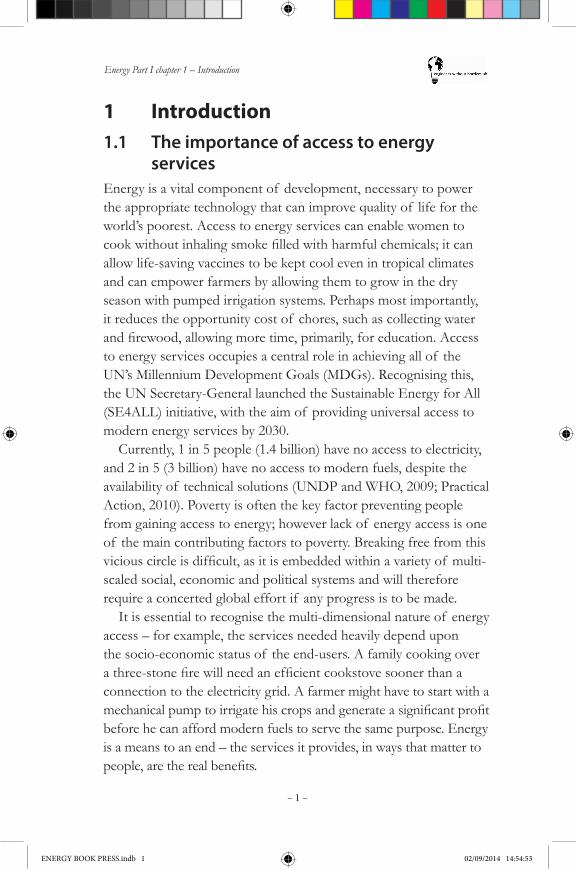
1 Introduction1.1 The importance of access to energy servicesEnergy is a vital component of development, necessary to power the appropriate technology that can improve quality of life for the world’s poorest. Access to energy services can enable women to cookwithoutinhalingsmokefilledwithharmfulchemicals;itcanallow life-saving vaccines to be kept cool even in tropical climates and can empower farmers by allowing them to grow in the dry season with pumped irrigation systems. Perhaps most importantly, it reduces the opportunity cost of chores, such as collecting water andfirewood,allowingmoretime,primarily,foreducation.Accessto energy services occupies a central role in achieving all of the UN’s Millennium Development Goals (MDGs). Recognising this, the UN Secretary-General launched the Sustainable Energy for All (SE4ALL) initiative, with the aim of providing universal access to modern energy services by 2030.
Currently, 1 in 5 people (1.4 billion) have no access to electricity, and 2 in 5 (3 billion) have no access to modern fuels, despite the availability of technical solutions (UNDP and WHO, 2009; Practical Action, 2010). Poverty is often the key factor preventing people from gaining access to energy; however lack of energy access is one of the main contributing factors to poverty. Breaking free from this viciouscircleisdifficult,asitisembeddedwithinavarietyof multi-scaled social, economic and political systems and will therefore require a concerted global effort if any progress is to be made.
It is essential to recognise the multi-dimensional nature of energy access – for example, the services needed heavily depend upon the socio-economic status of the end-users. A family cooking over athree-stonefirewillneedanefficientcookstovesoonerthanaconnection to the electricity grid. A farmer might have to start with a mechanicalpumptoirrigatehiscropsandgenerateasignificantprofitbefore he can afford modern fuels to serve the same purpose. Energy is a means to an end – the services it provides, in ways that matter to people,aretherealbenefits.
ENERGY BOOK PRESS.indb 1 02/09/2014 14:54:53
Energy Part I chapter 1 – Introduction
– 2 –
This section on energy access draws heavily from Practical Action’s highly relevant publications, the Poor People’s Energy Outlook (PPEO) 2010, 2012 and 2013, to which the reader is referred if they wish to learn more about the issues surrounding energy poverty. The aim here is to outline the aspects most relevant to a potential EWB-UK placement volunteer, and to guide the reader in identifying the needs of households, small enterprises or communities, where engineers on placement can have an impact.
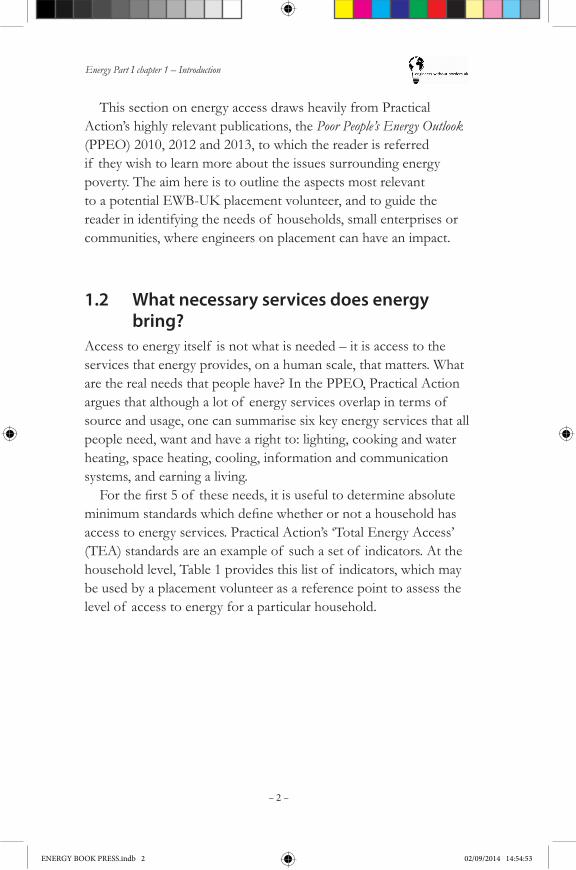
1.2 What necessary services does energy bring? Access to energy itself is not what is needed – it is access to the services that energy provides, on a human scale, that matters. What are the real needs that people have? In the PPEO, Practical Action argues that although a lot of energy services overlap in terms of source and usage, one can summarise six key energy services that all people need, want and have a right to: lighting, cooking and water heating, space heating, cooling, information and communication systems, and earning a living. Forthefirst5of theseneeds,itisusefultodetermineabsolute
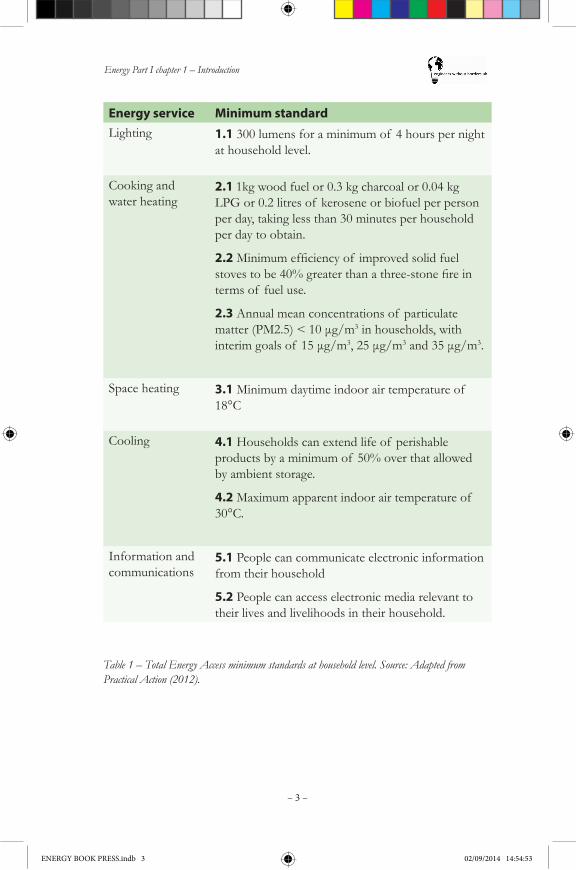
minimumstandardswhichdefinewhetherornotahouseholdhasaccess to energy services. Practical Action’s ‘Total Energy Access’ (TEA) standards are an example of such a set of indicators. At the household level, Table 1 provides this list of indicators, which may be used by a placement volunteer as a reference point to assess the level of access to energy for a particular household.
ENERGY BOOK PRESS.indb 2 02/09/2014 14:54:53
Energy Part I chapter 1 – Introduction
– 3 –
Energy service Minimum standardLighting 1.1 300 lumens for a minimum of 4 hours per night
at household level.
Cooking and water heating
2.1 1kg wood fuel or 0.3 kg charcoal or 0.04 kg LPG or 0.2 litres of kerosene or biofuel per person per day, taking less than 30 minutes per household per day to obtain.
2.2Minimumefficiencyof improvedsolidfuelstovestobe40%greaterthanathree-stonefireinterms of fuel use.
2.3 Annual mean concentrations of particulate matter(PM2.5)<10μg/m3 in households, with interimgoalsof 15μg/m3,25μg/m3and35μg/m3.
Space heating 3.1 Minimum daytime indoor air temperature of 18°C
Cooling 4.1 Households can extend life of perishable products by a minimum of 50% over that allowed by ambient storage.
4.2 Maximum apparent indoor air temperature of 30°C.
Information and communications
5.1 People can communicate electronic information from their household
5.2 People can access electronic media relevant to their lives and livelihoods in their household.
Table 1 – Total Energy Access minimum standards at household level. Source: Adapted from Practical Action (2012).
ENERGY BOOK PRESS.indb 3 02/09/2014 14:54:53
Energy Part I chapter 1 – Introduction
– 4 –
Note that this set of indicators is multi-dimensional. For example, it is not only 1 kg of wood fuel that is needed for cooking and water heating, it is 1 kg of wood fuel taking less than 30 minutes per household per day to obtain. This takes into account the opportunity costs associated with obtaining energy supplies. These opportunity costs are often in the form of time wasted to obtain something which could be considerably reduced by appropriate access to energy supplies. This time could instead be used for education and socialising, amongst other crucial elements to development.
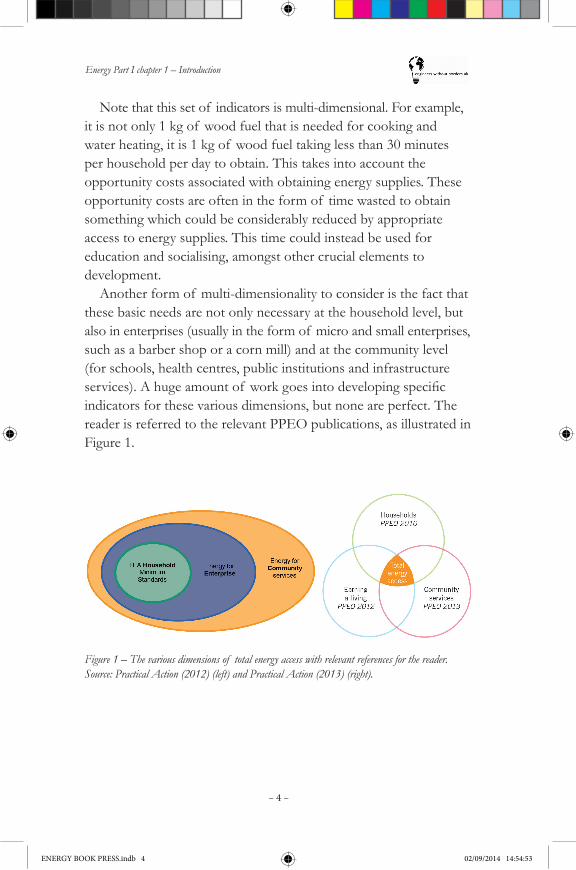
Another form of multi-dimensionality to consider is the fact that these basic needs are not only necessary at the household level, but also in enterprises (usually in the form of micro and small enterprises, such as a barber shop or a corn mill) and at the community level (for schools, health centres, public institutions and infrastructure services).Ahugeamountof workgoesintodevelopingspecificindicators for these various dimensions, but none are perfect. The reader is referred to the relevant PPEO publications, as illustrated in Figure 1.
Figure 1 – The various dimensions of total energy access with relevant references for the reader. Source: Practical Action (2012) (left) and Practical Action (2013) (right).
ENERGY BOOK PRESS.indb 4 02/09/2014 14:54:53
Energy Part I chapter 1 – Introduction
– 5 –
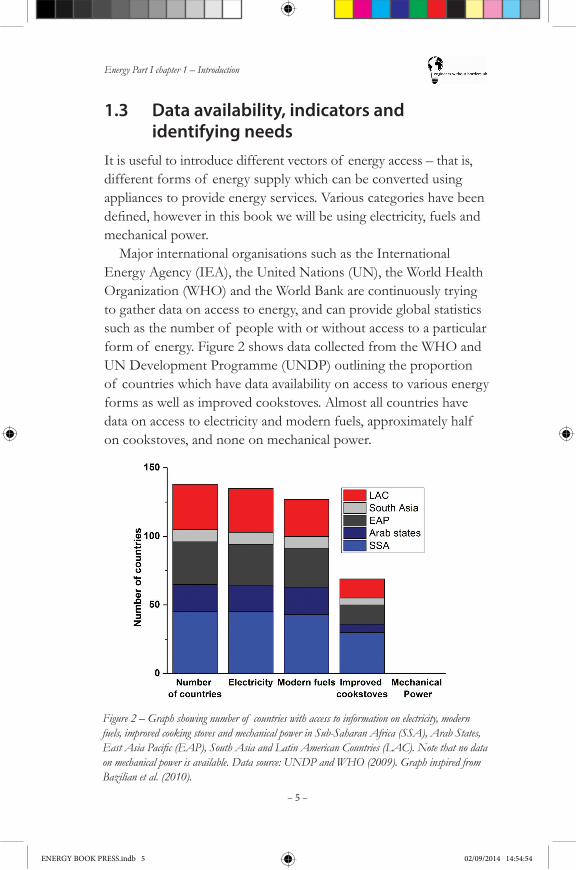
Figure 2 – Graph showing number of countries with access to information on electricity, modern fuels, improved cooking stoves and mechanical power in Sub-Saharan Africa (SSA), Arab States, East Asia Pacific (EAP), South Asia and Latin American Countries (LAC). Note that no data on mechanical power is available. Data source: UNDP and WHO (2009). Graph inspired from Bazilian et al. (2010).
1.3 Data availability, indicators and identifying needsIt is useful to introduce different vectors of energy access – that is, different forms of energy supply which can be converted using appliances to provide energy services. Various categories have been defined,howeverinthisbookwewillbeusingelectricity,fuelsandmechanical power.
Major international organisations such as the International Energy Agency (IEA), the United Nations (UN), the World Health Organization (WHO) and the World Bank are continuously trying to gather data on access to energy, and can provide global statistics such as the number of people with or without access to a particular form of energy. Figure 2 shows data collected from the WHO and UN Development Programme (UNDP) outlining the proportion of countries which have data availability on access to various energy forms as well as improved cookstoves. Almost all countries have data on access to electricity and modern fuels, approximately half on cookstoves, and none on mechanical power.
ENERGY BOOK PRESS.indb 5 02/09/2014 14:54:54
Energy Part I chapter 1 – Introduction
– 6 –
Although most countries have data on access to electricity and modern fuels, it is misleading to think that this data is comprehensive. For example, data on electricity often means data on how many people have access to grid connections, in a simple yes or no format. It often does not take into account whether or not these people can afford to pay for the initial connection and if they could, whether they can afford the monthly payments. In addition to this, the grid connection may be extremely unreliable, leading to regular black- and brownouts.
In contrast, the indicators discussed in this section provide a textured picture of whether or not people have access to the energy services that they need and are therefore a much more accurate description of their level of energy access. However, this data is extremelydifficulttoobtainonnationalscales.Thebestwaytoobtainsuch data is to conduct surveys in situ, and as a result, collecting this data is best done through crowd-sourcing. Gathering such data can be one of the largest impacts EWB-UK placement volunteers (as a group) can have, as it is crucial for developing national and international policies
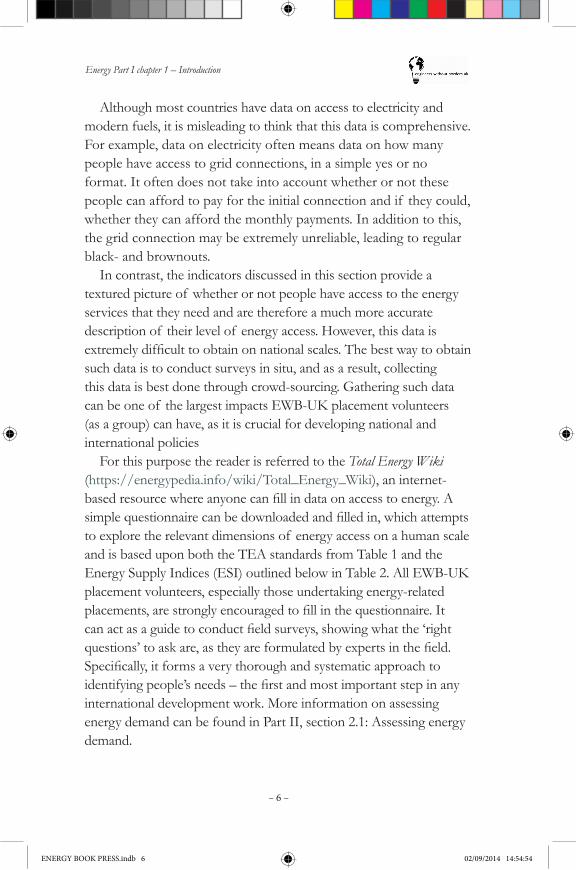
For this purpose the reader is referred to the Total Energy Wiki (https://energypedia.info/wiki/Total_Energy_Wiki), an internet-basedresourcewhereanyonecanfillindataonaccesstoenergy.Asimplequestionnairecanbedownloadedandfilledin,whichattemptsto explore the relevant dimensions of energy access on a human scale and is based upon both the TEA standards from Table 1 and the Energy Supply Indices (ESI) outlined below in Table 2. All EWB-UK placement volunteers, especially those undertaking energy-related placements,arestronglyencouragedtofillinthequestionnaire.Itcanactasaguidetoconductfieldsurveys,showingwhatthe‘rightquestions’toaskare,astheyareformulatedbyexpertsinthefield.Specifically,itformsaverythoroughandsystematicapproachtoidentifyingpeople’sneeds–thefirstandmostimportantstepinanyinternational development work. More information on assessing energy demand can be found in Part II, section 2.1: Assessing energy demand.
ENERGY BOOK PRESS.indb 6 02/09/2014 14:54:54
Energy Part I chapter 1 – Introduction
– 7 –
Energy supply Level Quality of supply
Household fuels 0 Using non-standard solid fuels such as plastics.
1 Usingsolidfuelinanopen/three-stonefire.2 Using solid fuel in an improved stove.3 Using solid fuel in an improved stove with
smoke extraction/chimney.4 Mainly using a liquid or gas fuel or
electricity, and associated stove.5 Using only a liquid or gas fuel or electricity,
and associated stove.
Electricity 0 No access to electricity at all.1 Access to third party battery charging only.2 Access to stand-alone electrical appliance
(e.g. solar lantern, solar phone charger).3 Own limited power access for multiple
home applications (e.g. solar home systems or power-limited off-grid).
4 Poor quality and/or intermittent AC connection.
5 Reliable AC connection available for all uses.
Mechanical Power
0 No household access to tools or mechanical advantages.
1 Hand tools available for household tasks.2 Mechanical advantage devices available to
magnify human/animal effort for most household tasks.
3 Powered mechanical devices available for some household tasks.
4 Powered mechanical devices available for most household tasks.
5 Mainly purchasing mechanically processed goods and services.
Table 2 – The Energy Supply Indices (ESI), a simple scoring mechanism that provides a more realistic and textured picture of access to energy services than national scale statistics give. Source: Adapted from Practical Action (2012).
ENERGY BOOK PRESS.indb 7 02/09/2014 14:54:54

Energy Part I chapter 1 – Introduction
– 8 –
Such scoring systems can be applied to household, enterprise or community level (with adapted indicators), and should ultimately leadtocomprehensivedatasetswhichcaninformandinfluenceworldwide policies and form a framework for action, from major multilateral organisations such as the UN or World Bank, down to community-based organisations (CBOs) and individuals.
Although such questionnaires and indicators may be used to identify people’s energy needs, one must always make sure that chosensolutionsarealsoculturallyappropriate.Thisisdifficulttoachieve and may only be ascertained by directly talking to the end-users and involving them in the decision-making process (see case study 1). This is explored in more detail in the Pre-departure book from the Engineers Without Borders: Engineering in Development series.
ENERGY BOOK PRESS.indb 8 02/09/2014 14:54:54
Energy Part I chapter 1 – Introduction
– 9 –
Case study 1: The pedal-powered washing machine
Jon Sumanik-Leary, Guatemala, 2009
Maya Pedal is a Guatemalan NGO based in the rural town of San Andrés Itzapa and is one of the world’s leading centres for bicitecnología (bicycle technology). Unwanted bicycles are collected by co-operatives in North America to be sent down to Central America by shipping container. The best are refurbished and sold as bicycles, whilst the rest are stripped down ready to begin a new life as a bicycle machine.
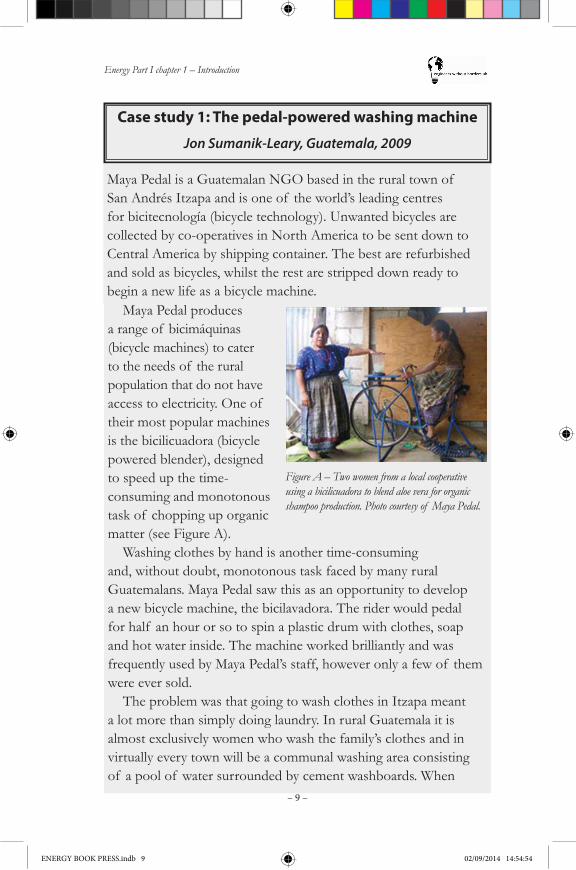
Maya Pedal produces a range of bicimáquinas (bicycle machines) to cater to the needs of the rural population that do not have access to electricity. One of their most popular machines is the bicilicuadora (bicycle powered blender), designed to speed up the time-consuming and monotonous task of chopping up organic matter (see Figure A).
Washing clothes by hand is another time-consuming and, without doubt, monotonous task faced by many rural Guatemalans. Maya Pedal saw this as an opportunity to develop a new bicycle machine, the bicilavadora. The rider would pedal for half an hour or so to spin a plastic drum with clothes, soap and hot water inside. The machine worked brilliantly and was frequently used by Maya Pedal’s staff, however only a few of them were ever sold.
The problem was that going to wash clothes in Itzapa meant a lot more than simply doing laundry. In rural Guatemala it is almost exclusively women who wash the family’s clothes and in virtually every town will be a communal washing area consisting of a pool of water surrounded by cement washboards. When
Figure A – Two women from a local cooperative using a bicilicuadora to blend aloe vera for organic shampoo production. Photo courtesy of Maya Pedal.
ENERGY BOOK PRESS.indb 9 02/09/2014 14:54:54

Energy Part I chapter 1 – Introduction
– 10 –
asked informally why they were not interested in Maya Pedal’s new machine, many of the women said that they would actually look forward to doing the laundry because this was their chance tocatchupwithfriends.Timeflieswhenyou’rehavingfun,soforthese ladies, laundry was not even seen as a chore. That is to say, except for when you had to do it alone in your own home with only a machine for company!
About the author: Jon received an EWB-UK bursary to spend four months working with Maya Pedal on the design of the bicibomba móvil (mobile bicycle powered water pump) that he began as a Master’s level research project at the University of Sheffield.
About the organisation: Maya Pedal is operated as a small business, with Carlos Marroquín and son designing, manufacturing and installing over 10,000 bicimáquinas. International volunteers bring their skills and ideas to Maya Pedal and assist them with the refurbishing of bicycles or with their bicitecnología. Maya Pedal have produced thousands of bicycle machines and the bicibomba móvil is now part of their portfolio (with over 100 already sold), offering many local farmers without access to electricity the ability to irrigate their land.
ENERGY BOOK PRESS.indb 10 02/09/2014 14:54:54
Energy Part I chapter 1 – Introduction
– 11 –
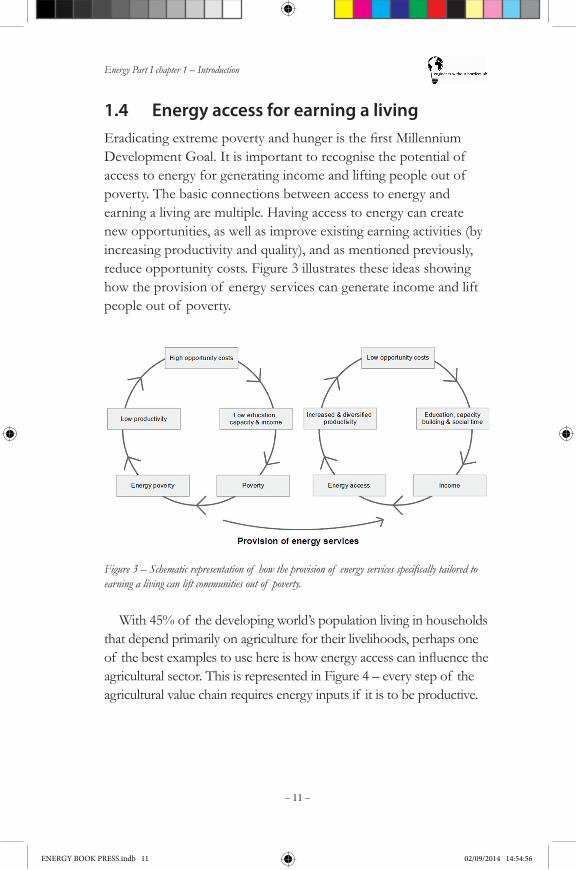
1.4 Energy access for earning a livingEradicatingextremepovertyandhungeristhefirstMillenniumDevelopment Goal. It is important to recognise the potential of access to energy for generating income and lifting people out of poverty. The basic connections between access to energy and earning a living are multiple. Having access to energy can create new opportunities, as well as improve existing earning activities (by increasing productivity and quality), and as mentioned previously, reduce opportunity costs. Figure 3 illustrates these ideas showing how the provision of energy services can generate income and lift people out of poverty.
Figure 3 – Schematic representation of how the provision of energy services specifically tailored to earning a living can lift communities out of poverty.
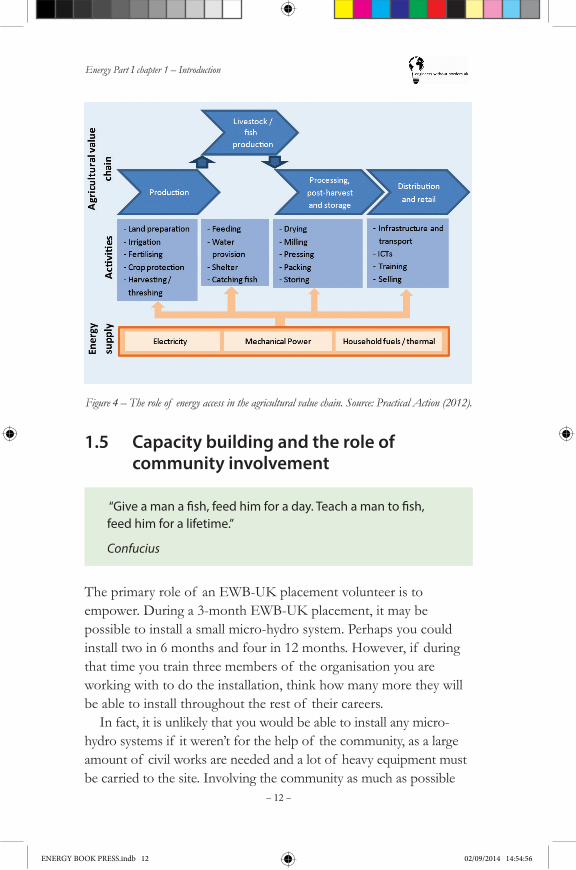
With 45% of the developing world’s population living in households that depend primarily on agriculture for their livelihoods, perhaps one of thebestexamplestousehereishowenergyaccesscaninfluencetheagricultural sector. This is represented in Figure 4 – every step of the agricultural value chain requires energy inputs if it is to be productive.
ENERGY BOOK PRESS.indb 11 02/09/2014 14:54:56
Energy Part I chapter 1 – Introduction
– 12 –
Figure 4 – The role of energy access in the agricultural value chain. Source: Practical Action (2012).
1.5 Capacity building and the role of community involvement
“Give a man a fish, feed him for a day. Teach a man to fish, feed him for a lifetime.”
Confucius
The primary role of an EWB-UK placement volunteer is to empower. During a 3-month EWB-UK placement, it may be possible to install a small micro-hydro system. Perhaps you could install two in 6 months and four in 12 months. However, if during that time you train three members of the organisation you are working with to do the installation, think how many more they will be able to install throughout the rest of their careers.
In fact, it is unlikely that you would be able to install any micro-hydro systems if it weren’t for the help of the community, as a large amount of civil works are needed and a lot of heavy equipment must be carried to the site. Involving the community as much as possible
ENERGY BOOK PRESS.indb 12 02/09/2014 14:54:56

Energy Part I chapter 1 – Introduction
– 13 –
•The majority of communities without electricity are in remote regionsandasaresult,sendinganengineertheretofixthesystemevery time it breaks is impractical. A far better solution is to train community members to operate and maintain their own energy system.
•Participation in installation of the technology by the community is a direct way of transferring knowledge to those who will be operating and maintaining the system. It can often reduce the cost of the system as the labour is essentially free and allows communities that may not necessarily be able to afford to contributemuchfinanciallytogivewhattheycanintheformof ‘sweat equity’. This ensures that the community has something invested in the new technology and the resulting increase in sense of ownership greatly raises the likelihood of the scheme succeeding in the long-term. If possible, those who will be operating and maintaining the system should also be given the opportunity to manufacture the technology themselves, or at least participate in itsmanufactureinsomeway,tofurtherenhancethebenefitslistedabove,butspecificallytofurtherknowledgetransfer.
•End-usersmustbeawareof thepossiblebenefitsof thetechnologyin order to be able to take full advantage of the new energy system. To expect a community that has had little to no experience with electricity before to suddenly become aware of the huge range of available electrical appliances without any assistance is unrealistic. It is also important for them to be aware of the limitations of the system, for example plugging a toaster into a solar home system will surely result in more than just burnt toast! Case study 2 highlights the importance of knowing what a technology can offer.
from the initial consultation to the installation and beyond makes sense on many levels:
ENERGY BOOK PRESS.indb 13 02/09/2014 14:54:57
Energy Part I chapter 1 – Introduction
– 14 –
Case study 2: Ujaalo
Sam Williamson, Nepal, 2011
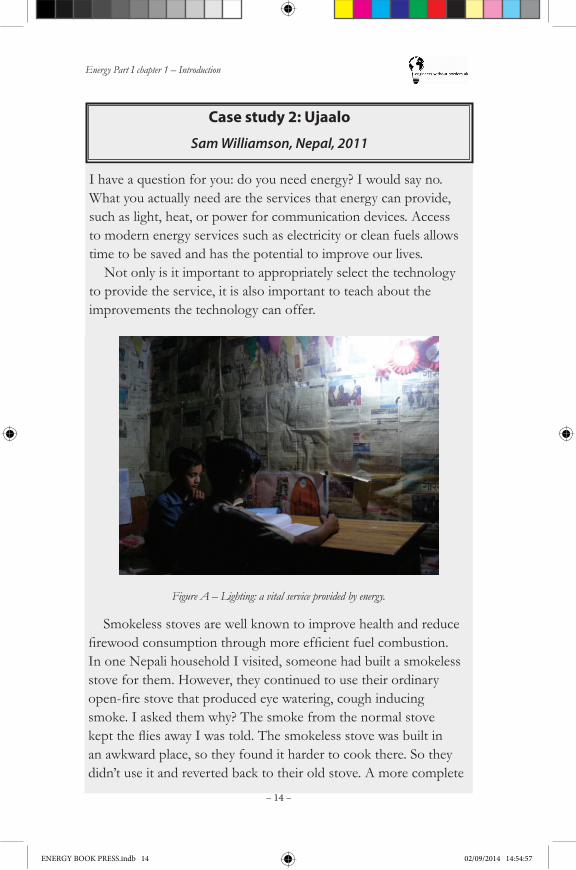
I have a question for you: do you need energy? I would say no. What you actually need are the services that energy can provide, such as light, heat, or power for communication devices. Access to modern energy services such as electricity or clean fuels allows time to be saved and has the potential to improve our lives.
Not only is it important to appropriately select the technology to provide the service, it is also important to teach about the improvements the technology can offer.
Smokeless stoves are well known to improve health and reduce firewoodconsumptionthroughmoreefficientfuelcombustion.In one Nepali household I visited, someone had built a smokeless stove for them. However, they continued to use their ordinary open-firestovethatproducedeyewatering,coughinducingsmoke. I asked them why? The smoke from the normal stove keptthefliesawayIwastold.Thesmokelessstovewasbuiltinan awkward place, so they found it harder to cook there. So they didn’t use it and reverted back to their old stove. A more complete
Figure A – Lighting: a vital service provided by energy.
ENERGY BOOK PRESS.indb 14 02/09/2014 14:54:57

Energy Part I chapter 1 – Introduction
– 15 –
understanding of what the stove could offer the family, such as improved air quality in their home and using less wood, as well as discussing its location and convenience would have made sure that this technology – and money – was not wasted.
Being able to understand the different services that a technology could provide and matching them to the needs of the community is vital in ensuring the technology you install has a positive impact on people’s lives. A school in Bhanbhane, western Nepal, used the electricity from a pico-hydro plant to power a PA system so they could talk to all the classes at the same time, making administration and school assemblies much easier. With the introduction of micro-hydro and the extensive mobile network that has built up in Nepal, people have started cybers – internet cafés – where they can talk to people all over the world from their village, able to pass on ideas, knowledge, news and talk with family working abroad.
I visited a village in an eastern district of Nepal just before a micro-hydro project was installed, then returned a year later to see what the changes had been. I asked an old lady what improvements she thought there had been since the micro-hydro was installed. She thought for a bit and then looked at me with a smile and said one word, ujaalo, brightness. That brightness gave her security, comfort and time.
About the author: Sam took a year-long sabbatical from his work in an engineering consultancy to volunteer in Nepal, where he worked in a small energy NGO which introduced him to community pico-hydropower. He now researches pico-hydro systems with EWB-UK support.
About the organisation: The University of Bristol, supported by Renishaw and EPSRC, has been carrying out research into low-head pico-hydro systems since 2009.
Figure B – PA system in a school in Bhanbhane, Nepal.
ENERGY BOOK PRESS.indb 15 02/09/2014 14:54:57
Energy Part I chapter 1 – Introduction
– 16 –
1.6 Thinking holisticallyEWB-UK takes a holistic approach to engineering. This requires systems level thinking, i.e. considering the impact of a particular solution not just technically, but socially, economically, environmentally and politically. There is no way to provide an exhaustive list of all of the different aspects that one must consider, asthesearespecifictotheparticularprojectandthecontextinwhich it is undertaken. Some general considerations may be the costs incurred in achieving universal energy access, the potential effects on the local and global environment (including air pollution and climate change), and the impact on jobs.
In the concerted effort to achieve universal energy access by 2030, one must consider what the impact of this could be on world resources and climate change. With dwindling reserves of fossil fuels and increasing levels of climate change, one may worry about the potential effects that bringing 3–4 billion people out of energy poverty may have. However, studies have shown that if universal access to the most basic energy services outlined in the TEA was to be achieved purely through fossil-fuel based technologies, an increase of 1.6% in global CO2 emissions would result. This striking figureisaratherstarkstatementof whereclimatechangemitigationshould take place (i.e. in the developed world), and that climate changeconsiderationsshouldnotbethefirstconcerninachievingbasic universal energy access.
In terms of economics, it has been estimated by the IEA and the UN Advisory Group on Energy and Climate Change (AGECC) that to achieve universal energy access would require a global investment of $48 billion/year. To give an idea of scale, the UK alone spends approximately $60 billion/year on its defence budget. The US, $680 billion/year! More relevantly, from 2007 to 2010, global subsidies for fossil fuels were over $300 billion/year (The Guardian, 2012). Only a fraction of that would need to be used towards the goal of universal energy access.
Nevertheless, renewable energy technologies are inherently suited to development, as energy resources such as the sun and wind are naturally distributed – if all renewable energy resources
ENERGY BOOK PRESS.indb 16 02/09/2014 14:54:57
Energy Part I chapter 1 – Introduction
– 17 –
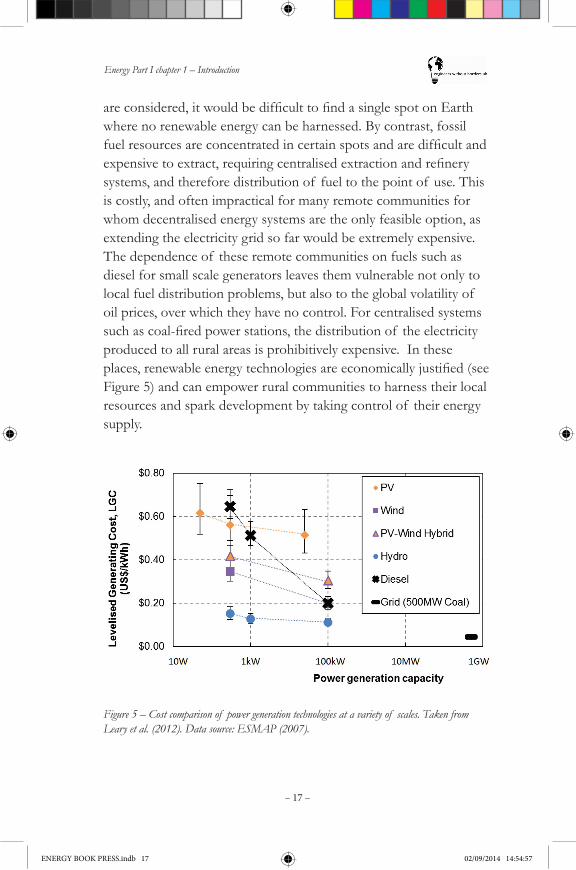
areconsidered,itwouldbedifficulttofindasinglespotonEarthwhere no renewable energy can be harnessed. By contrast, fossil fuelresourcesareconcentratedincertainspotsandaredifficultandexpensivetoextract,requiringcentralisedextractionandrefinerysystems, and therefore distribution of fuel to the point of use. This is costly, and often impractical for many remote communities for whom decentralised energy systems are the only feasible option, as extending the electricity grid so far would be extremely expensive. The dependence of these remote communities on fuels such as diesel for small scale generators leaves them vulnerable not only to local fuel distribution problems, but also to the global volatility of oil prices, over which they have no control. For centralised systems suchascoal-firedpowerstations,thedistributionof theelectricityproduced to all rural areas is prohibitively expensive. In these places,renewableenergytechnologiesareeconomicallyjustified(seeFigure 5) and can empower rural communities to harness their local resources and spark development by taking control of their energy supply.
Figure 5 – Cost comparison of power generation technologies at a variety of scales. Taken from Leary et al. (2012). Data source: ESMAP (2007).
ENERGY BOOK PRESS.indb 17 02/09/2014 14:54:57
Energy Part I chapter 1 – Introduction
– 18 –
Unfortunately a number of barriers stand in the way of the widespread dissemination of renewable technologies, which must be addressed by any EWB-UK placement volunteer hoping to introduce them. They include: •The initial purchase costs of renewable power systems are often
many times higher than that of a diesel equivalent. Although the ongoing fuel costs often raise the life cycle costs well above a renewable system, the fact that these do not have to be paid upfront can make diesel generators much more attractive in the short-term. However, it is a false economy as this simply traps people in poverty by draining their income each month with high fuelprices.Accesstocapitalthroughmicro-financingorsimilarschemes can allow communities to pay back the high upfront costs of renewable technologies over time (see Part I, section 1.8: Accesstofinance,withmonthlypaymentsequaltoorlessthanthey were paying for diesel, kerosene, batteries and/or candles.
•Supply chains for conventional fuels and the associated equipment and spare parts are already in place, but must be created for any newly introduced renewable technologies.
•Assessing the resource is often complex and costly and always involves an element of risk. The daily, seasonal and inter-annual variation in the resource must also be taken into account when planninganyspecificapplicationsfortheenergyproducedbythesystem.
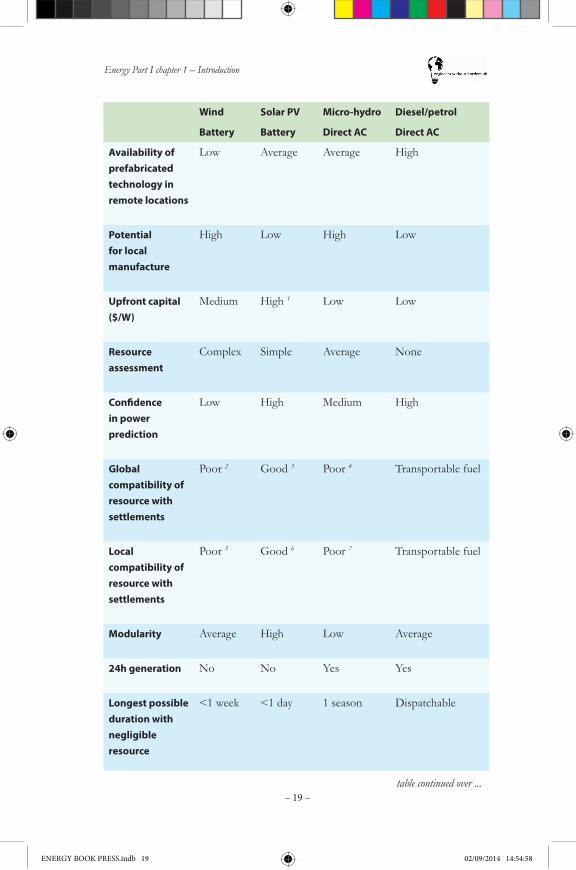
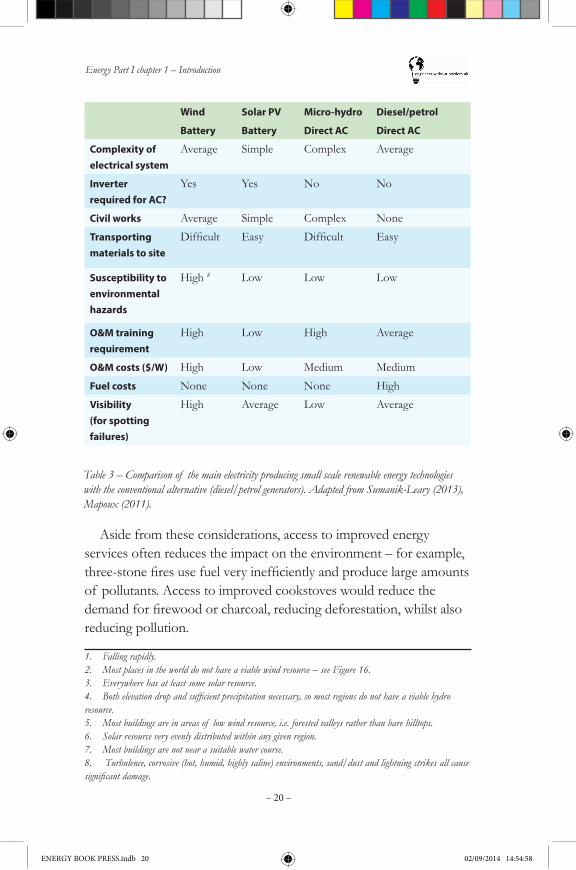
•Using the example of electric power production, Table 3 shows thateachrenewableenergytechnologyhasspecificadvantagesand disadvantages. Each local context is different and as a result, decidingwhichtechnologyismostappropriateforeachspecificproject is quite a challenge in itself.
ENERGY BOOK PRESS.indb 18 02/09/2014 14:54:58
Energy Part I chapter 1 – Introduction
– 19 –
Wind Solar PV Micro-hydro Diesel/petrol
Battery Battery Direct AC Direct AC
Availability of prefabricated technology in remote locations
Low Average Average High
Potential for local manufacture
High Low High Low
Upfront capital ($/W)
Medium High 1 Low Low
Resource assessment
Complex Simple Average None
Confidence in power prediction
Low High Medium High
Global compatibility of resource with settlements
Poor 2 Good 3 Poor 4 Transportable fuel
Local compatibility of resource with settlements
Poor 5 Good 6 Poor 7 Transportable fuel
Modularity Average High Low Average
24h generation No No Yes Yes
Longest possible duration with negligible resource
<1 week <1 day 1 season Dispatchable
table continued over ...
ENERGY BOOK PRESS.indb 19 02/09/2014 14:54:58
Energy Part I chapter 1 – Introduction
– 20 –
Wind Solar PV Micro-hydro Diesel/petrol
Battery Battery Direct AC Direct AC
Complexity of electrical system
Average Simple Complex Average
Inverter required for AC?
Yes Yes No No
Civil works Average Simple Complex NoneTransporting materials to site
Difficult Easy Difficult Easy
Susceptibility to environmental hazards
High 8 Low Low Low
O&M training requirement
High Low High Average
O&M costs ($/W) High Low Medium MediumFuel costs None None None HighVisibility (for spotting failures)
High Average Low Average
Table 3 – Comparison of the main electricity producing small scale renewable energy technologies with the conventional alternative (diesel/petrol generators). Adapted from Sumanik-Leary (2013), Mapoux (2011).
1. Falling rapidly.2. Most places in the world do not have a viable wind resource – see Figure 16.3. Everywhere has at least some solar resource.4. Both elevation drop and sufficient precipitation necessary, so most regions do not have a viable hydro resource.5. Most buildings are in areas of low wind resource, i.e. forested valleys rather than bare hilltops.6. Solar resource very evenly distributed within any given region.7. Most buildings are not near a suitable water course.8. Turbulence, corrosive (hot, humid, highly saline) environments, sand/dust and lightning strikes all cause significant damage.
Aside from these considerations, access to improved energy services often reduces the impact on the environment – for example, three-stonefiresusefuelveryinefficientlyandproducelargeamountsof pollutants. Access to improved cookstoves would reduce the demandforfirewoodorcharcoal,reducingdeforestation,whilstalsoreducing pollution.
ENERGY BOOK PRESS.indb 20 02/09/2014 14:54:58
Energy Part I chapter 1 – Introduction
– 21 –
Energy services Example energy transitions
Earning opportunities (in fuel, equipment, and/or appliance provision)
Earning risks/transitions
Lighting Candles/kerosene to electric lighting
Marketing and sale of solar lanterns and grid-based systems. Maintenance of electric lighting systems
Reduced revenues for kerosene and candle suppliers
Cooking and water heating
3-stone wood to improved cookstove and ventilation (e.g. smoke hoods)
Manufacture and sale of improved stoves and smoke hoods
Moderately reduced demand for wood fuel/ charcoal suppliers
Switch to a biofuelled cookstove or LPG cookstove
Manufacture and sale of stoves and fuel
Reduced demand for wood fuel/charcoal (see household fuels below)
Heating Insulation of houses Installation of building insulation
Reduced demand for heating fuel
Use of purpose made or multi-purpose heating stoves
New stove production and supply chains
Reduced demand for fuel
Cooling Installation of ceiling fans
Distribution and marketing of ceiling fans
None
Use of refrigerators Distribution and marketing of refrigerators
None
ICTs Increased access to mobile phones
Earning in mobile phones sector, top-up card sales, system maintenance, charging
Reduced need for courier and postal services
Increased access to the internet
Running internet cafés, producing local content for internet
Reduced need for postal services
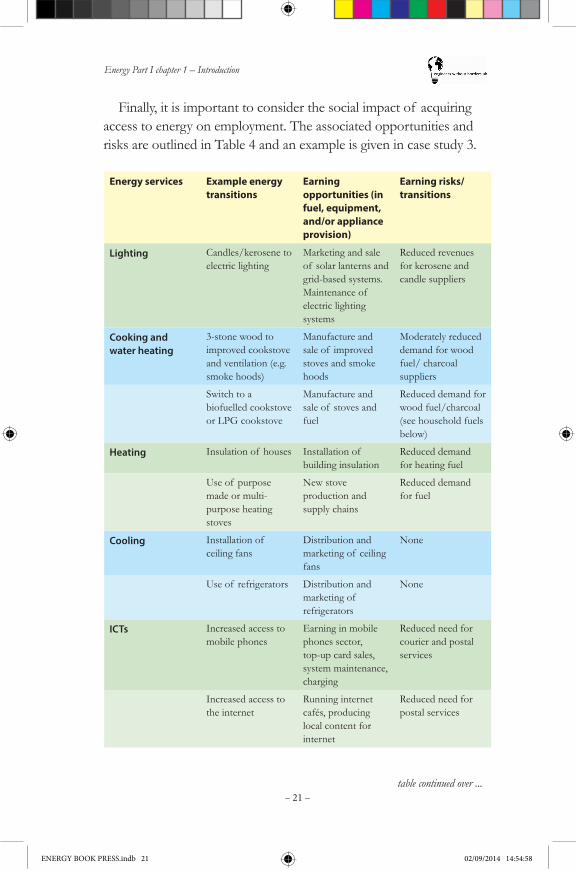
Finally, it is important to consider the social impact of acquiring access to energy on employment. The associated opportunities and risks are outlined in Table 4 and an example is given in case study 3.
table continued over ...
ENERGY BOOK PRESS.indb 21 02/09/2014 14:54:58
Energy Part I chapter 1 – Introduction
– 22 –
Energy
Electricity No electricity to household supply e.g. solar home system
Marketing, sales, financingandinstallation of SHS, maintenance
Reduced demand for kerosene for lighting and battery charging
No electricity to mini-grid supply (e.g. hydropower or biomassfired)
Installation of system, operation and management of system, tariff collection and accounting
Reduced demand for SHS, kerosene and battery charging
No electricity to grid-based supply
Growth in jobs for utility locally
As above
Household fuels Switch from wood fuel/ charcoal to biofuel (e.g. ethanol)
In agricultural production of biofuel; Manufacture and sale of stoves; Participation in new fuel supply chain
Reduced demand for wood fuel/charcoal and for mud/clay improved stoves
Switch from wood fuel/ charcoal to LPG
Expanding LPG distribution system
As above
Mechanical power Create availability of community mechanical services (e.g. milling with multi-functional platform)
In running the MFP/mill services; In supplying fuel to MFP/mill
Reduced manual labour required in grindingflourbyhand (if paid)
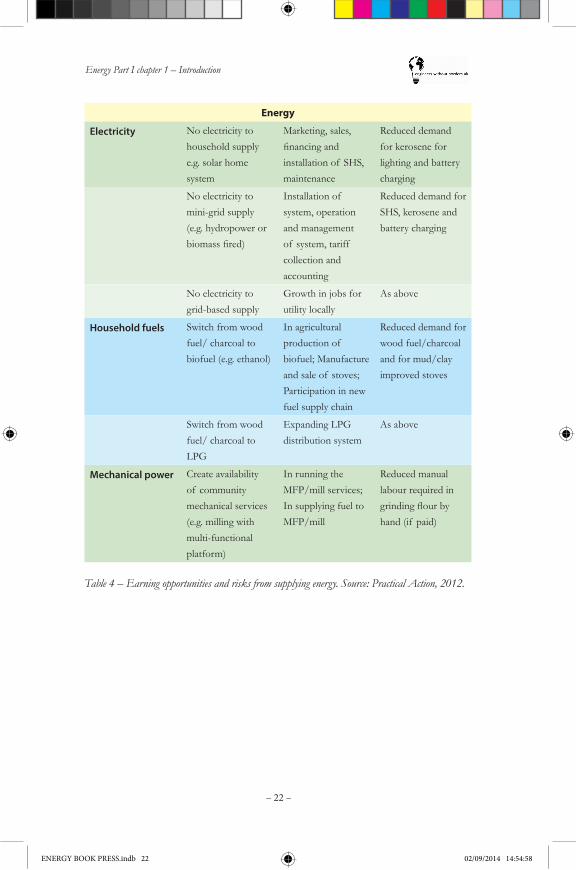
Table 4 – Earning opportunities and risks from supplying energy. Source: Practical Action, 2012.
ENERGY BOOK PRESS.indb 22 02/09/2014 14:54:58
Energy Part I chapter 1 – Introduction
– 23 –
Case study 3: Drying in humid climates
Lincoln Smith, Karnataka, South India, 2010
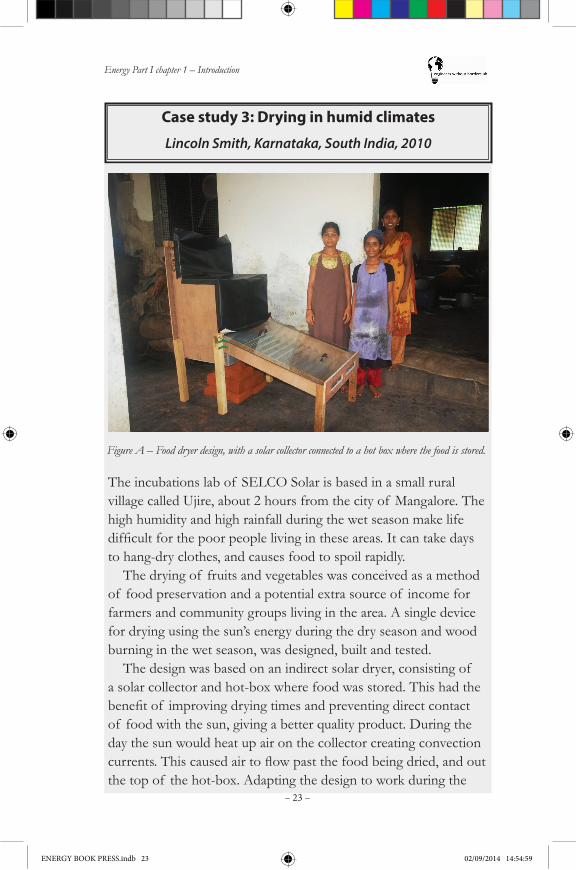
The incubations lab of SELCO Solar is based in a small rural village called Ujire, about 2 hours from the city of Mangalore. The high humidity and high rainfall during the wet season make life difficultforthepoorpeoplelivingintheseareas.Itcantakedaysto hang-dry clothes, and causes food to spoil rapidly.
The drying of fruits and vegetables was conceived as a method of food preservation and a potential extra source of income for farmers and community groups living in the area. A single device for drying using the sun’s energy during the dry season and wood burning in the wet season, was designed, built and tested.
The design was based on an indirect solar dryer, consisting of a solar collector and hot-box where food was stored. This had the benefitof improvingdryingtimesandpreventingdirectcontactof food with the sun, giving a better quality product. During the day the sun would heat up air on the collector creating convection currents.Thiscausedairtoflowpastthefoodbeingdried,andoutthe top of the hot-box. Adapting the design to work during the
Figure A – Food dryer design, with a solar collector connected to a hot box where the food is stored.
ENERGY BOOK PRESS.indb 23 02/09/2014 14:54:59
Energy Part I chapter 1 – Introduction
– 24 –
monsoon season simply required facilitating heat transfer between a heat source such as the burning wood, and the hot-box itself.
ChallengesTechnical design challenges faced included: •maximising heat transfer between the burning biomass and the
drying box
•achievingefficientcombustionwhilstmaintainingoptimumtemperature control in the drying box
•sealing the drying box to prevent smoke and insect ingress.
Upon consultation with farmers it was discovered that despite being a desirable product, dried fruits were not eaten by the local population. The only way to create a sustainable enterprise would be to package and sell them to richer urban populations; however this would have entailed additional costs of distribution and marketing.
Lessons learnedAlthough the solar drying aspect of the design worked successfully, further work was needed to reduce production costs through appropriate material selection. Drying fruits with biomass is not very desirable or workable in most situations as many communities are already biomass poor, and what they do have is required for cooking. Upon returning to the UK, I came across a company called Tropical Wholefoods Ltd. This company purchased dried fruit from fair trade sellers in Uganda, who sun-dry vegetables in direct type solar dryers. In this case, drying fruit with biomass was shown to be an unsustainable venture, however this highlights theimportanceof findingandanalysingcasestudiesof similarschemes before pursuing a particular solution.
For future projects it is important to take a systems level approach to design, taking into account the market for the product produced by the machine as well as the mechanics of the productionprocess.Inparticular,thelocalcontextandfinancialsituation need to be taken into account when conceiving new ideas and projects.
ENERGY BOOK PRESS.indb 24 02/09/2014 14:54:59

Energy Part I chapter 1 – Introduction
– 25 –
About the author: Lincoln spent 11 weeks in Southern India in 2010 working on the redevelopment of a solar and biomass dryer. He was offered the placement between his second and third years at Birmingham University. He later took up other roles within EWB-UK, including training co-ordinator. You can read about his placement experience on his blog at: lincoln-selcoindia.blogspot.co.uk
About the organisation: SELCO is a social enterprise which provides sustainable energy solutions to under-served households and businesses. The Incubations lab was set up to develop new products based on end-user needs, and bring them to market. The lab is based near the Hindu pilgrim town of Dharmastala. With over 10,000 visitors per day, it is the perfect place to conduct market research with people from across India.
ENERGY BOOK PRESS.indb 25 02/09/2014 14:54:59
Energy Part I chapter 1 – Introduction
– 26 –
1.7 Reaching scaleWith 3–4 billion people suffering from energy poverty globally, the scale of the problem is enormous and rather daunting. Achieving universal energy access by 2030 is only possible if the successful solutions can be adopted beyond the communities in which they are piloted. Unfortunately a considerable number of barriers arise when attempting to provide universal energy access. These are mostly due to the inadequacy of the market structure responsible for developing and implementing energy technologies in less developed countries.Lackof accesstofinance,governmentcorruption,poorinstitutional frameworks, lack of domestic technical skills and the reluctance of private sector involvement on the basis of poor financialreturnsandguaranteesarejustafewof therecurrentbarriers to universal energy access.
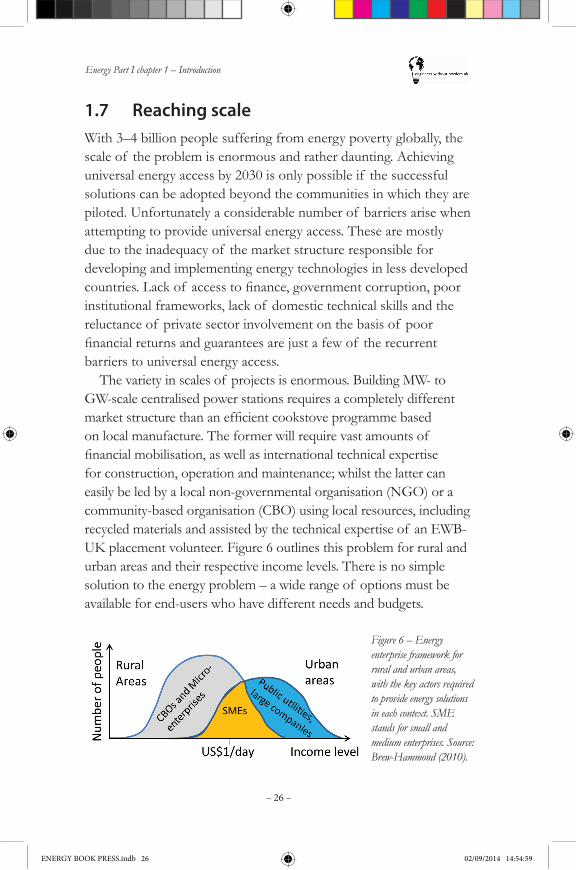
The variety in scales of projects is enormous. Building MW- to GW-scale centralised power stations requires a completely different marketstructurethananefficientcookstoveprogrammebasedon local manufacture. The former will require vast amounts of financialmobilisation,aswellasinternationaltechnicalexpertisefor construction, operation and maintenance; whilst the latter can easily be led by a local non-governmental organisation (NGO) or a community-based organisation (CBO) using local resources, including recycled materials and assisted by the technical expertise of an EWB-UK placement volunteer. Figure 6 outlines this problem for rural and urban areas and their respective income levels. There is no simple solution to the energy problem – a wide range of options must be available for end-users who have different needs and budgets.
Figure 6 – Energy enterprise framework for rural and urban areas, with the key actors required to provide energy solutions in each context. SME stands for small and medium enterprises. Source: Brew-Hammond (2010).
ENERGY BOOK PRESS.indb 26 02/09/2014 14:54:59
Energy Part I chapter 1 – Introduction
– 27 –
The range of scales and types of energy services required mean that a wide variety of energy resources and technologies with which to convert them into useful energy are needed. Implementing each of thesetechnologiesrequiresspecifictechnicalexpertiseandfinancialmobilisation,aswellaspolicyframeworksprovidingthenecessary incentives. This results in a need for a large variety of actors to be involved in the energy market.
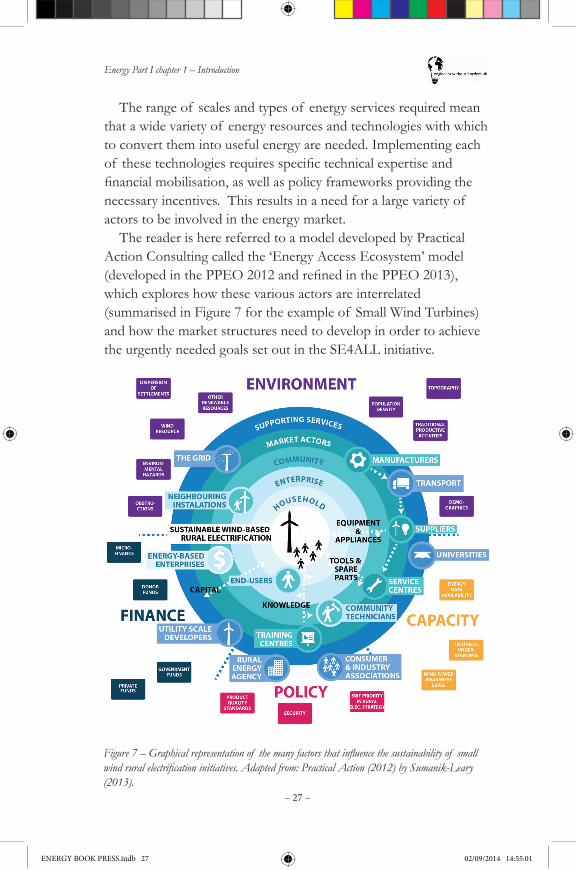
The reader is here referred to a model developed by Practical Action Consulting called the ‘Energy Access Ecosystem’ model (developedinthePPEO2012andrefinedinthePPEO2013),which explores how these various actors are interrelated (summarised in Figure 7 for the example of Small Wind Turbines) and how the market structures need to develop in order to achieve the urgently needed goals set out in the SE4ALL initiative.
Figure 7 – Graphical representation of the many factors that influence the sustainability of small wind rural electrification initiatives. Adapted from: Practical Action (2012) by Sumanik-Leary (2013).
ENERGY BOOK PRESS.indb 27 02/09/2014 14:55:01
Energy Part I chapter 1 – Introduction
– 28 –
1.8 Access to financeTheeconomicsandfinancingof anenergysupplysystemareof great importance to the initial and long-term success of a project. The following information is a very basic introduction to current financingmodels.Thissectorisrapidlychangingatthemomentwith many new (both appropriate and less-appropriate) options appearing. It is neither exhaustive nor very detailed. Please consult the references and experts for more information.
There are two main costs for an energy supply system:
1. Capital (upfront costs)
◊ Buying the physical energy conversion equipment (e.g. diesel generator, cables, power house).
◊ Civil works (such as water diversion for hydro systems).
◊ Other initial costs, such as resource assessment, system design, transporting equipment to the site and installation.
2. Operation and Maintenance (ongoing costs)
◊ Fuel (if required).
◊ Wages for an operator (if required).
◊ Replacement parts/repairs.
In order to cover these costs a successful project must carefully considerlong-termfinancing.Thismeansaskingquestionssuchas:◊ Dotheend-usershavesufficientincometocovertheongoing
costs?
◊ How much are they willing to they pay for the ongoing costs?
◊ Who will collect payment?
1.8.1 Funding types
There are three main types of funding:
1. Grants and subsidies.
2. Tariffs.
3. Savings and credit.
ENERGY BOOK PRESS.indb 28 02/09/2014 14:55:01

Energy Part I chapter 1 – Introduction
– 29 –
1.8.1.1 Grants and subsidies
Grants for the capital costs of a project and subsidies on fuel or electricity tariffs have been traditionally used for development projects. Grants generally come from governments, larger aid agencies and development funds (e.g. United States Agency for International Development (USAID) and the United Nations Development Programme (UNDP)), although the recent development of crowd-source funding platforms allow individuals toclubtogethertofundspecificprojects.
A grant will often cover the full capital cost of an energy infrastructure project, although the funding may only be available in stages, subject to the successful completion of previous stages. A full grant will usually be aimed at the poorest people, who have no additional income to pay for or invest in energy services.
Subsidies on initial purchase costs can also help low-income groups gain access to energy services, however they are usually more short-lived and linked to political objectives. They can also undermine the ability of the private sector to provide such services on the free market, limiting consumer choice and preventing the development of local industry. The best subsidies are carefully targetedtoremoveaspecificbarrier,e.g.subsidisedtrainingforoperation and maintenance.
Research grants can help to develop a particular technology or service and build local capacity for manufacture and innovation.
However, there are a number of issues with grants and subsidies:•Lack of ownership or ‘buy-in’ to the system by the users/
community. Hence there is no economic incentive to operate and maintain equipment.
•No long-term money for operation and maintenance, hence additionalfinancemayberequired.
•No incentive to be conservative with the energy service, which can lead to corruption.
•Generally guided by political goals (e.g. ticking boxes to say that a certainpercentageof thepopulationis‘electrified’).
ENERGY BOOK PRESS.indb 29 02/09/2014 14:55:02
Energy Part I chapter 1 – Introduction
– 30 –
1.8.1.2 Tariffs
In the tariff model, the consumer pays for the energy service by making monthly payments (or equivalent). The upfront capital is providedbyabusiness,whichhopestogenerateaprofitafteranumber of years through the tariff collected from the users. Tariffs must be carefully set to encourage income generating activities (which often consume more energy than domestic applications), whilstatthesametimeencouragingtheefficientuseof energy.
According to the World Bank (2012), only 41% of the adult population within developing economies have a bank account, which limits the options for the payment of the tariff. However, innovative banking solutions, such as the M-Pesa system in Kenya thatallowsuserstoaccessfinancialservicesthroughtheirmobilephone, are working around this problem. As the technology to record and pay for energy use improves, many innovative models are beginning to appear, including leasing, pay-as-you-go and pre-pay models. With these models the users pays off a certain amount of the capital every time the system is used. When the initial capital costs have been paid off (and the investors have made a return on their investment), the equipment is owned outright by the user (see case study 4).
ENERGY BOOK PRESS.indb 30 02/09/2014 14:55:02
Energy Part I chapter 1 – Introduction
– 31 –
Case study 4: Pay-as-you-go solar lighting in Rwanda
Chris Emmott, Rwanda, 2012
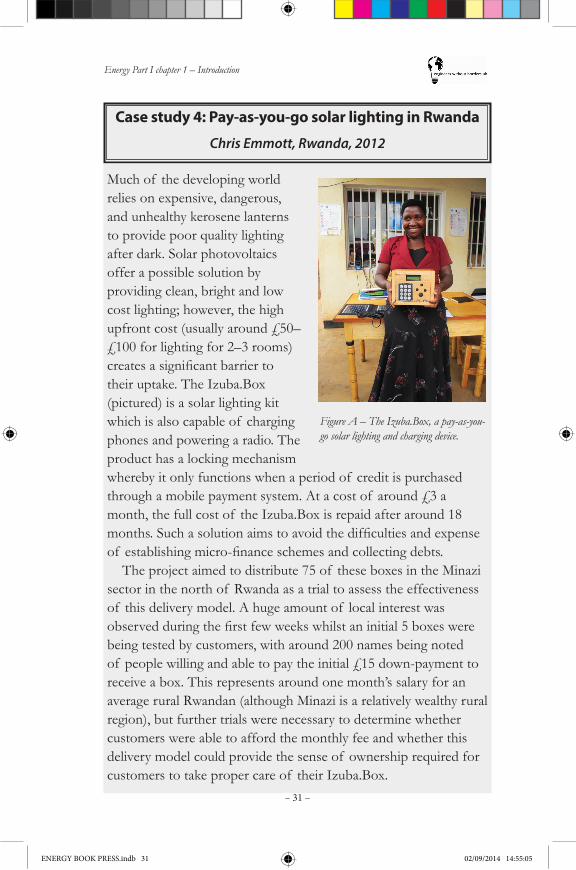
Much of the developing world relies on expensive, dangerous, and unhealthy kerosene lanterns to provide poor quality lighting after dark. Solar photovoltaics offer a possible solution by providing clean, bright and low cost lighting; however, the high upfront cost (usually around £50–£100 for lighting for 2–3 rooms) createsasignificantbarriertotheir uptake. The Izuba.Box (pictured) is a solar lighting kit which is also capable of charging phones and powering a radio. The product has a locking mechanism whereby it only functions when a period of credit is purchased through a mobile payment system. At a cost of around £3 a month, the full cost of the Izuba.Box is repaid after around 18 months.Suchasolutionaimstoavoidthedifficultiesandexpenseof establishingmicro-financeschemesandcollectingdebts.
The project aimed to distribute 75 of these boxes in the Minazi sector in the north of Rwanda as a trial to assess the effectiveness of this delivery model. A huge amount of local interest was observedduringthefirstfewweekswhilstaninitial5boxeswerebeing tested by customers, with around 200 names being noted of people willing and able to pay the initial £15 down-payment to receive a box. This represents around one month’s salary for an average rural Rwandan (although Minazi is a relatively wealthy rural region), but further trials were necessary to determine whether customers were able to afford the monthly fee and whether this delivery model could provide the sense of ownership required for customers to take proper care of their Izuba.Box.
Figure A – The Izuba.Box, a pay-as-you-go solar lighting and charging device.
ENERGY BOOK PRESS.indb 31 02/09/2014 14:55:05
Energy Part I chapter 1 – Introduction
– 32 –
Whentheproductfinallylaunched,uptakewasfarlowerthanexpected – high interest in the new product didn’t necessarily mean everyone wanted to buy one. Instead, it was found that it simply showed that, as in many rural communities, the actions of any foreigner in the village would be of great interest. The whole community wanted to put their name down for the chance to receive a box in order to avoid feeling left out of the excitement, and ensure that they did not miss out on something purely because they did not show enough interest. However, wariness of new technology and the high down-payment being asked ensured the vast majority of people did not take up the offer of the Izuba.Box. Although the pay-as-you-go model aimed to emulate the small regular payments of current expenditure on kerosene, the high down-payment (despite being much lower than required to purchase a conventional solar lighting kit) was not in-line with what people usual spent on energy services.
As a result of this initial excitement, advertising for the product was limited to only the immediate area surrounding the village, in order to ensure that not too many people were disappointed by not being able to buy an Izuba.Box. It had been envisioned that all 75 boxes would be distributed at a product launch event, however, at this event only around 30 people were present who could actually afford the product and were willing to pay, with a further dozen purchasing Izuba.Boxes over the following few days. Distribution was thus much slower than expected, greatly affecting the success of the trial, at least in gathering initial results. This experience showed that determining what is affordable for a community is muchmoredifficultthansimplyaskingthequestion.About the author: Chris Emmott is a PhD student at Imperial College London, studying the potential impacts that emerging solar energy technologies may have on reducing greenhouse gas emissions. He travelled to Rwanda in August 2012 to commence thetrialof thefirstIzuba.Boxprototypes.About the organisation: e.quinox is an open-source, humanitarian, student organisation based within Imperial College London. It aims to develop cost-effective, sustainable and scalable delivery models for providing renewable energy to developing countries.
ENERGY BOOK PRESS.indb 32 02/09/2014 14:55:05
Energy Part I chapter 1 – Introduction
– 33 –
1.8.1.3 Savings and credit
One problem with conventional banking is that, to reduce risk, banks need to be sure of collateral before providing a loan (e.g. the house, when a mortgage is taken out). The world’s poorest do not have any collateral and hence cannot start to invest in energy services which might help them out of poverty.Theterm‘microcredit’coversawiderangeof financialservices,
but the general concept is that small loans are given to people without any collateral. The small size of the loan means that the bank does not take a large risk, but repayments are expected. Generally, microcredit services should be offered locally in low income areas, wherethefinancialservicesofferedareappropriatetolocalconditions(e.g. repayments are affordable for most of the population).
An interesting and successful example of this is the Grameen Bank in India. They removed the need for collateral and rely upon mutualtrustandaccountability.Theybringfinancialserviceswithinthe reach of the poorest people by providing very small loans, without collateral. These loans can be used for services which help increase income and hence facilitate repayment of the loan. For example, the ‘pay-for-use’ mobile phone involves one person (the entrepreneur) investing in a mobile phone using a microcredit loan. Phone calls (the use of the phone) are then sold to other people in the local area (the customers) to raise income to pay back the loan, as well as generating an income for the phone owner (the entrepreneur). The Grameen Bank mainly supplies microcredit to women (97% of the borrowers are women) and they have a 96% loan recovery rate.
In fact, there are many initiatives and schemes in operation across the world, however, some are more replicable than others. For example, in India, even poor families often have gold jewellery of some kind, which was used as collateral against loans to good effect. However, this does not translate directly to many other parts of theworld.Incontrast,thegroupmicro-financemodelhasbeensuccessfullyemployedinanumberof differentcontexts:thefirstmember of a small group (4 to 8 people, usually women) is given a loan, but the next group member does not receive their loan untilthefirstrecipienthasrepaidall(orasignificantproportion)
ENERGY BOOK PRESS.indb 33 02/09/2014 14:55:05
Energy Part I chapter 1 – Introduction
– 34 –
of their individual debt. The third group member is dependent on repayment by the second, and so on. In short, peer pressure is used as the formal collateral, as a single person is responsible for the group’s credit (even though it has been reported that the money is often shared within the group throughout the process).Formoreinformationonaccesstofinance,pleaseseethe
dedicated section in chapter 4: Further reading.
1.9 How to use this book – the energy systems design process1.9.1 Introducing energy pathways
This introduction has given an overview of the range of services needed by end-users, which can be provided only if they have access to energy. However, there are a wide range of services required and a multitude of ways in which to provide them. Furthermore, every local context is different, for example: •In some projects, vaccine refrigeration at the health centre may be
valued higher than electric light for the school (or vice versa).
•An electrical appliance that delivers the required energy service may already be available in a particular place, however electricity may not be available there yet.
•In some regions solar PV is already widely available, in others a new supply chain may have to be established to import it.
•Some places are windy, whilst others are sunny (and some are even both).
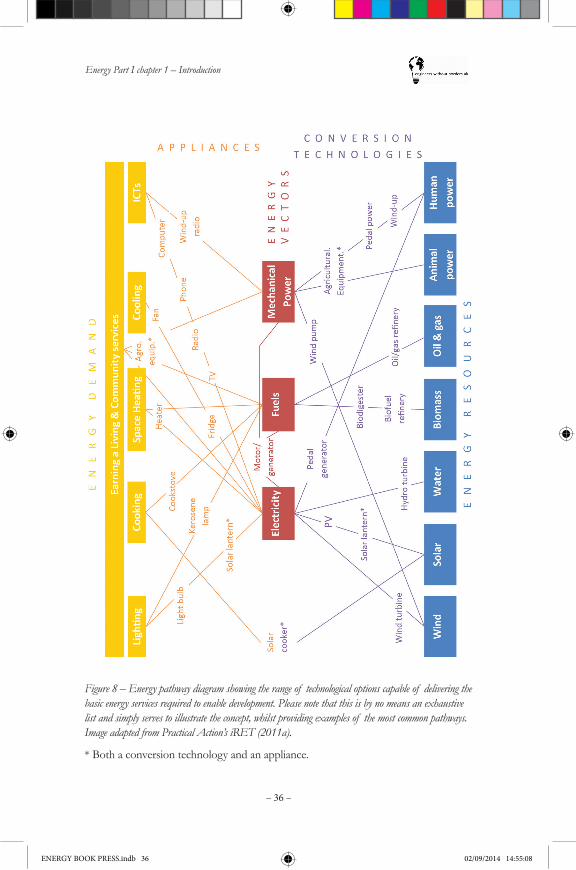
The incredible number of variables in each particular context makes it necessary to break down the problem into its component parts. These components can be reassembled in many different ways (illustrated by the many different lines connecting energy demand with energy resources in Figure 8) – designing an energy system involves selecting the most appropriate assemblage (pathway) for a particular situation.
This book takes a systems level approach to improving standards
ENERGY BOOK PRESS.indb 34 02/09/2014 14:55:05

Energy Part I chapter 1 – Introduction
– 35 –
of living with energy technologies. Figure 8 introduces the concept of energy pathways, which can guide the reader through the process of determining the energy services most relevant to the people they are working with (energy demand), the forms in which energy could be supplied to them (energy vectors) and the resources from which it could be generated (energy resources). Conversion technologies link energy resources to energy vectors by generating specifictypesof energy,forexamplephotovoltaicpanelstogenerate electricity from solar radiation or anaerobic digesters to generate biogas (a fuel) from organic waste. Appliances link energy vectorswithenergydemandbyutilisingspecificformsof energyto provide a given energy service, such as a light bulb creating light from electricity or a gas stove to cook food using biogas. In fact, some products encompass both conversion technologies and appliances, such as the solar lantern, which generates electricity from solar radiation and produces light from electricity.
ENERGY BOOK PRESS.indb 35 02/09/2014 14:55:05
Energy Part I chapter 1 – Introduction
– 36 –
Figure 8 – Energy pathway diagram showing the range of technological options capable of delivering the basic energy services required to enable development. Please note that this is by no means an exhaustive list and simply serves to illustrate the concept, whilst providing examples of the most common pathways. Image adapted from Practical Action’s iRET (2011a).
* Both a conversion technology and an appliance.
ENERGY BOOK PRESS.indb 36 02/09/2014 14:55:08
Energy Part I chapter 1 – Introduction
– 37 –
The components shown on Figure 8 act like stepping stones on the energy pathway from one side to the other. As a result, selecting the most appropriate energy pathway requires knowledge of each of the possible components. This chapter contains detailed information on the components with which EWB-UK has most experience. However, the Engineering in Development project is an ongoing process of acquiring knowledge from across the membership – as the organisation acquires experience with more of these components, information will be added to the next edition of this book. As a result, the reader is referred to the following sources, as they can provide information on the ‘missing links’:•Appropedia: Appropriate technology wiki with a comprehensive
energy section.
•Energypedia: Development focussed renewable energy wiki.
•Practical Action’s Development Bookshop: over 50 energy related books published by the well-respected Practical Action Publishing, e.g. A Handbook of Small-scale Energy Technologies, edited by Neil Noble, Practical Action Publishing, (2012)
•Practical Answers: free online resource provided by Practical Action that gives the basic facts on a range of technologies from solar PV to mud stoves in Kenya.
•Practical Action’s Interactive Renewable Energy Toolkit (iRET): freely available interactive multimedia renewable energy toolkit.
In fact, the energy pathway diagram (Figure 8) lists just a few of the many possible components and pathways between them, as it issimplynotpossibletoincludeallof thepossibleconfigurations.For example, it does not contain uranium or nuclear reactors as pathways for creating electricity. The components listed are those that the authors considered most relevant to the EWB-UK placement volunteer, however the reader is encouraged to use this methodology as a starting point and to add in other components that may be more viableintheirspecificlocalcontext(e.g.rivercurrentturbinesintheAmazon) or as new technological options become available (e.g. the Score stove developed at Nottingham University to burn fuel more efficientlyandproduceasmallamountof electricity).
ENERGY BOOK PRESS.indb 37 02/09/2014 14:55:08
Energy Part I chapter 1 – Introduction
– 38 –
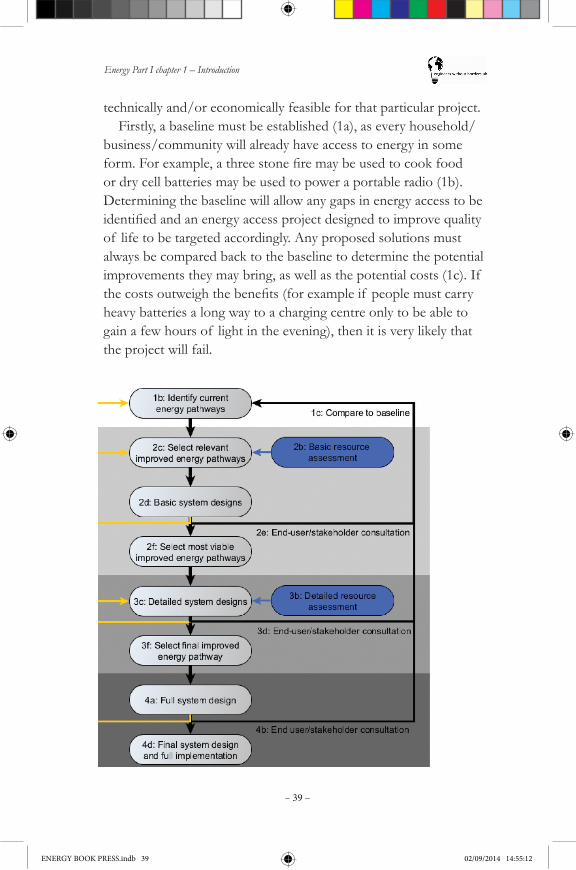
1.9.2 Choosing an energy pathway
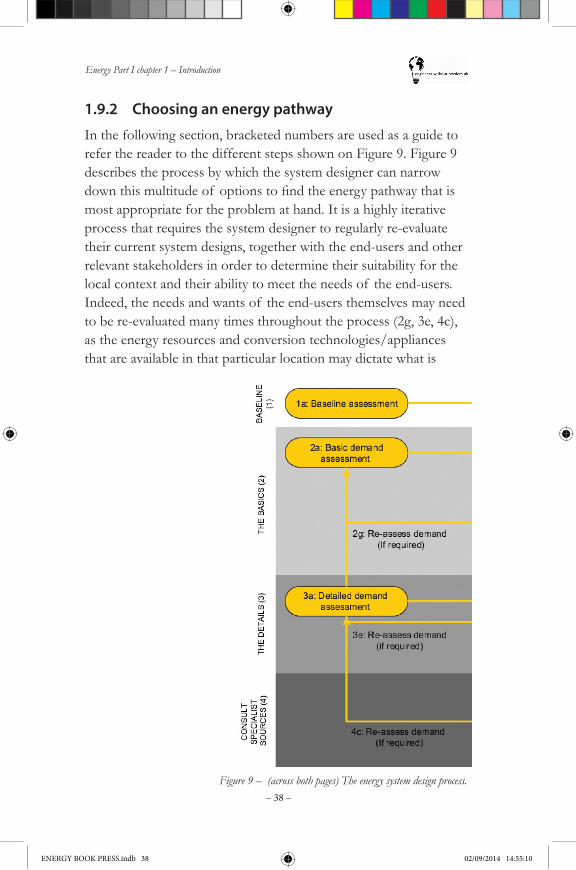
Figure 9 – (across both pages) The energy system design process.
In the following section, bracketed numbers are used as a guide to refer the reader to the different steps shown on Figure 9. Figure 9 describes the process by which the system designer can narrow downthismultitudeof optionstofindtheenergypathwaythatismost appropriate for the problem at hand. It is a highly iterative process that requires the system designer to regularly re-evaluate their current system designs, together with the end-users and other relevant stakeholders in order to determine their suitability for the local context and their ability to meet the needs of the end-users. Indeed, the needs and wants of the end-users themselves may need to be re-evaluated many times throughout the process (2g, 3e, 4c), as the energy resources and conversion technologies/appliances that are available in that particular location may dictate what is
ENERGY BOOK PRESS.indb 38 02/09/2014 14:55:10
Energy Part I chapter 1 – Introduction
– 39 –
technically and/or economically feasible for that particular project.Firstly, a baseline must be established (1a), as every household/
business/community will already have access to energy in some form.Forexample,athreestonefiremaybeusedtocookfoodor dry cell batteries may be used to power a portable radio (1b). Determining the baseline will allow any gaps in energy access to be identifiedandanenergyaccessprojectdesignedtoimprovequalityof life to be targeted accordingly. Any proposed solutions must always be compared back to the baseline to determine the potential improvements they may bring, as well as the potential costs (1c). If thecostsoutweighthebenefits(forexampleif peoplemustcarryheavy batteries a long way to a charging centre only to be able to gain a few hours of light in the evening), then it is very likely that the project will fail.
ENERGY BOOK PRESS.indb 39 02/09/2014 14:55:12

Energy Part I chapter 1 – Introduction
– 40 –
For each component (small wind turbine, solar resource, etc.), the information given in this book is split into ‘the basics’ (2) and ‘the details’ (3):•‘The basics’ (2) refers to the information that you would need to
make a preliminary assessment of both energy demand (2a) and the available resources (2b) using simple, ‘back-of the envelope’ calculations to decide which particular components are even remotely viable in a particular local context. This would allow the elimination of many energy pathways that are simply not appropriate in that particular situation (2c).
With this information, the system designer will then be able to draw up a number of basic system designs (2d). Through dialogue with the end-users and other relevant stakeholders (2e), these can be assessed and either selected or discarded (2f). If none of these options are found to be viable, the needs of the end-users may require reassessment.•‘The details’ (3) refers to a more in-depth level of analysis, where
detailed surveys are conducted at the household/business/community itself on energy demand (3a), energy resources (3b), local capacity, existing supply chains etc. Quotes for materials/components are also acquired from suppliers. Factors that are relevant to the long-term viability of the project, such as safety and operation and maintenance are introduced.
With a number of detailed system designs (3c), the reader can again consult with the end-users and relevant stakeholders to discuss issues such as the community’s ability and willingness to perform operation and maintenance, the availability of key components in the local area and the cultural acceptability of each of the proposed energy solutions (3d).
The number of energy pathways from Figure 8 can therefore besystematicallyreducedtofindthemostviablesolutionforthatparticularproblem.Onceafinalenergypathwayhasbeenselected(3f), a full system design must be drawn up (4a). This will feature exact details of what is to be installed, where the materials are to be purchased from, how each component will be constructed/installed, who will be responsible for operation and maintenance etc.
ENERGY BOOK PRESS.indb 40 02/09/2014 14:55:13
Energy Part I chapter 1 – Introduction
– 41 –
At this stage, the reader is also referred to a range of specialist sources,asitisnotpossibletoincludesufficientdetailoneverypossiblecomponentandsystemdesigninthisbook.Thefinaldesign must again be discussed and agreed upon with the end-users and relevant stakeholders (4b) before the system design can be finalised(4d)andanyconstruction/installationcanbegin.
One point that must be emphasised is that engagement with the end-users and other relevant stakeholders is absolutely fundamental in the design of any energy system. It is of the utmost importance thattheneedsandwantsof theend-usersareclearlyidentifiedandunderstoodbeforeanyfurtherundertakings.Specificpointswhere engagement is essential are highlighted on Figure 9 (2e, 3d, 4b), however it is important to understand that the end-users are the most important stakeholders, and therefore that they must participate as much as possible (and often lead) in the process of selecting, planning and delivering an energy solution. In identifying strategic points for the highest impact of a technology, it is often useful to consider where and how it can be most effectively used to earn a living.
Frequent consultation ensures that:•The resulting energy system will be able to meet the needs of
the end-users, i.e. the energy access project is targeting the most relevant needs in the most effective way.
•End-usershaveorcanacquiresufficienttechnicalknowledgeandorganisational capacity with which to be able to operate, maintain and administer the system in the long-term.
•A sense of ownership is developed by the end-users, as they must also have the motivation to look after the equipment installed in their household/business/community.
•The energy system will be culturally appropriate in that particular location, e.g. case study 1.
•The community’s knowledge of their local environment is used to its full potential. For example, women may well know the windiest and sunniest places in their community as they may hang their washing there.
ENERGY BOOK PRESS.indb 41 02/09/2014 14:55:13
Energy Part I chapter 1 – Introduction
– 42 –
•The end-users and other relevant stakeholders are fully in support of the project. Any energy access project that does not have the full support of all the relevant stakeholders is likely to run into problems later down the line, even if it is just one person who is not content. The earlier in the design process these concerns are voiced, the easier it is to adapt the energy access project to take account of them.
•Local knowledge of the construction materials, appliances and equipment that are already available in a particular region should be taken into account, as creating new supply chains requires additional planning. Using local construction techniques can also reduce costs and enhance sustainability, as systems are much more likely to be maintained successfully if repairs can be made by local tradesmen and spare parts sourced from local suppliers.
•The energy access project does not accentuate existing social divides (or even create new ones), e.g. case study 5.
ENERGY BOOK PRESS.indb 42 02/09/2014 14:55:13
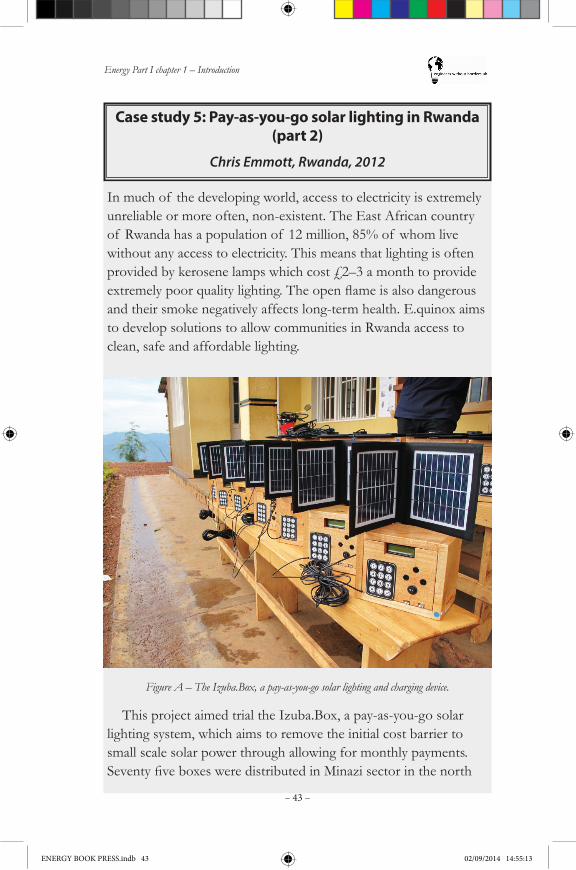
Energy Part I chapter 1 – Introduction
– 43 –
Case study 5: Pay-as-you-go solar lighting in Rwanda (part 2)
Chris Emmott, Rwanda, 2012
In much of the developing world, access to electricity is extremely unreliable or more often, non-existent. The East African country of Rwanda has a population of 12 million, 85% of whom live without any access to electricity. This means that lighting is often provided by kerosene lamps which cost £2–3 a month to provide extremelypoorqualitylighting.Theopenflameisalsodangerousand their smoke negatively affects long-term health. E.quinox aims to develop solutions to allow communities in Rwanda access to clean, safe and affordable lighting.
Figure A – The Izuba.Box, a pay-as-you-go solar lighting and charging device.
This project aimed trial the Izuba.Box, a pay-as-you-go solar lighting system, which aims to remove the initial cost barrier to small scale solar power through allowing for monthly payments. SeventyfiveboxesweredistributedinMinazisectorinthenorth
ENERGY BOOK PRESS.indb 43 02/09/2014 14:55:13
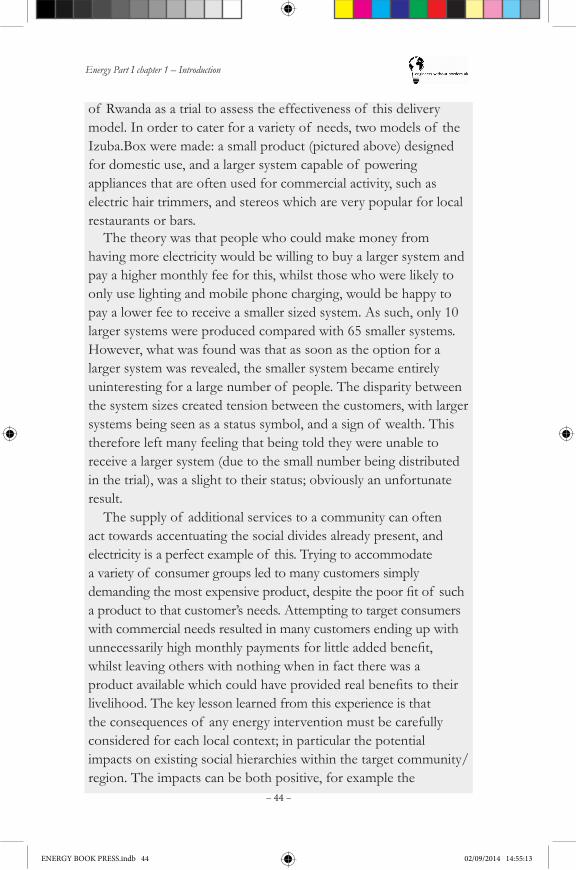
Energy Part I chapter 1 – Introduction
– 44 –
of Rwanda as a trial to assess the effectiveness of this delivery model. In order to cater for a variety of needs, two models of the Izuba.Box were made: a small product (pictured above) designed for domestic use, and a larger system capable of powering appliances that are often used for commercial activity, such as electric hair trimmers, and stereos which are very popular for local restaurants or bars.
The theory was that people who could make money from having more electricity would be willing to buy a larger system and pay a higher monthly fee for this, whilst those who were likely to only use lighting and mobile phone charging, would be happy to pay a lower fee to receive a smaller sized system. As such, only 10 larger systems were produced compared with 65 smaller systems. However, what was found was that as soon as the option for a larger system was revealed, the smaller system became entirely uninteresting for a large number of people. The disparity between the system sizes created tension between the customers, with larger systems being seen as a status symbol, and a sign of wealth. This therefore left many feeling that being told they were unable to receive a larger system (due to the small number being distributed in the trial), was a slight to their status; obviously an unfortunate result.
The supply of additional services to a community can often act towards accentuating the social divides already present, and electricity is a perfect example of this. Trying to accommodate a variety of consumer groups led to many customers simply demandingthemostexpensiveproduct,despitethepoorfitof sucha product to that customer’s needs. Attempting to target consumers with commercial needs resulted in many customers ending up with unnecessarilyhighmonthlypaymentsforlittleaddedbenefit,whilst leaving others with nothing when in fact there was a productavailablewhichcouldhaveprovidedrealbenefitstotheirlivelihood. The key lesson learned from this experience is that the consequences of any energy intervention must be carefully considered for each local context; in particular the potential impacts on existing social hierarchies within the target community/region. The impacts can be both positive, for example the
ENERGY BOOK PRESS.indb 44 02/09/2014 14:55:13

Energy Part I chapter 1 – Introduction
– 45 –
empowerment of women through the provision of electric light making household chores in the evening or early morning easier, or negative, as illustrated here.
About the author: Chris Emmott is a PhD student at Imperial College London, studying the potential impacts that emerging solar energy technologies may have on reducing greenhouse gas emissions. He travelled to Rwanda in August 2012 to commence thetrialof thefirstIzuba.Boxprototypes.
About the organisation: e.quinox is an open-source, humanitarian, student organisation based within Imperial College London. It aims to develop cost-effective, sustainable and scalable delivery models for providing renewable energy to developing countries.
ENERGY BOOK PRESS.indb 45 02/09/2014 14:55:13
Energy Part I chapter 1 – Introduction
– 46 –
1.9.3 Worked example
The following section takes the reader through a full worked example, using the energy systems design process described in section 1.9 and summarised in Figures 8 and 9.
1.9.3.1 Baseline (1)
The leader of a community in the Peruvian Andes approaches a Community Based Organisation (CBO) that has implemented a number of energy access projects in the region and asks if it would be possible to implement a similar project in his community. The CBO responds positively and visits the community to conduct a baseline assessment (1a). The EWB-UK volunteer, who is on placement with the CBO visits each of the village’s 38 houses, as well as the health centre and uses the TEA questionnaire (see section 2.1: Assessing energy demand) to categorise the current levelof energyaccessateachplace.Shefindsthatmosthouseholdsare already using biogas digesters with gas stoves for cooking, as there has already been a successful government-sponsored biogas programme in the region. However, the only electricity access in the village is via dry cell batteries for torches/portable radios and almosteverybodyisusingopenflamekerosenelamps(1b).
1.9.3.2 Basic system design (2)
TheCBOvisitsthecommunityandholdsameetingtofindoutwhich needs the community prioritises (2a). The community agree that electric light is most important to them, as one of the houses recentlyburntdownduetoanopenflamelamptippingover.Twoyoung mothers have also died in the last few years during childbirth due to anaemia that was not diagnosed in time because of the lack of medical facilities at the village health centre. Most people have mobile phones, however there is nowhere to charge them in the village, so they must take them to the nearest town (2 hours walk) and pay to charge them. Finally, the community leader has a large TV that was given to him by his son who is working in the US, however he has never been able to use it due to the lack of electricity in the village.
The EWB-UK placement volunteer conducts a basic resource
ENERGY BOOK PRESS.indb 46 02/09/2014 14:55:13
Energy Part I chapter 1 – Introduction
– 47 –
assessment (2b) by obtaining values for the solar and wind resources using online databases. Both look promising, however when she asks the community leader if there are any streams nearby, he answers no, meaning that hydro power is not an option. He also says that neighbouring communities that have bought generators use them only very occasionally due to the high price of diesel in the region. She notices that there are no bicycles in the area due to the mountainous terrain, which means that pedal generators would be difficulttomaintain.Asaresult,undertheguidanceof theCBO,the EWB-UK placement volunteer draws up a number of basic system designs (2d):
1. Solar Home Systems (50 W) installed at each household.
2. Small Wind Turbines (100 W) installed at each household.
3. A small wind turbine (1 kW) installed at the health centre with a mini-grid extending to the closest houses.
4. A wind/solar hybrid system (1 kW) installed at the health centre with a battery charging station.
A meeting is held in the community to decide which, if any, of these basic system designs are viable (2f). After hearing about the amount of maintenance that wind turbines require, the whole community agree that option 2 should be dropped.
1.9.3.3 Detailed system design (3)
With the assistance of the CBO, the EWB-UK volunteer conducts a detailed resource assessment (3b) by installing an anemometer at the health centre, which the community had agreed was the windiest pointinthevillage.However,thefirstfewmonthsof dataaredisappointing, leaving solar PV as the only viable power source. She also carries out a detailed needs assessment (3a) by asking each household (and the health centre) how many appliances they would like to use and for how many hours per day. Most households say that they would like a fridge, a freezer, an iron, a kettle, 10 CFL lights, 2 mobile phones, a widescreen TV and a radio. The EWB-UK placement volunteer explains that it would be very expensive
ENERGY BOOK PRESS.indb 47 02/09/2014 14:55:13

Energy Part I chapter 1 – Introduction
– 48 –
to provide that amount of energy from solar PV, so they agree that 3 CFL lights, a mobile phone, a small TV and a radio would be more realistic (3e). Unfortunately the community leader is very disappointed that they still won’t be able to use their widescreen TV and the EWB-UK placement volunteer remembers the importance of managing expectations and regrets not making this clear earlier. The health centre also asks for a centrifuge (for diagnosing anaemia) and electric light.
With this information, detailed system designs (3c) are drawn up for to following options:
1. Solar Home Systems (50 W) installed at each household.
2. A solar array (10 kW) installed at the health centre with a mini-grid extending to the closest houses.
3. A solar array (10 kW) installed at the health centre with a battery charging station.
Another meeting is held in the community to discuss the detailed designs (3d). The meeting is a disaster, as it becomes apparent that nobody in the community has enough money to afford any of the proposed options. Fortunately the community leader is aware of a grant that the local municipality offers that will cover the cost of providing electricity to health centres. As a result, the EWB-UK placement volunteer uses the demand assessment for the health centre (3e) to design a much simpler and cheaper system to meet this reduced demand (3c):
1. A solar array (100W) installed at the health centre.
This new design is again discussed in a meeting with the community(3d),howevermanypeoplearestilldissatisfiedwiththefact that they have to walk so far to charge their mobile phone and they won’t have electric light in their homes. As a result, the demand assessment at the health centre is adjusted to include 10 mobile phone charges per day (3e) and the PV capacity is increased to 150W (3c). The EWB-UK placement volunteer mentions that solar lanterns are available in the nearest city, however many people are sceptical as they have never seen a solar lantern before. The EWB-
ENERGY BOOK PRESS.indb 48 02/09/2014 14:55:13
Energy Part I chapter 1 – Introduction
– 49 –
UK placement volunteer carefully assesses the quality and price of the solar lanterns to ensure they are appropriate for meeting the needs of the community members and brings one along to the next meeting for demonstration (3d). Everyone is very impressed by its simplicity and portability, however, although the lanterns do not cost much, only a few people can afford them. Fortunately the EWB-UK placement volunteer has found out about a revolving fund set up by a separate CBO to offer microcredit to groups of fivewomentoallowthemtopurchasesolarlanterns.
1.9.3.4 Full system design (4)
All agree that this is an acceptable solution (3f) and a full system design is drawn up for the health centre (4b). The EWB-UK placement volunteer consults the specialist literature on PV system design that has been recommended in this book in order to gain sufficientknowledgetobeabletodesignasafeandreliablesystem.The full design is checked and approved by a PV specialist that has been working for the CBO for many years.
When this design was shared with the community (4b), the only amendment was in the positioning of the battery bank (the nurse was unhappy with the batteries, as the location that the EWB-UK placement volunteer had chosen was blocking the store cupboard). Withthefinalsystemdesignnowconfirmed,underthesupervisionof the CBO, the EWB-UK placement volunteer coordinated the installation of the following system (4d):
1. A solar array (150W) installed at the health centre and solar lanterns for each home.
ENERGY BOOK PRESS.indb 49 02/09/2014 14:55:13
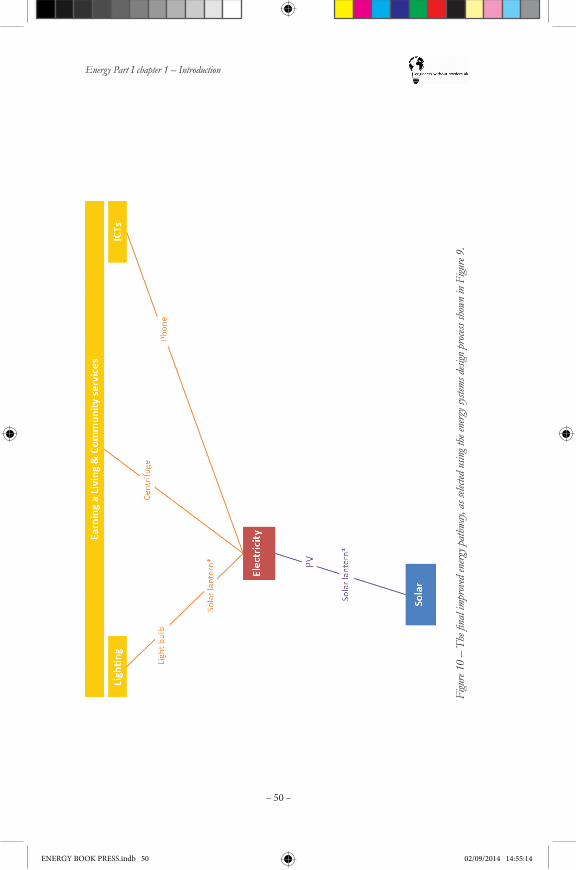
Energy Part I chapter 1 – Introduction
– 50 –
Figu
re 10
– T
he fi
nal i
mpro
ved en
ergy p
athwa
y, as
selec
ted u
sing t
he en
ergy s
ystem
s desi
gn pr
ocess
show
n in
Figu
re 9.
ENERGY BOOK PRESS.indb 50 02/09/2014 14:55:14

Energy Part I chapter 1 – Introduction
– 51 –
1.9.4 Structure of the book
This book is structured according to the energy system design process described in this section. The subjects covered by this chapter are categorised according to the energy pathway diagram shown in Figure 8:•Energy demand (including appliances)
•Practical system design (focussed on the electrical energy vector)
•Conversion technologies
•Energy resources
For each of these subjects, the information is divided according to the stages outlined in the energy system design process shown in Figure 9: •‘The basics’ (2) give a broad overview of the main issues
concerning a particular subject and enables the reader to draw up anumberof basicsystemdesigns.‘Thebasics’arepresentedfirst,so that the reader only needs to delve into ‘the details’ of that particular subject if a detailed system design using that particular component is required.
•‘The details’ (3) offer greater depth in each of these subjects so that the reader can develop the most viable basic system designs into detailed system designs.
•Furtherreadinglists(4)pointthereadertosubjectspecificliteratureandspecificpointswhereanexpertand/orlocalchampion should be consulted are highlighted. The reader can thengainsufficientdepthtobeabletodesignafullsystemthatisready for implementation.
ENERGY BOOK PRESS.indb 51 02/09/2014 14:55:14

Energy Part I chapter 1 – Introduction
– 52 –
1.10 Final remarks
This introduction has given an overview of the range of services needed by end-users, which can be provided only if they have access to energy. It is of utmost importance that the needs and wants of theend-usersareclearlyidentifiedandunderstoodbeforeanyfurther undertakings. It is also important to understand that the end-users are the most important stakeholders, and therefore that they must constantly be involved (and often lead) in the process of planning and delivering. In identifying strategic points for the highest impact of a technology, it is often useful to consider where and how it can be most effectively used to earn a living.
A methodology for designing energy systems that are shaped by the needs of the end-users and the resources available to them has been presented. This methodology dictates the structure of this book and will guide the reader in determining the most appropriate pathway/s to providing these energy services to the end-user.
ENERGY BOOK PRESS.indb 52 02/09/2014 14:55:14
Energy Part II chapter 2 – The basics
– 53 –
2 The basicsThis chapter presents an overview of the main points relating to energy demand, energy resources, conversion technologies and practical system design. It is designed to allow the reader to select potential energy pathways (see Figure 8) that are relevant to the particularcontextinwhichtheyareworking.Sufficientinformationis given to create some basic system designs for these energy pathways using back of the envelope calculations. These calculations will prove whether or not each potential energy pathway could be feasible in that particular context. These potential pathways can be discussed with the end-users and other relevant stakeholders and if they are approved, then a detailed system design can be created. Each section within this chapter is accompanied by a corresponding section in the following chapter, 'the details', where the reader canfindfurtherinformationoneachtopic.However,ashasbeenemphasised throughout this book, frequent consultation with an expert and local champion at all stages of the design process is essentialtoensurethattheproposedsolutionsaresafe,efficientandappropriate.
2.1 Assessing energy demand – the basicsThefollowingsectionaimstoguidethereaderthroughthefirststages of the process of assessing energy demand, as outlined in Figure 9:•A baseline assessment (1a)
•A basic demand assessment (2a)
Information on detailed demand assessments (3a) can be found in chapter 3, section 3.1: Assessing energy demand – the details.
2.1.1 Baseline and basic demand assessments
Thefirststeptowardsachievingaccesstomodernenergyservicesis to thoroughly identify the needs and wants of the end-user. As a starting point, we recommend using Practical Action’s 'Total Energy Access' (TEA) questionnaire, which can be downloaded from Energypedia at: https://energypedia.info/wiki/Total_Energy_Wiki.
ENERGY BOOK PRESS.indb 53 02/09/2014 14:55:14
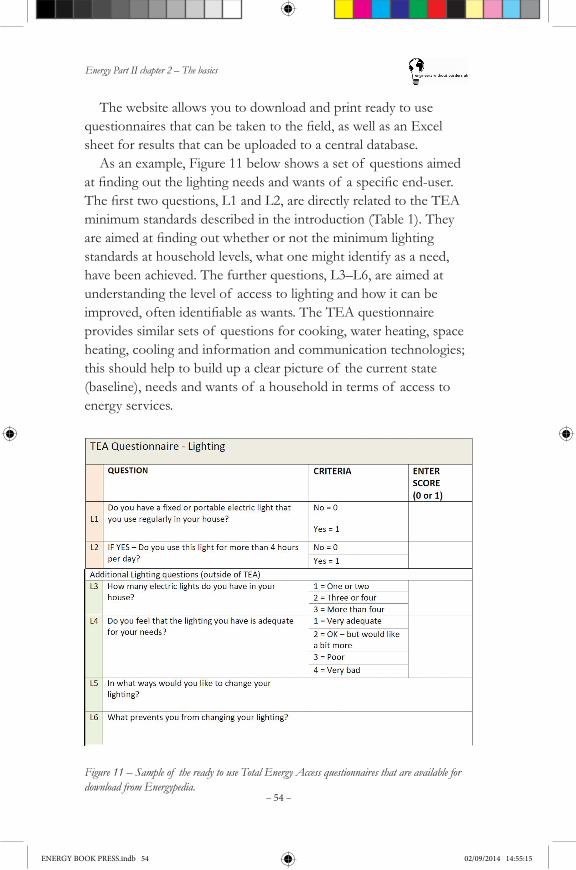
Energy Part II chapter 2 – The basics
– 54 –
The website allows you to download and print ready to use questionnairesthatcanbetakentothefield,aswellasanExcelsheet for results that can be uploaded to a central database.
As an example, Figure 11 below shows a set of questions aimed atfindingoutthelightingneedsandwantsof aspecificend-user.Thefirsttwoquestions,L1andL2,aredirectlyrelatedtotheTEAminimum standards described in the introduction (Table 1). They areaimedatfindingoutwhetherornottheminimumlightingstandards at household levels, what one might identify as a need, have been achieved. The further questions, L3–L6, are aimed at understanding the level of access to lighting and how it can be improved,oftenidentifiableaswants.TheTEAquestionnaireprovides similar sets of questions for cooking, water heating, space heating, cooling and information and communication technologies; this should help to build up a clear picture of the current state (baseline), needs and wants of a household in terms of access to energy services.
Figure 11 – Sample of the ready to use Total Energy Access questionnaires that are available for download from Energypedia.
ENERGY BOOK PRESS.indb 54 02/09/2014 14:55:15
Energy Part II chapter 2 – The basics
– 55 –
2.1.2 More information
This section has introduced the basic concepts in the assessment of energy demand. For further information, please see chapter 3, section 3.1: Assessing energy demand – the details', or chapter 4, Further reading.
2.2 Energy resources – the basics2.2.1 Resource assessment
Unlike fossil fuels, renewable resources are not available ‘on tap’ – they are a variable resource. As a result, conducting an accurate resource assessment is absolutely vital in designing a system that willbecapableof meetingtheneedsof end-users,asidentifiedinthe previous section. Whilst a 100 Wp (Watt-peak) solar panel in the Sahara may be able to power twenty CFL bulbs for a few hours every night, it would struggle to light just one in a Siberian winter.
The following section describes how to assess the three most common renewable energy resources: the sun, the wind and water. This information will allow the reader to calculate how much energy each conversion technology is able to generate throughout the year in your location and therefore design the most appropriate energy system for that particular place. Referring back to the energy systems design process described in Figure 9, it will guide the reader through the process of conducting a basic resource assessment (2b), with the accompanying section later in chapter 3, section 3.2: Energy resources – the details, able to assist with detailed resource assessments (3b).
Grid-connected and off-grid systems use different methods for estimating energy generation for a particular location. This is because grid-connected systems are designed for maximum annual energy generation, while off-grid systems are typically designed to ensure they operate during the month with the lowest renewable resource availability, e.g. winter for solar outside the tropics or the dry season for hydro. However, there are exceptions:•If energy demand also peaks in the same season as the renewable
resource, e.g. an irrigation system could be designed to work at full capacity only during the dry season, when it is sunniest.
ENERGY BOOK PRESS.indb 55 02/09/2014 14:55:15
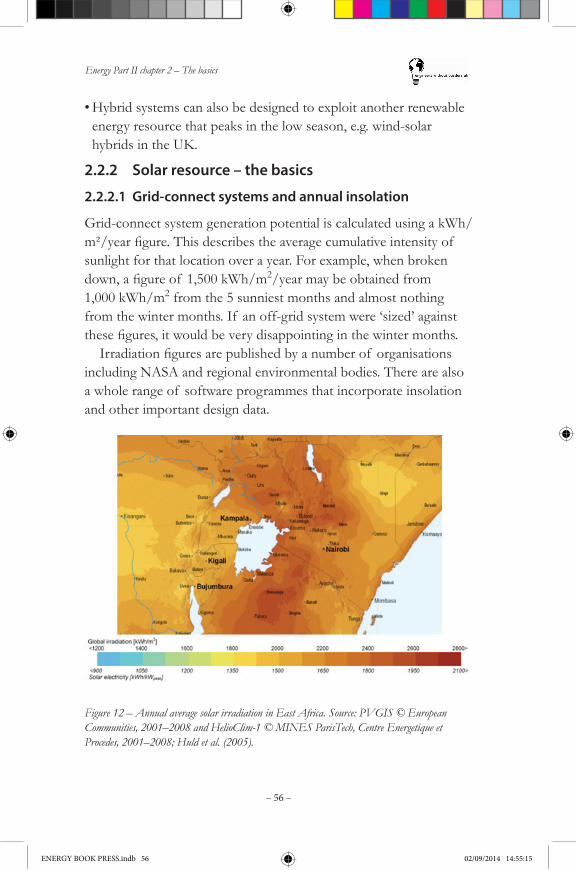
Energy Part II chapter 2 – The basics
– 56 –
•Hybrid systems can also be designed to exploit another renewable energy resource that peaks in the low season, e.g. wind-solar hybrids in the UK.
2.2.2 Solar resource – the basics
2.2.2.1 Grid-connect systems and annual insolation
Grid-connect system generation potential is calculated using a kWh/m²/yearfigure.Thisdescribestheaveragecumulativeintensityof sunlight for that location over a year. For example, when broken down,afigureof 1,500kWh/m2/year may be obtained from 1,000 kWh/m2 from the 5 sunniest months and almost nothing from the winter months. If an off-grid system were ‘sized’ against thesefigures,itwouldbeverydisappointinginthewintermonths.Irradiationfiguresarepublishedbyanumberof organisations
including NASA and regional environmental bodies. There are also a whole range of software programmes that incorporate insolation and other important design data.
Figure 12 – Annual average solar irradiation in East Africa. Source: PVGIS © European Communities, 2001–2008 and HelioClim-1 © MINES ParisTech, Centre Energetique et Procedes, 2001–2008; Huld et al. (2005).
ENERGY BOOK PRESS.indb 56 02/09/2014 14:55:15
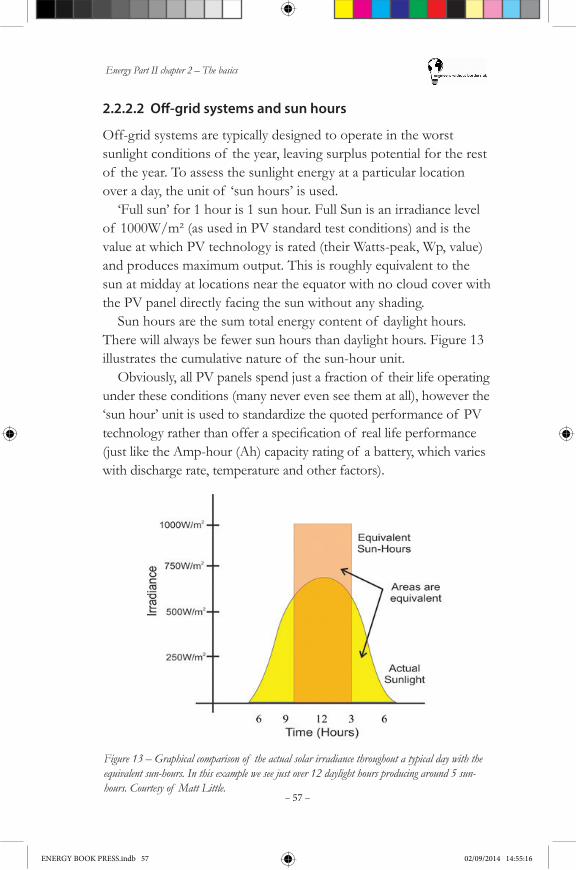
Energy Part II chapter 2 – The basics
– 57 –
2.2.2.2 Off-grid systems and sun hours
Off-grid systems are typically designed to operate in the worst sunlight conditions of the year, leaving surplus potential for the rest of the year. To assess the sunlight energy at a particular location over a day, the unit of ‘sun hours’ is used.
‘Full sun’ for 1 hour is 1 sun hour. Full Sun is an irradiance level of 1000W/m² (as used in PV standard test conditions) and is the value at which PV technology is rated (their Watts-peak, Wp, value) and produces maximum output. This is roughly equivalent to the sun at midday at locations near the equator with no cloud cover with the PV panel directly facing the sun without any shading.
Sun hours are the sum total energy content of daylight hours. There will always be fewer sun hours than daylight hours. Figure 13 illustrates the cumulative nature of the sun-hour unit.
Obviously, all PV panels spend just a fraction of their life operating under these conditions (many never even see them at all), however the ‘sun hour’ unit is used to standardize the quoted performance of PV technologyratherthanofferaspecificationof reallifeperformance(just like the Amp-hour (Ah) capacity rating of a battery, which varies with discharge rate, temperature and other factors).
Figure 13 – Graphical comparison of the actual solar irradiance throughout a typical day with the equivalent sun-hours. In this example we see just over 12 daylight hours producing around 5 sun-hours. Courtesy of Matt Little.
ENERGY BOOK PRESS.indb 57 02/09/2014 14:55:16
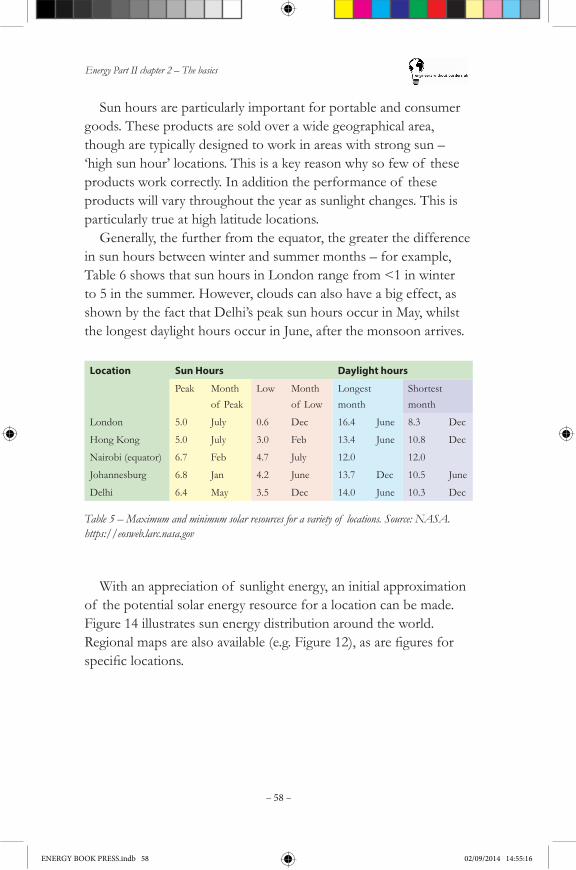
Energy Part II chapter 2 – The basics
– 58 –
Sun hours are particularly important for portable and consumer goods. These products are sold over a wide geographical area, though are typically designed to work in areas with strong sun – ‘high sun hour’ locations. This is a key reason why so few of these products work correctly. In addition the performance of these products will vary throughout the year as sunlight changes. This is particularly true at high latitude locations.
Generally, the further from the equator, the greater the difference in sun hours between winter and summer months – for example, Table 6 shows that sun hours in London range from <1 in winter to 5 in the summer. However, clouds can also have a big effect, as shown by the fact that Delhi’s peak sun hours occur in May, whilst the longest daylight hours occur in June, after the monsoon arrives.
Location Sun Hours Daylight hours
Peak Month of Peak
Low Month of Low
Longest month
Shortest month
London 5.0 July 0.6 Dec 16.4 June 8.3 Dec
Hong Kong 5.0 July 3.0 Feb 13.4 June 10.8 Dec
Nairobi (equator) 6.7 Feb 4.7 July 12.0 12.0
Johannesburg 6.8 Jan 4.2 June 13.7 Dec 10.5 June
Delhi 6.4 May 3.5 Dec 14.0 June 10.3 Dec
Table 5 – Maximum and minimum solar resources for a variety of locations. Source: NASA. https://eosweb.larc.nasa.gov
With an appreciation of sunlight energy, an initial approximation of the potential solar energy resource for a location can be made. Figure 14 illustrates sun energy distribution around the world. Regionalmapsarealsoavailable(e.g.Figure12),asarefiguresforspecificlocations.
ENERGY BOOK PRESS.indb 58 02/09/2014 14:55:16
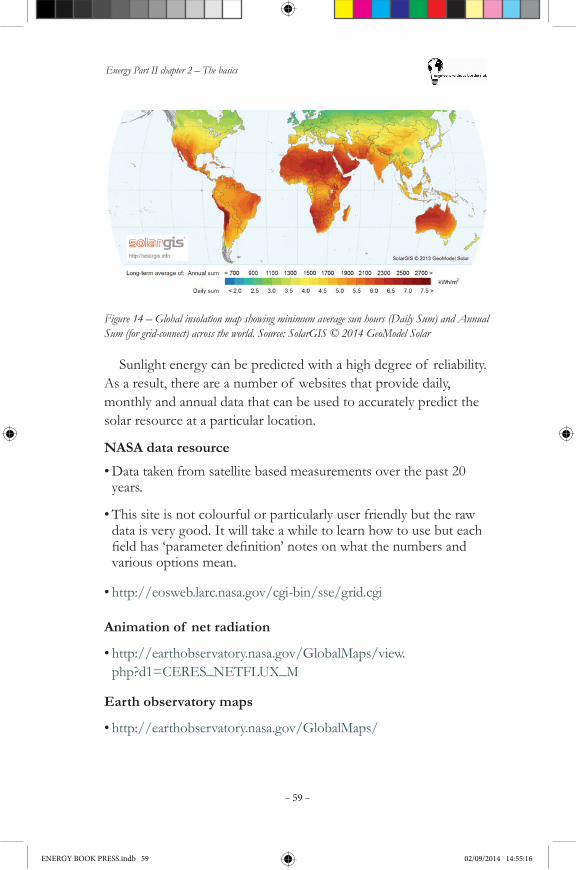
Energy Part II chapter 2 – The basics
– 59 –
Figure 14 – Global insolation map showing minimum average sun hours (Daily Sum) and Annual Sum (for grid-connect) across the world. Source: SolarGIS © 2014 GeoModel Solar
Sunlight energy can be predicted with a high degree of reliability. As a result, there are a number of websites that provide daily, monthly and annual data that can be used to accurately predict the solar resource at a particular location.
NASA data resource
•Data taken from satellite based measurements over the past 20 years.
•This site is not colourful or particularly user friendly but the raw data is very good. It will take a while to learn how to use but each fieldhas‘parameterdefinition’notesonwhatthenumbersandvarious options mean.
•http://eosweb.larc.nasa.gov/cgi-bin/sse/grid.cgi
Animation of net radiation
•http://earthobservatory.nasa.gov/GlobalMaps/view.php?d1=CERES_NETFLUX_M
Earth observatory maps
•http://earthobservatory.nasa.gov/GlobalMaps/
ENERGY BOOK PRESS.indb 59 02/09/2014 14:55:16
Energy Part II chapter 2 – The basics
– 60 –
EC JRC maps and resources
•Highly recommended solar insolation map of Africa: http://re.jrc.ec.europa.eu/pvgis/.
•The interactive maps are useful for thinking about how the software is calculating the summarised values (click ‘stand-alone PV’ top right of the page): http://re.jrc.ec.europa.eu/pvgis/apps4/pvest.php?map=africa.
2.2.2.3 More information
This section has introduced the basic concepts relating to the solar resource. For further information, please see chapter 3, section 3.2.1: Solar resource – the details, or chapter 4, Further reading.
2.2.3 Wind resource – the basics
The wind is a highly variable resource. In the time domain, there are gusts acting over seconds, calm periods lasting for days, seasonal patternsacrosstheyearandclimaticinfluencesleadingtointer-annual variation. In the spatial domain, trees cause very localised shelter effects, gentle hills can funnel the wind smoothly around them and continental land masses slow down the winds that whip across the ocean. Consequently, assessing the wind resource is not easy.
The power available in the wind is derived from the kinetic energy available in a stream tube passing through a given area (Gipe, 2004). The most important part of wind resource assessment is the fact that the available power is proportional to the cube of the wind speed:
P = power available (W) ρ = density of air (kg/m3: approx. 1.2kg/m3 at sea level & 15°C)A = swept area of wind energy conversion device (m2:=πr2 for conventional horizontal axis rotors)V = wind velocity (m/s)
P = ½ρAV3
ENERGY BOOK PRESS.indb 60 02/09/2014 14:55:16
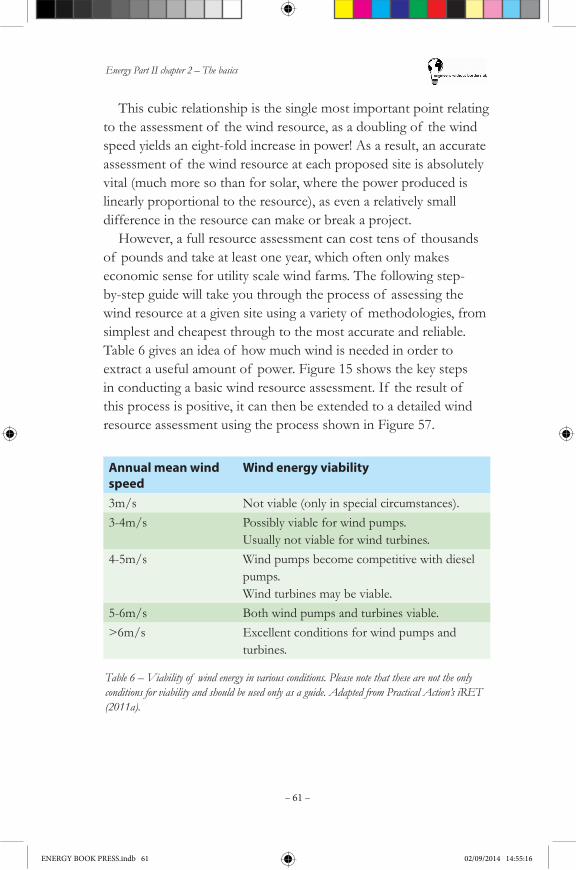
Energy Part II chapter 2 – The basics
– 61 –
This cubic relationship is the single most important point relating to the assessment of the wind resource, as a doubling of the wind speed yields an eight-fold increase in power! As a result, an accurate assessment of the wind resource at each proposed site is absolutely vital (much more so than for solar, where the power produced is linearly proportional to the resource), as even a relatively small difference in the resource can make or break a project.
However, a full resource assessment can cost tens of thousands of pounds and take at least one year, which often only makes economic sense for utility scale wind farms. The following step-by-step guide will take you through the process of assessing the wind resource at a given site using a variety of methodologies, from simplest and cheapest through to the most accurate and reliable. Table 6 gives an idea of how much wind is needed in order to extract a useful amount of power. Figure 15 shows the key steps in conducting a basic wind resource assessment. If the result of this process is positive, it can then be extended to a detailed wind resource assessment using the process shown in Figure 57.
Annual mean wind speed
Wind energy viability
3m/s Not viable (only in special circumstances).3-4m/s Possibly viable for wind pumps.
Usually not viable for wind turbines.4-5m/s Wind pumps become competitive with diesel
pumps.Wind turbines may be viable.
5-6m/s Both wind pumps and turbines viable.>6m/s Excellent conditions for wind pumps and
turbines.
Table 6 – Viability of wind energy in various conditions. Please note that these are not the only conditions for viability and should be used only as a guide. Adapted from Practical Action’s iRET (2011a).
ENERGY BOOK PRESS.indb 61 02/09/2014 14:55:16
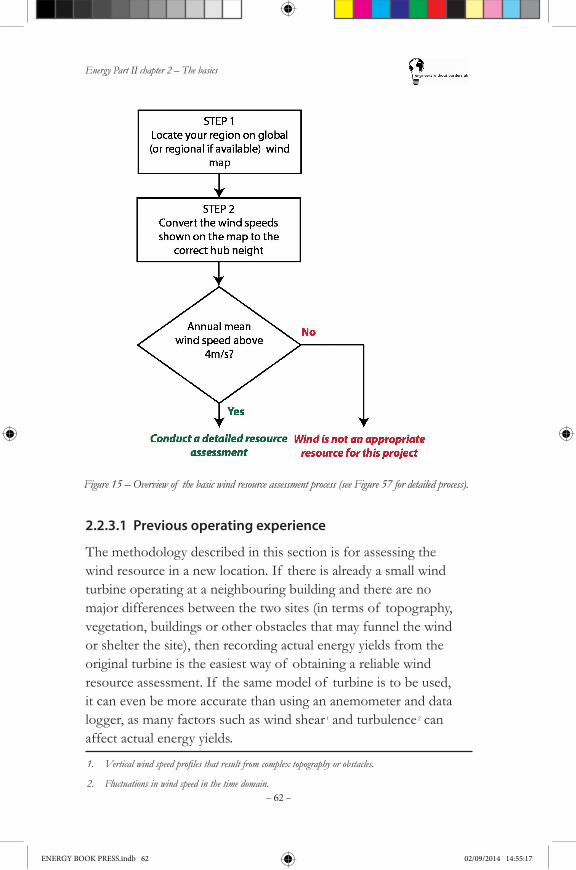
Energy Part II chapter 2 – The basics
– 62 –
Figure 15 – Overview of the basic wind resource assessment process (see Figure 57 for detailed process).
2.2.3.1 Previous operating experience
The methodology described in this section is for assessing the wind resource in a new location. If there is already a small wind turbine operating at a neighbouring building and there are no major differences between the two sites (in terms of topography, vegetation, buildings or other obstacles that may funnel the wind or shelter the site), then recording actual energy yields from the original turbine is the easiest way of obtaining a reliable wind resource assessment. If the same model of turbine is to be used, it can even be more accurate than using an anemometer and data logger, as many factors such as wind shear 1 and turbulence 2 can affect actual energy yields.
1. Vertical wind speed profiles that result from complex topography or obstacles.
2. Fluctuations in wind speed in the time domain.
ENERGY BOOK PRESS.indb 62 02/09/2014 14:55:17
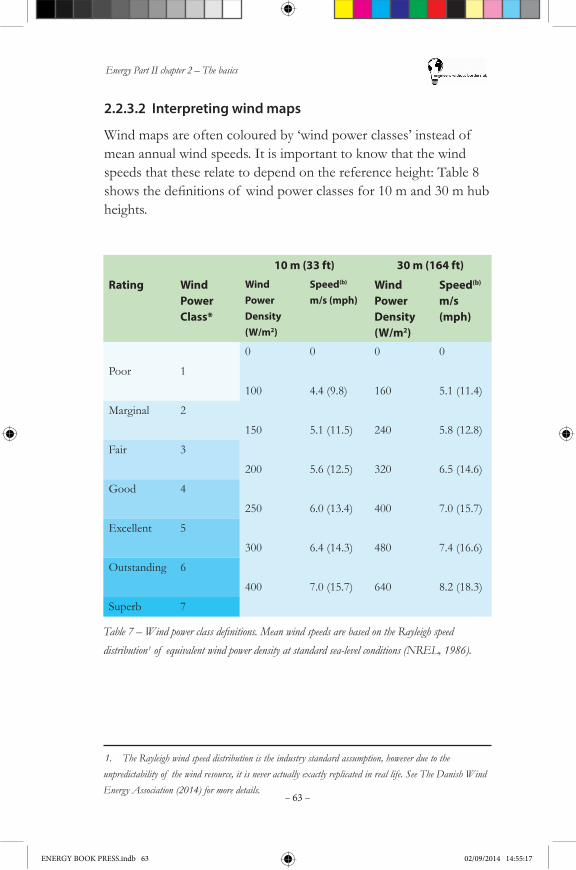
Energy Part II chapter 2 – The basics
– 63 –
2.2.3.2 Interpreting wind maps
Wind maps are often coloured by ‘wind power classes’ instead of mean annual wind speeds. It is important to know that the wind speeds that these relate to depend on the reference height: Table 8 showsthedefinitionsof windpowerclassesfor10mand30mhubheights.
10 m (33 ft) 30 m (164 ft)
Rating Wind Power Class*
Wind Power Density (W/m2)
Speed(b) m/s (mph)
Wind Power Density (W/m2)
Speed(b) m/s (mph)
0 0 0 0
Poor 1
100 4.4 (9.8) 160 5.1 (11.4)
Marginal 2
150 5.1 (11.5) 240 5.8 (12.8)
Fair 3
200 5.6 (12.5) 320 6.5 (14.6)
Good 4
250 6.0 (13.4) 400 7.0 (15.7)
Excellent 5
300 6.4 (14.3) 480 7.4 (16.6)
Outstanding 6
400 7.0 (15.7) 640 8.2 (18.3)
Superb 7
Table 7 – Wind power class definitions. Mean wind speeds are based on the Rayleigh speed distribution 1 of equivalent wind power density at standard sea-level conditions (NREL, 1986).
1. The Rayleigh wind speed distribution is the industry standard assumption, however due to the unpredictability of the wind resource, it is never actually exactly replicated in real life. See The Danish Wind Energy Association (2014) for more details.
ENERGY BOOK PRESS.indb 63 02/09/2014 14:55:17
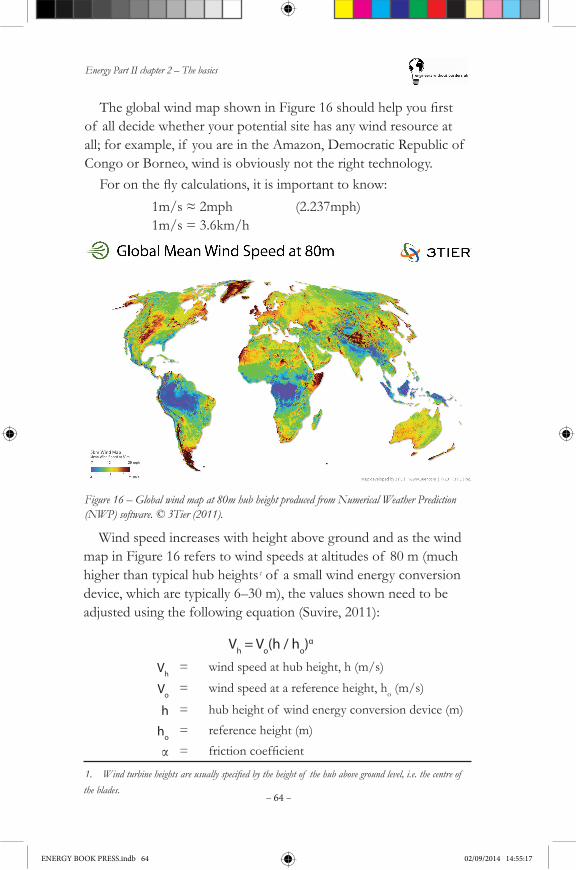
Energy Part II chapter 2 – The basics
– 64 –
Forontheflycalculations,itisimportanttoknow:1m/s≈2mph (2.237mph)1m/s = 3.6km/h
TheglobalwindmapshowninFigure16shouldhelpyoufirstof all decide whether your potential site has any wind resource at all; for example, if you are in the Amazon, Democratic Republic of Congo or Borneo, wind is obviously not the right technology.
Figure 16 – Global wind map at 80m hub height produced from Numerical Weather Prediction (NWP) software. © 3Tier (2011).
Wind speed increases with height above ground and as the wind map in Figure 16 refers to wind speeds at altitudes of 80 m (much higher than typical hub heights 1 of a small wind energy conversion device, which are typically 6–30 m), the values shown need to be adjusted using the following equation (Suvire, 2011):
1. Wind turbine heights are usually specified by the height of the hub above ground level, i.e. the centre of the blades.
Vh = Vo(h / ho)α
Vh= wind speed at hub height, h (m/s)
Vo= wind speed at a reference height, ho (m/s)
h = hub height of wind energy conversion device (m)
ho= reference height (m)
α = frictioncoefficient
ENERGY BOOK PRESS.indb 64 02/09/2014 14:55:17
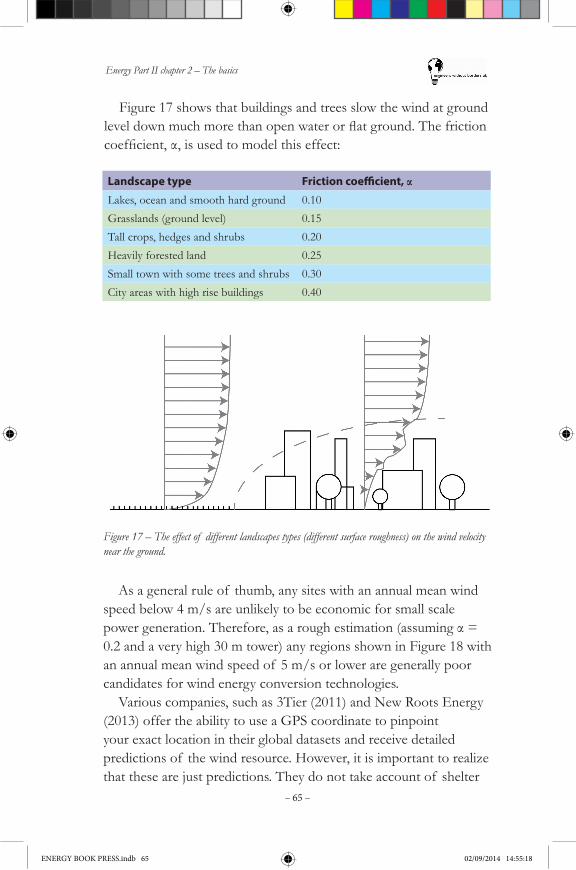
Energy Part II chapter 2 – The basics
– 65 –
Figure 17 shows that buildings and trees slow the wind at ground leveldownmuchmorethanopenwaterorflatground.Thefrictioncoefficient,α,isusedtomodelthiseffect:
Landscape type Friction coefficient, αLakes, ocean and smooth hard ground 0.10Grasslands (ground level) 0.15Tall crops, hedges and shrubs 0.20Heavily forested land 0.25Small town with some trees and shrubs 0.30City areas with high rise buildings 0.40
Figure 17 – The effect of different landscapes types (different surface roughness) on the wind velocity near the ground.
As a general rule of thumb, any sites with an annual mean wind speed below 4 m/s are unlikely to be economic for small scale powergeneration.Therefore,asaroughestimation(assumingα=0.2 and a very high 30 m tower) any regions shown in Figure 18 with an annual mean wind speed of 5 m/s or lower are generally poor candidates for wind energy conversion technologies.
Various companies, such as 3Tier (2011) and New Roots Energy (2013) offer the ability to use a GPS coordinate to pinpoint your exact location in their global datasets and receive detailed predictions of the wind resource. However, it is important to realize that these are just predictions. They do not take account of shelter
ENERGY BOOK PRESS.indb 65 02/09/2014 14:55:18
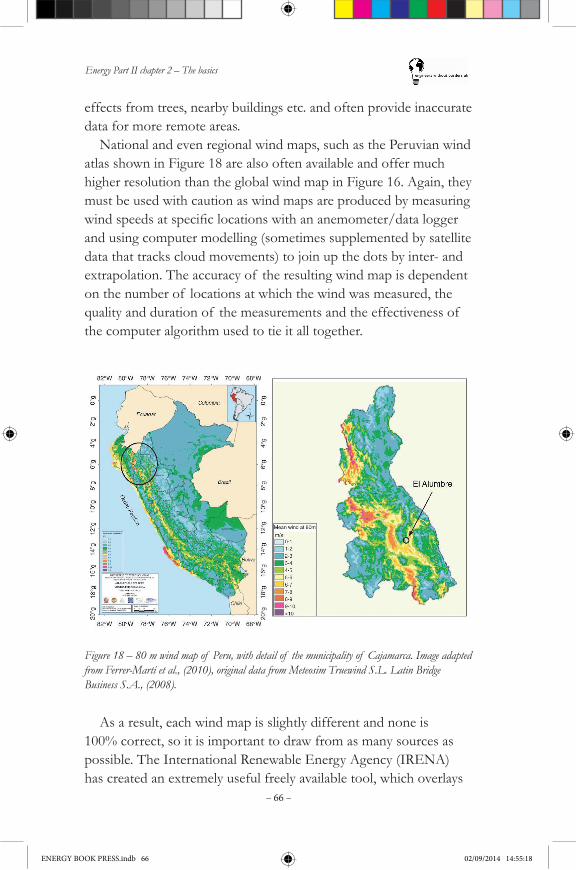
Energy Part II chapter 2 – The basics
– 66 –
effects from trees, nearby buildings etc. and often provide inaccurate data for more remote areas.
National and even regional wind maps, such as the Peruvian wind atlas shown in Figure 18 are also often available and offer much higher resolution than the global wind map in Figure 16. Again, they must be used with caution as wind maps are produced by measuring windspeedsatspecificlocationswithananemometer/dataloggerand using computer modelling (sometimes supplemented by satellite data that tracks cloud movements) to join up the dots by inter- and extrapolation. The accuracy of the resulting wind map is dependent on the number of locations at which the wind was measured, the quality and duration of the measurements and the effectiveness of the computer algorithm used to tie it all together.
Figure 18 – 80 m wind map of Peru, with detail of the municipality of Cajamarca. Image adapted from Ferrer-Martí et al., (2010), original data from Meteosim Truewind S.L. Latin Bridge Business S.A., (2008).
As a result, each wind map is slightly different and none is 100% correct, so it is important to draw from as many sources as possible. The International Renewable Energy Agency (IRENA) has created an extremely useful freely available tool, which overlays
ENERGY BOOK PRESS.indb 66 02/09/2014 14:55:18
Energy Part II chapter 2 – The basics
– 67 –
many of the best global wind maps (together with solar resource, population density, electricity grids and much more) onto Google Maps (IRENA, 2013). This enables you to easily compare between the different wind maps that are available in your location. If they all agree that there is good wind in a particular place, then it gives you muchmoreconfidencethattherewillbegoodsitesinthatregion.
2.2.3.3 More information
This section has introduced the basic concepts relating to the wind resource. For further information, please see chapter 3, section 3.2.2: Wind resource – the details, or chapter 4, Further reading.
2.2.4 Hydro resource – the basics
The power available from a water resource is dependent on the potential energy. This is proportional to the height through which thewaterfalls,head,andthemassflowof water(waterdensityxvolumeflowrate).
The equation to calculate input power (in watts) to a hydro scheme is:
Pwater = ρgHQ
ρ (constant) = density of water (1000 kg/m3)
g (constant) = gravitational constant (9.81 m/s2)
H (variable) = head (m)
Q(variable)=volumeflowrate(m3/s) 1
1. For micro-hydro, most flows are <1 m3/s, so flow rates are often stated in litre/s (1000 litre = 1 m3).
ENERGY BOOK PRESS.indb 67 02/09/2014 14:55:18
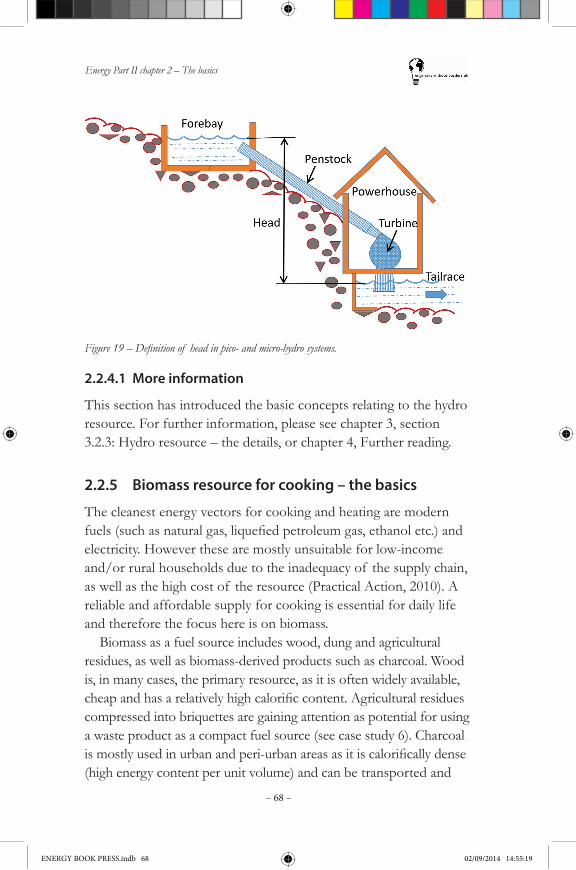
Energy Part II chapter 2 – The basics
– 68 –
Figure 19 – Definition of head in pico- and micro-hydro systems.
2.2.4.1 More information
This section has introduced the basic concepts relating to the hydro resource. For further information, please see chapter 3, section 3.2.3: Hydro resource – the details, or chapter 4, Further reading.
2.2.5 Biomass resource for cooking – the basics
The cleanest energy vectors for cooking and heating are modern fuels(suchasnaturalgas,liquefiedpetroleumgas,ethanoletc.)andelectricity. However these are mostly unsuitable for low-income and/or rural households due to the inadequacy of the supply chain, as well as the high cost of the resource (Practical Action, 2010). A reliable and affordable supply for cooking is essential for daily life and therefore the focus here is on biomass.
Biomass as a fuel source includes wood, dung and agricultural residues, as well as biomass-derived products such as charcoal. Wood is, in many cases, the primary resource, as it is often widely available, cheapandhasarelativelyhighcalorificcontent.Agriculturalresiduescompressed into briquettes are gaining attention as potential for using a waste product as a compact fuel source (see case study 6). Charcoal ismostlyusedinurbanandperi-urbanareasasitiscalorificallydense(high energy content per unit volume) and can be transported and
ENERGY BOOK PRESS.indb 68 02/09/2014 14:55:19
Energy Part II chapter 2 – The basics
– 69 –
stored easily, but as it is a processed product it is more expensive than wood. Charcoal production methods are often highly pollutingandinefficient.Dung,althoughoftenusedinlow-incomehouseholds,ishighlydiscouragedduetoitslowcalorificcontentandhigh health-risks associated with handling and burning it.
As will be discussed in more detail in the improved cookstoves (ICS) section (2.3.4), there are cookstove technologies for all of these potential fuel sources. In principle, a resource assessment on biomass availability (e.g. proximity, size and long-term sustainability of forests,calorificvalueof woodetc.)maybeconducted,butitislikely that such an assessment is unnecessary – ICS interventions aregenerallymeanttoimprovetheefficiency/reducesmokepollution from a resource that is already in use. This will reduce the amount of resource required to achieve the same result (a hot meal), reducing the strain on that resource and therefore increasing its availability. There may of course be cases where switching fuel source can make sense (see case study 6). However for wide scale uptake of a different fuel source, a thorough and specialized resource assessment must be conducted, which is beyond the scope of this section. Encouraging people to switch fuel source for cooking, which is vital and quotidian, would be a high-risk endeavour, as people can endupworseoff if thereliabilityof supplyisnotproperlyidentifiedand soon becomes scarce. We recommend that a local specialist with a good sense of how sustainable a local resource would be (e.g. a forestry expert) should be consulted for any in-depth resource assessment.
ENERGY BOOK PRESS.indb 69 02/09/2014 14:55:19

Energy Part II chapter 2 – The basics
– 70 –
Case study 6: Investigating fuel briquettes made from sugar cane waste
Chesta Tiwari, India, 2011
Biomass (such as wood, animal dung and crop residue) is the primary cooking fuel for the vast majority of the poorest in both rural and urban areas in the developing world. In some parts of the world wood fuel resources are becoming scarcer, and this provides an opportunity to develop technologies which utilize other more accessible and affordable sources of energy.
Prakti Design is a social enterprise based in Tamil Nadu. Prakti designs, manufactures and distributes ICS technology. To help address deforestation through unsustainable wood-fuel usage, they designedthe'Orka'–ahybridstovethatefficientlyusesbothwoodandbriquettes.Theaimwastofindresiduestobriquetteforuseinthe Orka.
Figure A – An example fuel briquette made from sugarcane residue.
Crop residue, left after the main crop is harvested, could be a cheap, local, renewable fuel-source for a rural community. Sugar cane residue was chosen as it is a high biomass yielding annual crop, and a principal Indian crop, so large quantities are available.
ENERGY BOOK PRESS.indb 70 02/09/2014 14:55:20

Energy Part II chapter 2 – The basics
– 71 –
Briquettingisthedensificationof biomassforfuel-increasingnetcalorificvalueperunitvolume,facilitatingbiomassstoragebeyond its season and subsequently reducing relative cost.
Key factors to determine the briquetting potential of residues:
•Residue composition
◊ CalorificValue(higher is better)
◊ Moisture Content (lower is better for combustion)
◊ Particle Size (smaller is better)
•Alternative uses
All existing and potential uses were investigated, as these would affect cost, availability and the value-added. Any edible crop residues were avoided.
Key factors in briquette production:
•Press Design (simple mechanical press up to industrial production – affects density)
•Composition (adding binding agents e.g. clay )
•Area to Volume Ratio (higher is better)
•Homogeneity
Crop residues are susceptible to variability:
•Season to season, year to year
◊ Quantity varies depending on weather conditions, pests and other factors out of farmer’s control.
◊ Quality varies depending on moisture content and particle size. More pre-processing (drying, reducing particle size) necessary would add cost and complexity to the process.
ENERGY BOOK PRESS.indb 71 02/09/2014 14:55:20
Energy Part II chapter 2 – The basics
– 72 –
•Storage is key
◊ Optimal conditions can reduce the pre-processing needed. India’s monsoon season is a challenge for dry storage.
◊ Sugar cane attracts pests – ants infested one batch of residue which had to be thrown away!
Potential application:Sugar cane plantations are the epicentre of some Indian villages with schools on site for workers’ children. Briquettes could be used to cook the school lunches for a cheap, readily available source of fuel with low transportation and storage costs.
Sugar cane is a relatively water and nutrient-demanding crop, yet, desirable for its monetary return. The Indian Government allows only 5% to be converted to ethanol, so when produced in excess, sugar prices are kept low. If residue from less demanding, traditional yet viable crops was successfully briquetted, this could encourage farmers to switch crops, reducing resource-demand.
'The Legacy Foundation' has developed simple presses used world-wide which could be used in community-run briquetting social enterprises. Agro-briquette workshops could be run to teach production technique whilst educating about deforestation.
About the author: Chesta has an interest in environmentally sustainable development and valorising products considered as 'waste'. She came across Prakti Design whilst looking for technical support for an EWB-UK placement she project managed. Later, shearrangedfieldworkthenchoseatitletoresearchwiththemforher Mechanical Engineering and French MEng dissertation.
About the organisation: Prakti Design is an award-winning social enterprise based in Tamil Nadu, India. They specialise in designing affordable ICS technology for communities world-wide. Their designs are tested by local women cooking local food traditionally and with little interference, ensuring they are both adapted to and approved by the end-users.
ENERGY BOOK PRESS.indb 72 02/09/2014 14:55:20
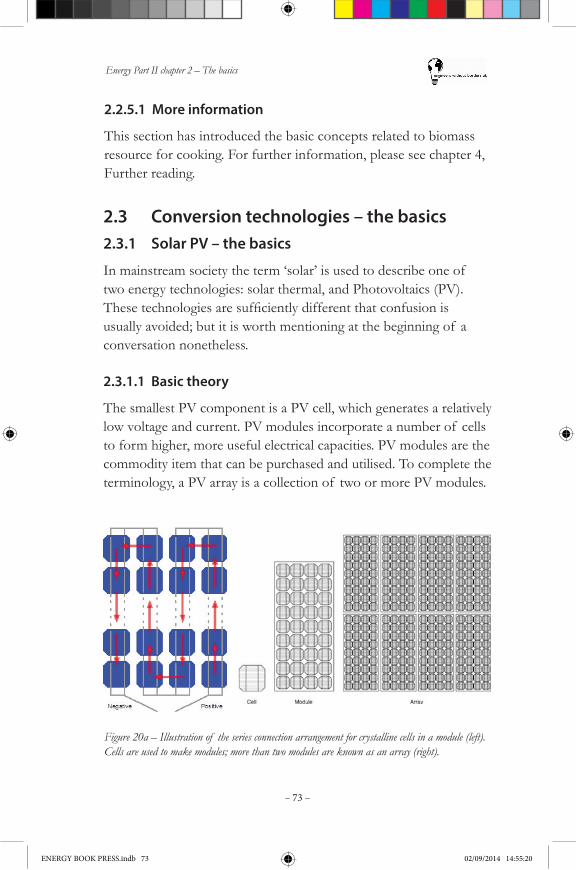
Energy Part II chapter 2 – The basics
– 73 –
2.2.5.1 More information
This section has introduced the basic concepts related to biomass resource for cooking. For further information, please see chapter 4, Further reading.
2.3 Conversion technologies – the basics2.3.1 Solar PV – the basics
In mainstream society the term ‘solar’ is used to describe one of two energy technologies: solar thermal, and Photovoltaics (PV). Thesetechnologiesaresufficientlydifferentthatconfusionisusually avoided; but it is worth mentioning at the beginning of a conversation nonetheless.
2.3.1.1 Basic theory
The smallest PV component is a PV cell, which generates a relatively low voltage and current. PV modules incorporate a number of cells to form higher, more useful electrical capacities. PV modules are the commodity item that can be purchased and utilised. To complete the terminology, a PV array is a collection of two or more PV modules.
Figure 20a – Illustration of the series connection arrangement for crystalline cells in a module (left). Cells are used to make modules; more than two modules are known as an array (right).
ENERGY BOOK PRESS.indb 73 02/09/2014 14:55:20
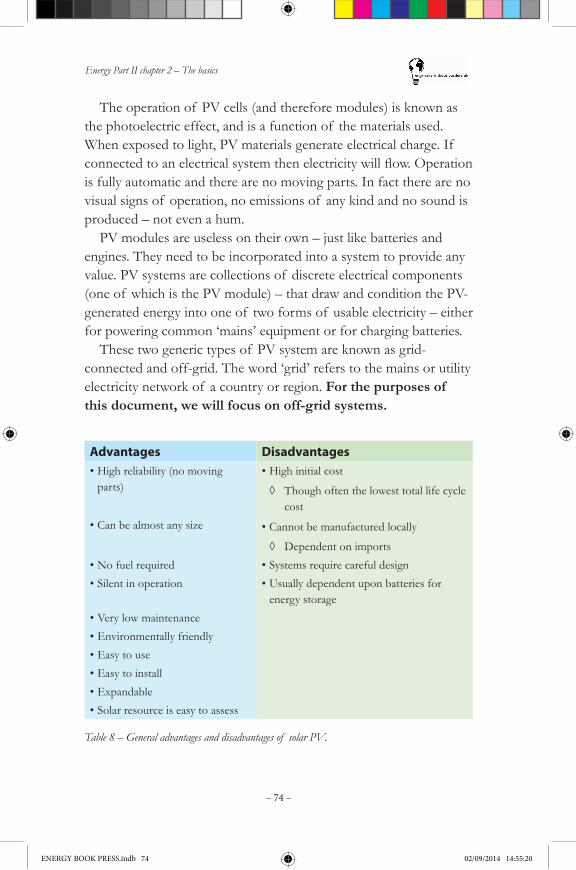
Energy Part II chapter 2 – The basics
– 74 –
The operation of PV cells (and therefore modules) is known as the photoelectric effect, and is a function of the materials used. When exposed to light, PV materials generate electrical charge. If connectedtoanelectricalsystemthenelectricitywillflow.Operationis fully automatic and there are no moving parts. In fact there are no visual signs of operation, no emissions of any kind and no sound is produced – not even a hum.
PV modules are useless on their own – just like batteries and engines. They need to be incorporated into a system to provide any value. PV systems are collections of discrete electrical components (one of which is the PV module) – that draw and condition the PV-generated energy into one of two forms of usable electricity – either for powering common ‘mains’ equipment or for charging batteries.
These two generic types of PV system are known as grid-connected and off-grid. The word ‘grid’ refers to the mains or utility electricity network of a country or region. For the purposes of this document, we will focus on off-grid systems.
Advantages Disadvantages•High reliability (no moving
parts)•High initial cost
◊ Though often the lowest total life cycle cost
•Can be almost any size •Cannot be manufactured locally
◊ Dependent on imports•No fuel required •Systems require careful design•Silent in operation •Usually dependent upon batteries for
energy storage•Very low maintenance•Environmentally friendly•Easy to use•Easy to install•Expandable•Solar resource is easy to assess
Table 8 – General advantages and disadvantages of solar PV.
ENERGY BOOK PRESS.indb 74 02/09/2014 14:55:20
Energy Part II chapter 2 – The basics
– 75 –
Typical applicationsThere are numerous off-grid PV applications and a multitude of solution sizes. The following are examples of those most relevant to the developing world:
Portable and consumer products: torches, LED lanterns, calculators, Solar Home Systems (domestic energy services), radios, battery chargers (AA, AAA, D cells), mobile phone charging, fans, refrigeration.
Regional (mid-sized) solutions: electric fencing, water pumping, Wi-Fi hubs, street lights, navigation lights, professional outdoor and a whole range of monitoring devices, emergency shelters, tents.
Larger (purpose-built) systems: water management and irrigation, container systems (with multiple functionality), site security and a range of remote building and community electricity supplies – often called ‘mini-grids’ because they are used as an alternative to the utility grid.
PV Modules – the commodityPV modules come in a wide range of physical sizes, with different operating voltages and currents, and using one of a number of different materials. However they all function the same way. TheInternetandindustrypublicationsalikearefilledwith
analysis of different PV technologies – real and theoretical – of efficiencies,materialattributes,costs,etc.Butthereareactuallyveryfew commercially available formats for off-grid.
From one PV product to another there are subtle differences in functionality and value for a given application or climate. But these differences can be misleading if not properly understood. This document could include several pages explaining how to select theidealtechnologyforaspecificapplication,butitcouldbethatonly one type of PV module is available in the location required, so is probable that only one of three basic formats can actually be employed.
There are a number of technologies, but nearly all fall into one of the following categories.
ENERGY BOOK PRESS.indb 75 02/09/2014 14:55:20
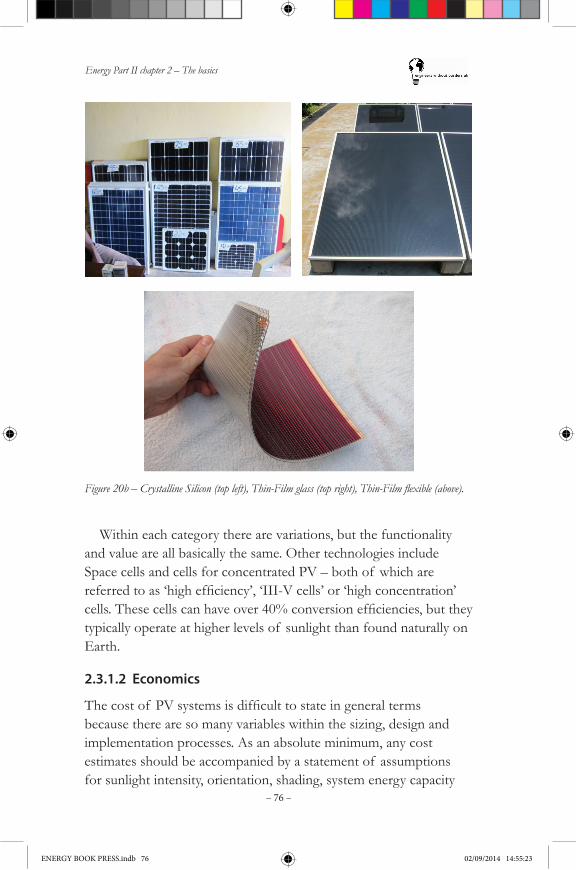
Energy Part II chapter 2 – The basics
– 76 –
Within each category there are variations, but the functionality and value are all basically the same. Other technologies include Space cells and cells for concentrated PV – both of which are referredtoas‘highefficiency’,‘III-Vcells’or‘highconcentration’cells.Thesecellscanhaveover40%conversionefficiencies,buttheytypically operate at higher levels of sunlight than found naturally on Earth.
Figure 20b – Crystalline Silicon (top left), Thin-Film glass (top right), Thin-Film flexible (above).
2.3.1.2 Economics
Thecostof PVsystemsisdifficulttostateingeneraltermsbecause there are so many variables within the sizing, design and implementation processes. As an absolute minimum, any cost estimates should be accompanied by a statement of assumptions for sunlight intensity, orientation, shading, system energy capacity
ENERGY BOOK PRESS.indb 76 02/09/2014 14:55:23

Energy Part II chapter 2 – The basics
– 77 –
and reliability factor, battery autonomy, design life and any pertinent information regarding the installation site.
If an appropriate statement is not present, it should be assumed that the costs are absolute best-case scenarios – and probably not achievable.
PV module costsThe cost of the PV was historically representative of the system cost, but this is less so today due to the huge fall in PV prices over the last three years (since 2011). There are also now great price variations between PV sizes and where they are purchased.
The international trading value of PV is quoted in $/Wp (US dollarsperpeakWatt).Thisfigureisforthelowestpricefromthetop manufacturers. Even one of these manufacturers may only have one of their module sizes at this price (the one produced in the highest volumes), the other products in the range can be over twice the cost.
So if the quotable market price for PV is, say, $1/Wp, this will be for something like a 170Wp grid-connect (high voltage) module. By comparison, a 50Wp off-grid module could be $3/Wp. That module delivered to central Africa (through one or two distributors) can be over $6/Wp.
At the time of writing, a 60Wp product bought in a UK retail outlet (Maplin Electronics) is selling for £250, which is around $480 and so $8/Wp.Thissamevariationcanbefoundinbatteries,thoughthespecific
type of battery tends to be the cause of the price discrepancy rather than the size per se. An automotive battery will likely be far cheaper than a (high cycle) PV battery, but the former is wholly unsuitable, whilst the latter may not be available anyway. A compromise will need to be reached between cost, quality (life) and cost of replacement.
Cost breakdownsAs mentioned above, consumer products such as small lights and Solar home systems (SHS) vary enormously in cost – and of course
ENERGY BOOK PRESS.indb 77 02/09/2014 14:55:23
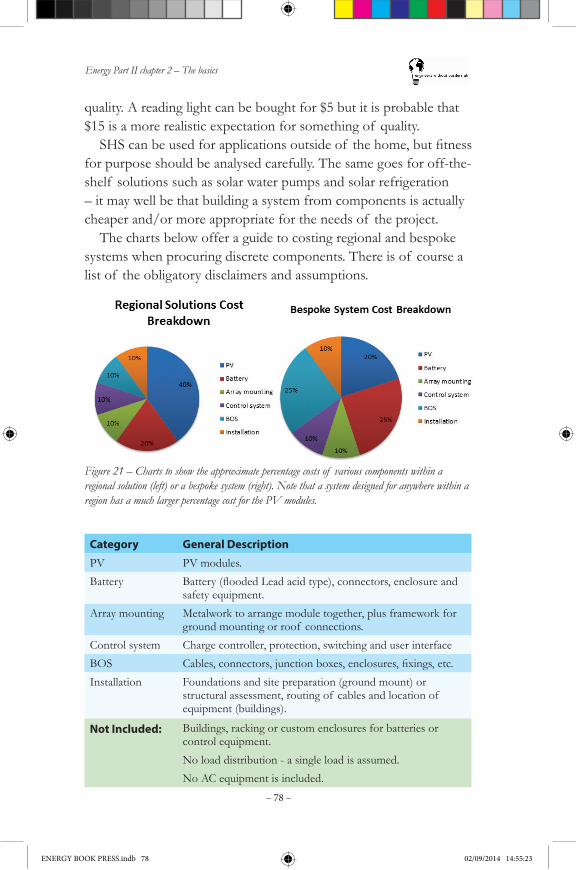
Energy Part II chapter 2 – The basics
– 78 –
quality. A reading light can be bought for $5 but it is probable that $15 is a more realistic expectation for something of quality. SHScanbeusedforapplicationsoutsideof thehome,butfitness
for purpose should be analysed carefully. The same goes for off-the-shelf solutions such as solar water pumps and solar refrigeration – it may well be that building a system from components is actually cheaper and/or more appropriate for the needs of the project.
The charts below offer a guide to costing regional and bespoke systems when procuring discrete components. There is of course a list of the obligatory disclaimers and assumptions.
Category General DescriptionPV PV modules.Battery Battery(floodedLeadacidtype),connectors,enclosureand
safety equipment.Array mounting Metalwork to arrange module together, plus framework for
ground mounting or roof connections.Control system Charge controller, protection, switching and user interfaceBOS Cables,connectors,junctionboxes,enclosures,fixings,etc.Installation Foundations and site preparation (ground mount) or
structural assessment, routing of cables and location of equipment (buildings).
Not Included: Buildings, racking or custom enclosures for batteries or control equipment.No load distribution - a single load is assumed.No AC equipment is included.
Figure 21 – Charts to show the approximate percentage costs of various components within a regional solution (left) or a bespoke system (right). Note that a system designed for anywhere within a region has a much larger percentage cost for the PV modules.
ENERGY BOOK PRESS.indb 78 02/09/2014 14:55:23
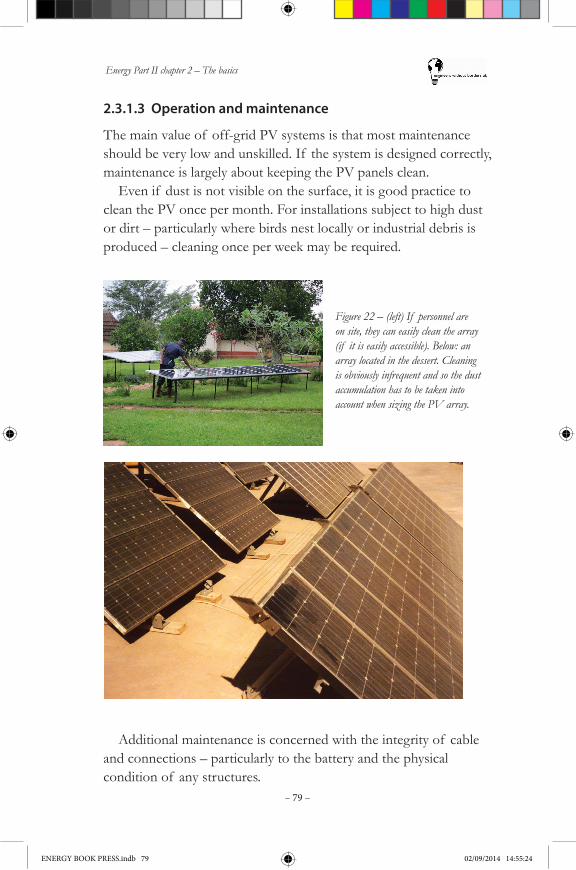
Energy Part II chapter 2 – The basics
– 79 –
2.3.1.3 Operation and maintenance
The main value of off-grid PV systems is that most maintenance should be very low and unskilled. If the system is designed correctly, maintenance is largely about keeping the PV panels clean.
Even if dust is not visible on the surface, it is good practice to clean the PV once per month. For installations subject to high dust or dirt – particularly where birds nest locally or industrial debris is produced – cleaning once per week may be required.
Figure 22 – (left) If personnel are on site, they can easily clean the array (if it is easily accessible). Below: an array located in the dessert. Cleaning is obviously infrequent and so the dust accumulation has to be taken into account when sizing the PV array.
Additional maintenance is concerned with the integrity of cable and connections – particularly to the battery and the physical condition of any structures.
ENERGY BOOK PRESS.indb 79 02/09/2014 14:55:24

Energy Part II chapter 2 – The basics
– 80 –
2.3.1.4 Safety
Electrically, PV modules can be short-circuited or open circuited without self-damage. They are also voltage independent (from a safety perspective) – a 12V PV panel can be connected to a 6V battery and neither will suffer (within appropriate current ratings) – the PV willsimplynotfunctionefficiently.
The main safety hazard for PV is from the combination of improper mounting and high winds that can lift a panel into the air like a sail. Please see 2.4: Practical system design – the basics, for details of the safety hazards involved with the other components in an off-grid PV system.
2.3.1.5 More information
This section has introduced the basic concepts relating to solar PV. For further information, please see chapter 3, section 3.3.1: Solar PV – the details, or chapter 4, Further reading.
2.3.2 Small Wind Turbines (SWTs) – the basics
The wind is a highly unpredictable resource (see section 2.2.3: Wind resource – the basics) and Small Wind Turbines (SWTs) are remarkably troublesome pieces of equipment. If you have a suitable hydro resource or if your budget allows you to obtain enough PV panels to comfortably meet demand throughout the year, then these will almost certainly provide a more reliable, simpler and/or cheaper energy solution. If not, then wind can offer a third option for rural electrification.
However, it is important to mention that the combination of wind and solar in a hybrid system is much greater than the sum of the parts, as the diversity in power generation sources reduces dependence on battery storage. In addition to this, the main advantage that SWTs offer is the ability to manufacture locally. In a development context, import taxes and international shipping are often very costly and local job creation is highly valued. What is more, mechanical technologies suchaswindturbines,requiresignificantamountsof maintenanceand by building local capacity to manufacture, local capacity to operate and maintain can also be created.
ENERGY BOOK PRESS.indb 80 02/09/2014 14:55:24
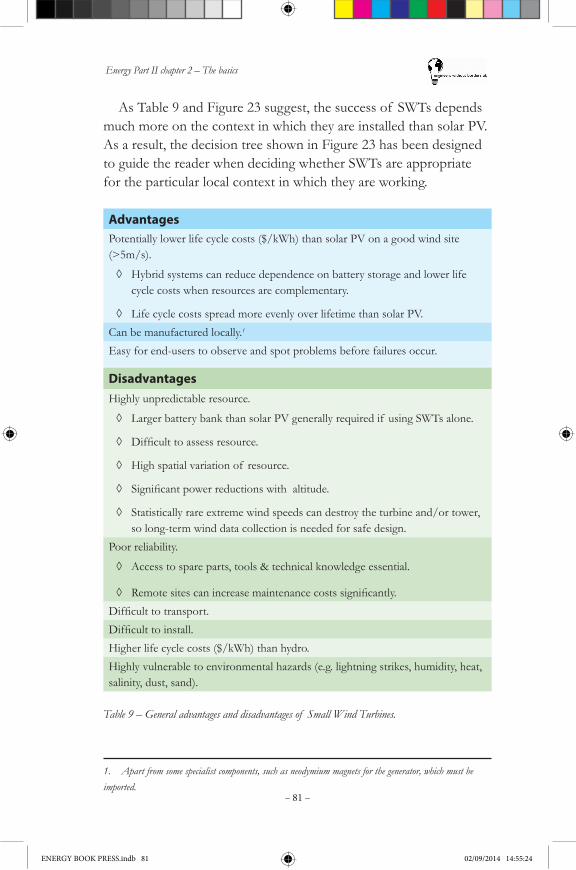
Energy Part II chapter 2 – The basics
– 81 –
As Table 9 and Figure 23 suggest, the success of SWTs depends much more on the context in which they are installed than solar PV. As a result, the decision tree shown in Figure 23 has been designed to guide the reader when deciding whether SWTs are appropriate for the particular local context in which they are working.
AdvantagesPotentially lower life cycle costs ($/kWh) than solar PV on a good wind site (>5m/s).
◊ Hybrid systems can reduce dependence on battery storage and lower life cycle costs when resources are complementary.
◊ Life cycle costs spread more evenly over lifetime than solar PV.Can be manufactured locally.1
Easy for end-users to observe and spot problems before failures occur.
Table 9 – General advantages and disadvantages of Small Wind Turbines.
1. Apart from some specialist components, such as neodymium magnets for the generator, which must be imported.
DisadvantagesHighly unpredictable resource.
◊ Larger battery bank than solar PV generally required if using SWTs alone.
◊ Difficulttoassessresource.
◊ High spatial variation of resource.
◊ Significantpowerreductionswithaltitude.
◊ Statistically rare extreme wind speeds can destroy the turbine and/or tower, so long-term wind data collection is needed for safe design.
Poor reliability.
◊ Access to spare parts, tools & technical knowledge essential.
◊ Remotesitescanincreasemaintenancecostssignificantly.Difficulttotransport.Difficulttoinstall.Higher life cycle costs ($/kWh) than hydro.Highly vulnerable to environmental hazards (e.g. lightning strikes, humidity, heat, salinity, dust, sand).
ENERGY BOOK PRESS.indb 81 02/09/2014 14:55:24
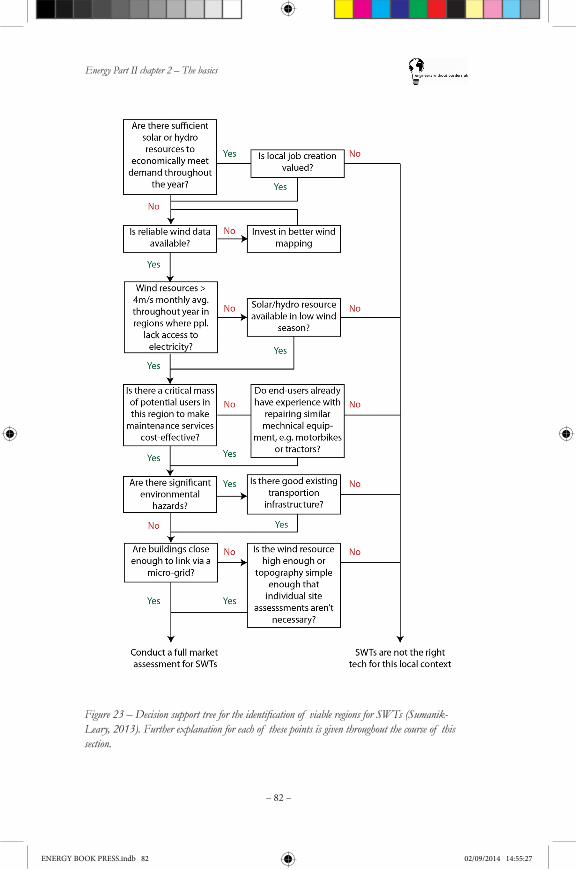
Energy Part II chapter 2 – The basics
– 82 –
Figure 23 – Decision support tree for the identification of viable regions for SWTs (Sumanik-Leary, 2013). Further explanation for each of these points is given throughout the course of this section.
ENERGY BOOK PRESS.indb 82 02/09/2014 14:55:27

Energy Part II chapter 2 – The basics
– 83 –
2.3.2.1 Typical Applications
Due to the variability in the wind resource, in off-grid applications SWTs are almost always used to charge batteries 1. Small systems can be used to supply electricity to a home, but are much more complicated than a typical solar home system. Solar PV is extremely modular (1 kWh from a 50 W solar panel is not that much more expensive than 1 kWh from a 5 kW solar array), making it ideal for dispersed communities, where each household has a very low power demand and interconnection is not an appropriate solution. In contrast, a 5 kW wind turbine will produce much cheaper power than a 50 W wind turbine. In a development context, where the ability to pay is low, this makes wind more appropriate for higher power applications such as agriculture (irrigation, agricultural processing equipment), small businesses (power tools, fridges/freezers), community services (lighting and computers for schools or health centres, water pumping, etc.) or a micro-grid to supply multiple households (see Figure 24).
1. Although variable loads such as water pumping and grain milling can be used without batteries, as water tanks and buckets of flour can be used as storage in place of batteries.
Figure 24 – Raising the tower of 1 kW locally manufactured small wind turbine in the village of Cuajinicuil, Nicaragua. Together with a 500 W solar array, the turbine was designed to supply a micro-grid that powers 14 households, a water pump for irrigation and water distribution and a food processor for a small business based on fruit preservation.
ENERGY BOOK PRESS.indb 83 02/09/2014 14:55:27
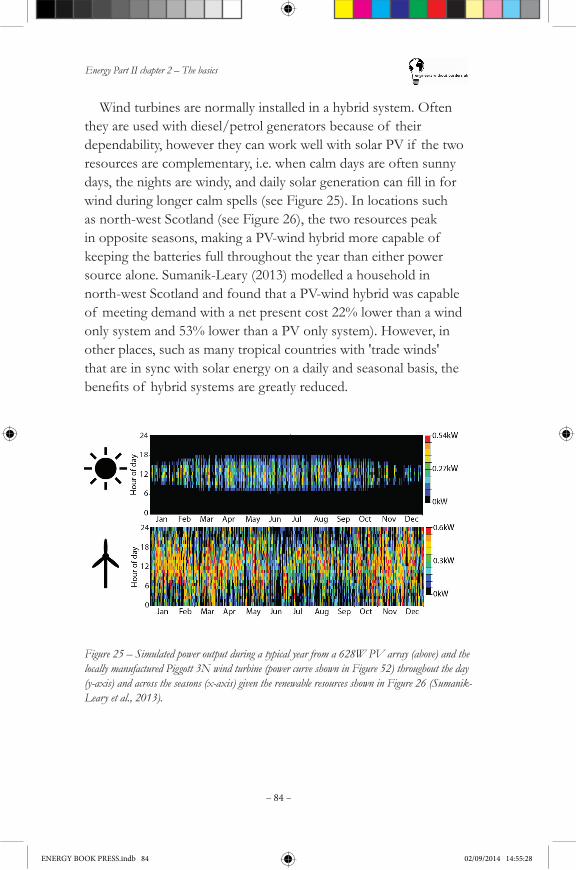
Energy Part II chapter 2 – The basics
– 84 –
Wind turbines are normally installed in a hybrid system. Often they are used with diesel/petrol generators because of their dependability, however they can work well with solar PV if the two resources are complementary, i.e. when calm days are often sunny days,thenightsarewindy,anddailysolargenerationcanfillinforwind during longer calm spells (see Figure 25). In locations such as north-west Scotland (see Figure 26), the two resources peak in opposite seasons, making a PV-wind hybrid more capable of keeping the batteries full throughout the year than either power source alone. Sumanik-Leary (2013) modelled a household in north-west Scotland and found that a PV-wind hybrid was capable of meeting demand with a net present cost 22% lower than a wind only system and 53% lower than a PV only system). However, in other places, such as many tropical countries with 'trade winds' that are in sync with solar energy on a daily and seasonal basis, the benefitsof hybridsystemsaregreatlyreduced.
Figure 25 – Simulated power output during a typical year from a 628W PV array (above) and the locally manufactured Piggott 3N wind turbine (power curve shown in Figure 52) throughout the day (y-axis) and across the seasons (x-axis) given the renewable resources shown in Figure 26 (Sumanik-Leary et al., 2013).
ENERGY BOOK PRESS.indb 84 02/09/2014 14:55:28
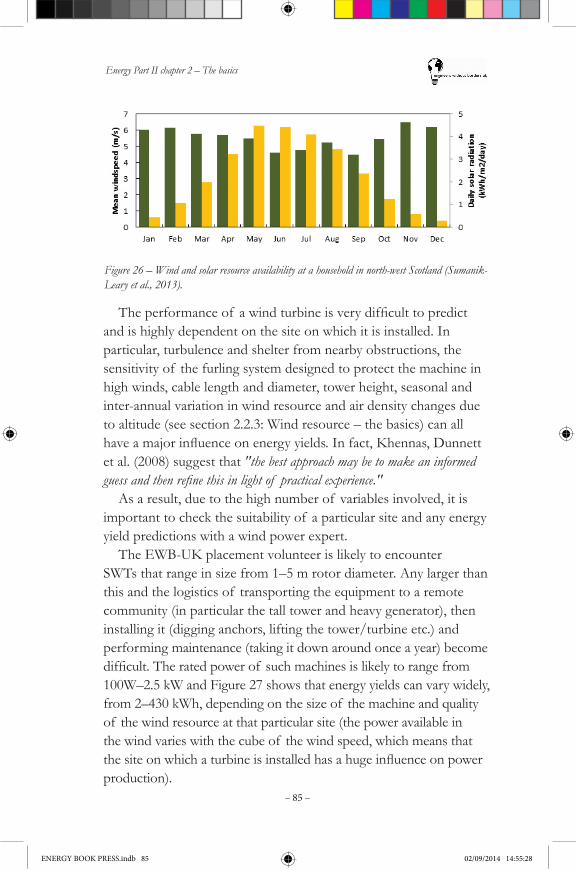
Energy Part II chapter 2 – The basics
– 85 –
Figure 26 – Wind and solar resource availability at a household in north-west Scotland (Sumanik-Leary et al., 2013).
Theperformanceof awindturbineisverydifficulttopredictand is highly dependent on the site on which it is installed. In particular, turbulence and shelter from nearby obstructions, the sensitivity of the furling system designed to protect the machine in high winds, cable length and diameter, tower height, seasonal and inter-annual variation in wind resource and air density changes due to altitude (see section 2.2.3: Wind resource – the basics) can all haveamajorinfluenceonenergyyields.Infact,Khennas,Dunnettet al. (2008) suggest that "the best approach may be to make an informed guess and then refine this in light of practical experience."
As a result, due to the high number of variables involved, it is important to check the suitability of a particular site and any energy yield predictions with a wind power expert.
The EWB-UK placement volunteer is likely to encounter SWTs that range in size from 1–5 m rotor diameter. Any larger than this and the logistics of transporting the equipment to a remote community (in particular the tall tower and heavy generator), then installing it (digging anchors, lifting the tower/turbine etc.) and performing maintenance (taking it down around once a year) become difficult.Theratedpowerof suchmachinesislikelytorangefrom100W–2.5 kW and Figure 27 shows that energy yields can vary widely, from 2–430 kWh, depending on the size of the machine and quality of the wind resource at that particular site (the power available in the wind varies with the cube of the wind speed, which means that thesiteonwhichaturbineisinstalledhasahugeinfluenceonpowerproduction).
ENERGY BOOK PRESS.indb 85 02/09/2014 14:55:28
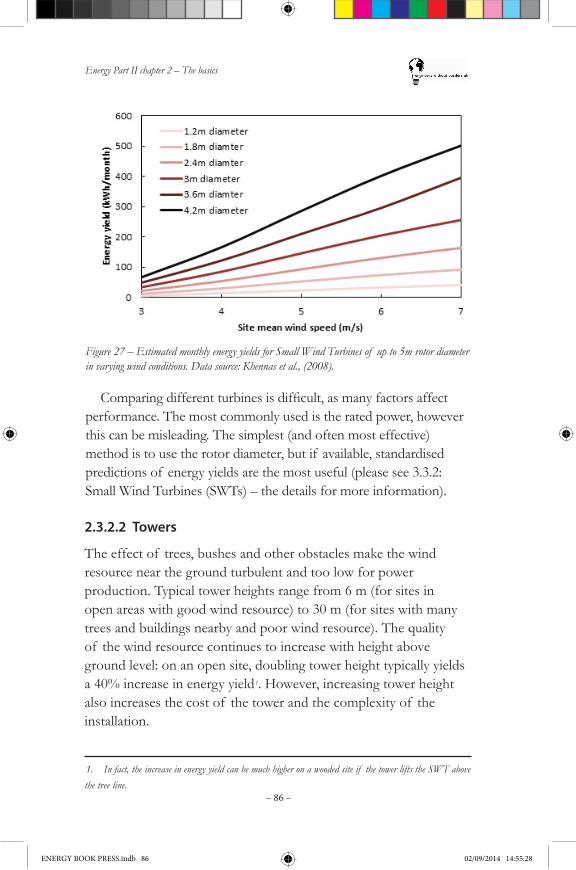
Energy Part II chapter 2 – The basics
– 86 –
Comparingdifferentturbinesisdifficult,asmanyfactorsaffectperformance. The most commonly used is the rated power, however this can be misleading. The simplest (and often most effective) method is to use the rotor diameter, but if available, standardised predictions of energy yields are the most useful (please see 3.3.2: Small Wind Turbines (SWTs) – the details for more information).
Figure 27 – Estimated monthly energy yields for Small Wind Turbines of up to 5m rotor diameter in varying wind conditions. Data source: Khennas et al., (2008).
2.3.2.2 Towers
The effect of trees, bushes and other obstacles make the wind resource near the ground turbulent and too low for power production. Typical tower heights range from 6 m (for sites in open areas with good wind resource) to 30 m (for sites with many trees and buildings nearby and poor wind resource). The quality of the wind resource continues to increase with height above ground level: on an open site, doubling tower height typically yields a 40% increase in energy yield 1. However, increasing tower height also increases the cost of the tower and the complexity of the installation.
1. In fact, the increase in energy yield can be much higher on a wooded site if the tower lifts the SWT above the tree line.
ENERGY BOOK PRESS.indb 86 02/09/2014 14:55:28
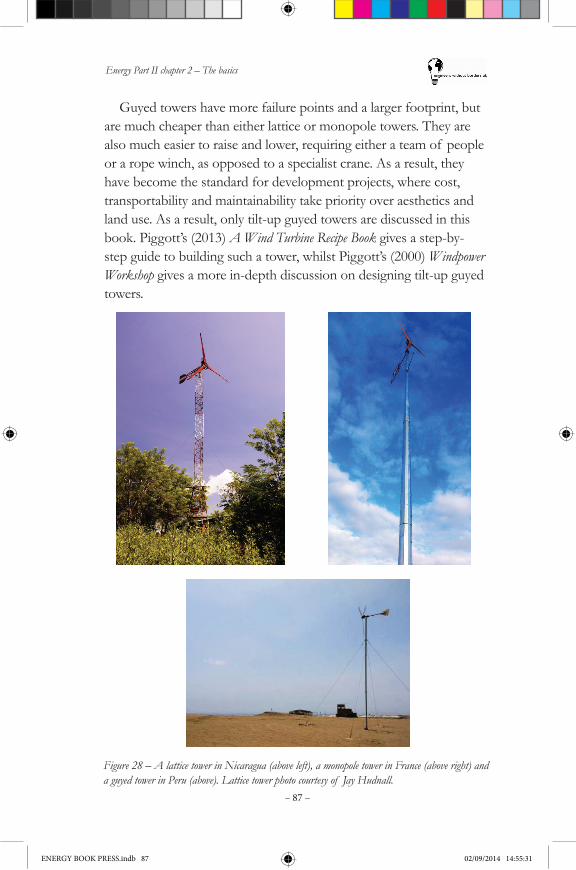
Energy Part II chapter 2 – The basics
– 87 –
Guyed towers have more failure points and a larger footprint, but are much cheaper than either lattice or monopole towers. They are also much easier to raise and lower, requiring either a team of people or a rope winch, as opposed to a specialist crane. As a result, they have become the standard for development projects, where cost, transportability and maintainability take priority over aesthetics and land use. As a result, only tilt-up guyed towers are discussed in this book. Piggott’s (2013) A Wind Turbine Recipe Book gives a step-by-step guide to building such a tower, whilst Piggott’s (2000) Windpower Workshop gives a more in-depth discussion on designing tilt-up guyed towers.
Figure 28 – A lattice tower in Nicaragua (above left), a monopole tower in France (above right) and a guyed tower in Peru (above). Lattice tower photo courtesy of Jay Hudnall.
ENERGY BOOK PRESS.indb 87 02/09/2014 14:55:31
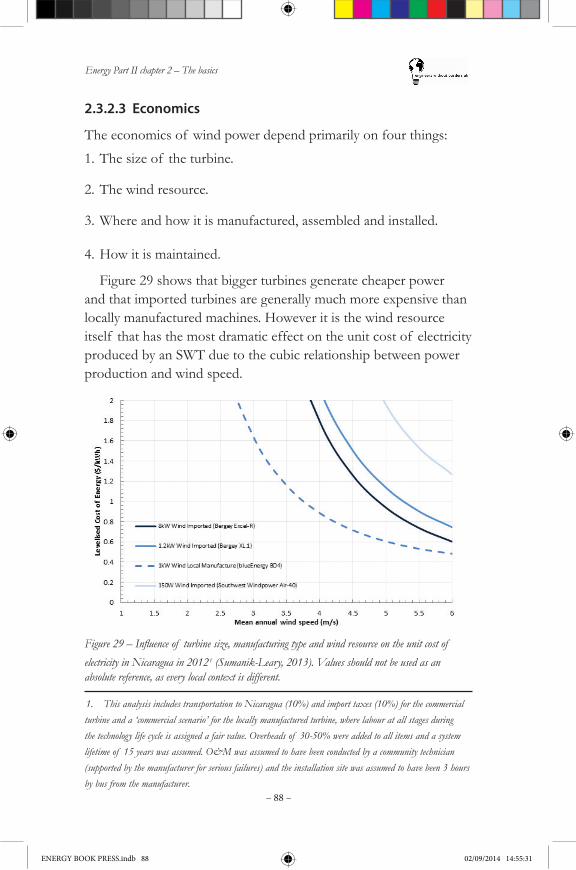
Energy Part II chapter 2 – The basics
– 88 –
2.3.2.3 Economics
The economics of wind power depend primarily on four things:
1. The size of the turbine.
2. The wind resource.
3. Where and how it is manufactured, assembled and installed.
4. How it is maintained.
Figure 29 shows that bigger turbines generate cheaper power and that imported turbines are generally much more expensive than locally manufactured machines. However it is the wind resource itself that has the most dramatic effect on the unit cost of electricity produced by an SWT due to the cubic relationship between power production and wind speed.
Figure 29 – Influence of turbine size, manufacturing type and wind resource on the unit cost of electricity in Nicaragua in 2012 1 (Sumanik-Leary, 2013). Values should not be used as an absolute reference, as every local context is different.
1. This analysis includes transportation to Nicaragua (10%) and import taxes (10%) for the commercial turbine and a ‘commercial scenario’ for the locally manufactured turbine, where labour at all stages during the technology life cycle is assigned a fair value. Overheads of 30-50% were added to all items and a system lifetime of 15 years was assumed. O&M was assumed to have been conducted by a community technician (supported by the manufacturer for serious failures) and the installation site was assumed to have been 3 hours by bus from the manufacturer.
ENERGY BOOK PRESS.indb 88 02/09/2014 14:55:31
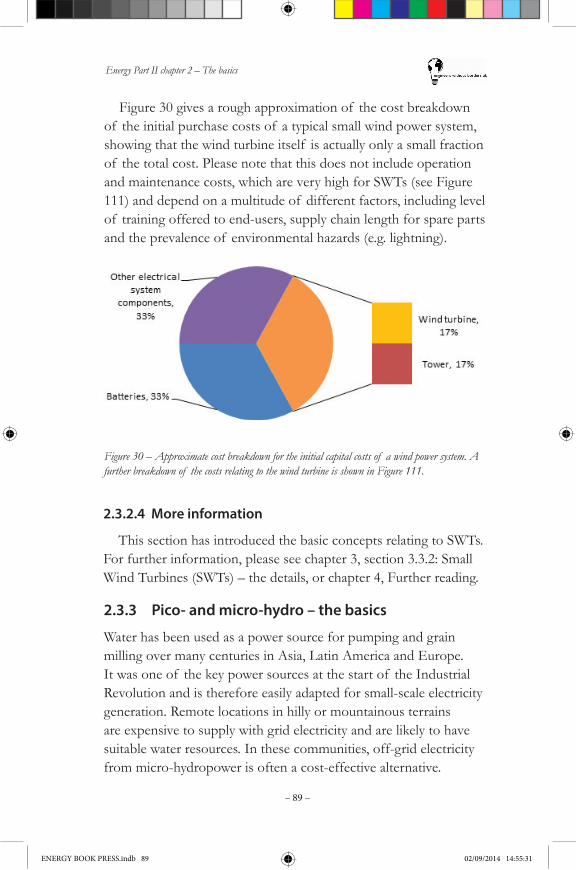
Energy Part II chapter 2 – The basics
– 89 –
Figure 30 gives a rough approximation of the cost breakdown of the initial purchase costs of a typical small wind power system, showing that the wind turbine itself is actually only a small fraction of the total cost. Please note that this does not include operation and maintenance costs, which are very high for SWTs (see Figure 111) and depend on a multitude of different factors, including level of training offered to end-users, supply chain length for spare parts and the prevalence of environmental hazards (e.g. lightning).
Figure 30 – Approximate cost breakdown for the initial capital costs of a wind power system. A further breakdown of the costs relating to the wind turbine is shown in Figure 111.
2.3.2.4 More information
This section has introduced the basic concepts relating to SWTs. For further information, please see chapter 3, section 3.3.2: Small Wind Turbines (SWTs) – the details, or chapter 4, Further reading.
2.3.3 Pico- and micro-hydro – the basics
Water has been used as a power source for pumping and grain milling over many centuries in Asia, Latin America and Europe. It was one of the key power sources at the start of the Industrial Revolution and is therefore easily adapted for small-scale electricity generation. Remote locations in hilly or mountainous terrains are expensive to supply with grid electricity and are likely to have suitable water resources. In these communities, off-grid electricity from micro-hydropower is often a cost-effective alternative.
ENERGY BOOK PRESS.indb 89 02/09/2014 14:55:31
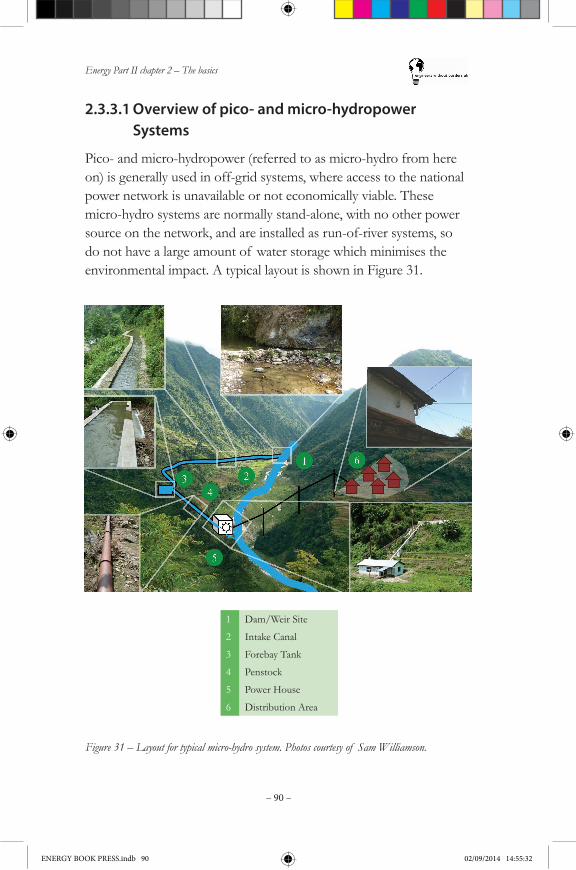
Energy Part II chapter 2 – The basics
– 90 –
2.3.3.1 Overview of pico- and micro-hydropower Systems
Pico- and micro-hydropower (referred to as micro-hydro from here on) is generally used in off-grid systems, where access to the national power network is unavailable or not economically viable. These micro-hydro systems are normally stand-alone, with no other power source on the network, and are installed as run-of-river systems, so do not have a large amount of water storage which minimises the environmental impact. A typical layout is shown in Figure 31.
1 Dam/Weir Site
2 Intake Canal
3 Forebay Tank
4 Penstock
5 Power House
6 Distribution Area
Figure 31 – Layout for typical micro-hydro system. Photos courtesy of Sam Williamson.
ENERGY BOOK PRESS.indb 90 02/09/2014 14:55:32

Energy Part II chapter 2 – The basics
– 91 –
At the weir site, some of the water from the river is diverted into anintakecanal.Theweirisusedtokeeptheflowtotheturbineconstant,extractingwaterduringbothhighandlowflowperiods.The water then follows a path along an intake canal, which leads to the forebay tank. The forebay tank provides a small amount of water storage for the system, and has the inlet to the penstock (pipe leading from the tank to the turbine) built into it. In some very small schemes a forebay tank may not be needed, if the pipe intake can be located in a pool in the stream.
Depending on the steepness of the stream or river, there are different options for the canal and penstock. If the stream is steep, it makes sense to have a short canal to enable the forebay tank to belocatedawayfromwhereitcouldbedamagedbyflooding.Fromthere, the penstock falls parallel to the stream to a point where the power house can be located. In other cases, it makes sense to have a longer canal, running almost along the contour to a point at which the forebay is sited above the power house. The penstock can be taken down the shortest slope to the power house. In some low head sites, a penstock may not be required due to the design of the turbine.
At the forebay, a trash rack is used to remove any larger pieces of flotsamfromthewaterbeforeitentersthepenstock.Thewaterflowsdownthepenstocktothepowerhouse,wheretheturbine,generator and electrical equipment is located, and then exits the powerhouse through the tailrace. The power from the generator is then transmitted through power lines to the transmission area, where it is connected to the consumers.
2.3.3.2 Advantages and disadvantages of micro- hydropower
In comparison to other energy generation options, hydropower tends to be lower cost over the life of the project because the main parts of the system have a long lifetime and the capacity factor can be quite good. The capacity factor, i.e. the average output power as a percentage of the full output, is typically 35% for small hydro, whereas small wind generators have a capacity factor of 20–25%,
ENERGY BOOK PRESS.indb 91 02/09/2014 14:55:32
Energy Part II chapter 2 – The basics
– 92 –
and solar power can sometimes have even lower values.However, each site has different characteristics, so requires
individual design including the correct selection of the turbine type and basic dimensions. This, and the fact that very small (< 1 kW) schemeshaverelativelypoorefficiency,meansthatitisusuallybetterto connect to several households to create a reasonable demand for the power.
Typically, hydro systems will generate mains voltage alternating current supply. This presents some additional challenges in terms of the distribution of the power, but enables the power to travel longer distances and to be used with standard mains-voltage light bulbs and appliances, which are likely to be cheaper and more widely available than special low-voltage ones.
Pico- and micro-hydro equipment is capable of being manufactured using basic workshop facilities and does not need tobeimported.Pelton,Crossflowandsomeaxialturbinescanbefabricated from sheet metal and simple castings, whilst an electronic load controller (ELC) or induction generator controller (IGC) can be can be assembled without the need for specialist equipment. This can have advantages, not just because of cost, but also because local manufacture implies local expertise in repair and maintenance and allows systems to be easily customised for the wide variety of sites. Although not always appropriate, the concept of developing local skills meets the overall philosophy of EWB-UK as discussed in case study 7.
ENERGY BOOK PRESS.indb 92 02/09/2014 14:55:32
Energy Part II chapter 2 – The basics
– 93 –
Case study 7: Pico-hydro turbine development
Ryan Dunne & Alasdair Grainger, Sri Lanka, 2007
This project was part of an on-going collaboration between Practical Action and EWB-UK in Sri Lanka. The partnership had focused on the research and development of pico-hydro turbines built and used in the hill country of Sri Lanka. These are the smallest and simplest type of hydro turbine, built in local welding shops out of recycled components and typically offering just 10–100 W of electrical power output. They are bought and used by local villagers to power radios and light bulbs, not only offering entry level access to electricity but also supporting a local industry of affordable turbine production.
A project carried out the year before had sought to test and document the performance of existing pico-hydro turbines, concludingthatefficiencieswereverylow.The2007projectwasthenextstep,totryandimprovetheseefficienciesthroughdesignchanges to the turbines, while still using locally sourced and manufactured components.
We experimented on both the electrical and mechanical designs. Trials were carried out in a remote rural community, with mechanical components (principally turbine runners) manufactured in the nearest welding shop and electrical components (light bulbs, capacitors, old motorbike alternators, etc.) purchased in a regional town. Further testing and research was carried out in a government test facility near the capital.
The results were positive, design variations of the turbine runnerfoundefficiencyimprovementsof 12%couldbemadeontheprevailingdesignwithoutsignificantadditionalcomplexity.Local manufacturing was a crucial part of the Practical Action philosophy,aimingtodevelopself-sufficientcommunities,butwasalsothelimitationtoreachingthehighermechanicalefficienciesachieved with precision manufacturing. Thefindingsof theelectricalworkwerethattheuseof capacitors
toimprovethepowerfactorof thegeneratorwasbeneficial–thoughtheimprovementvariedsignificantly.
ENERGY BOOK PRESS.indb 93 02/09/2014 14:55:32
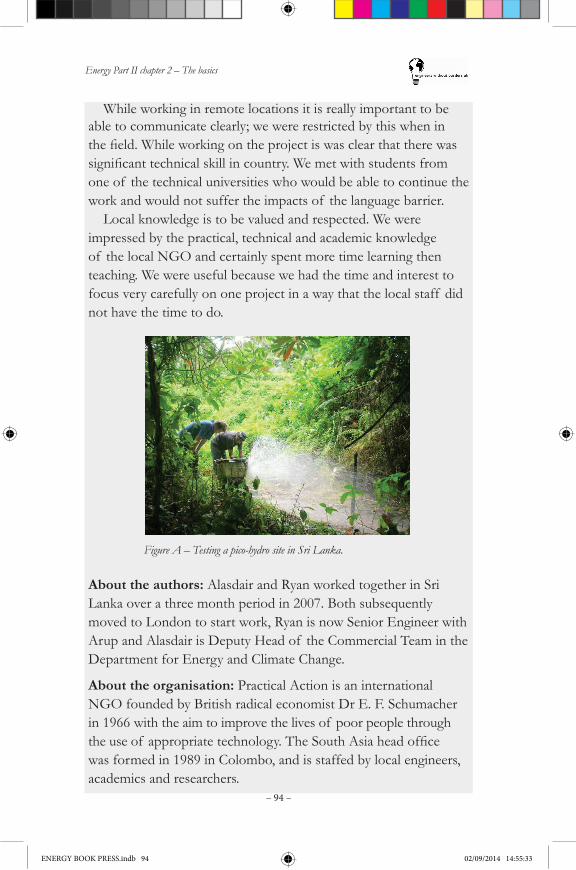
Energy Part II chapter 2 – The basics
– 94 –
While working in remote locations it is really important to be able to communicate clearly; we were restricted by this when in thefield.Whileworkingontheprojectiswasclearthattherewassignificanttechnicalskillincountry.Wemetwithstudentsfromone of the technical universities who would be able to continue the work and would not suffer the impacts of the language barrier.
Local knowledge is to be valued and respected. We were impressed by the practical, technical and academic knowledge of the local NGO and certainly spent more time learning then teaching. We were useful because we had the time and interest to focus very carefully on one project in a way that the local staff did not have the time to do.
About the authors: Alasdair and Ryan worked together in Sri Lanka over a three month period in 2007. Both subsequently moved to London to start work, Ryan is now Senior Engineer with Arup and Alasdair is Deputy Head of the Commercial Team in the Department for Energy and Climate Change.
About the organisation: Practical Action is an international NGO founded by British radical economist Dr E. F. Schumacher in 1966 with the aim to improve the lives of poor people through theuseof appropriatetechnology.TheSouthAsiaheadofficewas formed in 1989 in Colombo, and is staffed by local engineers, academics and researchers.
Figure A – Testing a pico-hydro site in Sri Lanka.
ENERGY BOOK PRESS.indb 94 02/09/2014 14:55:33
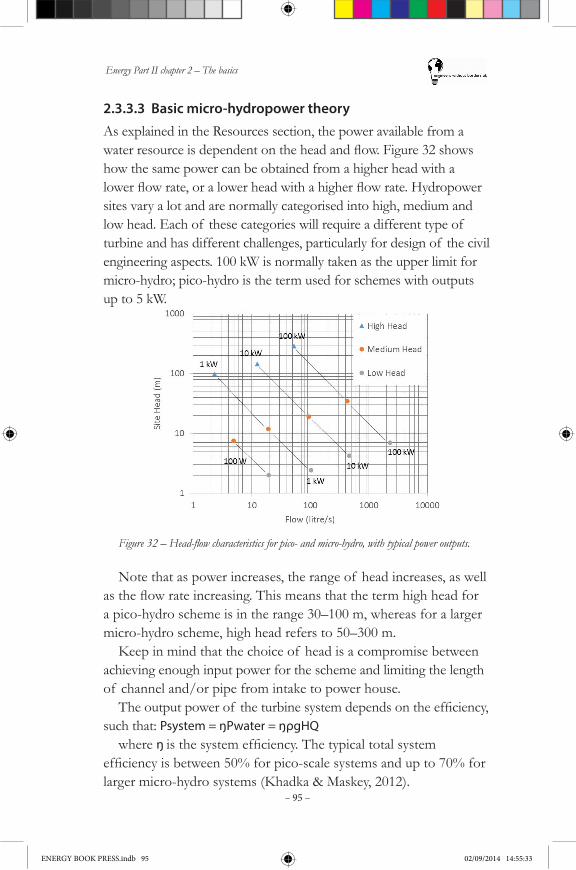
Energy Part II chapter 2 – The basics
– 95 –
2.3.3.3 Basic micro-hydropower theory
As explained in the Resources section, the power available from a waterresourceisdependentontheheadandflow.Figure32showshow the same power can be obtained from a higher head with a lowerflowrate,oralowerheadwithahigherflowrate.Hydropowersites vary a lot and are normally categorised into high, medium and low head. Each of these categories will require a different type of turbine and has different challenges, particularly for design of the civil engineering aspects. 100 kW is normally taken as the upper limit for micro-hydro; pico-hydro is the term used for schemes with outputs up to 5 kW.
Figure 32 – Head-flow characteristics for pico- and micro-hydro, with typical power outputs.
Note that as power increases, the range of head increases, as well astheflowrateincreasing.Thismeansthatthetermhighheadfora pico-hydro scheme is in the range 30–100 m, whereas for a larger micro-hydro scheme, high head refers to 50–300 m.
Keep in mind that the choice of head is a compromise between achieving enough input power for the scheme and limiting the length of channel and/or pipe from intake to power house.Theoutputpowerof theturbinesystemdependsontheefficiency,
such that: Psystem = ŋPwater = ŋρgHQwhere ŋ isthesystemefficiency.Thetypicaltotalsystem
efficiencyisbetween50%forpico-scalesystemsandupto70%forlarger micro-hydro systems (Khadka & Maskey, 2012).
ENERGY BOOK PRESS.indb 95 02/09/2014 14:55:33
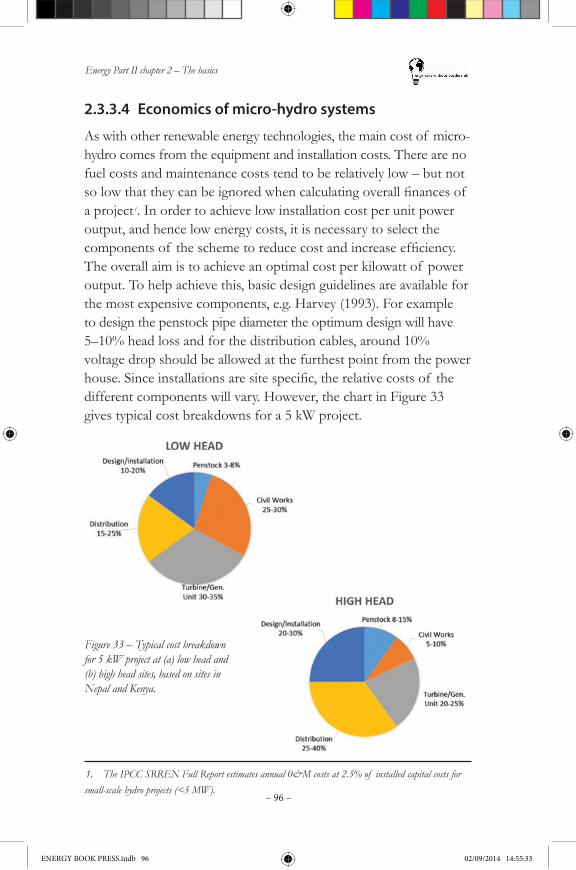
Energy Part II chapter 2 – The basics
– 96 –
2.3.3.4 Economics of micro-hydro systems
As with other renewable energy technologies, the main cost of micro-hydro comes from the equipment and installation costs. There are no fuel costs and maintenance costs tend to be relatively low – but not solowthattheycanbeignoredwhencalculatingoverallfinancesof a project 1. In order to achieve low installation cost per unit power output, and hence low energy costs, it is necessary to select the componentsof theschemetoreducecostandincreaseefficiency.The overall aim is to achieve an optimal cost per kilowatt of power output. To help achieve this, basic design guidelines are available for the most expensive components, e.g. Harvey (1993). For example to design the penstock pipe diameter the optimum design will have 5–10% head loss and for the distribution cables, around 10% voltage drop should be allowed at the furthest point from the power house.Sinceinstallationsaresitespecific,therelativecostsof thedifferent components will vary. However, the chart in Figure 33 gives typical cost breakdowns for a 5 kW project.
1. The IPCC SRREN Full Report estimates annual 0&M costs at 2.5% of installed capital costs for small-scale hydro projects (<5 MW).
Figure 33 – Typical cost breakdown for 5 kW project at (a) low head and (b) high head sites, based on sites in Nepal and Kenya.
ENERGY BOOK PRESS.indb 96 02/09/2014 14:55:33
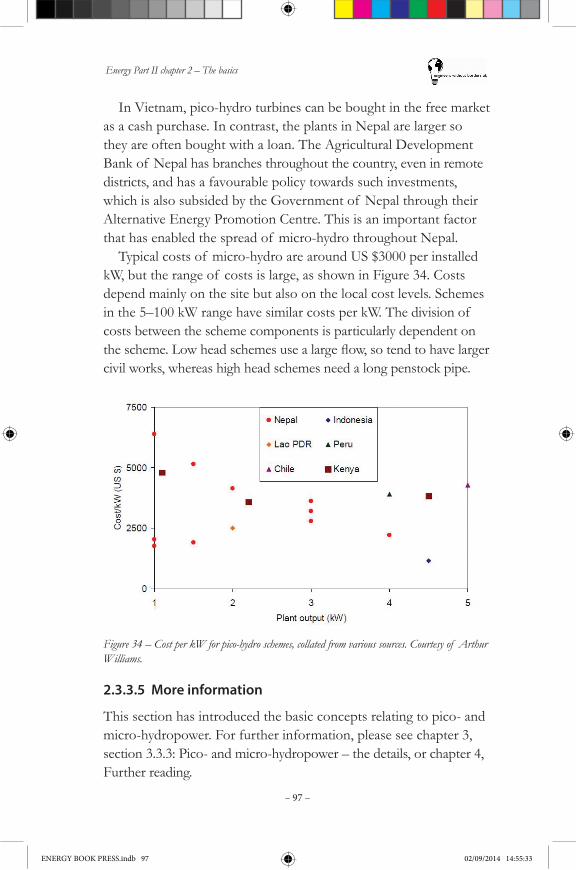
Energy Part II chapter 2 – The basics
– 97 –
In Vietnam, pico-hydro turbines can be bought in the free market as a cash purchase. In contrast, the plants in Nepal are larger so they are often bought with a loan. The Agricultural Development Bank of Nepal has branches throughout the country, even in remote districts, and has a favourable policy towards such investments, which is also subsided by the Government of Nepal through their Alternative Energy Promotion Centre. This is an important factor that has enabled the spread of micro-hydro throughout Nepal.
Typical costs of micro-hydro are around US $3000 per installed kW, but the range of costs is large, as shown in Figure 34. Costs depend mainly on the site but also on the local cost levels. Schemes in the 5–100 kW range have similar costs per kW. The division of costs between the scheme components is particularly dependent on thescheme.Lowheadschemesusealargeflow,sotendtohavelargercivil works, whereas high head schemes need a long penstock pipe.
Figure 34 – Cost per kW for pico-hydro schemes, collated from various sources. Courtesy of Arthur Williams.
2.3.3.5 More information
This section has introduced the basic concepts relating to pico- and micro-hydropower. For further information, please see chapter 3, section 3.3.3: Pico- and micro-hydropower – the details, or chapter 4, Further reading.
ENERGY BOOK PRESS.indb 97 02/09/2014 14:55:33
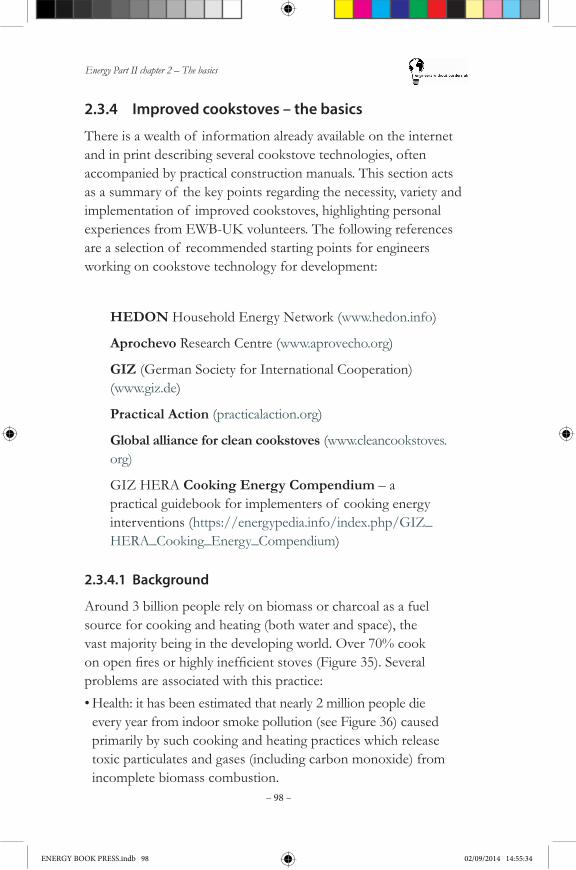
Energy Part II chapter 2 – The basics
– 98 –
2.3.4 Improved cookstoves – the basics
There is a wealth of information already available on the internet and in print describing several cookstove technologies, often accompanied by practical construction manuals. This section acts as a summary of the key points regarding the necessity, variety and implementation of improved cookstoves, highlighting personal experiences from EWB-UK volunteers. The following references are a selection of recommended starting points for engineers working on cookstove technology for development:
HEDON Household Energy Network (www.hedon.info)
Aprochevo Research Centre (www.aprovecho.org)
GIZ (German Society for International Cooperation) (www.giz.de)
Practical Action (practicalaction.org)
Global alliance for clean cookstoves (www.cleancookstoves.org)
GIZ HERA Cooking Energy Compendium – a practical guidebook for implementers of cooking energy interventions (https://energypedia.info/index.php/GIZ_HERA_Cooking_Energy_Compendium)
2.3.4.1 Background
Around 3 billion people rely on biomass or charcoal as a fuel source for cooking and heating (both water and space), the vast majority being in the developing world. Over 70% cook onopenfiresorhighlyinefficientstoves(Figure35).Severalproblems are associated with this practice:•Health: it has been estimated that nearly 2 million people die
every year from indoor smoke pollution (see Figure 36) caused primarily by such cooking and heating practices which release toxic particulates and gases (including carbon monoxide) from incomplete biomass combustion.
ENERGY BOOK PRESS.indb 98 02/09/2014 14:55:34
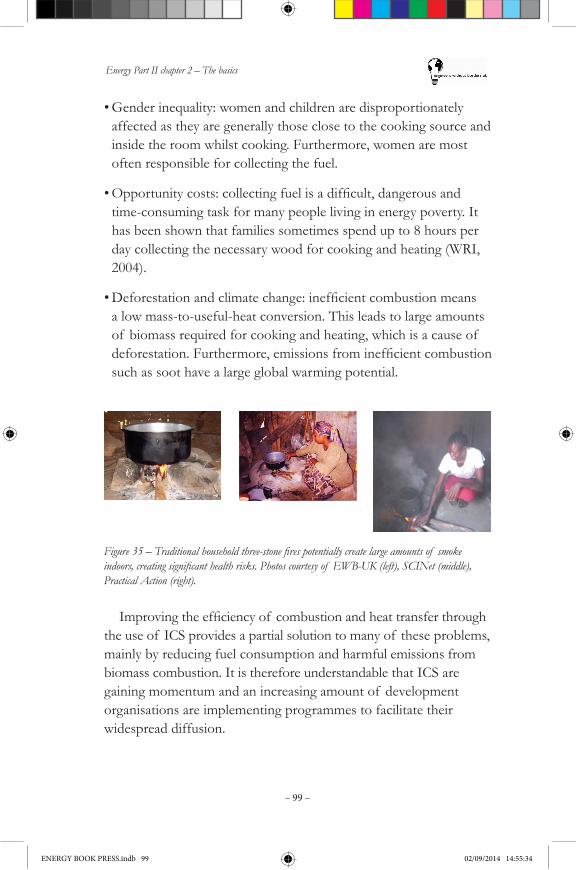
Energy Part II chapter 2 – The basics
– 99 –
•Gender inequality: women and children are disproportionately affected as they are generally those close to the cooking source and inside the room whilst cooking. Furthermore, women are most often responsible for collecting the fuel.
•Opportunitycosts:collectingfuelisadifficult,dangerousandtime-consuming task for many people living in energy poverty. It has been shown that families sometimes spend up to 8 hours per day collecting the necessary wood for cooking and heating (WRI, 2004).
•Deforestationandclimatechange:inefficientcombustionmeansa low mass-to-useful-heat conversion. This leads to large amounts of biomass required for cooking and heating, which is a cause of deforestation.Furthermore,emissionsfrominefficientcombustionsuch as soot have a large global warming potential.
Figure 35 – Traditional household three-stone fires potentially create large amounts of smoke indoors, creating significant health risks. Photos courtesy of EWB-UK (left), SCINet (middle), Practical Action (right).
Improvingtheefficiencyof combustionandheattransferthroughthe use of ICS provides a partial solution to many of these problems, mainly by reducing fuel consumption and harmful emissions from biomass combustion. It is therefore understandable that ICS are gaining momentum and an increasing amount of development organisations are implementing programmes to facilitate their widespread diffusion.
ENERGY BOOK PRESS.indb 99 02/09/2014 14:55:34
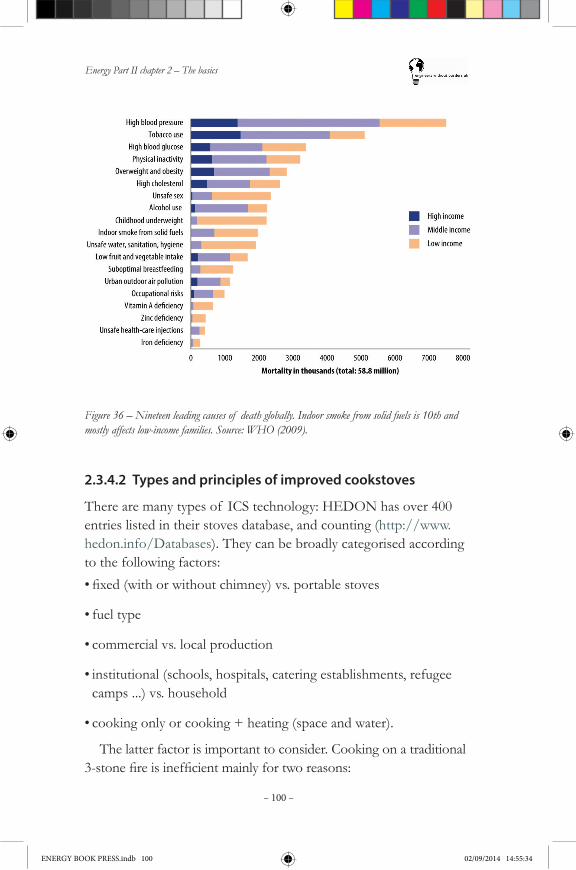
Energy Part II chapter 2 – The basics
– 100 –
Figure 36 – Nineteen leading causes of death globally. Indoor smoke from solid fuels is 10th and mostly affects low-income families. Source: WHO (2009).
2.3.4.2 Types and principles of improved cookstoves
There are many types of ICS technology: HEDON has over 400 entries listed in their stoves database, and counting (http://www.hedon.info/Databases). They can be broadly categorised according to the following factors:•fixed(withorwithoutchimney)vs.portablestoves
•fuel type
•commercial vs. local production
•institutional (schools, hospitals, catering establishments, refugee camps ...) vs. household
•cooking only or cooking + heating (space and water).
The latter factor is important to consider. Cooking on a traditional 3-stonefireisinefficientmainlyfortworeasons:
ENERGY BOOK PRESS.indb 100 02/09/2014 14:55:34

Energy Part II chapter 2 – The basics
– 101 –
1. The combustion of the biomass is incomplete, releasing harmful smoke which could otherwise be combusted, releasing more heat per unit biomass.
2. Poor thermal transfer to pots, because the heat is not directed to the cooking pot or pan and not designed for optimal thermal transfer. Heat is lost to the surroundings.
Although the second point may be seen as wasteful, in places wherespaceheatingisalsoneeded,thefireservesforbothcookingandheating(andsometimeslighting)purposes.If 3-stonefiresarereplacedwithcookstovetechnologieswhichmoreefficientlydirectheattothecookingpotbutdonotimprovecombustionefficiency,anegative consequence may occur in cold climates, whereby another stove may be needed for heating, and emissions may not have been reduced (indeed – they may even have increased). Improving combustionefficiencyisdesirableingeneral,asitwillalsoheatthe space more effectively per unit biomass, and results in cleaner combustion.
There are two crucial components to improving combustion efficiencies:insulatingthecombustionchambertodriveupthetemperature so that more gases are combusted, and improving the oxygen-fuel mix by creating air inlets and stack effects to increase air-flowtothecombustionchamber(seeFigure37,the'firetriangle').Evenif thecombustionefficiencyishigh,almostallICSstill emit plenty of particulates. Carbon Monoxide (CO) is especially difficulttogetridof,andbeingexposedtolargeamountsof COinconfinedspaceshasserioushealthconsequences.NotethatCO,amongst other possible incomplete biomass combustion emissions, iscolourlessandodourless.If thestoveisfixed,chimneysarehighlyrecommended in order to drive the smoke outdoors (Figure 37 right).
ENERGY BOOK PRESS.indb 101 02/09/2014 14:55:34
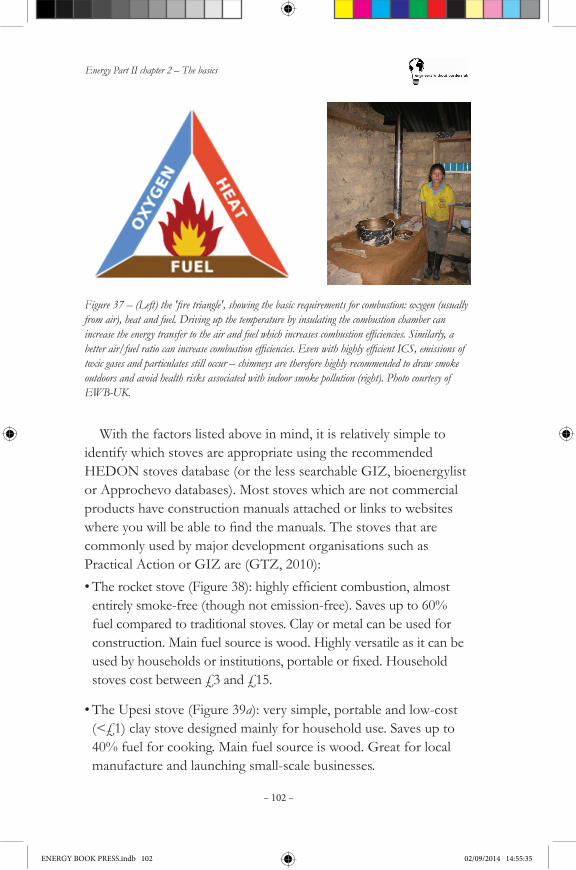
Energy Part II chapter 2 – The basics
– 102 –
Figure 37 – (Left) the 'fire triangle', showing the basic requirements for combustion: oxygen (usually from air), heat and fuel. Driving up the temperature by insulating the combustion chamber can increase the energy transfer to the air and fuel which increases combustion efficiencies. Similarly, a better air/fuel ratio can increase combustion efficiencies. Even with highly efficient ICS, emissions of toxic gases and particulates still occur – chimneys are therefore highly recommended to draw smoke outdoors and avoid health risks associated with indoor smoke pollution (right). Photo courtesy of EWB-UK.
With the factors listed above in mind, it is relatively simple to identify which stoves are appropriate using the recommended HEDON stoves database (or the less searchable GIZ, bioenergylist or Approchevo databases). Most stoves which are not commercial products have construction manuals attached or links to websites whereyouwillbeabletofindthemanuals.Thestovesthatarecommonly used by major development organisations such as Practical Action or GIZ are (GTZ, 2010):•Therocketstove(Figure38):highlyefficientcombustion,almost
entirely smoke-free (though not emission-free). Saves up to 60% fuel compared to traditional stoves. Clay or metal can be used for construction. Main fuel source is wood. Highly versatile as it can be usedbyhouseholdsorinstitutions,portableorfixed.Householdstoves cost between £3 and £15.
•The Upesi stove (Figure 39a): very simple, portable and low-cost (<£1) clay stove designed mainly for household use. Saves up to 40% fuel for cooking. Main fuel source is wood. Great for local manufacture and launching small-scale businesses.
ENERGY BOOK PRESS.indb 102 02/09/2014 14:55:35
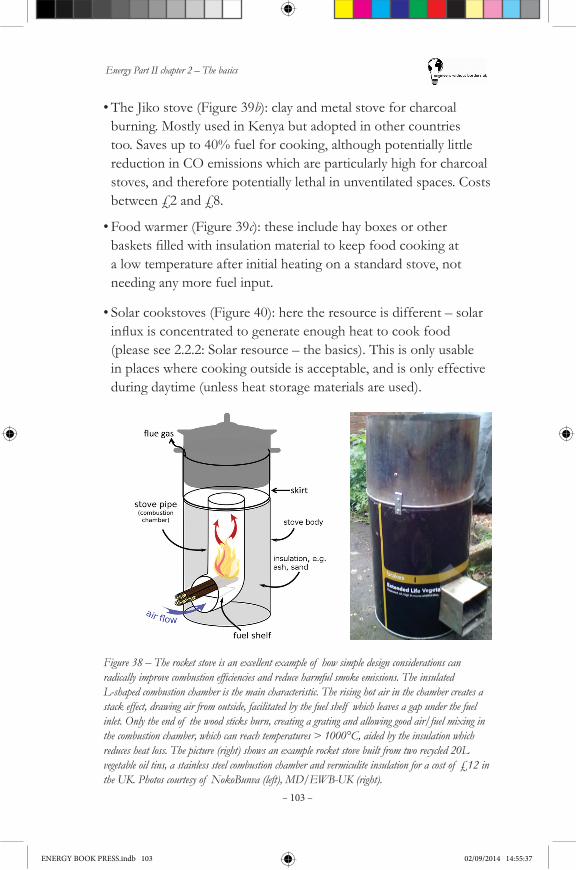
Energy Part II chapter 2 – The basics
– 103 –
•The Jiko stove (Figure 39b): clay and metal stove for charcoal burning. Mostly used in Kenya but adopted in other countries too. Saves up to 40% fuel for cooking, although potentially little reduction in CO emissions which are particularly high for charcoal stoves, and therefore potentially lethal in unventilated spaces. Costs between £2 and £8.
•Food warmer (Figure 39c): these include hay boxes or other basketsfilledwithinsulationmaterialtokeepfoodcookingata low temperature after initial heating on a standard stove, not needing any more fuel input.
•Solar cookstoves (Figure 40): here the resource is different – solar influxisconcentratedtogenerateenoughheattocookfood(please see 2.2.2: Solar resource – the basics). This is only usable in places where cooking outside is acceptable, and is only effective during daytime (unless heat storage materials are used).
Figure 38 – The rocket stove is an excellent example of how simple design considerations can radically improve combustion efficiencies and reduce harmful smoke emissions. The insulated L-shaped combustion chamber is the main characteristic. The rising hot air in the chamber creates a stack effect, drawing air from outside, facilitated by the fuel shelf which leaves a gap under the fuel inlet. Only the end of the wood sticks burn, creating a grating and allowing good air/fuel mixing in the combustion chamber, which can reach temperatures > 1000°C, aided by the insulation which reduces heat loss. The picture (right) shows an example rocket stove built from two recycled 20L vegetable oil tins, a stainless steel combustion chamber and vermiculite insulation for a cost of £12 in the UK. Photos courtesy of NokoBunva (left), MD/EWB-UK (right).
ENERGY BOOK PRESS.indb 103 02/09/2014 14:55:37
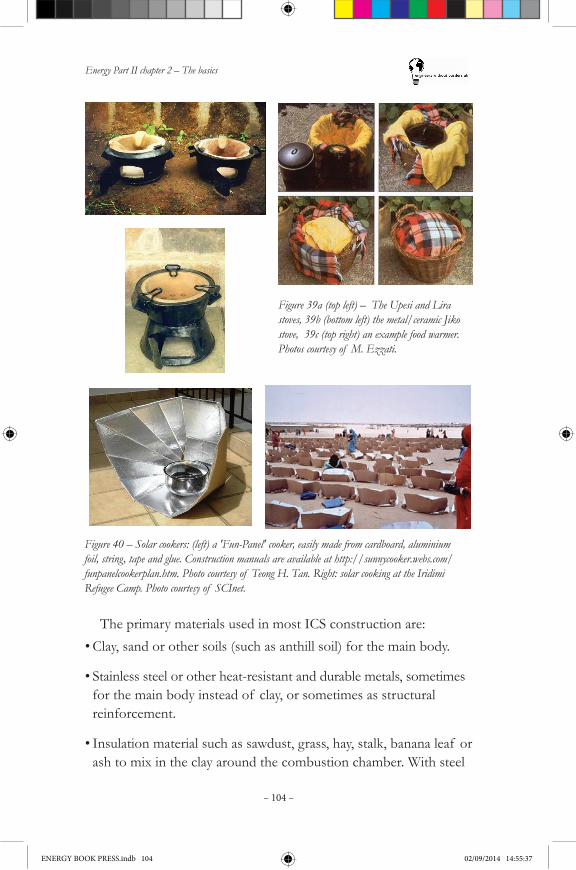
Energy Part II chapter 2 – The basics
– 104 –
Figure 39a (top left) – The Upesi and Lira stoves, 39b (bottom left) the metal/ceramic Jiko stove, 39c (top right) an example food warmer. Photos courtesy of M. Ezzati.
Figure 40 – Solar cookers: (left) a 'Fun-Panel' cooker, easily made from cardboard, aluminium foil, string, tape and glue. Construction manuals are available at http://sunnycooker.webs.com/funpanelcookerplan.htm. Photo courtesy of Teong H. Tan. Right: solar cooking at the Iridimi Refugee Camp. Photo courtesy of SCInet.
The primary materials used in most ICS construction are:•Clay, sand or other soils (such as anthill soil) for the main body.
•Stainless steel or other heat-resistant and durable metals, sometimes for the main body instead of clay, or sometimes as structural reinforcement.
•Insulation material such as sawdust, grass, hay, stalk, banana leaf or ash to mix in the clay around the combustion chamber. With steel
ENERGY BOOK PRESS.indb 104 02/09/2014 14:55:37
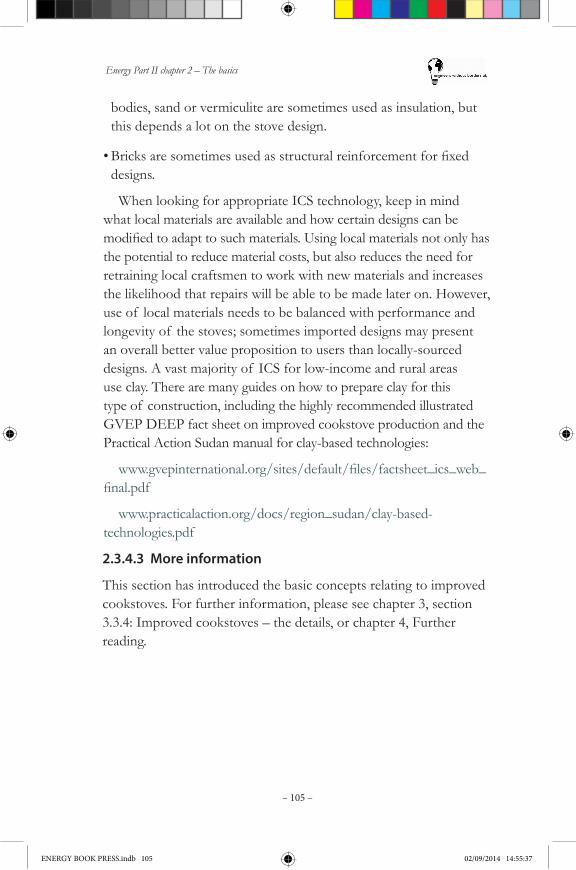
Energy Part II chapter 2 – The basics
– 105 –
bodies, sand or vermiculite are sometimes used as insulation, but this depends a lot on the stove design.
•Bricksaresometimesusedasstructuralreinforcementforfixeddesigns.
When looking for appropriate ICS technology, keep in mind what local materials are available and how certain designs can be modifiedtoadapttosuchmaterials.Usinglocalmaterialsnotonlyhasthe potential to reduce material costs, but also reduces the need for retraining local craftsmen to work with new materials and increases the likelihood that repairs will be able to be made later on. However, use of local materials needs to be balanced with performance and longevity of the stoves; sometimes imported designs may present an overall better value proposition to users than locally-sourced designs. A vast majority of ICS for low-income and rural areas use clay. There are many guides on how to prepare clay for this type of construction, including the highly recommended illustrated GVEP DEEP fact sheet on improved cookstove production and the Practical Action Sudan manual for clay-based technologies:
www.gvepinternational.org/sites/default/files/factsheet_ics_web_final.pdf
www.practicalaction.org/docs/region_sudan/clay-based-technologies.pdf
2.3.4.3 More information
This section has introduced the basic concepts relating to improved cookstoves. For further information, please see chapter 3, section 3.3.4: Improved cookstoves – the details, or chapter 4, Further reading.
ENERGY BOOK PRESS.indb 105 02/09/2014 14:55:37
Energy Part II chapter 2 – The basics
– 106 –
2.4 Practical system design – the basics2.4.1 Practical considerations for working in the field
Energy-poor regions present challenges above and beyond those experienced in the UK and similar societies. The range of climate and environmental factors is a challenge in itself. But we must also accept that the global diversity of people living in these regions means there are often no common languages, a low level of literacy and a wide range of technology awareness.
This section aims to convey appreciation for some of the more general challenges that will be faced, and the safety considerations required to ensure a lasting positive impact from the project.
2.4.1.1 Managing expectations
With all energy projects, it is always better to be cautious about stating the available resources, likely power output and scheme costs. If expectations are built up that cannot be achieved in practice thisleadstoconflictsbetweenstakeholdersthatcouldhavebeenavoided.
2.4.1.2 Innovation
For the EWB-UK placement volunteer, unusual, innovative solutions are unlikely to better than tried and tested methods. Case study 8 shows that reinventing the wheel is often more trouble than it's worth, as simply adapting existing products to the task at hand can often provide a cheaper, simpler, more sustainable solution. Existing products will have gone through a lengthy process of research and development, during which all of the little design flawsthatwouldhaverenderedtheproductunusableareironedout. Support for existing products is widely available in the form of technical assistance and spare parts, whilst new products are often reliant on a single supplier – the organisation you are working with. Innovation is a great thing, however it is important to ask yourself whether your innovation is really the best solution for the people you are working with in the long-term.
ENERGY BOOK PRESS.indb 106 02/09/2014 14:55:37
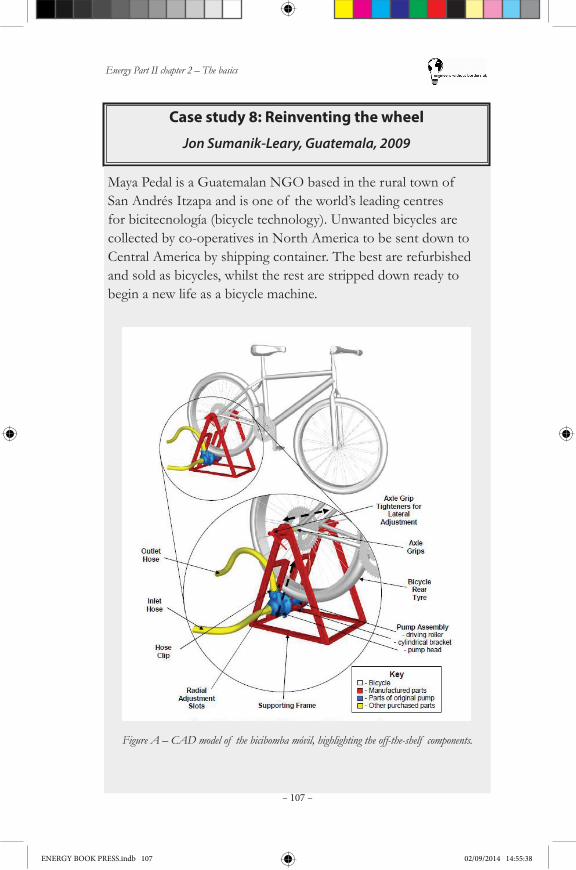
Energy Part II chapter 2 – The basics
– 107 –
Case study 8: Reinventing the wheel
Jon Sumanik-Leary, Guatemala, 2009
Maya Pedal is a Guatemalan NGO based in the rural town of San Andrés Itzapa and is one of the world’s leading centres for bicitecnología (bicycle technology). Unwanted bicycles are collected by co-operatives in North America to be sent down to Central America by shipping container. The best are refurbished and sold as bicycles, whilst the rest are stripped down ready to begin a new life as a bicycle machine.
Figure A – CAD model of the bicibomba móvil, highlighting the off-the-shelf components.
ENERGY BOOK PRESS.indb 107 02/09/2014 14:55:38

Energy Part II chapter 2 – The basics
– 108 –
Maya Pedal produces a range of bicimáquinas (bicycle machines) to cater to the needs of the rural population that do not have access to electricity. Their most popular machines are the bicilicuadora (bicycle powered blender), bicibomba móvil (mobile bicycle powered water pump) and the bicidesgranador (bicycle powered corn de-grainer). Each machine allows the user to complete a previously time-consuming and monotonous task in a fraction of the time.
One of the key factors that has led to the success of Maya Pedal’s bicycle machines is their use of standard, off-the-shelf components. It is not only the bicycles that are re-manufactured, as in fact Maya Pedal manufacture very few components from scratch. Instead they wisely choose to re-manufacture existing productsbyadaptingthemforpedalpower,significantlyreducingthe cost of their machines.
Each of the three machines mentioned above is an example of re-manufacturing of machines designed for other power sources into pedal-powered machines:
The bicilicuadora (£40) consists of a jug and stand from a regular electric blender (~£15), with the blade driven by friction from the front wheel of a bicycle instead of an electric motor.
The bicibomba móvil (£115, pictured) is essentially a standard 300W electric centrifugal pump (~£40) with the electric motor removed and the pump axle driven by friction from the back wheel of a bicycle.
The bicidesgranador (£150) adapts a hand-cranked corn de-grainer (~£30) to be driven by the feet at much higher speed using a bicycle drivetrain.
Using these off-the-shelf components that are already available from hardware stores in the local area speeds up production time as there are fewer parts to build from scratch. It also increases the usability of the product as users are often already familiar with the original product and therefore only need to learn how to use the pedal power part of the machine. The off-the-shelf components generally have a longer life expectancy than their custom made counterparts,assignificantresearchanddevelopmenthasgoneinto designing a reliable product before entering mass-production.
ENERGY BOOK PRESS.indb 108 02/09/2014 14:55:38

Energy Part II chapter 2 – The basics
– 109 –
In addition to this, if a failure does occur, then spare parts can be sourced from a variety of retailers that stock the original product. This last point becomes particularly important when bicycle machines are installed in remote regions far away from Maya Pedal’s workshop.
About the author: Jon received an EWB-UK bursary to spend four months working with Maya Pedal on the design of the bicibomba móvil (mobile bicycle powered water pump) that he began as a Master’s level research project at the University of Sheffield.
About the organisation: Maya Pedal is operated as a small business, with Carlos Marroquín and son designing, manufacturing and installing over 10,000 bicimáquinas. International volunteers bring their skills and ideas to Maya Pedal and assist them with the refurbishing of bicycles or with their bicitecnología.
Maya Pedal have produced thousands of bicycle machines and the bicibomba móvil is now part of their portfolio (with over 100 already sold), offering many local farmers without access to electricity the ability to irrigate their land.
ENERGY BOOK PRESS.indb 109 02/09/2014 14:55:38
Energy Part II chapter 2 – The basics
– 110 –
2.4.1.3 Safety
It is not possible to protect against every eventuality, but it is important to appreciate that many communities will not appreciate risk in the same way a typical UK national does. Equally, when considering aspects such as extremes of climate, a UK national will nothavesufficientappreciationcomparedtoalocal.Thereisnosuchthingas‘commonsense’–oneperson’sdefinitionof ‘safe’willdiffer from the next.Itisnotfire,rotatingequipmentandothernaturallyintimidating
hazards that are of most concern, but the subtle and silent hazards, such as electricity and chemicals (e.g. battery acids) that pose the greatest risk.
It is unwise to make assumptions regarding recognition of hazards.Whereriskispresent,restrictionratherthannotificationisadvised,aswarningsignsarenotsufficientontheirown.Theycan be removed or damaged, but they may not be understood even when new. Instead, dangerous equipment should be inaccessible to anyone other than trained personnel.
Where risk of electrical shock and other hazards exist (terminals, switchgear and moving parts) enclosures or barriers should not only be employed to prevent access, they should prevent close proximity to a dangerous area.
Where user interaction is required (for example on small solar lights) it should not be possible for small parts to come away from the product (that may represent a choking hazard). There should be no access to internal parts and in the event of physical damage, internal parts should be naturally contained.
Toxicity is a serious concern. As with other hazards it is not necessarily the obvious culprits that cause harm. Battery acid for example is (or should be) clearly labelled and is supplied in extremely rugged containers that cannot be opened by children. Some locally available paints can contain lead, and some cleaning agents would not be legal in the UK. Always check the labels. Any toxic or environmentally hazardous materials or components must be clearly identifiedwithsymbols,notjustwriting.Wherefactorsspecifictothelocationneedtobequantified,local
ENERGY BOOK PRESS.indb 110 02/09/2014 14:55:38

Energy Part II chapter 2 – The basics
– 111 –
partners and community members should be consulted. Extreme weather conditions – wind, temperature and rain – can pose serious design challenges above and beyond what would normally be acceptable.Forexample,flooding,isobviouslyaconcernforhydrosystems (and is addressed in the appropriate sections of this text) but it is also an issue for the location of electrical equipment for other technologies.
Where extreme climate conditions are a potential risk, specialist advice should be sought from local champions and technical experts.
2.4.1.4 Transportation and logistics
Compared to typical use in the industrialised world, equipment and components will likely suffer excessive knocks, vibration and unusually harsh physical treatment. Below are some potential challenges that should be considered.
Any international transportation of materials will likely be by sea freight and conform to standard practices. However once the container or package commences its journey from the port (or airport), damage can occur if suitable measures are not taken.
For local ground transport (from port), equipment will be driven over harsh roads, in vehicles with poor suspension, and lifting equipment will likely not be available at the destination. This means that the handling of goods is by people, and there are natural limits to the weight and volume that can be managed both practically and safely.
For example, the cheapest solar panel (relative to power output) may be over 1 square meter in area and weigh in excess of 15 kg. Two people can handle a unit of this size, but if a stack of, say, 10 arelaidflatonthebackof avehicle,itishighlylikelysomewillbreak (they contain large sheets of glass.) Conversely, a battery of even modest capacity – 200 Ah for example, is easily transported by vehicle but will weigh over 50 kg – which is a serious safety risk for two people trying to lift it off a vehicle. If the battery is dropped from even a metre high, it will likely sustain internal damage that willsignificantlyaffectperformanceandoperationallife.
The message is to consider the realities of local logistics and
ENERGY BOOK PRESS.indb 111 02/09/2014 14:55:38

Energy Part II chapter 2 – The basics
– 112 –
choose equipment accordingly. Packaging can reduce the adverse effects of transportation, but it should not be relied upon. Products need to be manageable by hand and resilient to the environment they will be used in – including the people that will handle them.
2.4.1.5 People and everyday use
It should be assumed that the user has no prior experience with the equipment being installed or provided. This is especially important where user interaction is required. The operator could havesweatyhandsandfingers,possiblycoveredwithoilysubstances,and therefore moisture protection for controls is an important consideration. And to add to these issues, greater force and pressure than usual will be applied to all user controls.
Electrical failure due to repetitive operation is a common issue with user equipment. Rugged switches and controls should be included for all user interfaces, as a simple on/off switch on a solar light may be used over 3000 times in just two years – even under modest use.
Theft is also a major consideration. We should not assume everyone is a criminal, but it is realistic to consider the security of certain components and equipment. Anti-theft screws and bolts are available, and enclosures are usually available with locks. Discussion with local partners and assessment of risk for the location and community should be conducted to determine the appropriate course of action for each project.
2.4.1.6 Climate
The distinction between indoor and outdoor locations is far less definedthaninmostindustrialisednations.Buildingsprovideshelterfrom rain and direct sunlight but indoor temperatures can be the same as outdoor ambient values. The same applies to humidity levels.
Extremes of temperature and especially large variations in temperature are serious concerns for equipment. Add humidity to these conditions and materials, components and systems can and do regularly fail.
It is important to research the climate of the country being
ENERGY BOOK PRESS.indb 112 02/09/2014 14:55:38
Energy Part II chapter 2 – The basics
– 113 –
visited.Onceincountryitisthennecessarytotalkspecificallyaboutenvironmental conditions with local organisations and people, because they will have valuable experience above and beyond what the simple temperature and humidity numbers may suggest.Specificconsiderationsforequipmentareincludedwithinthis
text at the appropriate places (for example, the effect of high temperatures on batteries are addressed in 3.4.2.5.4: Battery safety). Keeping equipment shaded from direct sunlight (apart from solar panels of course!) is also addressed in the main text, however items such as cables and connectors are often overlooked when considering the damaging effects of temperature and particularly UV exposure.
Below are examples of other more general considerations to keep in mind when assessing the requirements for a given project:
MaterialsIn very hot or very cold regions plastics can become soft or brittle and lose structural integrity – this includes cable ties, insulation washers, junction boxes and enclosures.
Large variations in temperature – on a daily basis or seasonal variations – can cause cracking of plastics and even metals through repeated expansion and contraction.
Wood is particularly susceptible to temperature and humidity, and the strength of soft woods is seriously compromised by water.
Degradation levels for a given material will not be the same when exposed to extreme humidity, compared to when it is exposed to damp, cold conditions that are typical of the UK.
Whilst choosing robust materials that are designed to withstand environmental exposure for extended periods of time is preferable, it may often not be possible, as they are more expensive than ‘standard’ items (if they are even available). However, whenever possible,stainlesssteelshouldbeusedforfixings,UVresistantcables should be used if they are not housed or buried, and UV resistant plastics should be used for safety guards and enclosures where security is important.
ENERGY BOOK PRESS.indb 113 02/09/2014 14:55:38
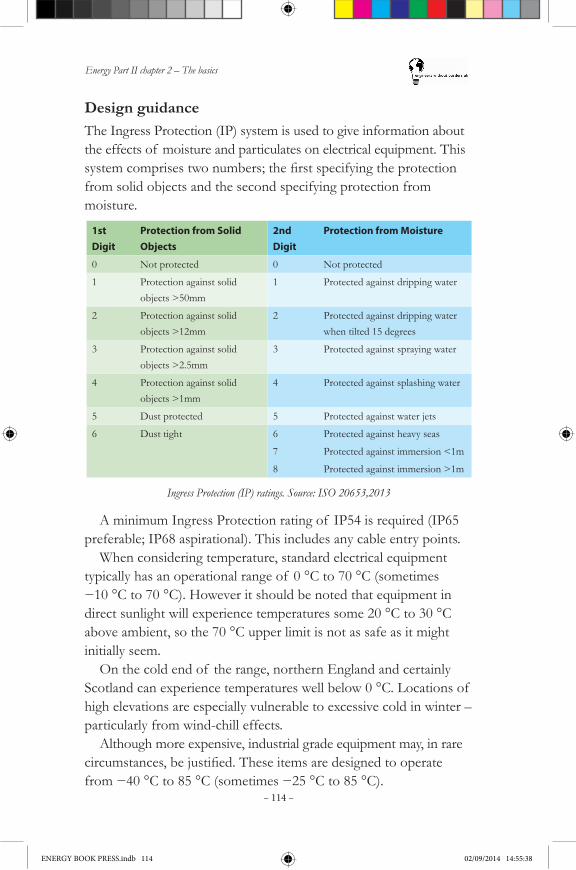
Energy Part II chapter 2 – The basics
– 114 –
Design guidanceThe Ingress Protection (IP) system is used to give information about the effects of moisture and particulates on electrical equipment. This systemcomprisestwonumbers;thefirstspecifyingtheprotectionfrom solid objects and the second specifying protection from moisture.
1st Digit
Protection from Solid Objects
2nd Digit
Protection from Moisture
0 Not protected 0 Not protected
1 Protection against solid objects >50mm
1 Protected against dripping water
2 Protection against solid objects >12mm
2 Protected against dripping water when tilted 15 degrees
3 Protection against solid objects >2.5mm
3 Protected against spraying water
4 Protection against solid objects >1mm
4 Protected against splashing water
5 Dust protected 5 Protected against water jets
6 Dust tight 6 Protected against heavy seas
7 Protected against immersion <1m
8 Protected against immersion >1m
A minimum Ingress Protection rating of IP54 is required (IP65 preferable; IP68 aspirational). This includes any cable entry points.
When considering temperature, standard electrical equipment typically has an operational range of 0 °C to 70 °C (sometimes −10°Cto70°C).Howeveritshouldbenotedthatequipmentindirect sunlight will experience temperatures some 20 °C to 30 °C above ambient, so the 70 °C upper limit is not as safe as it might initially seem.
On the cold end of the range, northern England and certainly Scotland can experience temperatures well below 0 °C. Locations of high elevations are especially vulnerable to excessive cold in winter – particularly from wind-chill effects.
Although more expensive, industrial grade equipment may, in rare circumstances,bejustified.Theseitemsaredesignedtooperatefrom−40°Cto85°C(sometimes−25°Cto85°C).
Ingress Protection (IP) ratings. Source: ISO 20653,2013
ENERGY BOOK PRESS.indb 114 02/09/2014 14:55:38

Energy Part II chapter 2 – The basics
– 115 –
2.4.1.7 Environmental impact
The environmental impact of the installation should be explicitly discussed with the local partner organisation. Agreement must be reached to ensure, among other things, the responsible disposal of any components that could pose a hazard to the environment, such as lead acid batteries (see 3.4.2.5: Batteries).
2.4.1.8 International standards
All materials, components and equipment should conform to relevant local standards and, where possible, international standards (e.g. IEC – International Electrotechnical Commission, EN – European Standards, BS – British Standards, UL – Underwriters Laboratories). If local standards are not available, BS/EN/UL should be the default alternative.Intheeventof aconflictbetweenstandards,Europeanharmonised (BS EN) or US (UL) standards should be used.
2.4.2 Electrical systems
This section covers aspects of electrical design for remote power supply systems. It will cover practical and theoretical aspects of integrating renewable energy into stand-alone power supply systems.Ithasbeenwrittenfor‘inthefield’engineersworkingonremote
electrificationusingsmall(upto10kW)renewableenergypowersupply systems with lead-acid battery storage, although items covered within this section are relevant to the electrical systems of all stand-alone power supply systems in all locations.
Designing robust and reliable stand-alone power supply systems isahighlyspecialistfield.Thisguideisastartingpointonly–alwaysconsult relevant specialists.
We are looking to install a system which will provide reliable power for many years to come. We must ensure that every aspect is covered and that all potential points of failure have been addressed. Failures within remote power supply systems are often due to low quality electrical design and implementation.
Note: This section does not replace any local statutory or non-statutory electrical installation regulations. Always check with a local qualifiedelectricianbeforeinstallinganyequipment.
ENERGY BOOK PRESS.indb 115 02/09/2014 14:55:38
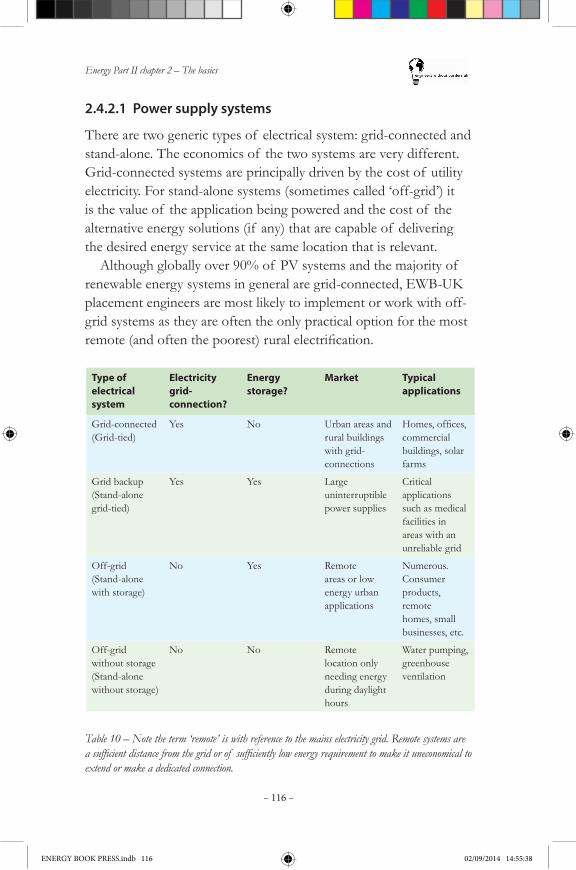
Energy Part II chapter 2 – The basics
– 116 –
2.4.2.1 Power supply systems
There are two generic types of electrical system: grid-connected and stand-alone. The economics of the two systems are very different. Grid-connected systems are principally driven by the cost of utility electricity. For stand-alone systems (sometimes called ‘off-grid’) it is the value of the application being powered and the cost of the alternative energy solutions (if any) that are capable of delivering the desired energy service at the same location that is relevant.
Although globally over 90% of PV systems and the majority of renewable energy systems in general are grid-connected, EWB-UK placement engineers are most likely to implement or work with off-grid systems as they are often the only practical option for the most remote(andoftenthepoorest)ruralelectrification.
Type of electrical system
Electricity grid-connection?
Energy storage?
Market Typical applications
Grid-connected (Grid-tied)
Yes No Urban areas and rural buildings with grid-connections
Homes,offices,commercial buildings, solar farms
Grid backup (Stand-alone grid-tied)
Yes Yes Large uninterruptible power supplies
Critical applications such as medical facilities in areas with an unreliable grid
Off-grid (Stand-alone with storage)
No Yes Remote areas or low energy urban applications
Numerous. Consumer products, remote homes, small businesses, etc.
Off-grid without storage (Stand-alone without storage)
No No Remote location only needing energy during daylight hours
Water pumping, greenhouse ventilation
Table 10 – Note the term ‘remote’ is with reference to the mains electricity grid. Remote systems are a sufficient distance from the grid or of sufficiently low energy requirement to make it uneconomical to extend or make a dedicated connection.
ENERGY BOOK PRESS.indb 116 02/09/2014 14:55:38
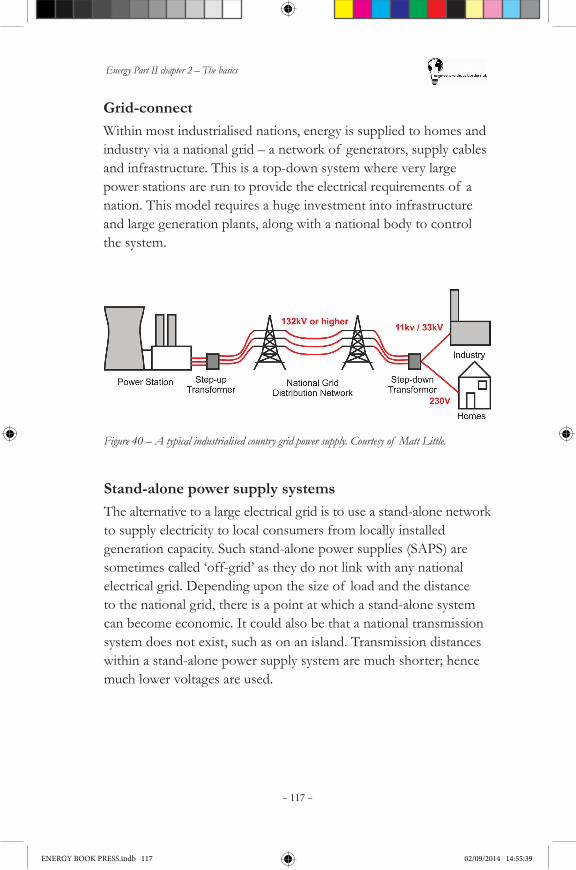
Energy Part II chapter 2 – The basics
– 117 –
Grid-connectWithin most industrialised nations, energy is supplied to homes and industry via a national grid – a network of generators, supply cables and infrastructure. This is a top-down system where very large power stations are run to provide the electrical requirements of a nation. This model requires a huge investment into infrastructure and large generation plants, along with a national body to control the system.
Stand-alone power supply systemsThe alternative to a large electrical grid is to use a stand-alone network to supply electricity to local consumers from locally installed generation capacity. Such stand-alone power supplies (SAPS) are sometimes called ‘off-grid’ as they do not link with any national electrical grid. Depending upon the size of load and the distance to the national grid, there is a point at which a stand-alone system can become economic. It could also be that a national transmission system does not exist, such as on an island. Transmission distances within a stand-alone power supply system are much shorter; hence much lower voltages are used.
Figure 40 – A typical industrialised country grid power supply. Courtesy of Matt Little.
ENERGY BOOK PRESS.indb 117 02/09/2014 14:55:39
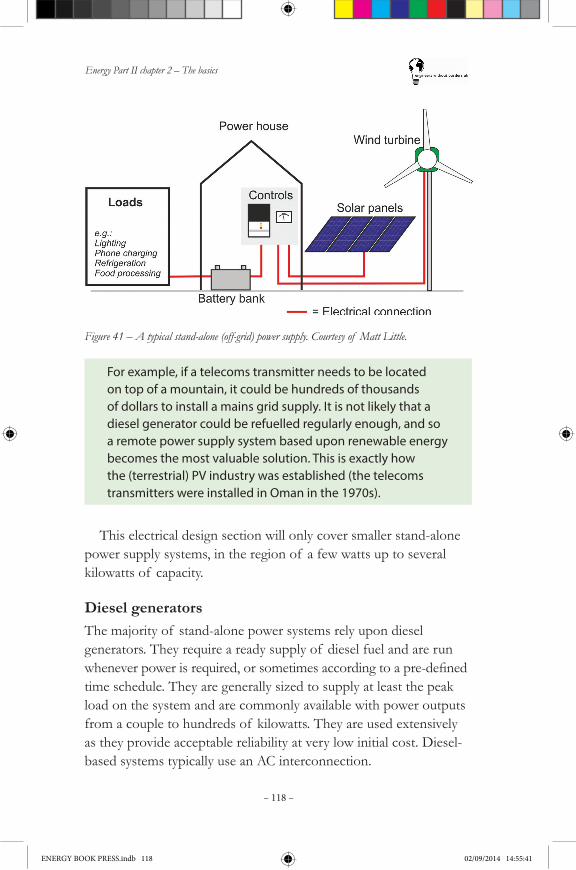
Energy Part II chapter 2 – The basics
– 118 –
Figure 41 – A typical stand-alone (off-grid) power supply. Courtesy of Matt Little.
For example, if a telecoms transmitter needs to be located on top of a mountain, it could be hundreds of thousands of dollars to install a mains grid supply. It is not likely that a diesel generator could be refuelled regularly enough, and so a remote power supply system based upon renewable energy becomes the most valuable solution. This is exactly how the (terrestrial) PV industry was established (the telecoms transmitters were installed in Oman in the 1970s).
This electrical design section will only cover smaller stand-alone power supply systems, in the region of a few watts up to several kilowatts of capacity.
Diesel generatorsThe majority of stand-alone power systems rely upon diesel generators. They require a ready supply of diesel fuel and are run wheneverpowerisrequired,orsometimesaccordingtoapre-definedtime schedule. They are generally sized to supply at least the peak load on the system and are commonly available with power outputs from a couple to hundreds of kilowatts. They are used extensively as they provide acceptable reliability at very low initial cost. Diesel-based systems typically use an AC interconnection.
ENERGY BOOK PRESS.indb 118 02/09/2014 14:55:41

Energy Part II chapter 2 – The basics
– 119 –
Problems with diesel generatorsProblems with the use of diesel generators include:•cost of fuel and its transportation
•local environmental effects, such as the reduction of local air quality
•global environmental effects, such as climate change
•security of fuel supply
•inefficientwhenpartiallyloaded
•start-up response time
•noise
•high maintenance requirements.
Diesel generator systems can have lower investment costs, due to the reduced infrastructure requirements, but will prove expensive in the long-term due to fuel and maintenance costs.
Note: For more information on selecting, operating and maintaining a diesel generator please see Practical Action’s 'Diesel Generator' worksheet:◊ http://practicalaction.org/diesel-engines
◊ http://practicalaction.org/diesel-engine-repair-maintenance.
2.4.2.2 Renewable energy
Why use renewable energy for these systems?
Genericbenefitsof usingrenewableenergy:
Distributed: Renewable energy resources are inherently distributed and usually some form is locally available (wind, solar, hydro or biomass).
Any size: a renewable energy solution can be almost any size, from personal to utility scale. From calculators to power stations.
ENERGY BOOK PRESS.indb 119 02/09/2014 14:55:41

Energy Part II chapter 2 – The basics
– 120 –
Variability of loadsThe various loads on the system will be switched on and off as required throughout the day, month and year. Loads such as lighting will be used at night. Loads such as refrigeration will be used more during the day. Some loads will vary with the seasons, such as increased lighting use during the winter. For more information on this subject please refer to chapter 3, section 1.2: Load spreadsheets.
No fuel required: there is no on-going fuel requirement from the owner or user. The fuel – sunlight, wind or rain – is free, abundant and potentially very predictable.
Buffer from fuel prices: Using renewable energy will buffer the community against the increasing cost of fossil fuels.
Economic: In the long-term, this can make economic sense, as the higher capital cost will be compensated for by the reduction, or even absence, of expenditure on fuel.
Transportation: Fuel does not need to be transported. In remote locations fuel can cost up to ten times the price of fuel within a city, mainly due to transportation costs.
Reduced local air pollution: No local diesel fumes.
Reduced global pollution: Reduction in greenhouse gasses.
Anywhere: PV works almost anywhere and can therefore be used in urban and rural locations.
In this section we are dealing with electrical supply systems, hence the renewable energy sources discussed here are those which generate electricity:
•Solar Photovoltaics •Wind turbines
•Hydro power •Biofuel based generators
Problems with integrating renewable energyThere are a number of problems with integrating renewable energy into a stand-alone system.
ENERGY BOOK PRESS.indb 120 02/09/2014 14:55:41
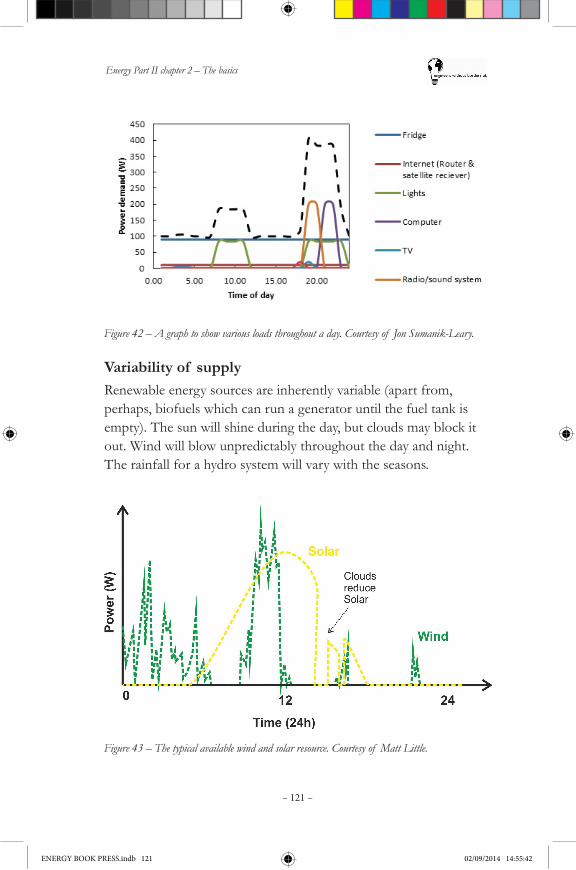
Energy Part II chapter 2 – The basics
– 121 –
Figure 42 – A graph to show various loads throughout a day. Courtesy of Jon Sumanik-Leary.
Variability of supplyRenewable energy sources are inherently variable (apart from, perhaps, biofuels which can run a generator until the fuel tank is empty). The sun will shine during the day, but clouds may block it out. Wind will blow unpredictably throughout the day and night. The rainfall for a hydro system will vary with the seasons.
Figure 43 – The typical available wind and solar resource. Courtesy of Matt Little.
ENERGY BOOK PRESS.indb 121 02/09/2014 14:55:42
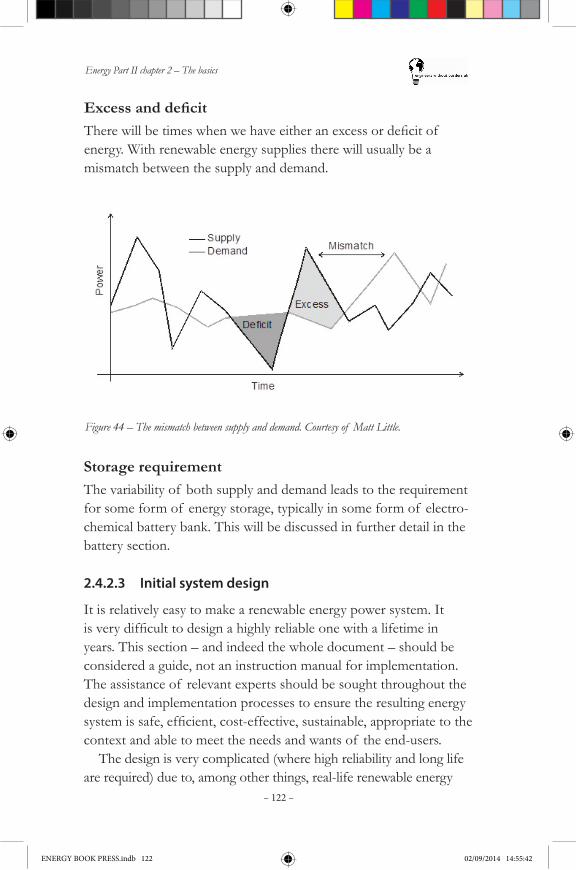
Energy Part II chapter 2 – The basics
– 122 –
Storage requirementThe variability of both supply and demand leads to the requirement for some form of energy storage, typically in some form of electro-chemical battery bank. This will be discussed in further detail in the battery section.
2.4.2.3 Initial system design
It is relatively easy to make a renewable energy power system. It isverydifficulttodesignahighlyreliableonewithalifetimeinyears. This section – and indeed the whole document – should be considered a guide, not an instruction manual for implementation. The assistance of relevant experts should be sought throughout the design and implementation processes to ensure the resulting energy systemissafe,efficient,cost-effective,sustainable,appropriatetothecontext and able to meet the needs and wants of the end-users.
The design is very complicated (where high reliability and long life are required) due to, among other things, real-life renewable energy
ExcessanddeficitTherewillbetimeswhenwehaveeitheranexcessordeficitof energy. With renewable energy supplies there will usually be a mismatch between the supply and demand.
Figure 44 – The mismatch between supply and demand. Courtesy of Matt Little.
ENERGY BOOK PRESS.indb 122 02/09/2014 14:55:42

Energy Part II chapter 2 – The basics
– 123 –
technology and battery performance – which can be drastically differenttotheirspecifiedratings.Overallsystemperformanceinreallifeisdifficulttoaccuratelydetermineduetoweather/resourcepredictions, cable and connector losses, component ageing, accuracy of control, vandalism/poor maintenance, etc.
Even for the most professional system designs, their exact performance cannot be predicted because the fuel – sunlight, wind or rain – is highly variable due to local micro-climates, inter-annual variations, modelling methods etc. It is also not possible to accurately predict battery life due to a host of inter-dependent factors such as varying charge current, temperature effects, ageing, charge and discharge rates.Thereisnocorrectsolution.Thefinaldeliverablesshould
be the best compromise between cost, complexity, reliability and expected lifetime (among other considerations).
System design processBuilding a stand-alone power supply system starts with talking to the people who are going to use the system. There is more information about this in the system design process chapter:
•What loads do they require?
•Why do they require them?
•What is the budget?
Using a stand-alone power supply system is a more involved and complex process than just plugging into a national grid.
Typical systems are small and the input and output energy is variable, hence the community which will be utilizing the supply must be willing to learn the system and adjust their use according to the available energy.
It also requires well trained, knowledgeable operators to operate and maintain the system. The social aspects of development projects will be covered in other chapters. Here we will look at the physical design of these systems.
The cost and physical size (among other aspects) of a stand-alone system are dependent upon:
ENERGY BOOK PRESS.indb 123 02/09/2014 14:55:42
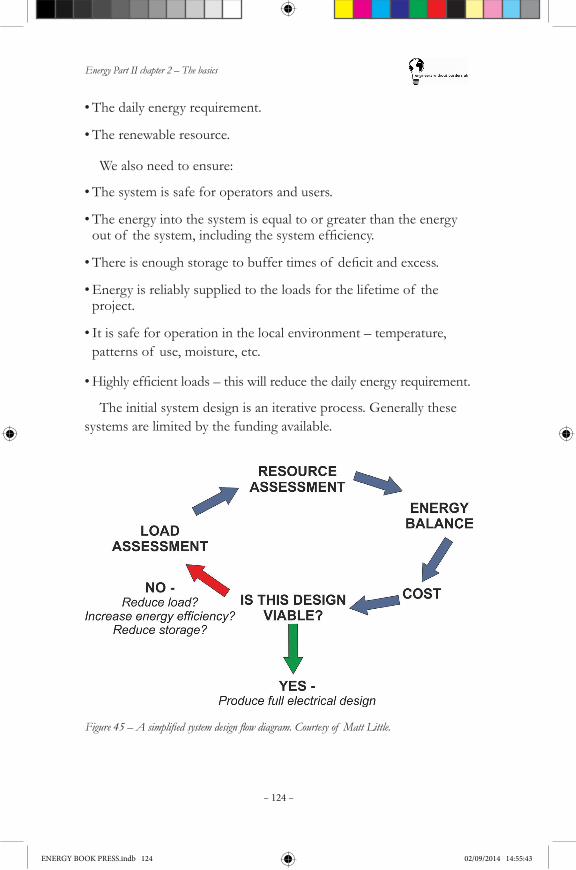
Energy Part II chapter 2 – The basics
– 124 –
Figure 45 – A simplified system design flow diagram. Courtesy of Matt Little.
•The daily energy requirement.
•The renewable resource.
We also need to ensure:
•The system is safe for operators and users.
•The energy into the system is equal to or greater than the energy outof thesystem,includingthesystemefficiency.
•Thereisenoughstoragetobuffertimesof deficitandexcess.
•Energy is reliably supplied to the loads for the lifetime of the project.
•It is safe for operation in the local environment – temperature, patterns of use, moisture, etc.
•Highlyefficientloads–thiswillreducethedailyenergyrequirement.
The initial system design is an iterative process. Generally these systems are limited by the funding available.
ENERGY BOOK PRESS.indb 124 02/09/2014 14:55:43

Energy Part II chapter 2 – The basics
– 125 –
Typically the initial system design is over-budget. We must then reviewtheloadsandlooktoinstallingmoreefficientappliancesorreducing the load through user interaction.
The system design process must be repeated until a viable (both technically and economically) design has been reached.
Load assessmentPerformed as shown in the Energy Demand section.
The load assessment will yield:•daily energy required for the loads (Eloads)
•maximum load demand for loads (Pload_ _max)
•is an inverter required? (Do some of the loads require an AC supply?)
Example: A health care centre is being set-up in a remote area of Northern Peru. This centre requires the following loads:
Health centre requires:
Lighting 10W x 4 for 6 hours per day = 240WhrsCommunications phone charging 5W x 4 x 3hours per day = 60WhrsCentrifuge 200W (Only AC device available) x 0.5 hours per day = 100Whrs
Total daily load requirement = 400Whrs/day
From this we can state that:•Εloads = 400Whrs/day
•Ρload_ _max = (10W x 4) + (5W x 4) + 200W = 260W is the maximum power draw
•An inverter is required to power the 200W centrifuge.
ENERGY BOOK PRESS.indb 125 02/09/2014 14:55:44
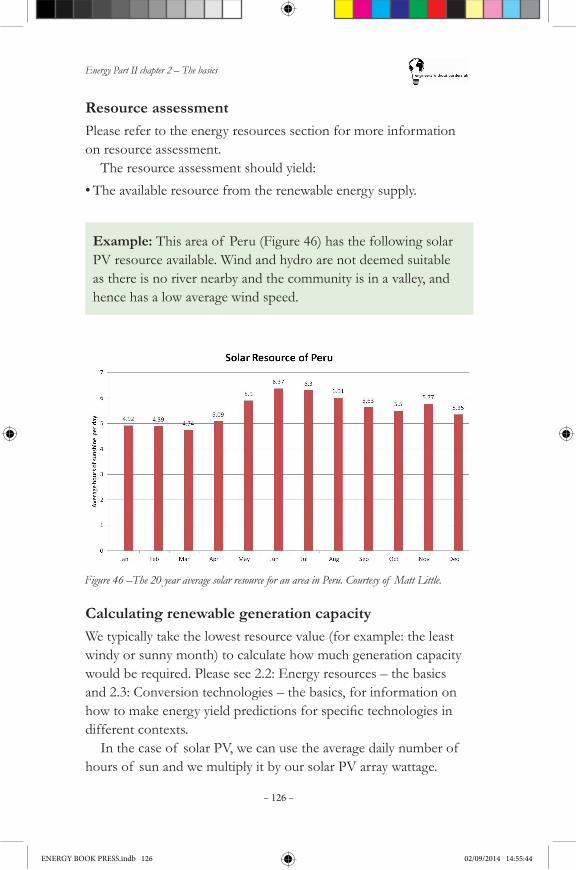
Energy Part II chapter 2 – The basics
– 126 –
Figure 46 –The 20 year average solar resource for an area in Peru. Courtesy of Matt Little.
Calculating renewable generation capacityWe typically take the lowest resource value (for example: the least windy or sunny month) to calculate how much generation capacity would be required. Please see 2.2: Energy resources – the basics and 2.3: Conversion technologies – the basics, for information on howtomakeenergyyieldpredictionsforspecifictechnologiesindifferent contexts.
In the case of solar PV, we can use the average daily number of hours of sun and we multiply it by our solar PV array wattage.
Resource assessmentPlease refer to the energy resources section for more information on resource assessment.
The resource assessment should yield:•The available resource from the renewable energy supply.
Example: This area of Peru (Figure 46) has the following solar PV resource available. Wind and hydro are not deemed suitable as there is no river nearby and the community is in a valley, and hence has a low average wind speed.
ENERGY BOOK PRESS.indb 126 02/09/2014 14:55:44
Energy Part II chapter 2 – The basics
– 127 –
Example: We need to calculate the minimum size solar PV array to supply this load throughout the year. Hence we choose the month of lowest solar irradiance, March, with 4.8 sun-hours per day.
Please refer to the solar resource section for information on sun-hours and energy generated by solar PV.
If we were to have a solar PV module with a rating of 100Wp and we used it in our site in Peru with 4.74 sun-hours, then we would generate 100Wp x 4.74hrs = 474Wh per day.
Energy balanceNext, we need to size the amount of renewable energy generation required to supply the loads. This must include any system inefficiencies(pleasesee3.4:Practicalsystemdesign–thedetailsformore information on each component).Typicalrule-of-thumbinefficienciesare:
•Battery storage (ηbatt)≈80%
Thisistheapproximateaverageefficiencyof puttingenergyintoand bringing it out of the battery.•Chargecontrolleroverallefficiency(ηcontrol)≈75%
Achargecontrollerisarelativelyefficientpieceof powerelectronics, only consuming less than 1% of the total power to function.
There are times when, if the battery is full and there is no load on the system, the charge controller must regulate the power in order to ensure the batteries are not over-charged. This is a normal function of the charge controller, but it does mean that some of the available resource must be controlled and hence not stored as useful energy. For this reason around 25% of the available energy cannot be utilised, hence we must factor this into our energy generation calculations.•Inverter, if used, (ηinv) ≈ 70%
ENERGY BOOK PRESS.indb 127 02/09/2014 14:55:44
Energy Part II chapter 2 – The basics
– 128 –
Example: In our Peru example system we have 300Whs of DC load (Edc_load) and 100Whrs of AC load (Edc_load). So we need to generate:
((100 / 0.9) + 300) / (0.75 x 0.8) = 685Wh per day
Asyoucansee,theseinefficienciesbuilduptoaddquiteanadditional load onto the system.
In this region of Peru we would need:685Wh / 4.74 sun-hour = a 145Wp solar array
This could be in the form of a single (large) 150Wp module or a number of smaller PV modules (such as 3 x50Wp modules). This design depends upon local availability and cost of modules and on transportation costs.
Economic analysisOnce a basic system design has been calculated we must perform a basic economic analysis. As funding is generally scarce, the cost of the system will normally be the limiting factor.
Ensure that all the aspects of the renewable energy system are taken into account including:•batteries for storage
•mounting systems for PV modules
•towers for wind turbines
Calculating required powerWhenweincludetheinefficienciesof theelectricalsystem,thedailyenergy which must be supplied to the load is:
(Eacload/ηinv) + (Edcload) Eload(ηcontrol.ηbatt)
=
Thisistheefficiencyof convertingDCintoAC,takingintoaccountthe lower utilization factor of an inverter (i.e. a 100W inverter running just 50W).
ENERGY BOOK PRESS.indb 128 02/09/2014 14:55:44

Energy Part II chapter 2 – The basics
– 129 –
•civil works for hydro sites
•transportation of equipment to site
•cables – including thickness and length.
Transportation costs can also be high, especially to remote locations.
If this basic economic analysis shows the system to be too expensive, then the load analysis must be altered (perhaps using moreefficientdevicesorreducingtheuseof someitems)andtheresource and economic analysis re-done. This is an iterative process.
Eventually a compromise will be reached and a realistic design will be produced, which can be implemented.
Considerations for system designThings to consider when designing SAPS:•Be conservative (better to overestimate at the beginning and have
the system performing better than expected rather than having a system which never performs as intended).
•Get the best data you can to help perform both a load and resource assessment. Sometimes this is not easy and ‘guestimates’ have to be made.
•Ensure the mechanical, civil and electrical design is thought through at an early stage.
•Ensure all calculations are checked and re-checked by an expert.
•Ensure energy demand calculations take into account any future community growth. People often do not realize how much energy they use. Also energy use patterns often change as after the implementation of a new energy access project, so ensure the system is designed to incorporate that.
•Ensure there is a contingency added to the costs as there will nearly always be additional costs.
•How much maintenance will the system require and who is going to do it?
ENERGY BOOK PRESS.indb 129 02/09/2014 14:55:44

Energy Part II chapter 2 – The basics
– 130 –
•Is the equipment you are specifying available locally? If not, how will it be purchased and how will spare parts be obtained?
Please see chapter 4, Further reading for more information on stand-alone power supply systems and computer simulation tools
Note: Never rely upon a computer simulation – always perform the basic design calculations and ensure that every factor has been included. There are many social and technological factors which should be included by the system designer, but might not be included within the computer model.
2.4.2.4 More information
This section has introduced the basic concepts relating to practical system design. For further information, please see chapter 3, section 3.4: Practical system design – the details, or chapter 4, Further reading.
ENERGY BOOK PRESS.indb 130 02/09/2014 14:55:45
Energy Part III chapter 3 – The details
– 131 –
3 The detailsThis chapter provides in-depth information on each of the topics described previously and should be used like an appendix, i.e. referredtowhenspecificdetailedinformationonaparticulartopicis required. Referring back to the energy systems design process in Figure 9, this chapter can guide the reader through the process of detailed system design (3), however, the advice of a relevant specialist and local champion should be sought when necessary. Each topic in the following chapter is also accompanied by a list of resources (both online and in print) that can offer the reader enough information to be able to complete a full system design (4).
3.1 Assessing energy demand – the detailsThis section focuses on conducting a detailed load assessment for electrical systems, however many of the concepts are transferable to mechanical or thermal systems. The starting point for the design of any energy system is to identify the loads and their patterns of use. Loads are appliances, i.e. the technologies that convert energy into usefulservicesfortheend-user.Thiswillallowustofindthedailyenergy requirement and the maximum power requirement, which can be calculated using a load analysis table (see below).
First we need to be sure that we understand the differences between power and energy. Power is the instantaneous rate of doing work. Energy is the total work done. For example: one person might cycle 20 miles in one hour, whereas another person might cycle 20 miles in 2 hours. They have both gone the same distance (their total energyisthesame)butthefirstwasmorepowerful,astheyonlytookone hour. Power is measured in Watts (W), energy in Joules (J).
1W = 1 Joule per second (J/s). Similarly, 1 Watt hour (Wh) = 1J/s x 3600 seconds = 3600J.
Beforeeventhinkingaboutthespecificcomponentsof asystem,the overall requirements of the user and the operating conditions should be fully understood:•The user is interested in their equipment – light, mobile phones,
radio, refrigerator, etc.
ENERGY BOOK PRESS.indb 131 02/09/2014 14:55:45
Energy Part III chapter 3 – The details
– 132 –
•The user wants reliable power – peace of mind.
With this in mind, consider the following:
1. What is the service required by the user? (Lighting, communication, refrigeration etc.)
2. Whatisthemostappropriateappliancetofulfiluserneeds? (Torchorfloodlight,phoneorcomputer,fridgeorfreezeretc.)
3. What is the environment within which the system will operate? (Temperature – limits and variations– moisture, humidity etc.)
4. How long does the equipment need to last? (Who will operate, maintain and replace the equipment when it fails?)
These are just a few of the many considerations that need to be taken into account. Remember to always involve the end-user in discussions about their needs and wants and to keep in mind that system design is always an iterative process – if something cannot be economically or technically achieved, discuss and reassess and prioritise the needs and wants with the end-users themselves.
3.1.1 Example: lighting
If after conducting a basic demand assessment, an EWB-UK placement volunteer decides that providing a household with lighting is the best course of action, how can they decide what type of light bulb should be used? In general, it is desirable to choose lighting that is durable, affordable, locally available and that can offer high-qualitylightingefficiently(i.e.withminimalloadingrequirements).Table11showsthatintermsof lightingefficiency,LEDsarebest,
as they add a smaller load to an energy system to achieve the same lighting capacity. Similarly, they have the longest estimated lifetimes and therefore will seldom need replacements. However the upfront costs may be prohibitively expensive and in many countries they aresimplynotavailable–inwhichcase,compactfluorescentlights(CFLs)orfluorescenttubesmightbemoredesirable.Incandescent
ENERGY BOOK PRESS.indb 132 02/09/2014 14:55:45
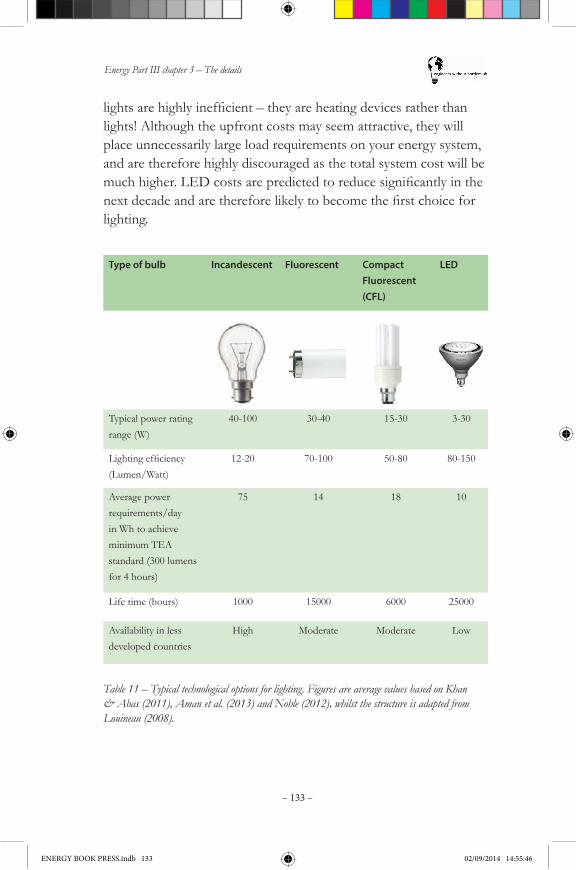
Energy Part III chapter 3 – The details
– 133 –
lightsarehighlyinefficient–theyareheatingdevicesratherthanlights! Although the upfront costs may seem attractive, they will place unnecessarily large load requirements on your energy system, and are therefore highly discouraged as the total system cost will be muchhigher.LEDcostsarepredictedtoreducesignificantlyinthenextdecadeandarethereforelikelytobecomethefirstchoiceforlighting.
Type of bulb Incandescent Fluorescent Compact Fluorescent (CFL)
LED
Typical power rating range (W)
40-100 30-40 15-30 3-30
Lightingefficiency(Lumen/Watt)
12-20 70-100 50-80 80-150
Average power requirements/day in Wh to achieve minimum TEA standard (300 lumens for 4 hours)
75 14 18 10
Life time (hours) 1000 15000 6000 25000
Availability in less developed countries
High Moderate Moderate Low
Table 11 – Typical technological options for lighting. Figures are average values based on Khan & Abas (2011), Aman et al. (2013) and Noble (2012), whilst the structure is adapted from Louineau (2008).
ENERGY BOOK PRESS.indb 133 02/09/2014 14:55:46
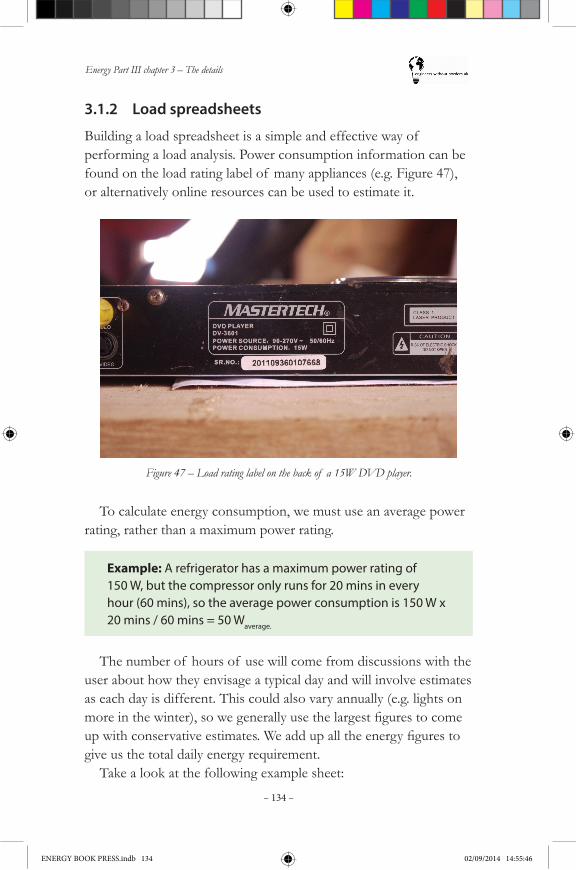
Energy Part III chapter 3 – The details
– 134 –
3.1.2 Load spreadsheets
Building a load spreadsheet is a simple and effective way of performing a load analysis. Power consumption information can be found on the load rating label of many appliances (e.g. Figure 47), or alternatively online resources can be used to estimate it.
Figure 47 – Load rating label on the back of a 15W DVD player.
To calculate energy consumption, we must use an average power rating, rather than a maximum power rating.
Example: A refrigerator has a maximum power rating of 150 W, but the compressor only runs for 20 mins in every hour (60 mins), so the average power consumption is 150 W x 20 mins / 60 mins = 50 Waverage.
The number of hours of use will come from discussions with the user about how they envisage a typical day and will involve estimates as each day is different. This could also vary annually (e.g. lights on moreinthewinter),sowegenerallyusethelargestfigurestocomeupwithconservativeestimates.Weaddupalltheenergyfigurestogive us the total daily energy requirement.
Take a look at the following example sheet:
ENERGY BOOK PRESS.indb 134 02/09/2014 14:55:46
Energy Part III chapter 3 – The details
– 135 –
Item Number Average Power (W)
Hours use per day (hrs)
Total energy per day (Whrs)
LightsFluorescent
5 15 3 (Summer) 5 (Winter)
375
Radio 1 5 5 25
Refrigerator 1 50 24 1200
Total 1600 Watt hours
So, in our example, our total average daily energy requirement (Eloads) is 1600 Watt hours. We can easily see in this list that the refrigerator consumes by far the most energy. If this was the case, thenitwouldbeimportanttoreviewanymoreefficientoptionsnow.
3.1.2.1 Maximum power requirement
It is also important to calculate the maximum power requirement, as this will determine the size of the cables, fuses and inverters (if using AC power). More detail on these components can be found in chapter 3, section 3.4: Practical system design – the details.
To calculate this we take the maximum power drawn by the loads if they were all switched on at the same time.
Example: The maximum power from the table above is:
Lighting: 5 x 15 W = 75 W
Radio: 1 x 5 W = 5 W
Refrigerator: 1 x 150 W = 150 W
Total: 230 Wmax
In this example, the maximum load demand (Pload_max) is 230 W.
If we are certain that all the loads will not be switched on at the same time then we can adjust our calculations and reduce this power level. This is usually called ‘electrical diversity’ and detailed discussion of this is outside the scope of this chapter. More details can usually be found in local electrical installation regulations (such as the BS7671 wiring regulations in the UK).
ENERGY BOOK PRESS.indb 135 02/09/2014 14:55:47
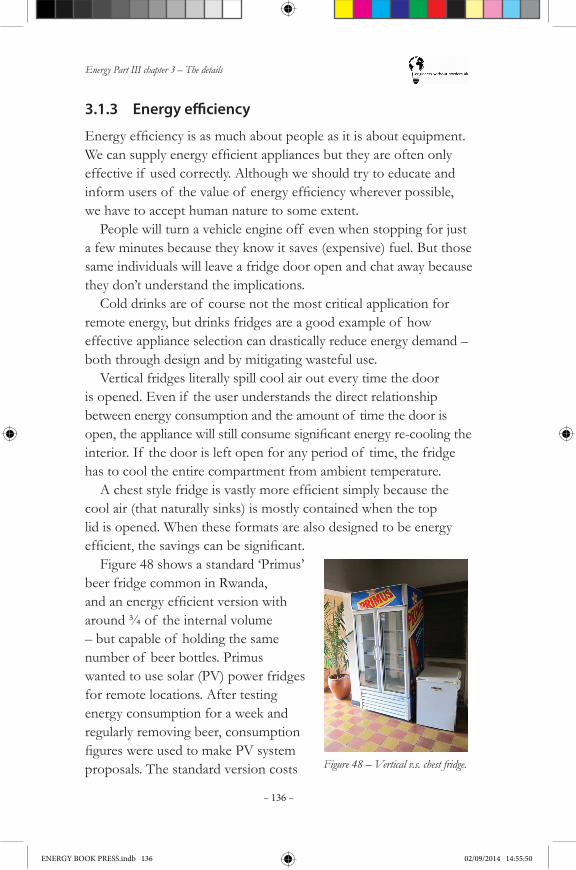
Energy Part III chapter 3 – The details
– 136 –
3.1.3 Energy efficiency
Energyefficiencyisasmuchaboutpeopleasitisaboutequipment.Wecansupplyenergyefficientappliancesbuttheyareoftenonlyeffective if used correctly. Although we should try to educate and informusersof thevalueof energyefficiencywhereverpossible,we have to accept human nature to some extent.
People will turn a vehicle engine off even when stopping for just a few minutes because they know it saves (expensive) fuel. But those same individuals will leave a fridge door open and chat away because they don’t understand the implications.
Cold drinks are of course not the most critical application for remote energy, but drinks fridges are a good example of how effective appliance selection can drastically reduce energy demand – both through design and by mitigating wasteful use.
Vertical fridges literally spill cool air out every time the door is opened. Even if the user understands the direct relationship between energy consumption and the amount of time the door is open,theappliancewillstillconsumesignificantenergyre-coolingtheinterior. If the door is left open for any period of time, the fridge has to cool the entire compartment from ambient temperature.Acheststylefridgeisvastlymoreefficientsimplybecausethe
cool air (that naturally sinks) is mostly contained when the top lid is opened. When these formats are also designed to be energy efficient,thesavingscanbesignificant.
Figure 48 shows a standard ‘Primus’ beer fridge common in Rwanda, andanenergyefficientversionwitharound ¾ of the internal volume – but capable of holding the same number of beer bottles. Primus wanted to use solar (PV) power fridges for remote locations. After testing energy consumption for a week and regularly removing beer, consumption figureswereusedtomakePVsystemproposals. The standard version costs Figure 48 – Vertical v.s. chest fridge.
ENERGY BOOK PRESS.indb 136 02/09/2014 14:55:50

Energy Part III chapter 3 – The details
– 137 –
around US$45,000 to power reliably for 5 years (in a shaded but not internal location) and the chest style costs around US$4000!
3.1.3.1 Efficient appliances
Energyefficientequipmentisusuallymarkedprominentlywithitslow rating. The sales literature is often based around how much lower the equipment consumption is compared to the standard versions – and how much money can be saved over the lifetime of the equipment.
Think of how LED light bulbs are marketed (and CFL versions before them): ‘11 W = equivalent to 60 W standard bulb and lasts ten times as long!’ Of course the upfront cost won’t usually be emphasised,asenergyefficientappliancescanbefarmoreexpensivethan‘standard’versions.Conversely,themostinefficientequipmentis likely to be marketed primarily on its low upfront cost. That low cost has been achieved by compromising a whole range of aspects – includingenergyconsumption.Theadditionalcostof theefficientequipmentwilllikelybejustifiedagainsttheenergysavingsmadewhen considering the life cycle costs of the entire energy system.
3.1.3.2 Optimising the equipment
Evenoninefficientequipment,ausercansignificantlyreducepower consumptions. For example, on many TVs and computers, turning the screen brightness down by, say, 10% might save 25% of the power consumption. Where possible, equipment should be appropriately sized – a small motor running at 65–100% load factor shouldoperatemoreefficientlythananoversizedmotoroperatingat part load.
Many portable devices such as smartphones, laptop computers andmediaequipmenthavespecificsettingsthatreducepowerconsumption. Aspects such as screen brightness, Wi-Fi and Bluetoothoperationcanhavesignificantconsumptionimplications.More complex equipment such as motors will require greater insightintothespecificsof theiroperationinordertoreducetheirconsumption. This may not be straightforward, but if at all possible it is worth reviewing the characteristics of the equipment to see if
ENERGY BOOK PRESS.indb 137 02/09/2014 14:55:50
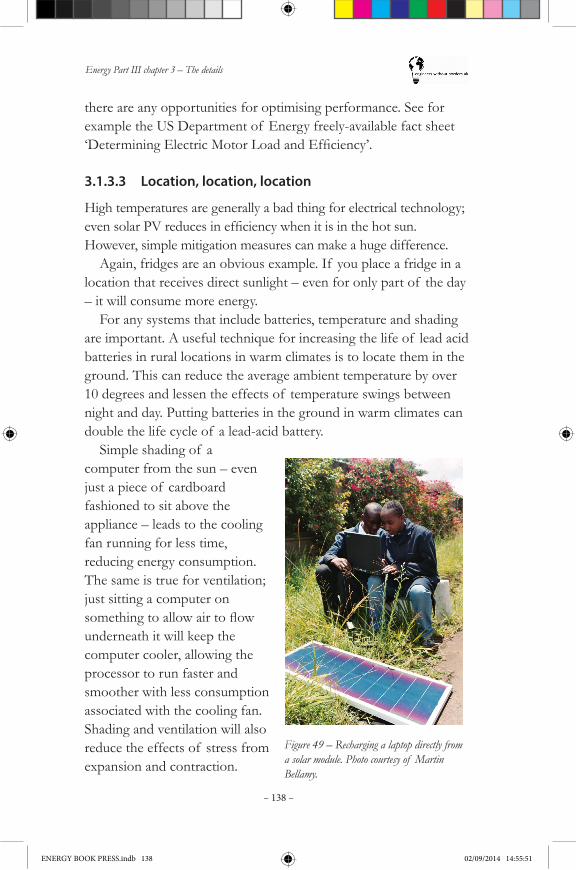
Energy Part III chapter 3 – The details
– 138 –
there are any opportunities for optimising performance. See for example the US Department of Energy freely-available fact sheet ‘DeterminingElectricMotorLoadandEfficiency’.
3.1.3.3 Location, location, location
High temperatures are generally a bad thing for electrical technology; evensolarPVreducesinefficiencywhenitisinthehotsun.However, simple mitigation measures can make a huge difference.
Again, fridges are an obvious example. If you place a fridge in a location that receives direct sunlight – even for only part of the day – it will consume more energy.
For any systems that include batteries, temperature and shading are important. A useful technique for increasing the life of lead acid batteries in rural locations in warm climates is to locate them in the ground. This can reduce the average ambient temperature by over 10 degrees and lessen the effects of temperature swings between night and day. Putting batteries in the ground in warm climates can double the life cycle of a lead-acid battery.
Simple shading of a computer from the sun – even just a piece of cardboard fashioned to sit above the appliance – leads to the cooling fan running for less time, reducing energy consumption. The same is true for ventilation; just sitting a computer on somethingtoallowairtoflowunderneath it will keep the computer cooler, allowing the processor to run faster and smoother with less consumption associated with the cooling fan. Shading and ventilation will also reduce the effects of stress from expansion and contraction.
Figure 49 – Recharging a laptop directly from a solar module. Photo courtesy of Martin Bellamy.
ENERGY BOOK PRESS.indb 138 02/09/2014 14:55:51

Energy Part III chapter 3 – The details
– 139 –
3.1.3.4 Selecting the correct equipment
In electrical systems, the cost of an energy solution is often directly proportional to the load requirement. It is not just the reduced energy consumption of the user equipment that is important; removingelectricalconversionsandotherinefficiencieswithinthesolutiondesignhassignificantbenefit.
A typical request may be ‘I need a solar power solution for a 1 kW waterpump.’A1kWwaterpumpwillrequiresignificantACpower;so an inverter must be used to convert DC power from batteries. Anyconversiondevicehasinefficienciesassociatedwithit;thismeans that more power needs to be generated, potentially also compromising reliability as inverters are electronic devices which introduce additional complexity and more potential fault points. However there are often additional factors to consider. Our AC waterpumpmayhaveastart-upcurrentsignificantlyhigherthanitsrunning requirement. This means the inverter will have to be sized for the maximum (start-up) current yet operate most of the time at amuchlower–andlikelylowerefficiency–level.
For example, our water pump could require 10 Amps for 30 seconds when starting, then run steadily at 2 Amps. Inverters can beover90%efficient,butusuallyonlyattheupperendof theiroperating range. The inverter – which must be capable of supplying 10Amps,willdosoataround90%efficiencyas1Ampislostintheconversion from AC to DC. However, when the current requirement fallsto2Amps,theefficiencyis67%,as1Ampisstilllostintheconversion. This means approximately 11 Amps is drawn from the batteryforthefirst30seconds,thenthecurrentrequirementfallstoa steady 3 Amps – 50% more than it needs to be. The battery and PV are also therefore 50% bigger – and 50% more expensive than necessary!
But what the end-user actually wants is to move a volume of water from one location to another in a given time under certain conditions.Thiscanbeachievedwithasimpler,highlyefficientandreliable water pump with a soft-start and designed to work with solar and on a DC system. Thus selecting the most appropriate (energy efficient)equipmentfortheservicethattheend-userrequiresiscrucial.
ENERGY BOOK PRESS.indb 139 02/09/2014 14:55:51
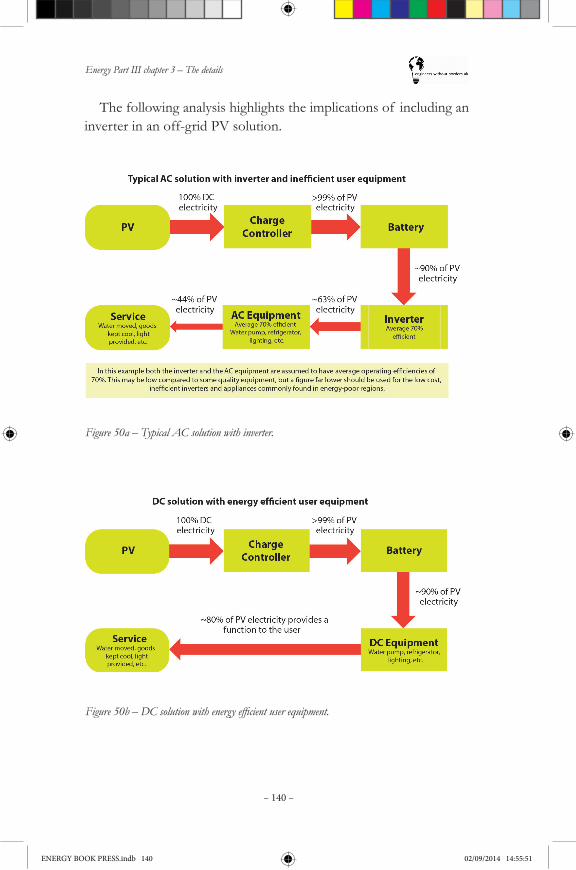
Energy Part III chapter 3 – The details
– 140 –
The following analysis highlights the implications of including an inverter in an off-grid PV solution.
Figure 50a – Typical AC solution with inverter.
Figure 50b – DC solution with energy efficient user equipment.
ENERGY BOOK PRESS.indb 140 02/09/2014 14:55:51

Energy Part III chapter 3 – The details
– 141 –
Assuming the appliance (a water pump, refrigerator, light, etc.) is70%efficient,only44%of thePVelectricityisactuallyusedtoperform a service (water moved, goods kept cool, light provided etc.) in an AC system with an inverter. However, if DC appliances areused,thereisnoefficiencylossbetweenthebatteryandtheappliances,soassuminga90%applianceefficiency,80%of thePVelectricity is actually used to perform a useful service. Additional systeminefficienciesoftenariseondayswhenitisverysunnyandthe batteries are already full.
For the AC solution both the inverter and the equipment are assumedtohaveaverageoperatingefficienciesof 70%.Thismaybelowcomparedtosomequalityequipment,howeverafigurefarlowershouldactuallybeusedforthelowcost,inefficientinvertersand appliances commonly found in energy-poor regions.AlthoughitisquitecommontohavehighlyefficientDC
equipment (because it is designed to run from disposable batteries), itcouldbearguedthatassuminga90%efficiencymakesanunfaircomparison with the AC system. However the proportions are appropriate: removing inverters from system designs is highly likely to halve the size – and therefore the cost – of the majority of ‘typical’ solutions. EWB-UK placement volunteers should thoroughly investigate the local availability of DC appliances and if it is possible to obtain the required items then a DC system is recommended.Theadvantagesof energyefficiencyapplytoallenergysystems.
Unfortunately they are not yet widely practiced.
ENERGY BOOK PRESS.indb 141 02/09/2014 14:55:52

Energy Part III chapter 3 – The details
– 142 –
Example: A rural school in central Africa. (Noteallfiguresareillustrativeonly.)
What typically happens:20 lowest cost PCs are purchased for, say, US$2,000.Then the project operators look for a power supply solution.They choose solar for reliability, low maintenance, etc.But they need to use inverters and AC equipment.The PV system to power the AC computers will cost ~US$40,000.Total solution cost = $42,000Operation without maintenance ~6 months.
What should happen:20 energy efficient PCs are purchased for, say, US$6,000.The project is designed specifically to be solar-powered.The whole system is DC and solid state – including the PCs (no fans).The PV system to power the computers will cost ~US$8,000.Total solution cost = $14,000Operation without maintenance ~5 years.
Notonlyisanefficientequipmentapproachcheaper,theyareusually more reliable and last longer. However, it is of the utmost importance that care is taken to ensure that a suitable supply chainisinplaceif newenergyefficientequipmentisintroduced, i.e. if it is imported from abroad, how will the usersbeabletoreplacetheenergyefficientequipmentif itbreaks?
ENERGY BOOK PRESS.indb 142 02/09/2014 14:55:52
Energy Part III chapter 3 – The details
– 143 –
3.1.3.5 Large area or high energy requirements
Where energy is needed over a wide area (more than a few tens of metres), or where high levels of energy are required in one location (e.g. a hospital or large building), it is worth considering the use of several smaller systems in place of a single large system. In such cases, it is sensible to identify large independent requirements, such as refrigerators, water pumps and air-conditioning, as these can be served by dedicated stand-alone solutions.
For example, a single large PV system may be the most cost effective solution for a given project, but it will also be the most complicated and require skilled maintenance. Logistics can also be a limiting factor for large components, such as batteries, in particularly remote areas. Choosing multiple smaller solutions over a large central PV power station reduces dependency on individual components, allows greater user involvement and will drastically reduce technical complexity and management issues. In some cases, e.g. vaccine refrigeration, redundancy of energy supply is particularly desirable (i.e. more than one system provides energy to the appliance). Smaller systems can be implemented in phases and can serve as learning platforms prior to larger, more disruptive equipment being implemented.
3.1.4 Summary
Thefirstandmostimportantstepintheenergysystemdesignprocess is to discuss and identify the needs and wants of the end-users. Using a questionnaire such as Practical Action’s ‘Total Energy Access’ (TEA) questionnaire may help achieve this task. This allows quickandeasyidentificationof howtheend-usersarecurrentlyusing energy and therefore how best to target an energy access project to address their needs and wants through the provision of energy services.
The next stage involves choosing appropriate appliances to provide these energy services and quantifying the resulting load requirements in order to determine the size and type of energy system needed. This section has focussed on electrical systems, however many of the concepts are transferable to mechanical or thermal systems.
ENERGY BOOK PRESS.indb 143 02/09/2014 14:55:52
Energy Part III chapter 3 – The details
– 144 –
Energyefficientequipmentmaybemoreexpensivetopurchase,howeveritislikelytosignificantlyreducetotalsystemcostsasfarless power generation and storage will be needed. It is important to considerthesupplychainforanynewenergyefficientequipmentintroduced in much the same way as the power generation technology itself, as if it cannot be repaired or replaced then the system will soon become useless as it will not be powerful enough to run the standard energy intensive equipment that is already widely available.
Removing electrical conversions reduces costs even further (often by half or more) and a completely DC solution is likely to be safer and more reliable than one with an additional AC component. In general, reducing system complexity makes things cheaper, more reliableandmoreefficient.
Remember that the end-user is only really interested in the energy services that a power generation system can provide – how it provides them is up to the system designer. A good system designer will be abletocreateanefficient,safeandreliablesystemthatiscapableof providing the energy services desired by the end-user when they want them, whilst minimising life cycle costs (although operation and maintenance, noise, visual intrusion and instilling a sense of ownership of the system are also important design considerations).
3.1.4.1 More information
Although this section has given more detailed information on the assessment of energy demand, the reader should refer to the additional information contained in chapter 4, Further reading and consult both an expert and a local champion before implementing any potential solutions.
3.2 Energy resources – the details3.2.1 Solar resource – the details
3.2.1.1 Solar energy vocabulary
BSENISO9488isanInternationalStandardthatdefinesthebasicterms relating to solar energy (in English, French and German). Hereweexplainspecifictermswhichareusedfordiscussionof solar resource.
ENERGY BOOK PRESS.indb 144 02/09/2014 14:55:52
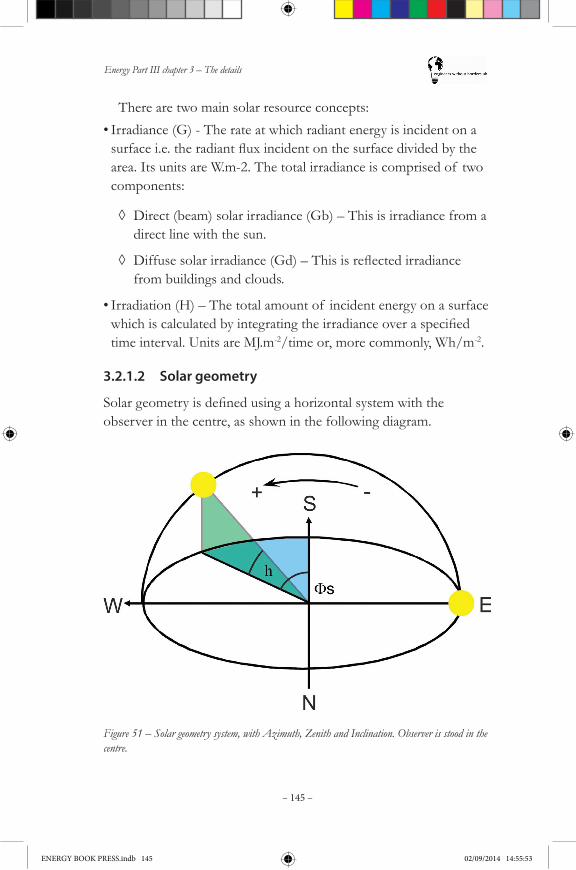
Energy Part III chapter 3 – The details
– 145 –
There are two main solar resource concepts: •Irradiance (G) - The rate at which radiant energy is incident on a surfacei.e.theradiantfluxincidentonthesurfacedividedbythearea. Its units are W.m-2. The total irradiance is comprised of two components:
◊ Direct (beam) solar irradiance (Gb) – This is irradiance from a direct line with the sun.
◊ Diffusesolarirradiance(Gd)–Thisisreflectedirradiancefrom buildings and clouds.
•Irradiation (H) – The total amount of incident energy on a surface whichiscalculatedbyintegratingtheirradianceoveraspecifiedtime interval. Units are MJ.m-2/time or, more commonly, Wh/m-2.
3.2.1.2 Solar geometry
Solargeometryisdefinedusingahorizontalsystemwiththeobserver in the centre, as shown in the following diagram.
Figure 51 – Solar geometry system, with Azimuth, Zenith and Inclination. Observer is stood in the centre.
ENERGY BOOK PRESS.indb 145 02/09/2014 14:55:53

Energy Part III chapter 3 – The details
– 146 –
•SolarAzimuth(φs)–Theprojectedanglebetweenastraightlinefrom the apparent position of the sun and due south (in the northern hemisphere) (i.e. the ‘compass’ angle). This is measured clockwise in the northern hemisphere.
•SolarZenithangle(θz)–Angulardistanceof thesunfromthevertical (not shown on diagram).
•Inclination or Solar Altitude Angle (h) – The complement of the solarzenithangleh=90°-θz.
•Angle of Incidence (u) – This is the angle of the direct solar radiation onto a surface (not shown on diagram).
3.2.1.3 Sun-path diagrams
Sun-path diagrams can be used to investigate shading issues at a particular site. They show the sun’s position through the sky for different moths of the year.
Obstacles can be measured and mapped onto the sun-path diagram to see how their shading would affect the system.
ENERGY BOOK PRESS.indb 146 02/09/2014 14:55:53
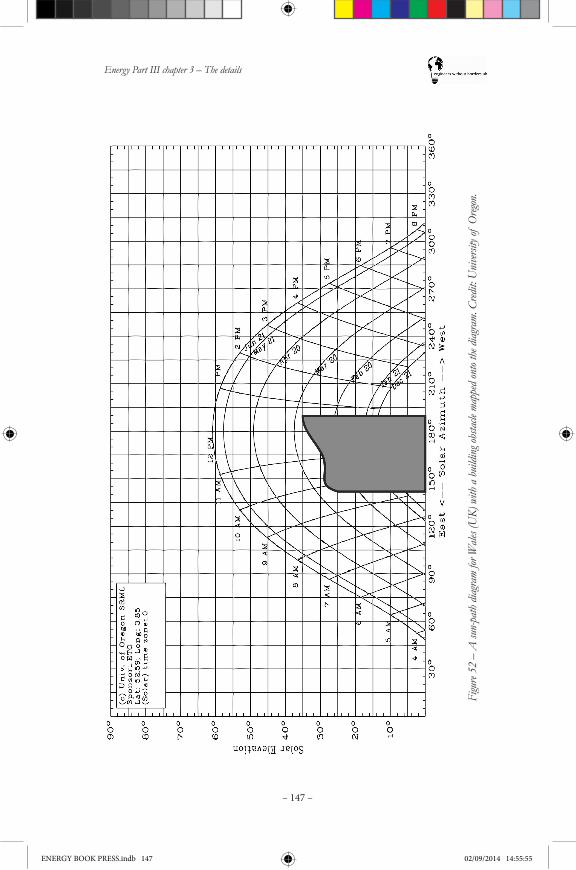
Energy Part III chapter 3 – The details
– 147 –
Figu
re 52
– A
sun-
path
diag
ram
for W
ales (
UK)
with
a bu
ilding
obsta
cle m
appe
d ont
o the
diag
ram.
Cred
it: U
niver
sity o
f O
regon
.
ENERGY BOOK PRESS.indb 147 02/09/2014 14:55:55

Energy Part III chapter 3 – The details
– 148 –
Sun-path diagrams require the location’s longitude and latitude. These can be entered into on-line sun-path diagram programs.(The diagram here, Figure 52, was drawn using http://solardat.uoregon.edu/SunChartProgram.html).
The path of the sun through the sky for the year can be shown, with each path marked by a different month. December through to June can be seen on this diagram, as July to November would just repeat these lines.
The sun is lowest in the sky in December and highest in June (as you would expect for the location).
With a compass and an inclinometer, readings of various obstacles can be taken. A building which would shade the array has been mapped onto the diagram here. It can be seen that between December and late February the building would totally shade the site between the hours of 9 a.m. until 1 p.m.
Whether this affects the design of the system depends upon what the system will be used for. If it is used for providing power to lights through the winter evenings, then this would not be acceptable and a better site should be found. If the system is designed to power an irrigation pump through the summer months (when there is no rainfall), then this site might be suitable.Specificinstrumentsthatcaptureadigitalimageof shadingand
print it onto a sun-path diagram can be obtained, such as the Solar Pathfinder(http://www.solarpathfinder.com), but these are only really useful if numerous site assessments are being performed.
3.2.1.4 Shading
Please see 3.3.1: Solar PV – the details, for more information on shading.
3.2.1.5 More information
Although this section has given more detailed information on the solar resource, the reader should refer to the additional information contained in chapter 4, Further reading and consult both an expert and a local champion before implementing any potential solutions.
ENERGY BOOK PRESS.indb 148 02/09/2014 14:55:55
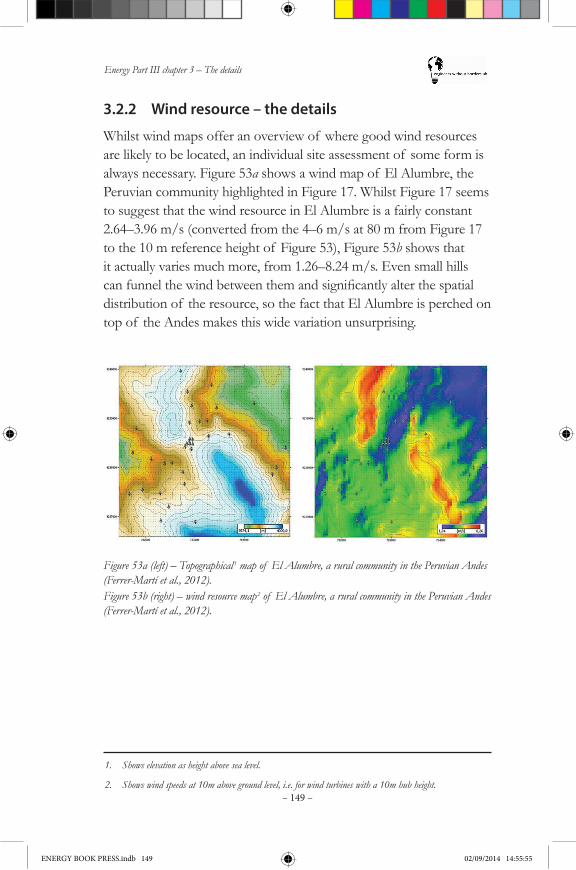
Energy Part III chapter 3 – The details
– 149 –
3.2.2 Wind resource – the details
Whilst wind maps offer an overview of where good wind resources are likely to be located, an individual site assessment of some form is always necessary. Figure 53a shows a wind map of El Alumbre, the Peruvian community highlighted in Figure 17. Whilst Figure 17 seems to suggest that the wind resource in El Alumbre is a fairly constant 2.64–3.96 m/s (converted from the 4–6 m/s at 80 m from Figure 17 to the 10 m reference height of Figure 53), Figure 53b shows that it actually varies much more, from 1.26–8.24 m/s. Even small hills canfunnelthewindbetweenthemandsignificantlyalterthespatialdistribution of the resource, so the fact that El Alumbre is perched on top of the Andes makes this wide variation unsurprising.
Figure 53a (left) – Topographical 1 map of El Alumbre, a rural community in the Peruvian Andes (Ferrer-Martí et al., 2012). Figure 53b (right) – wind resource map 2 of El Alumbre, a rural community in the Peruvian Andes (Ferrer-Martí et al., 2012).
1. Shows elevation as height above sea level.
2. Shows wind speeds at 10m above ground level, i.e. for wind turbines with a 10m hub height.
ENERGY BOOK PRESS.indb 149 02/09/2014 14:55:55
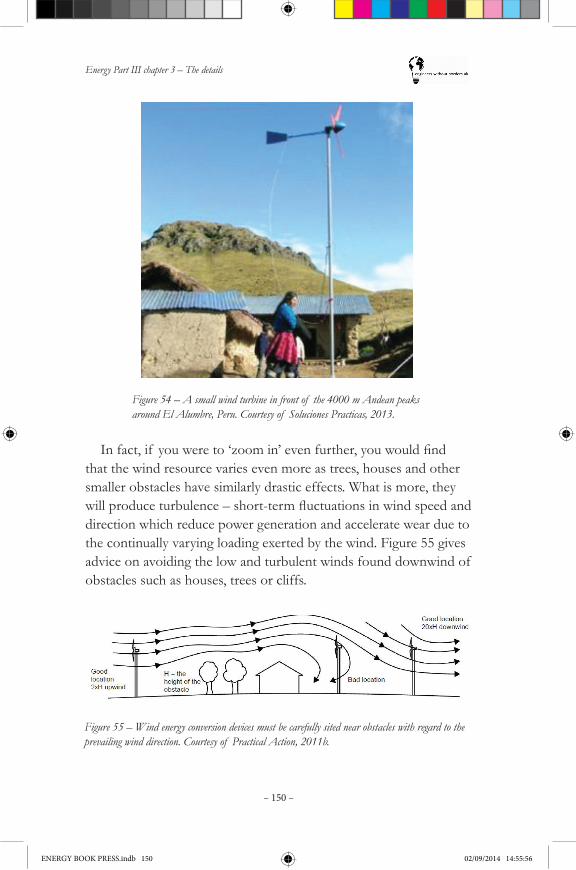
Energy Part III chapter 3 – The details
– 150 –
Figure 55 – Wind energy conversion devices must be carefully sited near obstacles with regard to the prevailing wind direction. Courtesy of Practical Action, 2011b.
Figure 54 – A small wind turbine in front of the 4000 m Andean peaks around El Alumbre, Peru. Courtesy of Soluciones Practicas, 2013.
Infact,if youwereto‘zoomin’evenfurther,youwouldfindthat the wind resource varies even more as trees, houses and other smaller obstacles have similarly drastic effects. What is more, they willproduceturbulence–short-termfluctuationsinwindspeedanddirection which reduce power generation and accelerate wear due to the continually varying loading exerted by the wind. Figure 55 gives advice on avoiding the low and turbulent winds found downwind of obstacles such as houses, trees or cliffs.
ENERGY BOOK PRESS.indb 150 02/09/2014 14:55:56
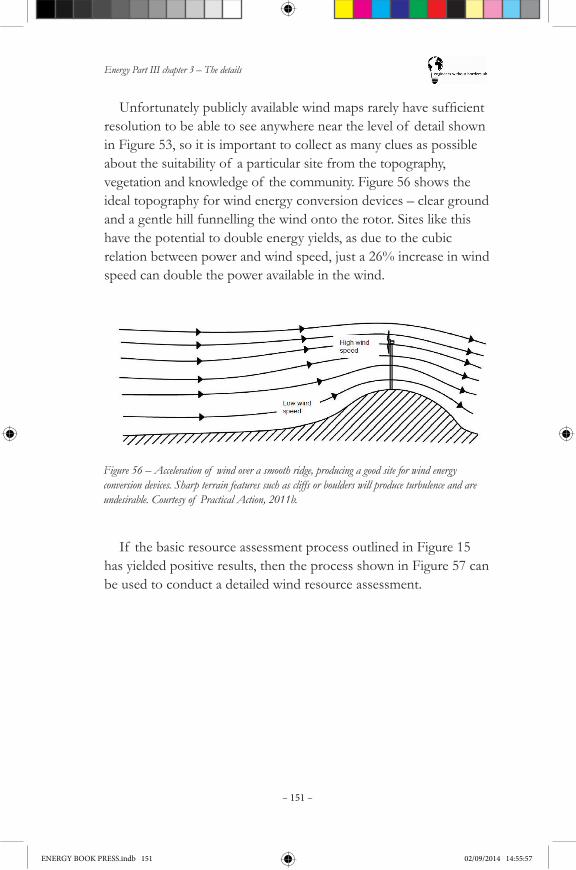
Energy Part III chapter 3 – The details
– 151 –
Unfortunatelypubliclyavailablewindmapsrarelyhavesufficientresolution to be able to see anywhere near the level of detail shown in Figure 53, so it is important to collect as many clues as possible about the suitability of a particular site from the topography, vegetation and knowledge of the community. Figure 56 shows the ideal topography for wind energy conversion devices – clear ground and a gentle hill funnelling the wind onto the rotor. Sites like this have the potential to double energy yields, as due to the cubic relation between power and wind speed, just a 26% increase in wind speed can double the power available in the wind.
Figure 56 – Acceleration of wind over a smooth ridge, producing a good site for wind energy conversion devices. Sharp terrain features such as cliffs or boulders will produce turbulence and are undesirable. Courtesy of Practical Action, 2011b.
If the basic resource assessment process outlined in Figure 15 has yielded positive results, then the process shown in Figure 57 can be used to conduct a detailed wind resource assessment.
ENERGY BOOK PRESS.indb 151 02/09/2014 14:55:57
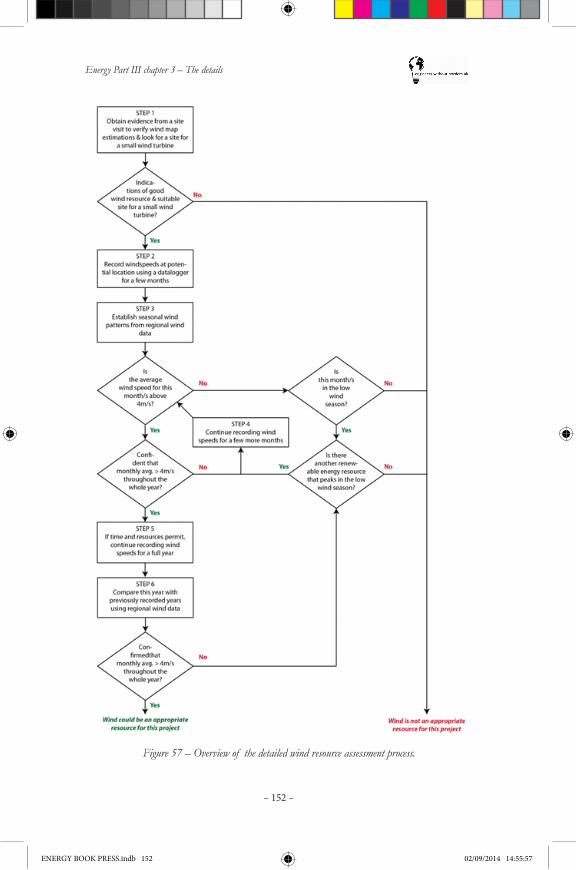
Energy Part III chapter 3 – The details
– 152 –
Figure 57 – Overview of the detailed wind resource assessment process.
ENERGY BOOK PRESS.indb 152 02/09/2014 14:55:57
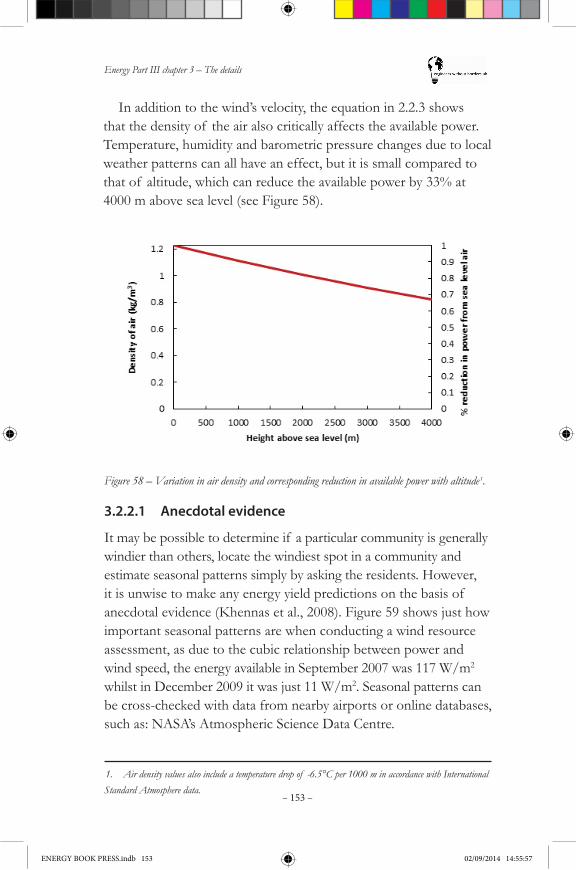
Energy Part III chapter 3 – The details
– 153 –
In addition to the wind’s velocity, the equation in 2.2.3 shows that the density of the air also critically affects the available power. Temperature, humidity and barometric pressure changes due to local weather patterns can all have an effect, but it is small compared to that of altitude, which can reduce the available power by 33% at 4000 m above sea level (see Figure 58).
Figure 58 – Variation in air density and corresponding reduction in available power with altitude 1.
1. Air density values also include a temperature drop of -6.5°C per 1000 m in accordance with International Standard Atmosphere data.
3.2.2.1 Anecdotal evidence
It may be possible to determine if a particular community is generally windier than others, locate the windiest spot in a community and estimate seasonal patterns simply by asking the residents. However, it is unwise to make any energy yield predictions on the basis of anecdotal evidence (Khennas et al., 2008). Figure 59 shows just how important seasonal patterns are when conducting a wind resource assessment, as due to the cubic relationship between power and wind speed, the energy available in September 2007 was 117 W/m2 whilst in December 2009 it was just 11 W/m2. Seasonal patterns can be cross-checked with data from nearby airports or online databases, such as: NASA’s Atmospheric Science Data Centre.
ENERGY BOOK PRESS.indb 153 02/09/2014 14:55:57
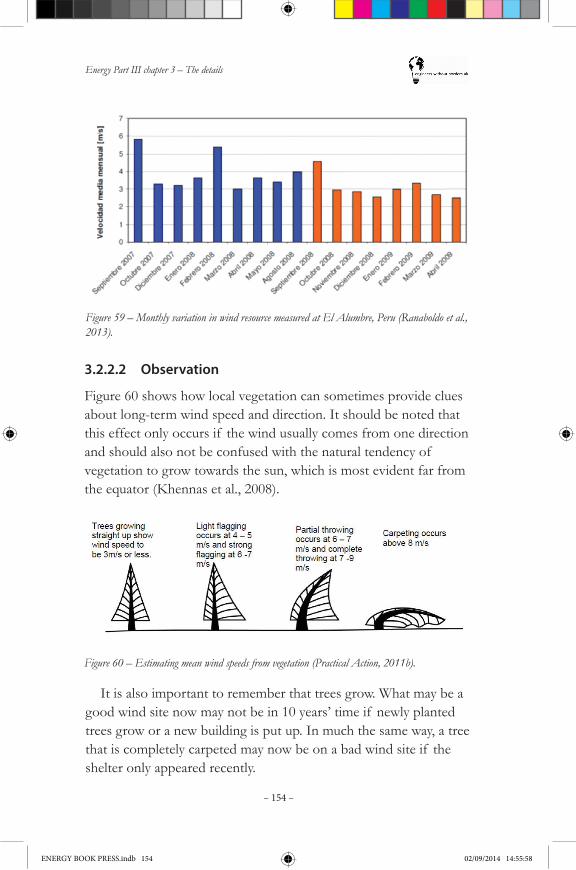
Energy Part III chapter 3 – The details
– 154 –
Figure 59 – Monthly variation in wind resource measured at El Alumbre, Peru (Ranaboldo et al., 2013).
Figure 60 – Estimating mean wind speeds from vegetation (Practical Action, 2011b).
3.2.2.2 Observation
Figure 60 shows how local vegetation can sometimes provide clues about long-term wind speed and direction. It should be noted that this effect only occurs if the wind usually comes from one direction and should also not be confused with the natural tendency of vegetation to grow towards the sun, which is most evident far from the equator (Khennas et al., 2008).
It is also important to remember that trees grow. What may be a good wind site now may not be in 10 years’ time if newly planted trees grow or a new building is put up. In much the same way, a tree that is completely carpeted may now be on a bad wind site if the shelter only appeared recently.
ENERGY BOOK PRESS.indb 154 02/09/2014 14:55:58
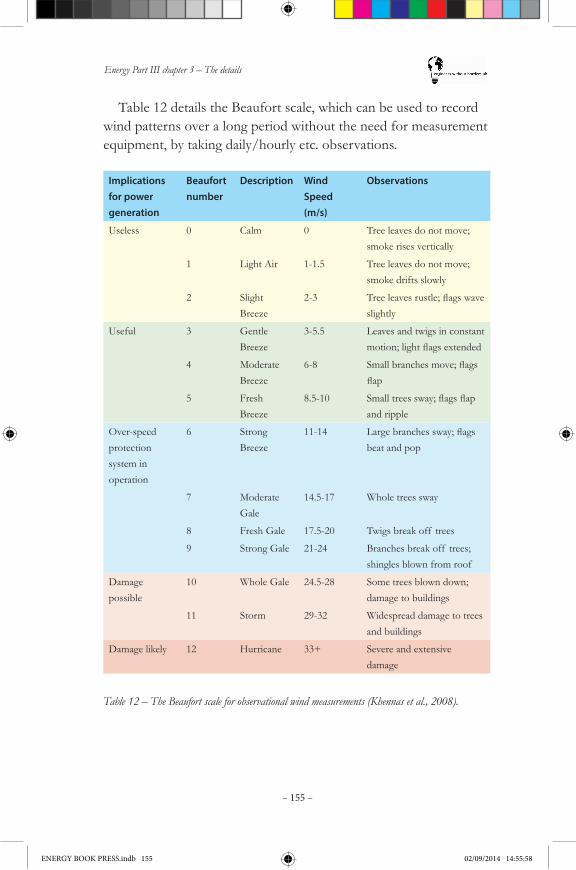
Energy Part III chapter 3 – The details
– 155 –
Table 12 details the Beaufort scale, which can be used to record wind patterns over a long period without the need for measurement equipment, by taking daily/hourly etc. observations.
Implications for power generation
Beaufort number
Description Wind Speed (m/s)
Observations
Useless 0 Calm 0 Tree leaves do not move; smoke rises vertically
1 Light Air 1-1.5 Tree leaves do not move; smoke drifts slowly
2 Slight Breeze
2-3 Treeleavesrustle;flagswaveslightly
Useful 3 Gentle Breeze
3-5.5 Leaves and twigs in constant motion;lightflagsextended
4 Moderate Breeze
6-8 Smallbranchesmove;flagsflap
5 Fresh Breeze
8.5-10 Smalltreessway;flagsflapand ripple
Over-speed protection system in operation
6 Strong Breeze
11-14 Largebranchessway;flagsbeat and pop
7 Moderate Gale
14.5-17 Whole trees sway
8 Fresh Gale 17.5-20 Twigs break off trees
9 Strong Gale 21-24 Branches break off trees; shingles blown from roof
Damage possible
10 Whole Gale 24.5-28 Some trees blown down; damage to buildings
11 Storm 29-32 Widespread damage to trees and buildings
Damage likely 12 Hurricane 33+ Severe and extensive damage
Table 12 – The Beaufort scale for observational wind measurements (Khennas et al., 2008).
ENERGY BOOK PRESS.indb 155 02/09/2014 14:55:58
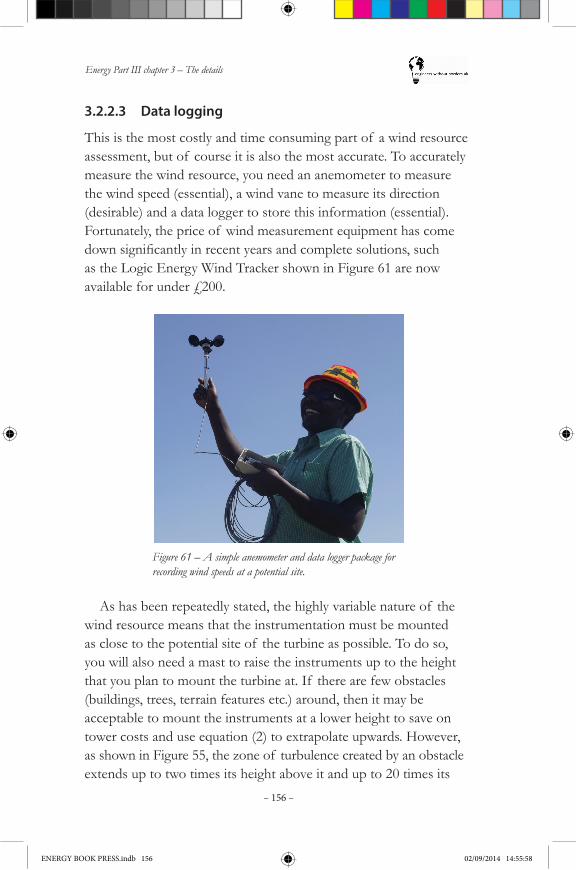
Energy Part III chapter 3 – The details
– 156 –
3.2.2.3 Data logging
This is the most costly and time consuming part of a wind resource assessment, but of course it is also the most accurate. To accurately measure the wind resource, you need an anemometer to measure the wind speed (essential), a wind vane to measure its direction (desirable) and a data logger to store this information (essential). Fortunately, the price of wind measurement equipment has come downsignificantlyinrecentyearsandcompletesolutions,suchas the Logic Energy Wind Tracker shown in Figure 61 are now available for under £200.
Figure 61 – A simple anemometer and data logger package for recording wind speeds at a potential site.
As has been repeatedly stated, the highly variable nature of the wind resource means that the instrumentation must be mounted as close to the potential site of the turbine as possible. To do so, you will also need a mast to raise the instruments up to the height that you plan to mount the turbine at. If there are few obstacles (buildings, trees, terrain features etc.) around, then it may be acceptable to mount the instruments at a lower height to save on tower costs and use equation (2) to extrapolate upwards. However, as shown in Figure 55, the zone of turbulence created by an obstacle extends up to two times its height above it and up to 20 times its
ENERGY BOOK PRESS.indb 156 02/09/2014 14:55:58
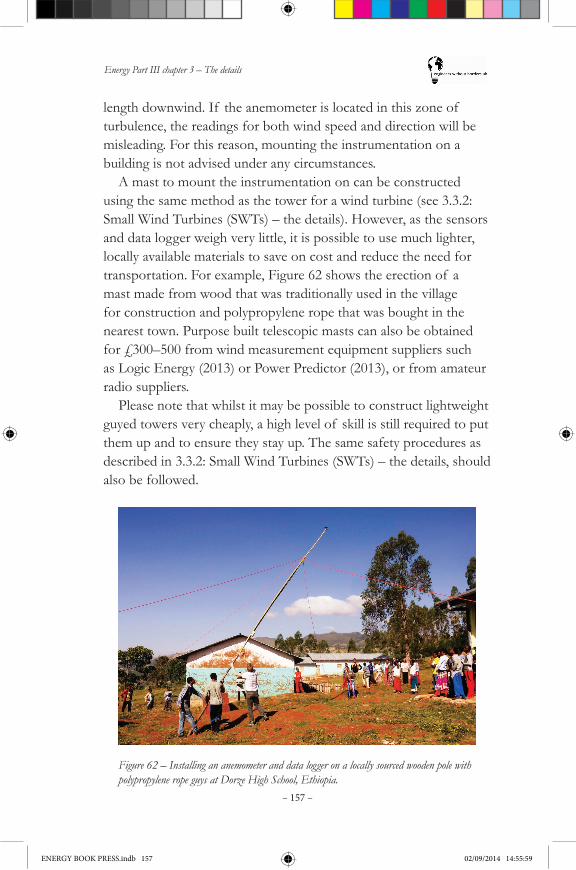
Energy Part III chapter 3 – The details
– 157 –
length downwind. If the anemometer is located in this zone of turbulence, the readings for both wind speed and direction will be misleading. For this reason, mounting the instrumentation on a building is not advised under any circumstances.
A mast to mount the instrumentation on can be constructed using the same method as the tower for a wind turbine (see 3.3.2: Small Wind Turbines (SWTs) – the details). However, as the sensors and data logger weigh very little, it is possible to use much lighter, locally available materials to save on cost and reduce the need for transportation. For example, Figure 62 shows the erection of a mast made from wood that was traditionally used in the village for construction and polypropylene rope that was bought in the nearest town. Purpose built telescopic masts can also be obtained for £300–500 from wind measurement equipment suppliers such as Logic Energy (2013) or Power Predictor (2013), or from amateur radio suppliers.
Please note that whilst it may be possible to construct lightweight guyed towers very cheaply, a high level of skill is still required to put them up and to ensure they stay up. The same safety procedures as described in 3.3.2: Small Wind Turbines (SWTs) – the details, should also be followed.
Figure 62 – Installing an anemometer and data logger on a locally sourced wooden pole with polypropylene rope guys at Dorze High School, Ethiopia.
ENERGY BOOK PRESS.indb 157 02/09/2014 14:55:59
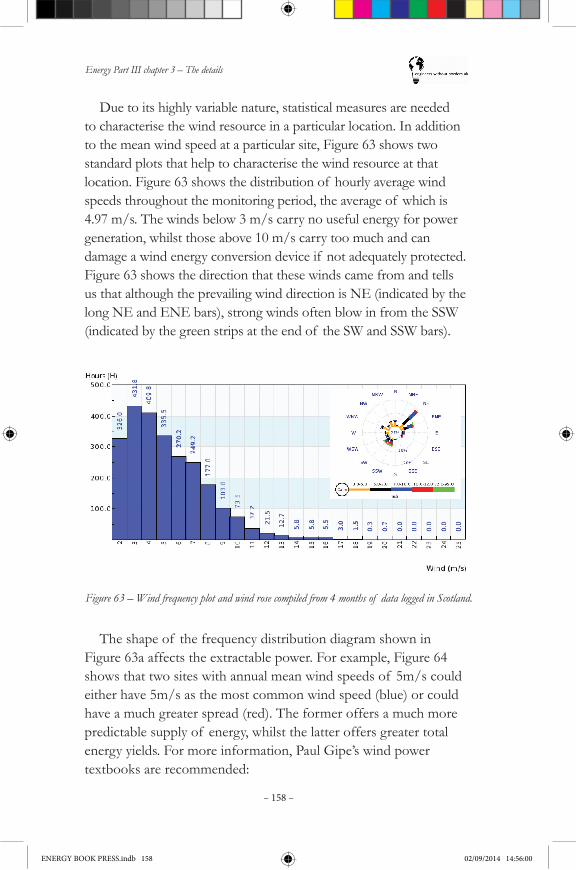
Energy Part III chapter 3 – The details
– 158 –
The shape of the frequency distribution diagram shown in Figure 63a affects the extractable power. For example, Figure 64 shows that two sites with annual mean wind speeds of 5m/s could either have 5m/s as the most common wind speed (blue) or could have a much greater spread (red). The former offers a much more predictable supply of energy, whilst the latter offers greater total energy yields. For more information, Paul Gipe’s wind power textbooks are recommended:
Due to its highly variable nature, statistical measures are needed to characterise the wind resource in a particular location. In addition to the mean wind speed at a particular site, Figure 63 shows two standard plots that help to characterise the wind resource at that location. Figure 63 shows the distribution of hourly average wind speeds throughout the monitoring period, the average of which is 4.97 m/s. The winds below 3 m/s carry no useful energy for power generation, whilst those above 10 m/s carry too much and can damage a wind energy conversion device if not adequately protected. Figure 63 shows the direction that these winds came from and tells us that although the prevailing wind direction is NE (indicated by the long NE and ENE bars), strong winds often blow in from the SSW (indicated by the green strips at the end of the SW and SSW bars).
Figure 63 – Wind frequency plot and wind rose compiled from 4 months of data logged in Scotland.
ENERGY BOOK PRESS.indb 158 02/09/2014 14:56:00
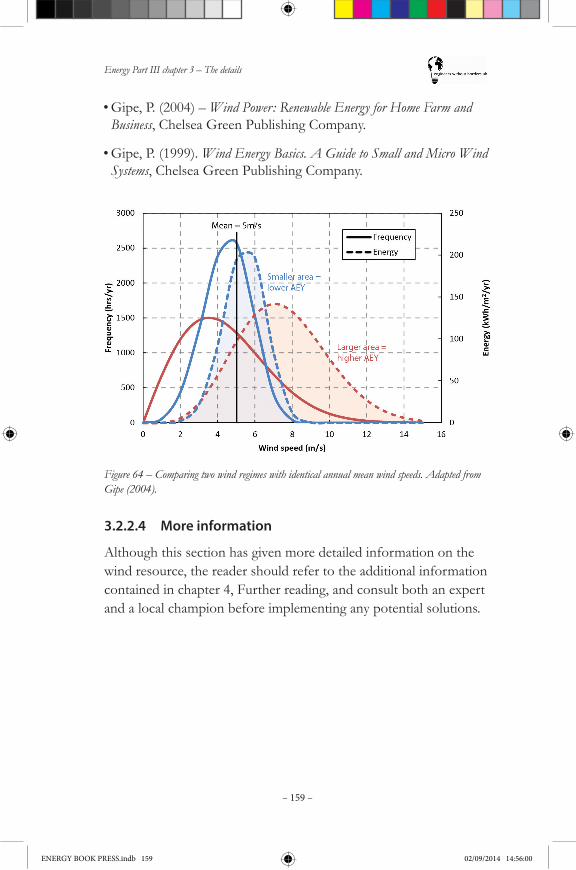
Energy Part III chapter 3 – The details
– 159 –
Figure 64 – Comparing two wind regimes with identical annual mean wind speeds. Adapted from Gipe (2004).
3.2.2.4 More information
Although this section has given more detailed information on the wind resource, the reader should refer to the additional information contained in chapter 4, Further reading, and consult both an expert and a local champion before implementing any potential solutions.
•Gipe, P. (2004) – Wind Power: Renewable Energy for Home Farm and Business, Chelsea Green Publishing Company.
•Gipe, P. (1999). Wind Energy Basics. A Guide to Small and Micro Wind Systems, Chelsea Green Publishing Company.
ENERGY BOOK PRESS.indb 159 02/09/2014 14:56:00

Energy Part III chapter 3 – The details
– 160 –
3.2.3 Hydro resource – the details
Hydropowerisacombinationof headandflowrate(seesection2.2.4). This section describes various techniques for measuring (or atleastestimating)theheadandflowrateatapotentialsite.Formore information on the techniques described in this section, please refer to:•Harvey’s (1993) Micro-hydro Design Manual.
3.2.3.1 Measuring head
There are several different methods to measure head. The simplest are summarised below.•GPS: using a GPS altimeter, the altitude at the proposed intake,
forebay and powerhouse can be measured to determine the total head available.
•Sighting meter: sighting meters can be used to measure the inclinationangle(α)of aslope,withthelineardistance(L)measuredwitheitheratapeorthrougharangefinder.Usingtrigonometry,theheadcanbefound(H=Lxsinα).
•Map: maps can be used to determine head for high head schemes, but requires an accurate map for the area, and there is a possibility that the incorrect sites are identified.
•Spirit level and tape measure: for lower heads, a spirit level, plank and tape measure can be used. The spirit level is strapped to the plank, which is extended level down the slope and the head at each portion can be measured. For very low heads in simple sites, such as terraced fields,atapemeasurecanbeusedto measure the height of the terracing, as shown in Figure 65.
Figure 65 – Measuring terrace height using a tape measure.
ENERGY BOOK PRESS.indb 160 02/09/2014 14:56:00
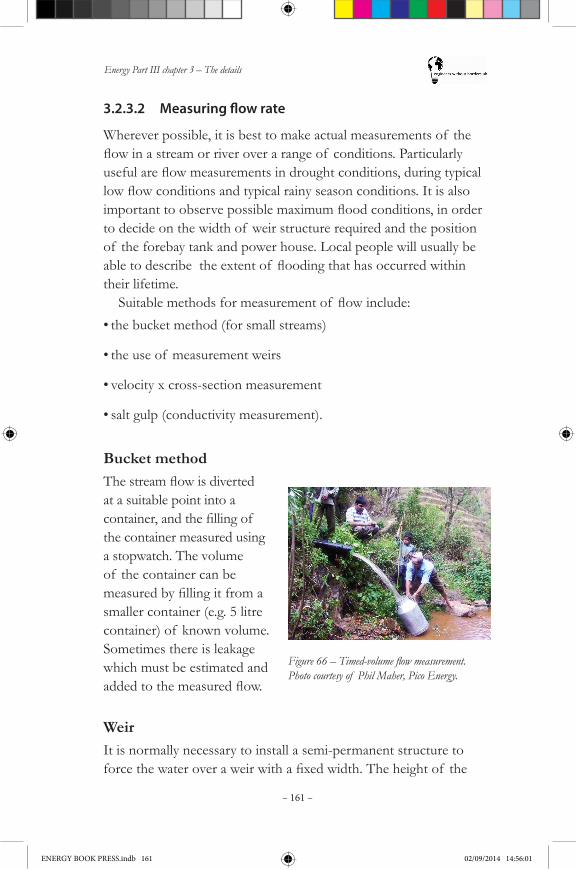
Energy Part III chapter 3 – The details
– 161 –
3.2.3.2 Measuring flow rate
Wherever possible, it is best to make actual measurements of the flowinastreamorriveroverarangeof conditions.Particularlyusefulareflowmeasurementsindroughtconditions,duringtypicallowflowconditionsandtypicalrainyseasonconditions.Itisalsoimportanttoobservepossiblemaximumfloodconditions,inorderto decide on the width of weir structure required and the position of the forebay tank and power house. Local people will usually be abletodescribetheextentof floodingthathasoccurredwithintheir lifetime.Suitablemethodsformeasurementof flowinclude:
•the bucket method (for small streams)
•the use of measurement weirs
•velocity x cross-section measurement
•salt gulp (conductivity measurement).
Bucket method Thestreamflowisdivertedat a suitable point into a container,andthefillingof the container measured using a stopwatch. The volume of the container can be measuredbyfillingitfromasmaller container (e.g. 5 litre container) of known volume. Sometimes there is leakage which must be estimated and addedtothemeasuredflow.
Figure 66 – Timed-volume flow measurement. Photo courtesy of Phil Maher, Pico Energy.
WeirIt is normally necessary to install a semi-permanent structure to forcethewateroveraweirwithafixedwidth.Theheightof the
ENERGY BOOK PRESS.indb 161 02/09/2014 14:56:01

Energy Part III chapter 3 – The details
– 162 –
waterrelativetothetopof theweirisusedtomeasuretheflowrate.The weir must be horizontal across the stream, so that the depth is the same at all points along the section. The weir may use a sharp crest (e.g. when made from sheet metal) or a broad crest (when made from masonry or concrete). Note that in each case the height of the water, h, is taken as the height of the water surface upstream of the weir above the point at which the surface reduces due to the effect of the velocity increasing as it reaches the weir. There are two equationsrelatingflowtoh for weirs with a rectangular section and width b:
Sharp-crested weir: Q=1.8bh1.5
Broad-crested weir: Q=1.7bh1.5
A V-notch weir can also be used, which gives fairly accurate measurementsoverawiderrangeof flows,butneedsagreaterdepthforthesameflow.Thesimplestversionhasanotchwitha90˚angleat the bottom. Again h is measured from the bottom of the notch to the upstream water level.
V-notch weir: Q=1.39h2.5
Figure 67 – A rectangular measurement weir fitted into a temporary dam. Photo courtesy Jack Giles.
ENERGY BOOK PRESS.indb 162 02/09/2014 14:56:01
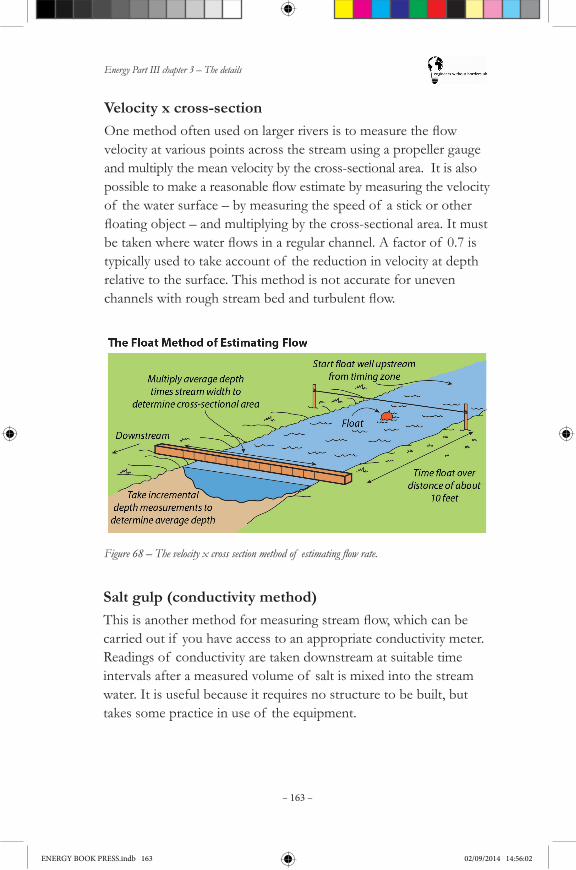
Energy Part III chapter 3 – The details
– 163 –
Velocity x cross-sectionOnemethodoftenusedonlargerriversistomeasuretheflowvelocity at various points across the stream using a propeller gauge and multiply the mean velocity by the cross-sectional area. It is also possibletomakeareasonableflowestimatebymeasuringthevelocityof the water surface – by measuring the speed of a stick or other floatingobject–andmultiplyingbythecross-sectionalarea.Itmustbetakenwherewaterflowsinaregularchannel.Afactorof 0.7istypically used to take account of the reduction in velocity at depth relative to the surface. This method is not accurate for uneven channelswithroughstreambedandturbulentflow.
Figure 68 – The velocity x cross section method of estimating flow rate.
Salt gulp (conductivity method)Thisisanothermethodformeasuringstreamflow,whichcanbecarried out if you have access to an appropriate conductivity meter. Readings of conductivity are taken downstream at suitable time intervals after a measured volume of salt is mixed into the stream water. It is useful because it requires no structure to be built, but takes some practice in use of the equipment.
ENERGY BOOK PRESS.indb 163 02/09/2014 14:56:02
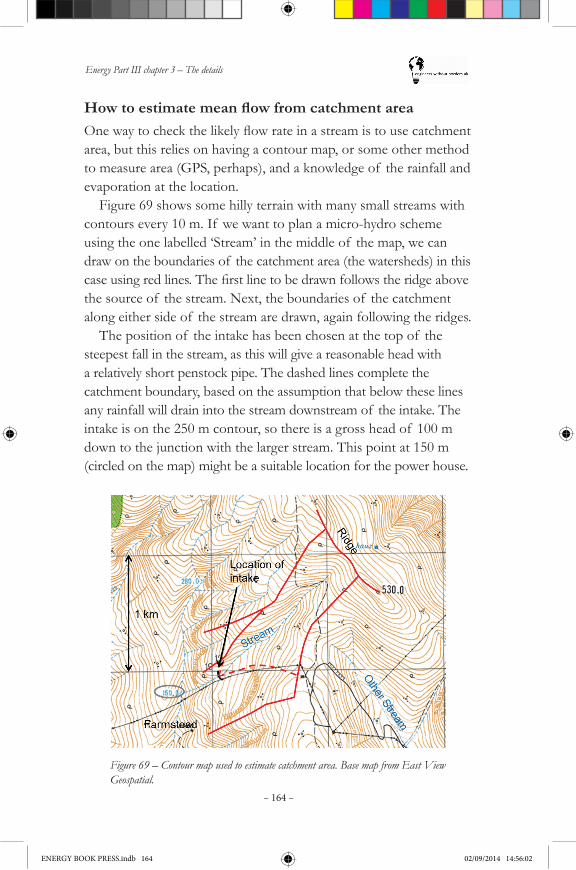
Energy Part III chapter 3 – The details
– 164 –
HowtoestimatemeanflowfromcatchmentareaOnewaytocheckthelikelyflowrateinastreamistousecatchmentarea, but this relies on having a contour map, or some other method to measure area (GPS, perhaps), and a knowledge of the rainfall and evaporation at the location.
Figure 69 shows some hilly terrain with many small streams with contours every 10 m. If we want to plan a micro-hydro scheme using the one labelled ‘Stream’ in the middle of the map, we can draw on the boundaries of the catchment area (the watersheds) in this caseusingredlines.Thefirstlinetobedrawnfollowstheridgeabovethe source of the stream. Next, the boundaries of the catchment along either side of the stream are drawn, again following the ridges.
The position of the intake has been chosen at the top of the steepest fall in the stream, as this will give a reasonable head with a relatively short penstock pipe. The dashed lines complete the catchment boundary, based on the assumption that below these lines any rainfall will drain into the stream downstream of the intake. The intake is on the 250 m contour, so there is a gross head of 100 m down to the junction with the larger stream. This point at 150 m (circled on the map) might be a suitable location for the power house.
Figure 69 – Contour map used to estimate catchment area. Base map from East View Geospatial.
ENERGY BOOK PRESS.indb 164 02/09/2014 14:56:02

Energy Part III chapter 3 – The details
– 165 –
The catchment area can be estimated by taking it as roughly equivalent to a rectangle 0.5 km x 0.8 km and a triangle down to the intake location, with base 0.5 km and height also 0.5 km. The total area is therefore 0.4 km2 + 0.25 km2 = 0.65 km2.
The amount of water draining into the stream from the catchment depends on the annual rainfall and evaporation. The rainfall data needs local information that can usually be obtained fromthelocalmeteorologicaloffice,butmayneedadjustmentforaltitude or rain-shadow effects. Evaporation data should also be available but tends to be constant over a much wider area. Value from locations up to 200 km distance should be usable, if a local value is not available.
At this site, the annual rainfall is 1200 mm and the evaporation is 600mm,sothenetamountof waterflowingintothestreameachyear should be 0.65 x 106 x (1.2 - 0.6) = 0.39 x 10⁶ m3. This can be convertedtoameanflowrateinm3/s by dividing by the number of seconds in a year (approx. 31.5 x 10⁶): 0.39/31.5 = 0.012 m3/s or 12 l/s. Assuming a net head 1 of 90 m, equation 1 gives:
Pwater = ρgHQ = 1,000 x 9.81 x 90 x 0.012 = 10,595 W = 10.6 kW
However,itwouldbeunwisetobasetheprojectonmeanflow,asmuchof thetimetheturbinewillthenberunninginefficiently.Thedesignflowrateshouldbemuchlessthanthis,dependingonthevariationof flowduringtheyear.6l/smightbeamorereasonableestimateforthedesignflow,whichwouldreducethepoweravailableto 5.3 kW.
1. Gross head is the height difference; net head is that difference less the head loss in the penstock, etc. i.e. net head is the head actually driving the turbine.
HowtouseyourflowmeasurementsIdeally,dailyflowmeasurements,rainfallandevaporationdataoverseveral years would be available for your micro-hydro scheme to give an accurate hydrograph. However, in reality for pico- and micro-hydro sites these are not available. Using the estimates from the catchmentareamethod,alongwithverifiedsitemeasurements,anestimateof theflowratecanbefound.
ENERGY BOOK PRESS.indb 165 02/09/2014 14:56:02
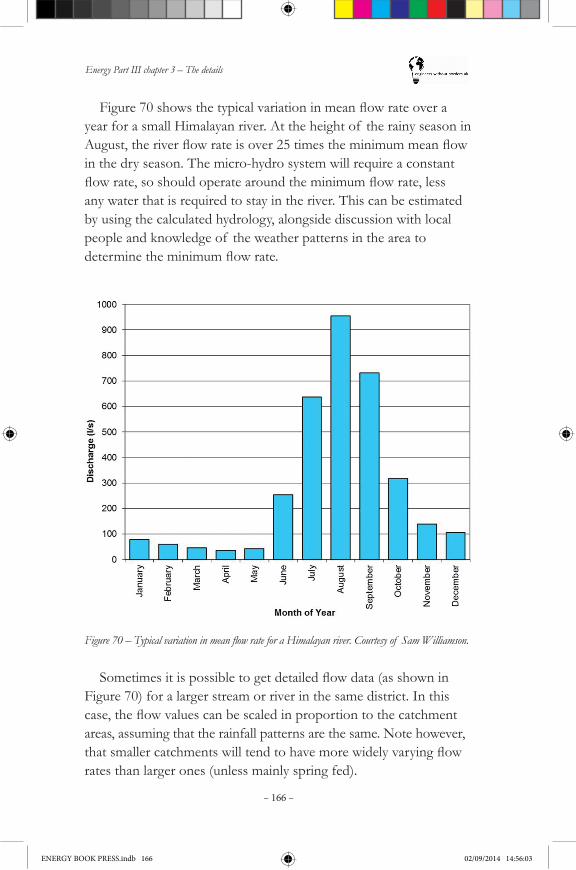
Energy Part III chapter 3 – The details
– 166 –
Figure70showsthetypicalvariationinmeanflowrateoverayear for a small Himalayan river. At the height of the rainy season in August,theriverflowrateisover25timestheminimummeanflowin the dry season. The micro-hydro system will require a constant flowrate,soshouldoperatearoundtheminimumflowrate,lessany water that is required to stay in the river. This can be estimated by using the calculated hydrology, alongside discussion with local people and knowledge of the weather patterns in the area to determinetheminimumflowrate.
Figure 70 – Typical variation in mean flow rate for a Himalayan river. Courtesy of Sam Williamson.
Sometimesitispossibletogetdetailedflowdata(asshowninFigure 70) for a larger stream or river in the same district. In this case,theflowvaluescanbescaledinproportiontothecatchmentareas, assuming that the rainfall patterns are the same. Note however, thatsmallercatchmentswilltendtohavemorewidelyvaryingflowrates than larger ones (unless mainly spring fed).
ENERGY BOOK PRESS.indb 166 02/09/2014 14:56:03

Energy Part III chapter 3 – The details
– 167 –
DesignoptionsforstreamswithlowdryseasonflowIf dryseasonflowsarelowerthanthenormalflowrequiredtomeetlocal electricity demand, then there are two sensible ways forward. One option (especially for low head schemes) is to choose a turbine withhighpart-loadefficiency,sothatevenindryseasontheoutputis reasonable. Another option is to incorporate a water storage tank attheforebaythatisbigenoughtostoreafewhoursof flow.If theturbine is turned off during times of low electricity demand, the storagetankcanrefilltoallowfulloutputwhenneeded(typicallyinthe evening).Forexample,inthehighheadschemewitha6l/sflowrate
described above, the tank size needed for 3 hours full operation would be:
6 l/s x 3,600 s/h x 3 h = 60,480l = 60.5 m3
Itmaynotbedifficulttoconstructsuchatankfrommasonryand/or cement.
Figure 71 – A small storage tank for dry season daily storage. (Kathamba, Kenya – Phil Maher, Pico Energy).
ENERGY BOOK PRESS.indb 167 02/09/2014 14:56:03
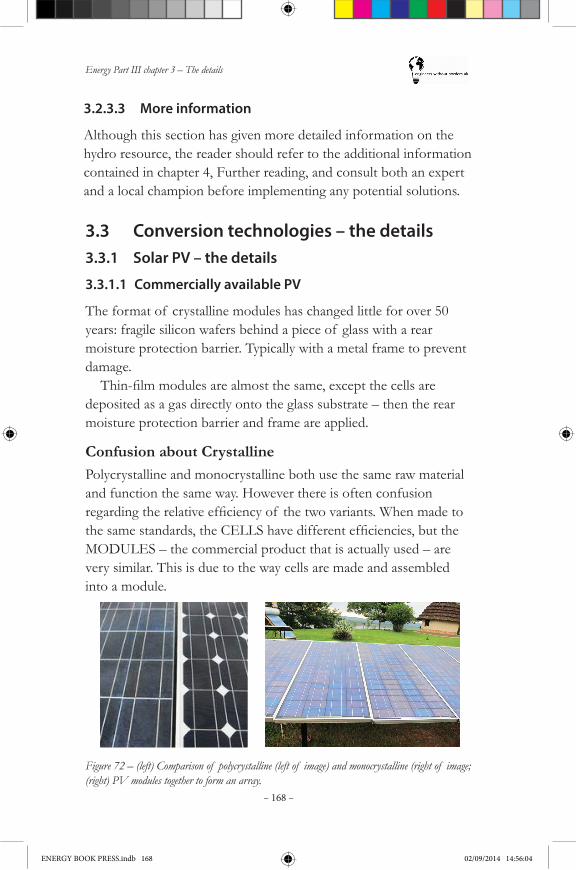
Energy Part III chapter 3 – The details
– 168 –
3.2.3.3 More information
Although this section has given more detailed information on the hydro resource, the reader should refer to the additional information contained in chapter 4, Further reading, and consult both an expert and a local champion before implementing any potential solutions.
3.3 Conversion technologies – the details3.3.1 Solar PV – the details
3.3.1.1 Commercially available PV
The format of crystalline modules has changed little for over 50 years: fragile silicon wafers behind a piece of glass with a rear moisture protection barrier. Typically with a metal frame to prevent damage.Thin-filmmodulesarealmostthesame,exceptthecellsare
deposited as a gas directly onto the glass substrate – then the rear moisture protection barrier and frame are applied.
Confusion about CrystallinePolycrystalline and monocrystalline both use the same raw material and function the same way. However there is often confusion regardingtherelativeefficiencyof thetwovariants.Whenmadetothesamestandards,theCELLShavedifferentefficiencies,buttheMODULES – the commercial product that is actually used – are very similar. This is due to the way cells are made and assembled into a module.
Figure 72 – (left) Comparison of polycrystalline (left of image) and monocrystalline (right of image; (right) PV modules together to form an array.
ENERGY BOOK PRESS.indb 168 02/09/2014 14:56:04
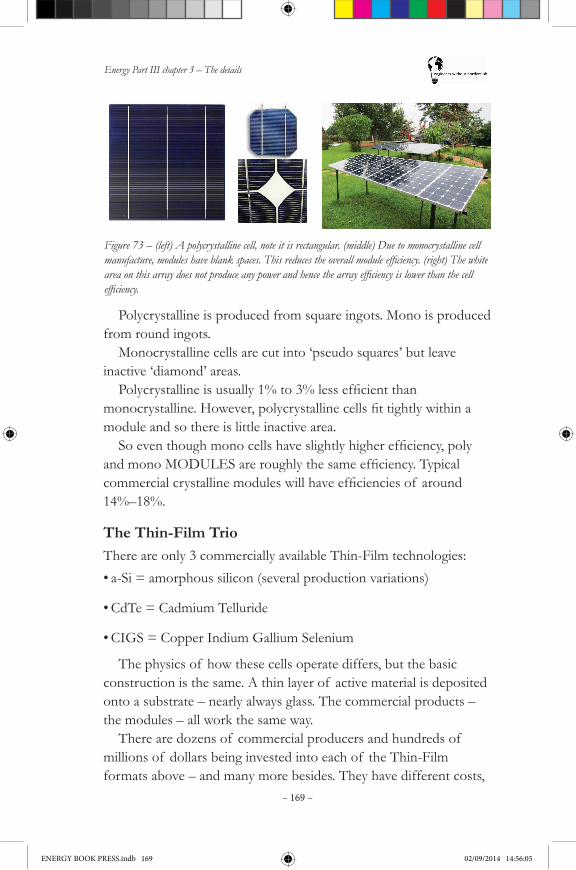
Energy Part III chapter 3 – The details
– 169 –
Figure 73 – (left) A polycrystalline cell, note it is rectangular. (middle) Due to monocrystalline cell manufacture, modules have blank spaces. This reduces the overall module efficiency. (right) The white area on this array does not produce any power and hence the array efficiency is lower than the cell efficiency.
Polycrystalline is produced from square ingots. Mono is produced from round ingots.
Monocrystalline cells are cut into ‘pseudo squares’ but leave inactive ‘diamond’ areas.Polycrystallineisusually1%to3%lessefficientthan
monocrystalline.However,polycrystallinecellsfittightlywithinamodule and so there is little inactive area.Soeventhoughmonocellshaveslightlyhigherefficiency,poly
andmonoMODULESareroughlythesameefficiency.Typicalcommercialcrystallinemoduleswillhaveefficienciesof around14%–18%.
The Thin-Film TrioThere are only 3 commercially available Thin-Film technologies:•a-Si = amorphous silicon (several production variations)
•CdTe = Cadmium Telluride
•CIGS = Copper Indium Gallium Selenium
The physics of how these cells operate differs, but the basic construction is the same. A thin layer of active material is deposited onto a substrate – nearly always glass. The commercial products – the modules – all work the same way.
There are dozens of commercial producers and hundreds of millions of dollars being invested into each of the Thin-Film formats above – and many more besides. They have different costs,
ENERGY BOOK PRESS.indb 169 02/09/2014 14:56:05
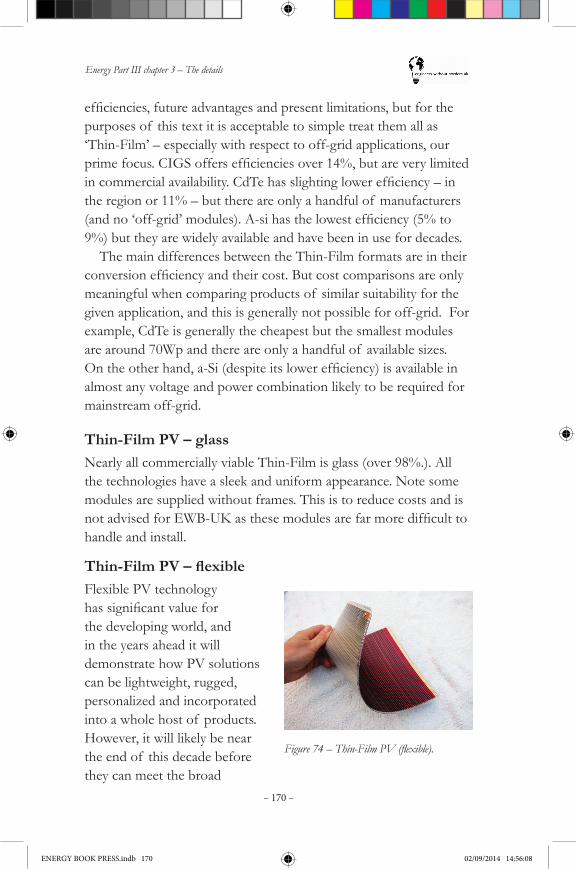
Energy Part III chapter 3 – The details
– 170 –
efficiencies,futureadvantagesandpresentlimitations,butforthepurposes of this text it is acceptable to simple treat them all as ‘Thin-Film’ – especially with respect to off-grid applications, our primefocus.CIGSoffersefficienciesover14%,butareverylimitedincommercialavailability.CdTehasslightinglowerefficiency–inthe region or 11% – but there are only a handful of manufacturers (andno‘off-grid’modules).A-sihasthelowestefficiency(5%to9%) but they are widely available and have been in use for decades.
The main differences between the Thin-Film formats are in their conversionefficiencyandtheircost.Butcostcomparisonsareonlymeaningful when comparing products of similar suitability for the given application, and this is generally not possible for off-grid. For example, CdTe is generally the cheapest but the smallest modules are around 70Wp and there are only a handful of available sizes. Ontheotherhand,a-Si(despiteitslowerefficiency)isavailableinalmost any voltage and power combination likely to be required for mainstream off-grid.
Thin-Film PV – glassNearly all commercially viable Thin-Film is glass (over 98%.). All the technologies have a sleek and uniform appearance. Note some modules are supplied without frames. This is to reduce costs and is notadvisedforEWB-UKasthesemodulesarefarmoredifficulttohandle and install.
Thin-FilmPV–flexibleFlexible PV technology hassignificantvalueforthe developing world, and in the years ahead it will demonstrate how PV solutions can be lightweight, rugged, personalized and incorporated into a whole host of products. However, it will likely be near the end of this decade before they can meet the broad
Figure 74 – Thin-Film PV (flexible).
ENERGY BOOK PRESS.indb 170 02/09/2014 14:56:08

Energy Part III chapter 3 – The details
– 171 –
requirements of off-grid (or compete commercially with glass modules).
There are hundreds of articles and product designs and there have been dozens of companies who have actually produced flexiblePV,howeverthetechnologyhasrepeatedlyfailedtoliveup to promises, let alone expectations. Flexible products have been unreliable, have short lifetimes (1 to 2 years), are expensive and most importantly, have actually been quite susceptible to mechanical failures–oftencausedbyflexingthemodule.ThefewflexiblePVproductsonthemarketremainexpensive
and vulnerable to the environment – especially compared with their glass counterparts.
3.3.1.2 Site selection and installation
The physical installation of PV falls into one of four categories: •Building Integrated (BIPV)
•Building mounted
•Ground mounted
•Purpose built structure.
Bespoke structures can be anything from wooden or metal frameworks through to structures such as carports. The installation type refers to the PV modules themselves rather than the electrical equipment – which can take a number of installation formats.
Building Integrated (BIPV)BIPV modules and installations are simply too expensive and complicated to justify widespread use in the industrialised world, let alone less developed countries. Existing BIPV installations are usually the result of architectural statements and aesthetic appeal rather than commercial viability.
Building mountedFor off-grid, nearly all installations in the industrialised world are ground mounted, but in the developing world they tend to be an even split between building and ground installed.
ENERGY BOOK PRESS.indb 171 02/09/2014 14:56:08

Energy Part III chapter 3 – The details
– 172 –
PV capacities up to approximately 100 W do not present significantmountingissuesforabuilding.Howevercapacitiesabove this are not recommended for EWB-UK solutions due to the implications of the PV weight on the building roof and structure, retaining the environmental protection of the building (roof or sides), the wind-loading effect and electrical integration of the PV system into the existing building wiring.
There are occasions when a large building mounted solution is required – sometimes at the request of the owner who wants the PV on the building for security reasons or to save cost on the ground mounted structure. In such circumstances it is essential a competent structural engineer assesses the integrity of the building. Typical crystalline PV panels weigh approximately 15 kg/m2 or 15 kg/100 W – excluding themetalworkthatholdsthemtotheroof –andtheyexertsignificantforce (in all directions) during windy conditions. Other considerations arehowthePVisfixedtothebuilding,routingof cablesfromoutside to inside and access for installation and maintenance/cleaning. All of this must be achieved without compromising the weather defences of the building.
Figure 75 – Small modules can be mounted easily, as long as the weatherproof nature of the roof is maintained. However, large arrays require a high number of fixings (through the roof membrane), will catch the wind and are very heavy.
ENERGY BOOK PRESS.indb 172 02/09/2014 14:56:15
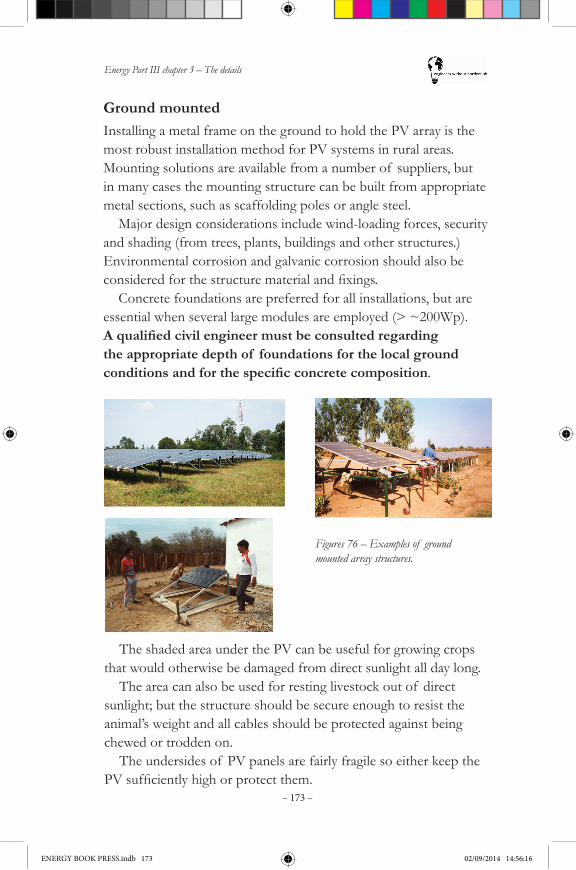
Energy Part III chapter 3 – The details
– 173 –
The shaded area under the PV can be useful for growing crops that would otherwise be damaged from direct sunlight all day long.
The area can also be used for resting livestock out of direct sunlight; but the structure should be secure enough to resist the animal’s weight and all cables should be protected against being chewed or trodden on.
The undersides of PV panels are fairly fragile so either keep the PVsufficientlyhighorprotectthem.
Figures 76 – Examples of ground mounted array structures.
Ground mountedInstalling a metal frame on the ground to hold the PV array is the most robust installation method for PV systems in rural areas. Mounting solutions are available from a number of suppliers, but in many cases the mounting structure can be built from appropriate metal sections, such as scaffolding poles or angle steel.
Major design considerations include wind-loading forces, security and shading (from trees, plants, buildings and other structures.) Environmental corrosion and galvanic corrosion should also be consideredforthestructurematerialandfixings.
Concrete foundations are preferred for all installations, but are essential when several large modules are employed (> ~200Wp). Aqualifiedcivilengineermustbeconsultedregardingthe appropriate depth of foundations for the local ground conditionsandforthespecificconcretecomposition.
ENERGY BOOK PRESS.indb 173 02/09/2014 14:56:16
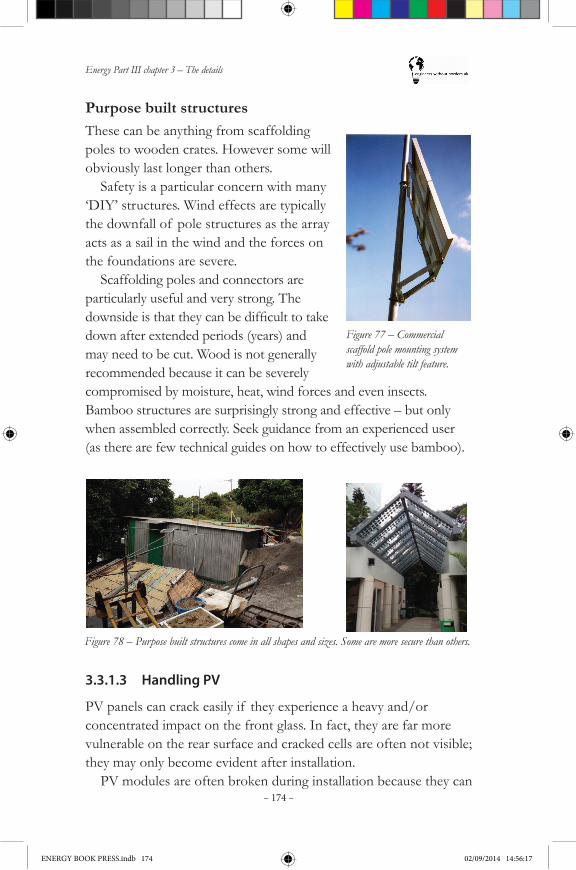
Energy Part III chapter 3 – The details
– 174 –
Purpose built structuresThese can be anything from scaffolding poles to wooden crates. However some will obviously last longer than others.
Safety is a particular concern with many ‘DIY’ structures. Wind effects are typically the downfall of pole structures as the array acts as a sail in the wind and the forces on the foundations are severe.
Scaffolding poles and connectors are particularly useful and very strong. The downsideisthattheycanbedifficulttotakedown after extended periods (years) and may need to be cut. Wood is not generally recommended because it can be severely compromised by moisture, heat, wind forces and even insects. Bamboo structures are surprisingly strong and effective – but only when assembled correctly. Seek guidance from an experienced user (as there are few technical guides on how to effectively use bamboo).
Figure 78 – Purpose built structures come in all shapes and sizes. Some are more secure than others.
3.3.1.3 Handling PV
PV panels can crack easily if they experience a heavy and/or concentrated impact on the front glass. In fact, they are far more vulnerable on the rear surface and cracked cells are often not visible; they may only become evident after installation.
PV modules are often broken during installation because they can
Figure 77 – Commercial scaffold pole mounting system with adjustable tilt feature.
ENERGY BOOK PRESS.indb 174 02/09/2014 14:56:17
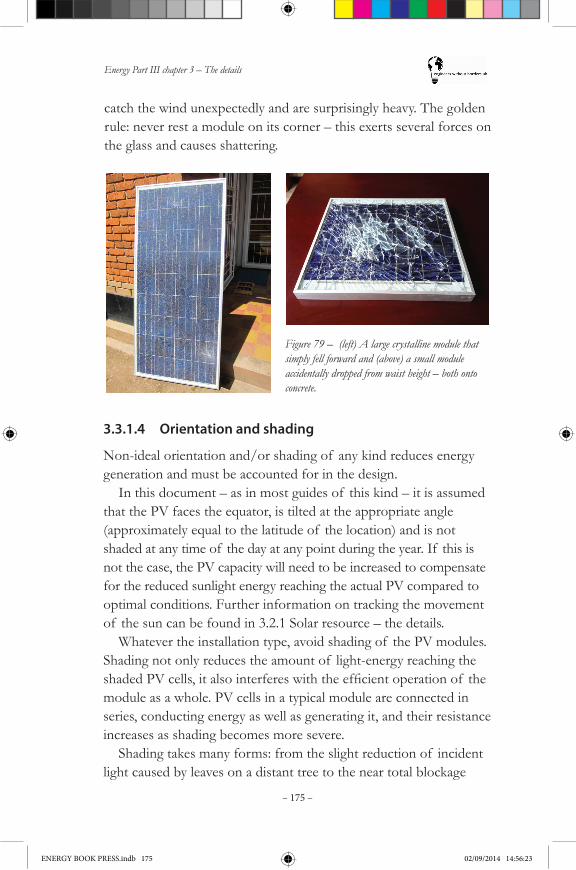
Energy Part III chapter 3 – The details
– 175 –
Figure 79 – (left) A large crystalline module that simply fell forward and (above) a small module accidentally dropped from waist height – both onto concrete.
3.3.1.4 Orientation and shading
Non-ideal orientation and/or shading of any kind reduces energy generation and must be accounted for in the design.
In this document – as in most guides of this kind – it is assumed that the PV faces the equator, is tilted at the appropriate angle (approximately equal to the latitude of the location) and is not shaded at any time of the day at any point during the year. If this is not the case, the PV capacity will need to be increased to compensate for the reduced sunlight energy reaching the actual PV compared to optimal conditions. Further information on tracking the movement of the sun can be found in 3.2.1 Solar resource – the details.
Whatever the installation type, avoid shading of the PV modules. Shading not only reduces the amount of light-energy reaching the shadedPVcells,italsointerfereswiththeefficientoperationof themodule as a whole. PV cells in a typical module are connected in series, conducting energy as well as generating it, and their resistance increases as shading becomes more severe.
Shading takes many forms: from the slight reduction of incident light caused by leaves on a distant tree to the near total blockage
catch the wind unexpectedly and are surprisingly heavy. The golden rule: never rest a module on its corner – this exerts several forces on the glass and causes shattering.
ENERGY BOOK PRESS.indb 175 02/09/2014 14:56:23
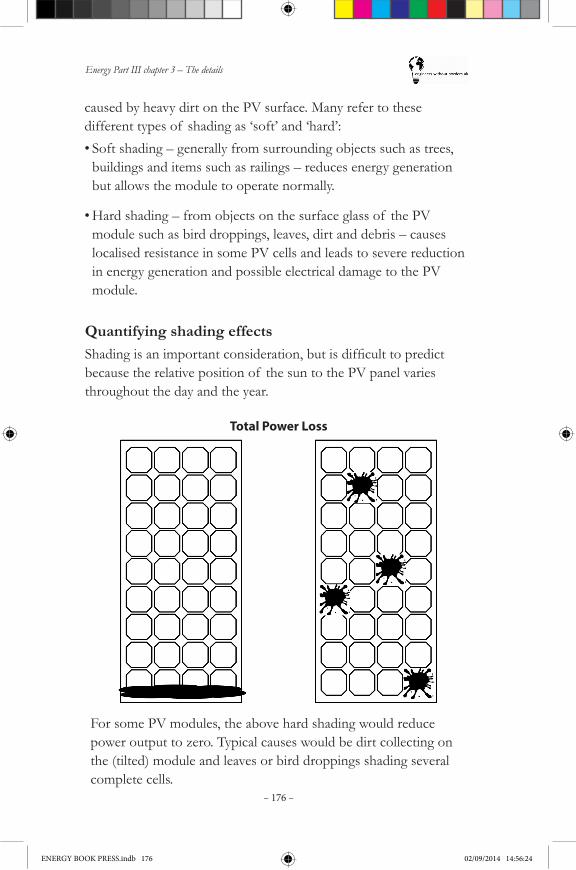
Energy Part III chapter 3 – The details
– 176 –
caused by heavy dirt on the PV surface. Many refer to these different types of shading as ‘soft’ and ‘hard’:•Soft shading – generally from surrounding objects such as trees,
buildings and items such as railings – reduces energy generation but allows the module to operate normally.
•Hard shading – from objects on the surface glass of the PV module such as bird droppings, leaves, dirt and debris – causes localised resistance in some PV cells and leads to severe reduction in energy generation and possible electrical damage to the PV module.
Quantifying shading effectsShadingisanimportantconsideration,butisdifficulttopredictbecause the relative position of the sun to the PV panel varies throughout the day and the year.
Total Power Loss
For some PV modules, the above hard shading would reduce power output to zero. Typical causes would be dirt collecting on the (tilted) module and leaves or bird droppings shading several complete cells.
ENERGY BOOK PRESS.indb 176 02/09/2014 14:56:24
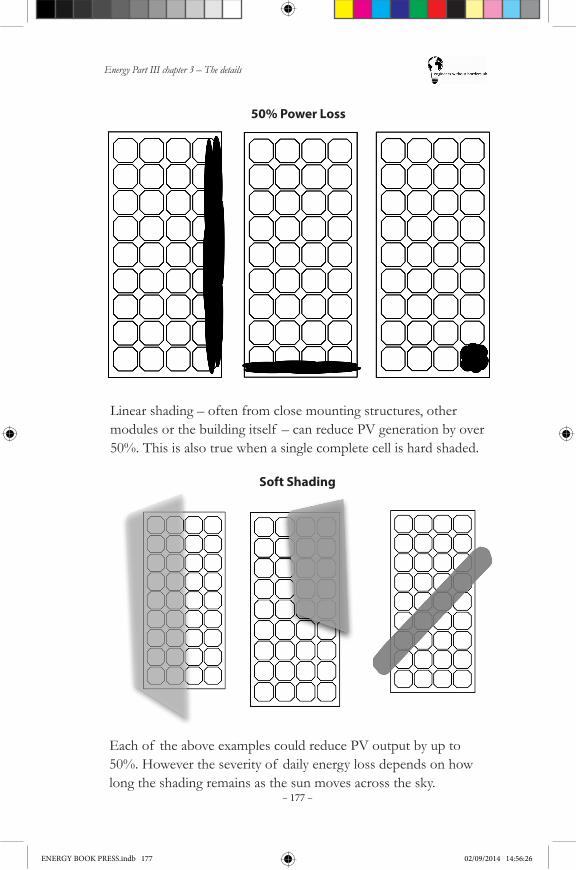
Energy Part III chapter 3 – The details
– 177 –
50% Power Loss
Linear shading – often from close mounting structures, other modules or the building itself – can reduce PV generation by over 50%. This is also true when a single complete cell is hard shaded.
Soft Shading
Each of the above examples could reduce PV output by up to 50%. However the severity of daily energy loss depends on how long the shading remains as the sun moves across the sky.
ENERGY BOOK PRESS.indb 177 02/09/2014 14:56:26
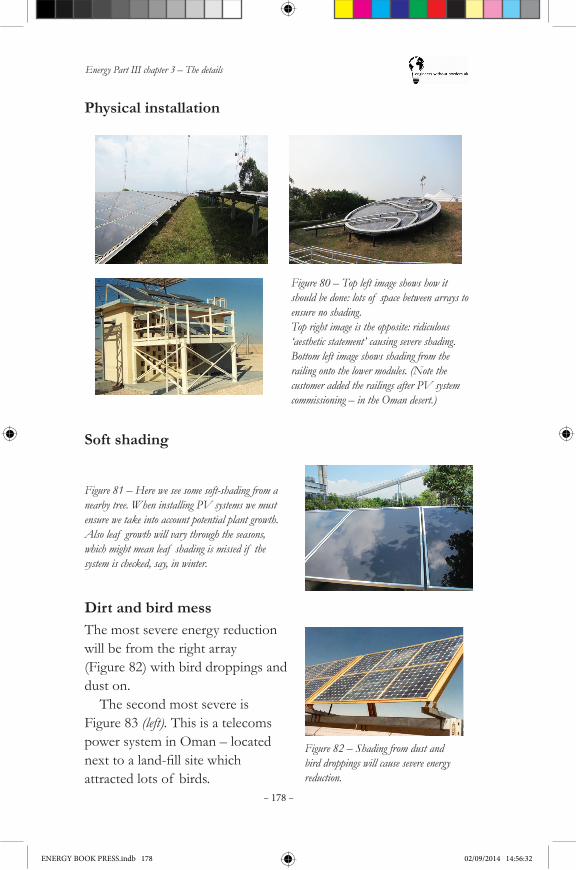
Energy Part III chapter 3 – The details
– 178 –
Physical installation
Figure 80 – Top left image shows how it should be done: lots of space between arrays to ensure no shading.Top right image is the opposite: ridiculous ‘aesthetic statement’ causing severe shading.Bottom left image shows shading from the railing onto the lower modules. (Note the customer added the railings after PV system commissioning – in the Oman desert.)
Soft shading
Figure 81 – Here we see some soft-shading from a nearby tree. When installing PV systems we must ensure we take into account potential plant growth. Also leaf growth will vary through the seasons, which might mean leaf shading is missed if the system is checked, say, in winter.
Dirt and bird messThe most severe energy reduction will be from the right array (Figure 82) with bird droppings and dust on.
The second most severe is Figure 83 (left). This is a telecoms power system in Oman – located nexttoaland-fillsitewhichattracted lots of birds.
Figure 82 – Shading from dust and bird droppings will cause severe energy reduction.
ENERGY BOOK PRESS.indb 178 02/09/2014 14:56:32
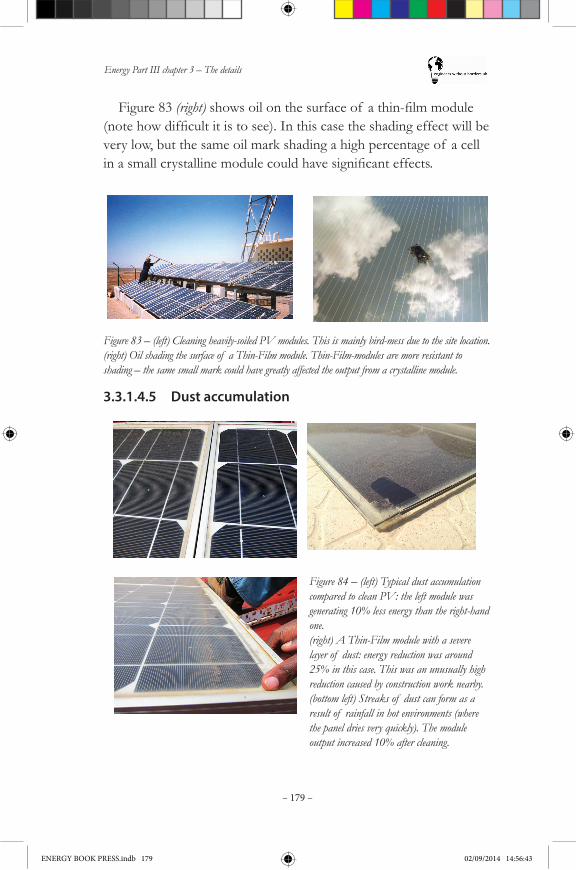
Energy Part III chapter 3 – The details
– 179 –
Figure 83 (right)showsoilonthesurfaceof athin-filmmodule(notehowdifficultitistosee).Inthiscasetheshadingeffectwillbevery low, but the same oil mark shading a high percentage of a cell inasmallcrystallinemodulecouldhavesignificanteffects.
Figure 83 – (left) Cleaning heavily-soiled PV modules. This is mainly bird-mess due to the site location. (right) Oil shading the surface of a Thin-Film module. Thin-Film-modules are more resistant to shading – the same small mark could have greatly affected the output from a crystalline module.
3.3.1.4.5 Dust accumulation
Figure 84 – (left) Typical dust accumulation compared to clean PV: the left module was generating 10% less energy than the right-hand one.(right) A Thin-Film module with a severe layer of dust: energy reduction was around 25% in this case. This was an unusually high reduction caused by construction work nearby.(bottom left) Streaks of dust can form as a result of rainfall in hot environments (where the panel dries very quickly). The module output increased 10% after cleaning.
ENERGY BOOK PRESS.indb 179 02/09/2014 14:56:43
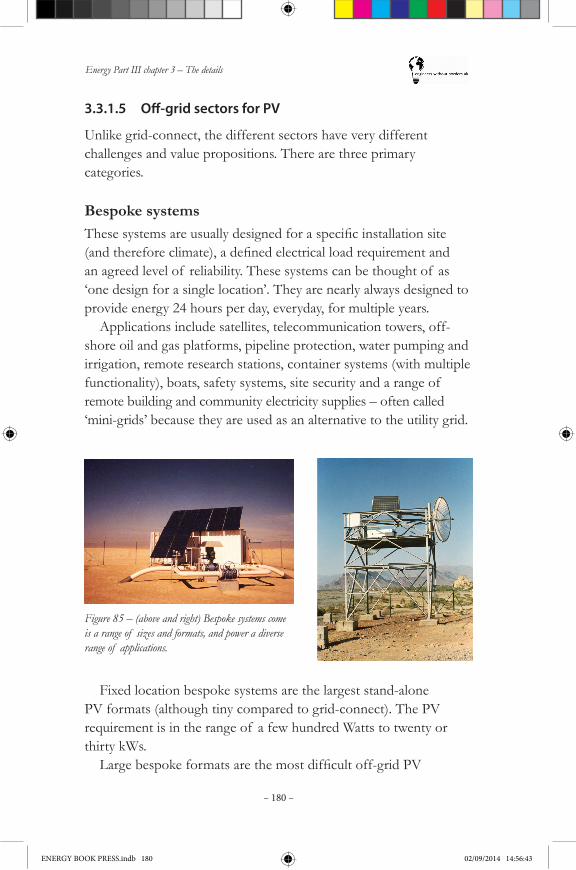
Energy Part III chapter 3 – The details
– 180 –
3.3.1.5 Off-grid sectors for PV
Unlike grid-connect, the different sectors have very different challenges and value propositions. There are three primary categories.
Bespoke systemsThesesystemsareusuallydesignedforaspecificinstallationsite(andthereforeclimate),adefinedelectricalloadrequirementandan agreed level of reliability. These systems can be thought of as ‘one design for a single location’. They are nearly always designed to provide energy 24 hours per day, everyday, for multiple years.
Applications include satellites, telecommunication towers, off-shore oil and gas platforms, pipeline protection, water pumping and irrigation, remote research stations, container systems (with multiple functionality), boats, safety systems, site security and a range of remote building and community electricity supplies – often called ‘mini-grids’ because they are used as an alternative to the utility grid.
Figure 85 – (above and right) Bespoke systems come is a range of sizes and formats, and power a diverse range of applications.
Fixed location bespoke systems are the largest stand-alone PV formats (although tiny compared to grid-connect). The PV requirement is in the range of a few hundred Watts to twenty or thirty kWs.Largebespokeformatsarethemostdifficultoff-gridPV
ENERGY BOOK PRESS.indb 180 02/09/2014 14:56:43
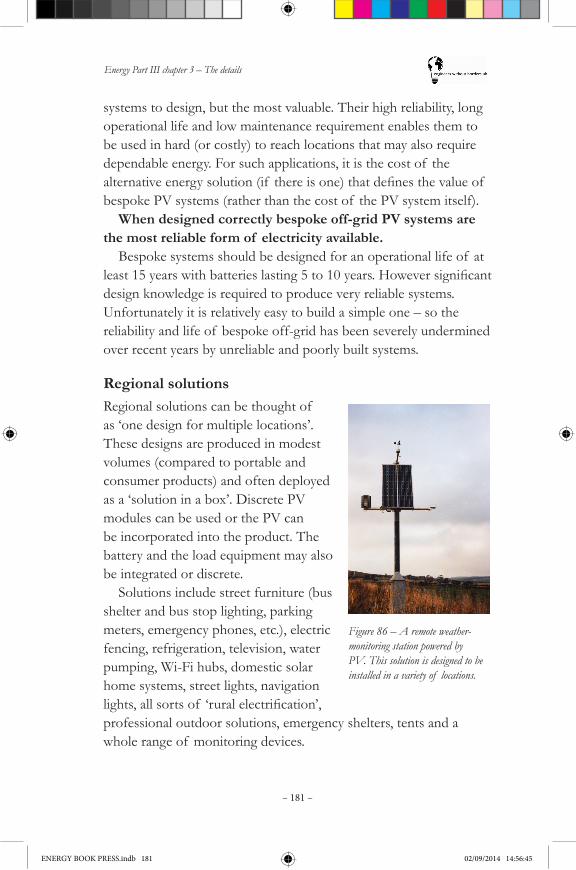
Energy Part III chapter 3 – The details
– 181 –
systems to design, but the most valuable. Their high reliability, long operational life and low maintenance requirement enables them to be used in hard (or costly) to reach locations that may also require dependable energy. For such applications, it is the cost of the alternativeenergysolution(if thereisone)thatdefinesthevalueof bespoke PV systems (rather than the cost of the PV system itself).
When designed correctly bespoke off-grid PV systems are the most reliable form of electricity available.
Bespoke systems should be designed for an operational life of at least15yearswithbatterieslasting5to10years.Howeversignificantdesign knowledge is required to produce very reliable systems. Unfortunately it is relatively easy to build a simple one – so the reliability and life of bespoke off-grid has been severely undermined over recent years by unreliable and poorly built systems.
Regional solutionsRegional solutions can be thought of as ‘one design for multiple locations’. These designs are produced in modest volumes (compared to portable and consumer products) and often deployed as a ‘solution in a box’. Discrete PV modules can be used or the PV can be incorporated into the product. The battery and the load equipment may also be integrated or discrete.
Solutions include street furniture (bus shelter and bus stop lighting, parking meters, emergency phones, etc.), electric fencing, refrigeration, television, water pumping, Wi-Fi hubs, domestic solar home systems, street lights, navigation lights,allsortsof ‘ruralelectrification’,professional outdoor solutions, emergency shelters, tents and a whole range of monitoring devices.
Figure 86 – A remote weather-monitoring station powered by PV. This solution is designed to be installed in a variety of locations.
ENERGY BOOK PRESS.indb 181 02/09/2014 14:56:45
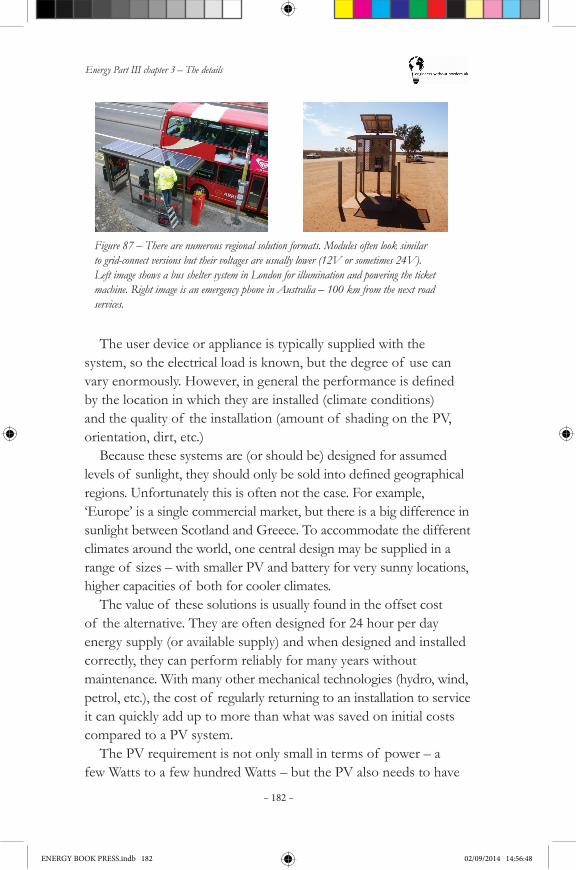
Energy Part III chapter 3 – The details
– 182 –
Figure 87 – There are numerous regional solution formats. Modules often look similar to grid-connect versions but their voltages are usually lower (12V or sometimes 24V). Left image shows a bus shelter system in London for illumination and powering the ticket machine. Right image is an emergency phone in Australia – 100 km from the next road services.
The user device or appliance is typically supplied with the system, so the electrical load is known, but the degree of use can varyenormously.However,ingeneraltheperformanceisdefinedby the location in which they are installed (climate conditions) and the quality of the installation (amount of shading on the PV, orientation, dirt, etc.)
Because these systems are (or should be) designed for assumed levelsof sunlight,theyshouldonlybesoldintodefinedgeographicalregions. Unfortunately this is often not the case. For example, ‘Europe’ is a single commercial market, but there is a big difference in sunlight between Scotland and Greece. To accommodate the different climates around the world, one central design may be supplied in a range of sizes – with smaller PV and battery for very sunny locations, higher capacities of both for cooler climates.
The value of these solutions is usually found in the offset cost of the alternative. They are often designed for 24 hour per day energy supply (or available supply) and when designed and installed correctly, they can perform reliably for many years without maintenance. With many other mechanical technologies (hydro, wind, petrol, etc.), the cost of regularly returning to an installation to service it can quickly add up to more than what was saved on initial costs compared to a PV system.
The PV requirement is not only small in terms of power – a few Watts to a few hundred Watts – but the PV also needs to have
ENERGY BOOK PRESS.indb 182 02/09/2014 14:56:48
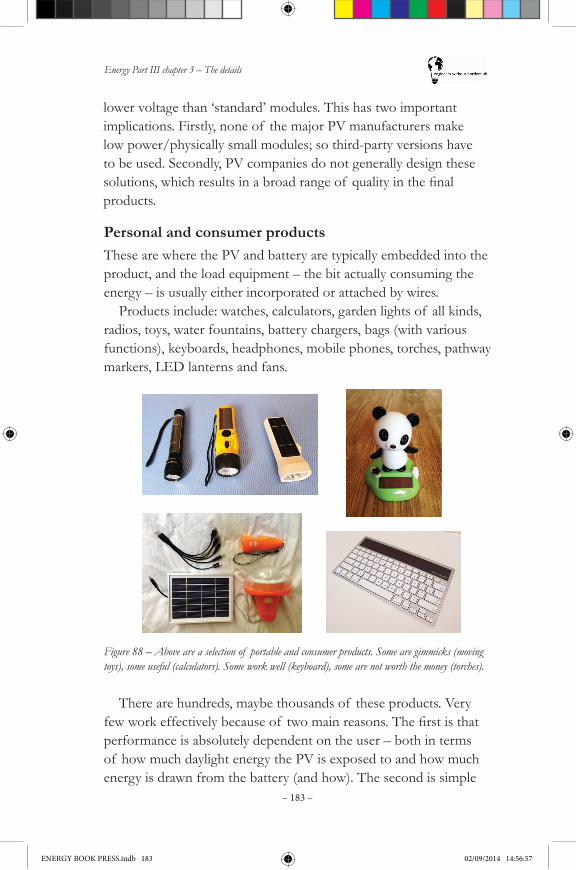
Energy Part III chapter 3 – The details
– 183 –
lower voltage than ‘standard’ modules. This has two important implications. Firstly, none of the major PV manufacturers make low power/physically small modules; so third-party versions have to be used. Secondly, PV companies do not generally design these solutions,whichresultsinabroadrangeof qualityinthefinalproducts.
Personal and consumer productsThese are where the PV and battery are typically embedded into the product, and the load equipment – the bit actually consuming the energy – is usually either incorporated or attached by wires.
Products include: watches, calculators, garden lights of all kinds, radios, toys, water fountains, battery chargers, bags (with various functions), keyboards, headphones, mobile phones, torches, pathway markers, LED lanterns and fans.
Figure 88 – Above are a selection of portable and consumer products. Some are gimmicks (moving toys), some useful (calculators). Some work well (keyboard), some are not worth the money (torches).
There are hundreds, maybe thousands of these products. Very fewworkeffectivelybecauseof twomainreasons.Thefirstisthatperformance is absolutely dependent on the user – both in terms of how much daylight energy the PV is exposed to and how much energy is drawn from the battery (and how). The second is simple
ENERGY BOOK PRESS.indb 183 02/09/2014 14:56:57
Energy Part III chapter 3 – The details
– 184 –
economics:thecostof theproductisheavilyinfluencedbyhowmuch PV is used. So less PV means a cheaper product but of course less energy generation and therefore lower performance. The PV content is only a few mWs to tens of Watts – and is often in the form of off-cut cells, often scrap, from larger manufacturers.
These products cannot have predictable performance in real life conditions; they can only be supplied with guidelines of potential performance.
Portable and consumer products are sold throughout the world, even though they are often only designed to work effectively in good, sunny locations. Despite this, they are regularly promoted in terms of their best possible performance, rather than setting expectations appropriately. A further casualty of consumer market is pressure to produce the product for as little as possible.
Summary of off-grid system typesAs described above, off-grid systems nearly always fall into one of three categories:
1. BespokeSystems–fixedlocationswithknownloads.
•The system is designed for the location, orientation and a specific(maximum)load. Examples: schools, hospitals, large homes, telecoms, mini-grids.
2. Distributedsolutions–multiplefixedlocations.
•Varying charge current levels, where load is known.
•A single design will be used in multiple locations, where system operationcanvarysignificantly. Examples: Street lighting, small homes, Wi-Fi hubs, TV and media, static monitoring.
•Personal and consumer goods – small and portable.
•Little idea of sunlight levels, maybe even an unknown load. Examples: Personal lights, calculators, watches, consumer battery chargers, mobile phone chargers, chargers for automotive use, outdoors/back-packers/hiking/expeditions, reactive monitoring.
ENERGY BOOK PRESS.indb 184 02/09/2014 14:56:58

Energy Part III chapter 3 – The details
– 185 –
3.3.1.6 Example off-grid solutions
As mentioned earlier, there are hundreds of applications and thousands of solution sizes. Below are some of the more widely usedapplicationsforsolar,alongwithpertinentinformation.Thefirsttwo – small scale lighting and Solar Home Systems – are products that can be bought through retail channels. They require careful selection against the requirements of the project and its people, but system design is not required. All other applications require project management that will include PV system sizing, design and implementation.
Personal and small scale lighting (solar lanterns)This category refers to torches, small personal reading lights, lights for craft work and for illuminating small rooms or areas. Traditionally the most common solar lights were called solar lanterns in an attempt to more easily make the connection to the Kerosene lamps they seek to replace. The lantern reference is less common now, partly due to the huge demand for mobile phone charging – which most are now capable of.
Since around 2008 the uptake of small solar lighting products has massively increased. The need to charge mobile phones, the significantimprovementinLEDandbatterytechnologyandaneedwithinthePVindustrytofindnewmarketshaveallbeencontributingfactors. There are now hundreds of small solar powered LED lighting devices including torches, lanterns for direct replacement of Kerosene lamps,roomlights,fishinglanterns,remotecontrolhomesystemsand many more. The market has grown so much that it has taken on a new name: ‘pico solar’.
Whilst the growth in the small solar light sector is welcome, it has resulted in some very low quality products. Great care should therefore be taken if solar lights are to be purchased or recommended.
The following are basic requirements for any product.•Lightintensitysufficientforreadingatypicalbookwiththelight
1 m from the paper.
ENERGY BOOK PRESS.indb 185 02/09/2014 14:56:58

Energy Part III chapter 3 – The details
– 186 –
•Light coverage of 1 m diameter from 1 m away.
•Duration of at least 6 hours (when fully charged).
•Brighter light option (with reduced operational time).
•Design life of 5 years.
•Warranty of 2 years (with clear evidence of how a customer can utilise it).
•Mobile phone and USB device charging capability.
•Clear user instructions and supplier support (even the best product will not work if the user does not understand how to operate it).
CostA small solar torch or ‘reading’ light can be purchased for just a few US dollars, however they are not worth the money. They provide insufficientlight,breakeasilyanddonotoperateformorethanafew weeks; if that. But there are a lot of low quality and low cost products around.Aproductfitforpurposewillalmostcertainlynotbethe
cheapest, but it may even seem expensive if only compared to the competition. A product that meets the above requirements will likely be over $15 dollars and could be over $30 – depending on the supply chain and location.
It is tempting to select the cheapest ‘acceptable’ solar lamp when supplying them for free – to the poorest of the poor for example. This is false economics. The poorest are the ones that need dependable performance from a product the most. Sometimes valuable features such as rugged construction, waterproof construction,remotecontrolandothersprovidesignificantvaluefor just a few dollars above the base-level product.
A thorough comparison of product features – value – should always be made before looking at the purchase cost.
ENERGY BOOK PRESS.indb 186 02/09/2014 14:56:58
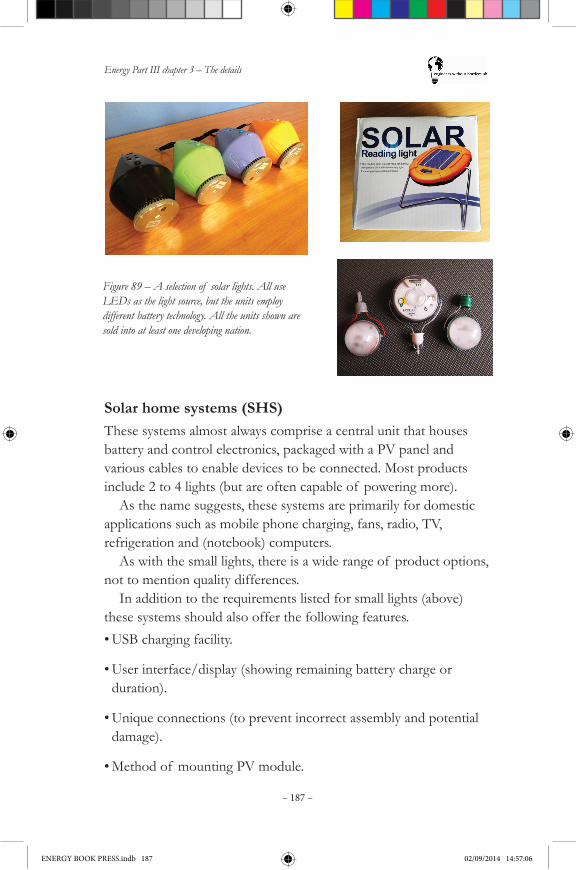
Energy Part III chapter 3 – The details
– 187 –
Figure 89 – A selection of solar lights. All use LEDs as the light source, but the units employ different battery technology. All the units shown are sold into at least one developing nation.
Solar home systems (SHS)These systems almost always comprise a central unit that houses battery and control electronics, packaged with a PV panel and various cables to enable devices to be connected. Most products include 2 to 4 lights (but are often capable of powering more).
As the name suggests, these systems are primarily for domestic applications such as mobile phone charging, fans, radio, TV, refrigeration and (notebook) computers.
As with the small lights, there is a wide range of product options, not to mention quality differences.
In addition to the requirements listed for small lights (above) these systems should also offer the following features.•USB charging facility.
•User interface/display (showing remaining battery charge or duration).
•Unique connections (to prevent incorrect assembly and potential damage).
•Method of mounting PV module.
ENERGY BOOK PRESS.indb 187 02/09/2014 14:57:06
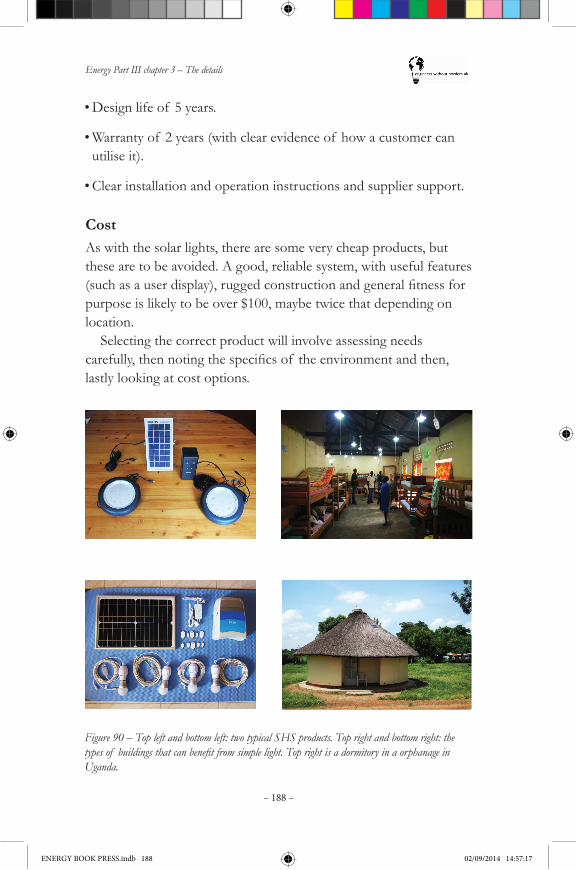
Energy Part III chapter 3 – The details
– 188 –
•Design life of 5 years.
•Warranty of 2 years (with clear evidence of how a customer can utilise it).
•Clear installation and operation instructions and supplier support.
CostAs with the solar lights, there are some very cheap products, but these are to be avoided. A good, reliable system, with useful features (suchasauserdisplay),ruggedconstructionandgeneralfitnessforpurpose is likely to be over $100, maybe twice that depending on location.
Selecting the correct product will involve assessing needs carefully,thennotingthespecificsof theenvironmentandthen,lastly looking at cost options.
Figure 90 – Top left and bottom left: two typical SHS products. Top right and bottom right: the types of buildings that can benefit from simple light. Top right is a dormitory in a orphanage in Uganda.
ENERGY BOOK PRESS.indb 188 02/09/2014 14:57:17
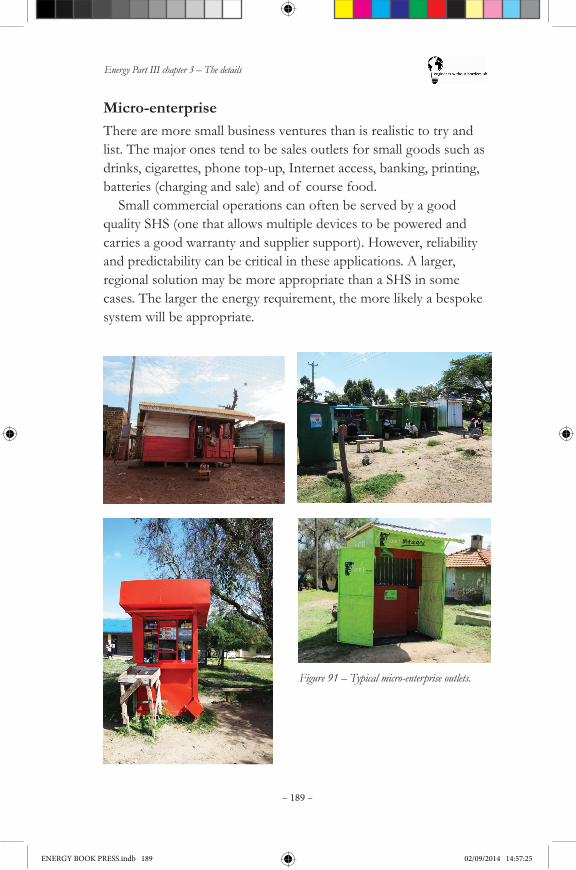
Energy Part III chapter 3 – The details
– 189 –
Micro-enterpriseThere are more small business ventures than is realistic to try and list. The major ones tend to be sales outlets for small goods such as drinks, cigarettes, phone top-up, Internet access, banking, printing, batteries (charging and sale) and of course food.
Small commercial operations can often be served by a good quality SHS (one that allows multiple devices to be powered and carries a good warranty and supplier support). However, reliability and predictability can be critical in these applications. A larger, regional solution may be more appropriate than a SHS in some cases. The larger the energy requirement, the more likely a bespoke system will be appropriate.
Figure 91 – Typical micro-enterprise outlets.
ENERGY BOOK PRESS.indb 189 02/09/2014 14:57:25

Energy Part III chapter 3 – The details
– 190 –
Outdoor lightingThere is an important reality to outdoors lighting: the higher the light source is positioned, the more powerful it needs to be. This may sound obvious, but because traditional street lighting is over 7 metres high, many solar lights are designed as direct replacements. It is usually far more effective (better lighting and cheaper) to have a
Electric fencingHigh voltage but low current is supplied through an exposed wire that runs the perimeter of small compounds, large enclosures or boundaries. Fencing can be anything from a few meters to 20 or 30km.Thelargerthedistancetobeelectrified,themorelikelyitisto employ multiple smaller systems instead of a single large one.
Historically used almost exclusively for keeping wildlife in or out of a particular area, it is now also used for keeping animals and people away from buildings, nature reserves, beaches, cliffs, political designationsandevenminefields.
This is an ideal application for solar because it uses relatively small amounts of energy per unit area, needs to be very reliable and is typically located in a rural or hard to reach place.
Fencing kits can be purchased as complete solutions ‘in a box’ or orderedagainstspecificrequirements–whicharemorecommonfor the bigger systems.
Figure 92 – Electric fencing for controlling animals can run many tens of kilometres. Electric security and safety can also be used on buildings.
ENERGY BOOK PRESS.indb 190 02/09/2014 14:57:32
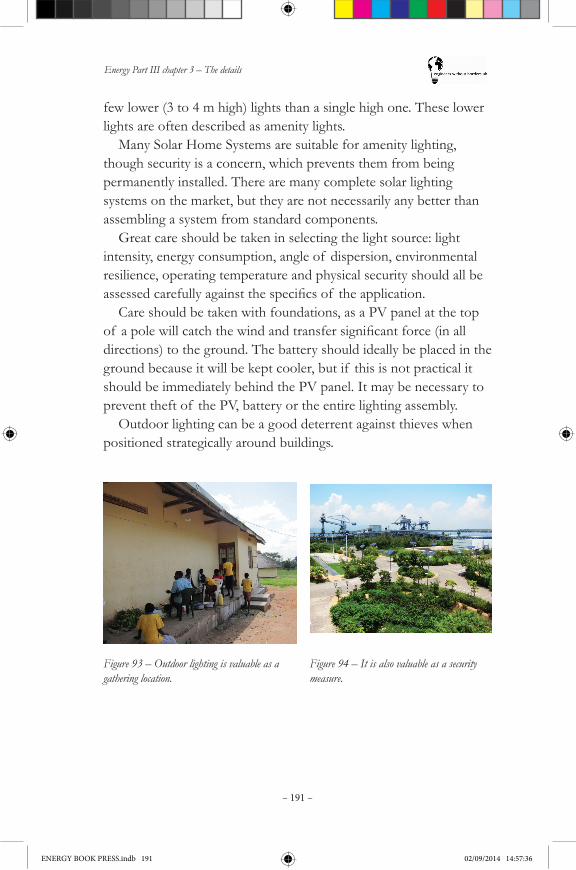
Energy Part III chapter 3 – The details
– 191 –
Figure 93 – Outdoor lighting is valuable as a gathering location.
Figure 94 – It is also valuable as a security measure.
few lower (3 to 4 m high) lights than a single high one. These lower lights are often described as amenity lights.
Many Solar Home Systems are suitable for amenity lighting, though security is a concern, which prevents them from being permanently installed. There are many complete solar lighting systems on the market, but they are not necessarily any better than assembling a system from standard components.
Great care should be taken in selecting the light source: light intensity, energy consumption, angle of dispersion, environmental resilience, operating temperature and physical security should all be assessedcarefullyagainstthespecificsof theapplication.
Care should be taken with foundations, as a PV panel at the top of apolewillcatchthewindandtransfersignificantforce(inalldirections) to the ground. The battery should ideally be placed in the ground because it will be kept cooler, but if this is not practical it should be immediately behind the PV panel. It may be necessary to prevent theft of the PV, battery or the entire lighting assembly.
Outdoor lighting can be a good deterrent against thieves when positioned strategically around buildings.
ENERGY BOOK PRESS.indb 191 02/09/2014 14:57:36
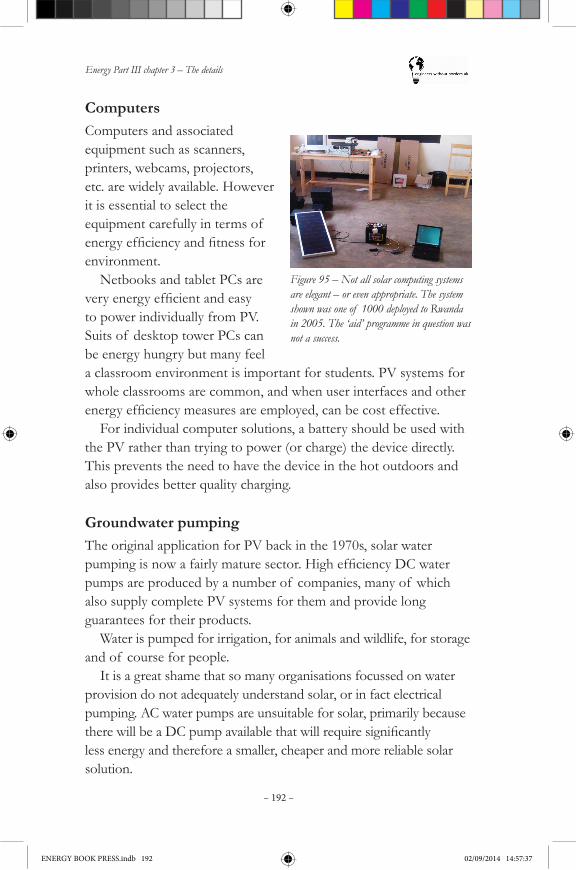
Energy Part III chapter 3 – The details
– 192 –
ComputersComputers and associated equipment such as scanners, printers, webcams, projectors, etc. are widely available. However it is essential to select the equipment carefully in terms of energyefficiencyandfitnessforenvironment.
Netbooks and tablet PCs are veryenergyefficientandeasyto power individually from PV. Suits of desktop tower PCs can be energy hungry but many feel a classroom environment is important for students. PV systems for whole classrooms are common, and when user interfaces and other energyefficiencymeasuresareemployed,canbecosteffective.
For individual computer solutions, a battery should be used with the PV rather than trying to power (or charge) the device directly. This prevents the need to have the device in the hot outdoors and also provides better quality charging.
Groundwater pumpingThe original application for PV back in the 1970s, solar water pumpingisnowafairlymaturesector.HighefficiencyDCwaterpumps are produced by a number of companies, many of which also supply complete PV systems for them and provide long guarantees for their products.
Water is pumped for irrigation, for animals and wildlife, for storage and of course for people.
It is a great shame that so many organisations focussed on water provision do not adequately understand solar, or in fact electrical pumping. AC water pumps are unsuitable for solar, primarily because therewillbeaDCpumpavailablethatwillrequiresignificantlyless energy and therefore a smaller, cheaper and more reliable solar solution.
Figure 95 – Not all solar computing systems are elegant – or even appropriate. The system shown was one of 1000 deployed to Rwanda in 2005. The ‘aid’ programme in question was not a success.
ENERGY BOOK PRESS.indb 192 02/09/2014 14:57:37

Energy Part III chapter 3 – The details
– 193 –
Figure 96 – Two water containers on a tower in Rwanda (left) were found to be open – without their access caps fitted (centre top). The water inside (used for drinking) was green with various insects swimming in it (centre bottom). Right: water tanks can be extremely heavy. This tower is bending under the weight of 1000 litres. Note the use of the PV to shade the water tank.
Toilets and SanitationSolar is used for lighting, pest control, ventilation and security. It is important to carefully locate the PV control equipment and batterysystem:thespecificcaveatfor these systems is to locate them where they will remain ‘clean’.
Water pumping is one of the few PV applications that do not always require a battery. The water needs of the particular location can be met by pumping groundwater up into a storage vessel only during sunlight hours.
It would be remiss not to make reference to water quality. Water should not be moved through corrodible materials and must only be stored in specially designed containers (that are properly sealed from the environment) otherwise bringing water to a community becomes a damaging act.
Figure 97 – A remote toilet in Australia with ventilation and light enabled by solar.
ENERGY BOOK PRESS.indb 193 02/09/2014 14:57:49
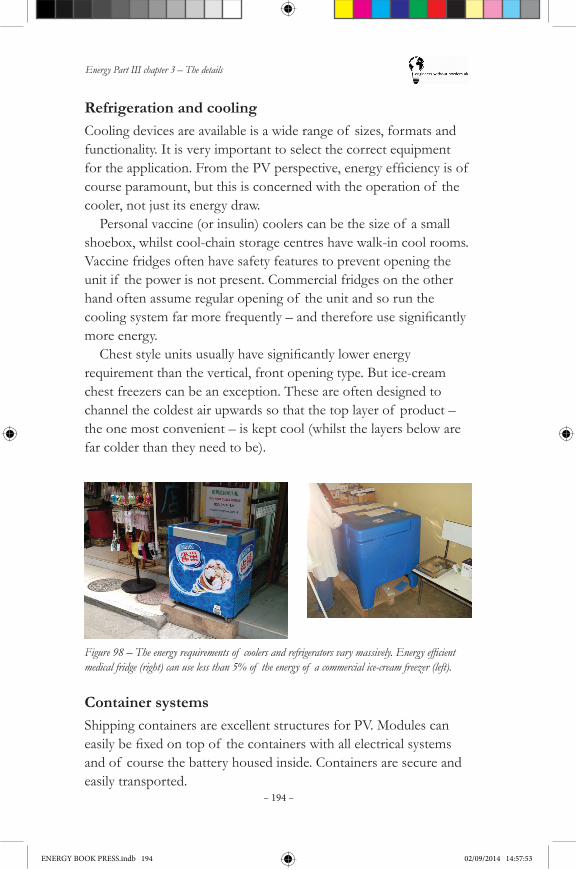
Energy Part III chapter 3 – The details
– 194 –
Refrigeration and coolingCooling devices are available is a wide range of sizes, formats and functionality. It is very important to select the correct equipment fortheapplication.FromthePVperspective,energyefficiencyisof course paramount, but this is concerned with the operation of the cooler, not just its energy draw.
Personal vaccine (or insulin) coolers can be the size of a small shoebox, whilst cool-chain storage centres have walk-in cool rooms. Vaccine fridges often have safety features to prevent opening the unit if the power is not present. Commercial fridges on the other hand often assume regular opening of the unit and so run the coolingsystemfarmorefrequently–andthereforeusesignificantlymore energy.Cheststyleunitsusuallyhavesignificantlylowerenergy
requirement than the vertical, front opening type. But ice-cream chest freezers can be an exception. These are often designed to channel the coldest air upwards so that the top layer of product – the one most convenient – is kept cool (whilst the layers below are far colder than they need to be).
Figure 98 – The energy requirements of coolers and refrigerators vary massively. Energy efficient medical fridge (right) can use less than 5% of the energy of a commercial ice-cream freezer (left).
Container systemsShipping containers are excellent structures for PV. Modules can easilybefixedontopof thecontainerswithallelectricalsystemsand of course the battery housed inside. Containers are secure and easily transported.
ENERGY BOOK PRESS.indb 194 02/09/2014 14:57:53
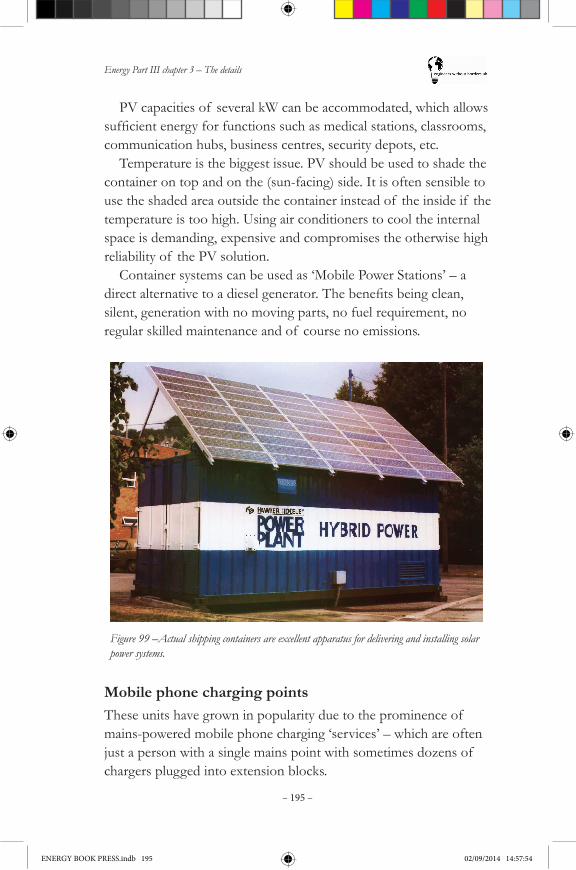
Energy Part III chapter 3 – The details
– 195 –
PV capacities of several kW can be accommodated, which allows sufficientenergyforfunctionssuchasmedicalstations,classrooms,communication hubs, business centres, security depots, etc.
Temperature is the biggest issue. PV should be used to shade the container on top and on the (sun-facing) side. It is often sensible to use the shaded area outside the container instead of the inside if the temperature is too high. Using air conditioners to cool the internal space is demanding, expensive and compromises the otherwise high reliability of the PV solution.
Container systems can be used as ‘Mobile Power Stations’ – a directalternativetoadieselgenerator.Thebenefitsbeingclean,silent, generation with no moving parts, no fuel requirement, no regular skilled maintenance and of course no emissions.
Figure 99 –Actual shipping containers are excellent apparatus for delivering and installing solar power systems.
Mobile phone charging pointsThese units have grown in popularity due to the prominence of mains-powered mobile phone charging ‘services’ – which are often just a person with a single mains point with sometimes dozens of chargers plugged into extension blocks.
ENERGY BOOK PRESS.indb 195 02/09/2014 14:57:54
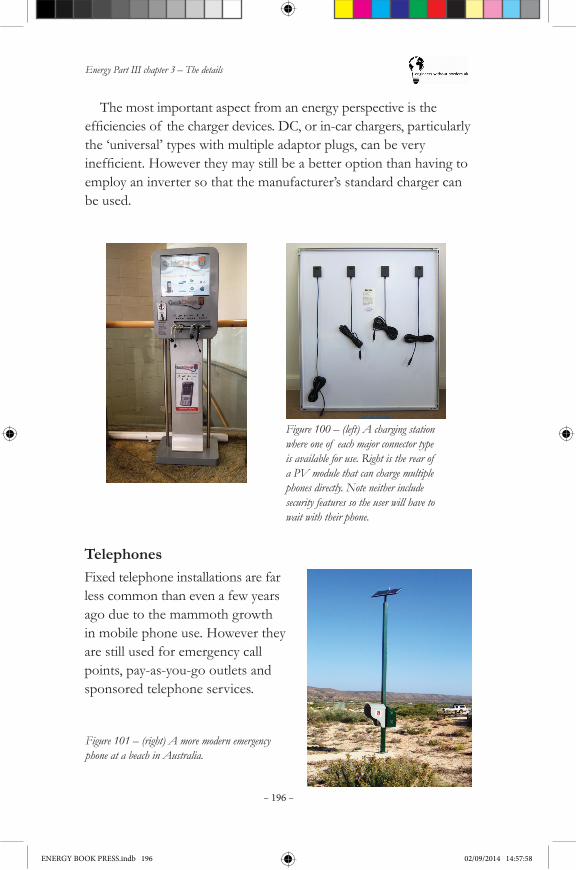
Energy Part III chapter 3 – The details
– 196 –
TelephonesFixed telephone installations are far less common than even a few years ago due to the mammoth growth in mobile phone use. However they are still used for emergency call points, pay-as-you-go outlets and sponsored telephone services.
Figure 101 – (right) A more modern emergency phone at a beach in Australia.
The most important aspect from an energy perspective is the efficienciesof thechargerdevices.DC,orin-carchargers,particularlythe ‘universal’ types with multiple adaptor plugs, can be very inefficient.Howevertheymaystillbeabetteroptionthanhavingtoemploy an inverter so that the manufacturer’s standard charger can be used.
Figure 100 – (left) A charging station where one of each major connector type is available for use. Right is the rear of a PV module that can charge multiple phones directly. Note neither include security features so the user will have to wait with their phone.
ENERGY BOOK PRESS.indb 196 02/09/2014 14:57:58

Energy Part III chapter 3 – The details
– 197 –
3.3.1.7 More information
Although this section has given more detailed information on solar PV, the reader should refer to the additional information contained in chapter 4, Further reading, and consult both an expert and a local champion before implementing any potential solutions.
Communications infrastructureThefirstcommercial(terrestrial)applicationof solarwasinhigh-reliability communication networks or ‘backbones’. Solar is still the most reliable form of remote power for telecoms repeaters/transmitters, but it is more common to utilise smaller, networked systems today.
Applications include Wi-Fi (private, community, regional or national) networks, mobile cell towers, radio and TV boosters and networks for pipelines, road and rail communications.
Of critical importance is the estimated energy requirement used for the PV system design – because this is based on expected utilisation.
Figure 102 – One of the first commercial (terrestrial) applications of solar was to enable communications infrastructure in Oman. Note the electricity pylon in the distance. It is usually cheaper to use solar than connect to high voltage utility lines (and often more reliable).
ENERGY BOOK PRESS.indb 197 02/09/2014 14:57:59
Energy Part III chapter 3 – The details
– 198 –
3.3.2 Small Wind Turbines (SWTs) – the details3.3.2.1 Key terminology
The following key terms are often used when describing wind turbine performance:
Power curve: A graph of power vs. wind speed that indicates how much power the wind turbine will produce over a range of wind conditions (e.g. Figure 103). A standard curve produced tointernationalspecificationsshouldbeavailableformostcommercial machines, however, the actual power curve of any particular machine after installation on a real site is likely to be different.
Rated power: The power produced by the wind turbine at its rated wind speed.TheSmallWindCertificationCouncil(SWCC)suggest 11 m/s as a standard speed to rate turbines at, howeveritisoftendefinedbythemanufacturerinmarketingliterature as simply the highest point on the power curve. On the power curve shown in Figure 103, the Piggott 3N, which is rated at 800 W never actually achieves this power output, as the over-speed protection system has been set conservatively to limit power output in high winds and therefore increase reliability. In contrast, the commercial Bergey XL.1 actually exceeds its rated power of 1 kW1.
Cut in speed: The point on the power curve where the wind turbine begins to produce power. Figure 103 shows that the Piggott 3N cuts in at 2 m/s, whilst the Bergey XL.1 cuts in at 3 m/s.
AEY or AEO or AEP (Annual Energy Yield /Output/Production):
Estimation of the total energy produced during one year by a particular turbine on a site with a given mean wind speed. Requires a power curve and wind speed frequency distribution (e.g. Figure 63).
RAEY or RAEO or RAEP (Rated Annual Energy Yield/Output/Production):
Estimated annual energy yield on a standard site (represented by a Rayleigh wind speed frequency distribution) with a 5 m/s annual mean wind speed, according to the SWCC standard. This is a much more reliable and comparable measure of performance than the rated power, however it relies upon the accuracy of each machine’s power curve.
1. Please note that instantaneous peak power is likely to be much higher than the highest point on the power curve, which is produced using data averaged over 1 or 10 minutes.
ENERGY BOOK PRESS.indb 198 02/09/2014 14:57:59
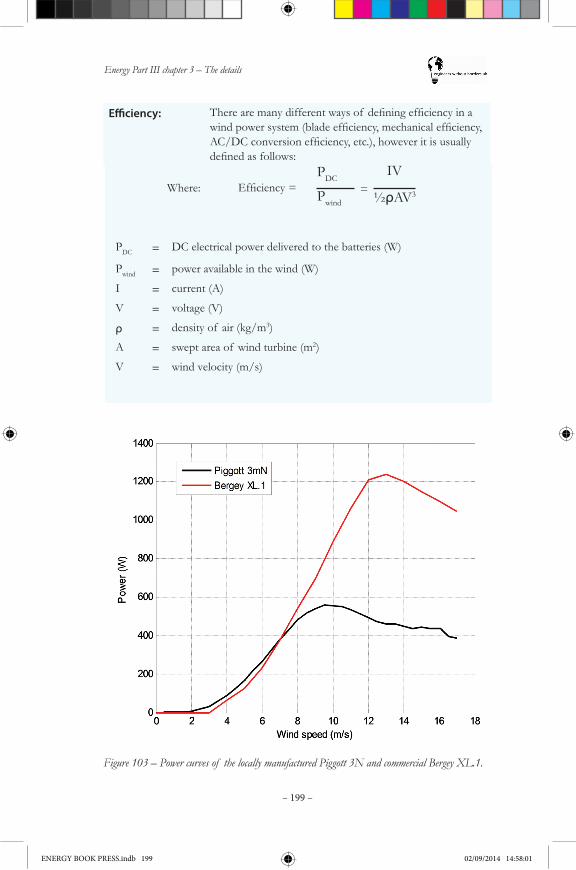
Energy Part III chapter 3 – The details
– 199 –
Figure 103 – Power curves of the locally manufactured Piggott 3N and commercial Bergey XL.1.
PDC = DC electrical power delivered to the batteries (W)
Pwind = power available in the wind (W)
I = current (A)
V = voltage (V)
ρ = density of air (kg/m3)
A = swept area of wind turbine (m2)
V = wind velocity (m/s)
Where: Efficiency = Pwind
PDC
½ρAV3
IV=
Efficiency: Therearemanydifferentwaysof definingefficiencyinawindpowersystem(bladeefficiency,mechanicalefficiency,AC/DCconversionefficiency,etc.),howeveritisusuallydefinedasfollows:
ENERGY BOOK PRESS.indb 199 02/09/2014 14:58:01

Energy Part III chapter 3 – The details
– 200 –
For more on the theory of wind power, see:•Paul Gipe’s (1999 and 2014) text books, which can be found on his
free online resource, WindWorks.org.
•The Danish Wind Energy Association’s (2014) guide to wind power, Wind Know-How.
3.3.2.2 Local manufacture vs. importation
One of the biggest decisions to be made after choosing wind power is whether to import a wind turbine or whether to manufacture one locally. In the following section the terms ‘imported’ and ‘commercial’ SWT are used interchangeably to refer to a mass-produced machine from a high-tech factory that is sold on the free market. Whilst such manufacturing facilities have been successfully employed to manufacture SWTs in emerging economies such as India, China and Argentina, they are rarely available in less developed countries. As a result, there is normally a choice between importing such technology or starting to manufacture it locally.
Piggott’s (2013) A Wind Turbine Recipe Book gives a step by step guide for manufacturing a range of SWTs from 1.2–4.2 m rotor diameter using only basic tools and techniques and readily available materials. Blades are carved from wood, the main bearing is the wheel hub of a scrap car and much of the steelwork can be made using scrap pieces of metal. Piggott designed the machines to provide power for his home community of Scoraig in Scotland andoverthelast30years,hehascontinuallyrefinedthedesigntoimprove reliability, lower costs and create a machine that is well respected across the globe for its durability, simplicity and adaptability. As a result, the design is now used in development projects in over 20 countries around the world, such as the Clean Energy Initiative in Mozambique shown in Figure 104.
WindEmpowerment (www.WindEmpowerment.org) is an association of many of the organisations and individuals across the globe that are working with locally manufactured technology. It is an active community that can offer assistance for new projects and the free online library contains both technical (e.g. design guides for
ENERGY BOOK PRESS.indb 200 02/09/2014 14:58:01

Energy Part III chapter 3 – The details
– 201 –
fibreglassblademanufacture)andsocio-economicinformation(e.g.casestudiesof successfulfinancingmechanismsforSWTs).
Figure 104 – (above and below) Grinding a mounting frame, welding a tail and carving blades at the Clean Energy Initiative in Mozambique. Photos courtesy of The Clean Energy Initiative.
ENERGY BOOK PRESS.indb 201 02/09/2014 14:58:02
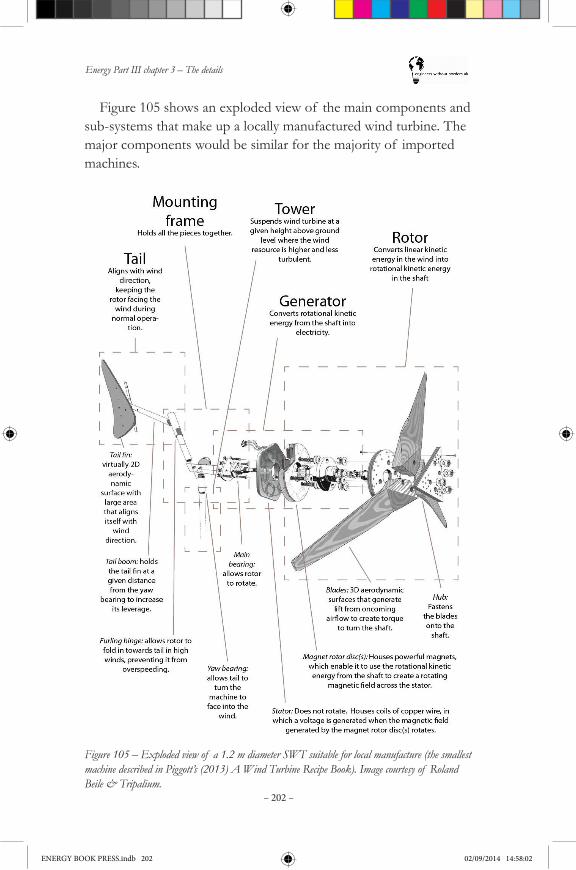
Energy Part III chapter 3 – The details
– 202 –
Figure 105 shows an exploded view of the main components and sub-systems that make up a locally manufactured wind turbine. The major components would be similar for the majority of imported machines.
Figure 105 – Exploded view of a 1.2 m diameter SWT suitable for local manufacture (the smallest machine described in Piggott’s (2013) A Wind Turbine Recipe Book). Image courtesy of Roland Beile & Tripalium.
ENERGY BOOK PRESS.indb 202 02/09/2014 14:58:02

Energy Part III chapter 3 – The details
– 203 –
When importing SWTs, you certainly get what you pay for, as very cheap machines will often have lifetimes in weeks rather than years (Sumanik-Leary, 2013). In contrast, the best quality imported SWTsarelikelytobemoreefficient,morereliableandhavealongerlifespan than locally manufactured SWTs. However, a failure will eventually occur and the following key issues will then arise: •Willtherebesufficientlocaltechnicalknowledgetoperformthe
repair?
•How long will it take/how much will it cost to send a spare part from overseas?
Imported technology will most likely be subject to import taxes 1 of 10–20% and shipping charges of a similar amount, pushing up an already high initial purchase cost even further. What is more, Figure 103 shows that commercial technology is often optimised for best performance at rated power (which is more marketable) rather than in low winds (which is more useful for battery charging systems, as calm periods can last up to a week and the batteries are oftenfilledquicklyduringperiodsof highwinds).
Figure 106 shows that whilst the commercial machine (Bergey XL.1) produces much more energy in the windiest month, November, it is actually the locally manufactured SWT (Piggott 3N) that produces more in the least windy month, September, i.e. when the power is needed most.
1. Although many less developed countries now offer tax exemptions for renewable energy products and components, they are often restricted to solar PV or certified products. However, regardless of the cost, clearing goods through customs often involves significant bureaucracy and requires a lot of patience.
ENERGY BOOK PRESS.indb 203 02/09/2014 14:58:02

Energy Part III chapter 3 – The details
– 204 –
Figure 106 – Monthly energy yields for a 628 W PV array, 800 W locally manufactured SWT (Piggott 3N) and comparable imported SWT (Bergey XL.1) on a site in Northwest Scotland. Solar and wind resources on this site are shown in Figure 26.
Sumanik-Leary, Piggott et al. (2013) modelled two hybrid PV-wind household energy systems: one using a locally manufactured SWT (Piggott 3N) and the other using an imported SWT (Bergey XL.1). Table 14 shows the key variables in this analysis, which found thatwhilsttheabilityof thetwosystemstofillthebatteriesandmeet demand was similar, the Piggott 3N was able to offer a lower costsolutionthantheBergeyXL.1.Providingthatsufficientlocaltechnical knowledge and access to the relevant tools and spare parts are available, then locally manufactured technology has the potential to offer savings of over 20% during the lifespan of the system. What is more, Figure 107 shows that the majority of the costs of locally manufactured technology are distributed throughout the lifespan of the energy system, lowering the barrier of high upfront capital costs that often inhibits the uptake of renewable energy technologies.
ENERGY BOOK PRESS.indb 204 02/09/2014 14:58:03
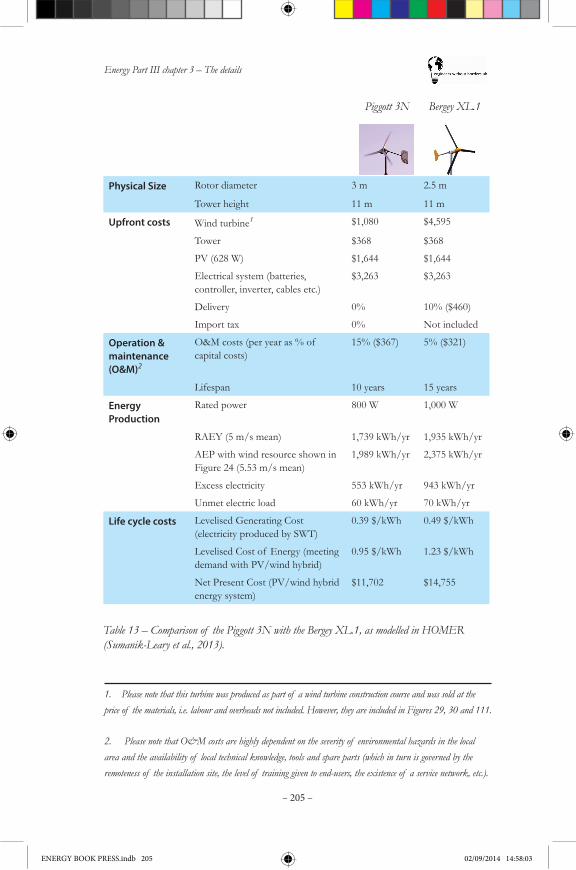
Energy Part III chapter 3 – The details
– 205 –
Physical Size Rotor diameter 3 m 2.5 m
Tower height 11 m 11 m
Upfront costs Wind turbine1 $1,080 $4,595
Tower $368 $368
PV (628 W) $1,644 $1,644
Electrical system (batteries, controller, inverter, cables etc.)
$3,263 $3,263
Delivery 0% 10% ($460)
Import tax 0% Not included
Operation & maintenance (O&M)2
O&M costs (per year as % of capital costs)
15% ($367) 5% ($321)
Lifespan 10 years 15 years
Energy Production
Rated power 800 W 1,000 W
RAEY (5 m/s mean) 1,739 kWh/yr 1,935 kWh/yr
AEP with wind resource shown in Figure 24 (5.53 m/s mean)
1,989 kWh/yr 2,375 kWh/yr
Excess electricity 553 kWh/yr 943 kWh/yr
Unmet electric load 60 kWh/yr 70 kWh/yr
Life cycle costs Levelised Generating Cost (electricity produced by SWT)
0.39 $/kWh 0.49 $/kWh
Levelised Cost of Energy (meeting demand with PV/wind hybrid)
0.95 $/kWh 1.23 $/kWh
Net Present Cost (PV/wind hybrid energy system)
$11,702 $14,755
1. Please note that this turbine was produced as part of a wind turbine construction course and was sold at the price of the materials, i.e. labour and overheads not included. However, they are included in Figures 29, 30 and 111.
2. Please note that O&M costs are highly dependent on the severity of environmental hazards in the local area and the availability of local technical knowledge, tools and spare parts (which in turn is governed by the remoteness of the installation site, the level of training given to end-users, the existence of a service network, etc.).
Table 13 – Comparison of the Piggott 3N with the Bergey XL.1, as modelled in HOMER (Sumanik-Leary et al., 2013).
Piggott 3N Bergey XL.1
ENERGY BOOK PRESS.indb 205 02/09/2014 14:58:03
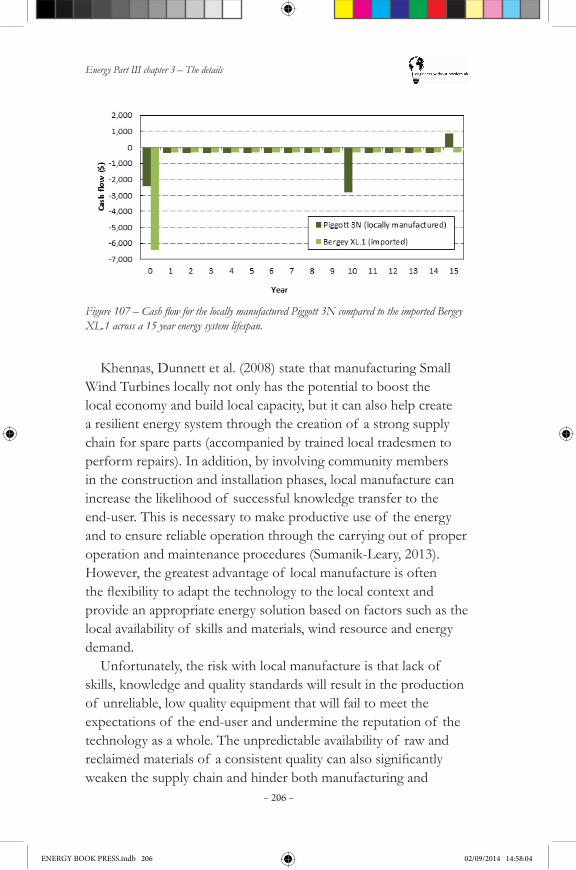
Energy Part III chapter 3 – The details
– 206 –
Figure 107 – Cash flow for the locally manufactured Piggott 3N compared to the imported Bergey XL.1 across a 15 year energy system lifespan.
Khennas, Dunnett et al. (2008) state that manufacturing Small Wind Turbines locally not only has the potential to boost the local economy and build local capacity, but it can also help create a resilient energy system through the creation of a strong supply chain for spare parts (accompanied by trained local tradesmen to perform repairs). In addition, by involving community members in the construction and installation phases, local manufacture can increase the likelihood of successful knowledge transfer to the end-user. This is necessary to make productive use of the energy and to ensure reliable operation through the carrying out of proper operation and maintenance procedures (Sumanik-Leary, 2013). However, the greatest advantage of local manufacture is often theflexibilitytoadaptthetechnologytothelocalcontextandprovide an appropriate energy solution based on factors such as the local availability of skills and materials, wind resource and energy demand.
Unfortunately, the risk with local manufacture is that lack of skills, knowledge and quality standards will result in the production of unreliable, low quality equipment that will fail to meet the expectations of the end-user and undermine the reputation of the technology as a whole. The unpredictable availability of raw and reclaimedmaterialsof aconsistentqualitycanalsosignificantlyweaken the supply chain and hinder both manufacturing and
ENERGY BOOK PRESS.indb 206 02/09/2014 14:58:04

Energy Part III chapter 3 – The details
– 207 –
maintenanceoperations.Thereisalsoasignificanthurdletoovercomeintermsof scale,asitisdifficulttoachievethenecessaryquality standards and offer the required maintenance services when producing just a few machines. Not only are poor quality or poorly maintained machines potentially dangerous, they can create a negative perception of the technology and inhibit future growth in the market, as occurred in both Nicaragua (Marandin et al., 2013) and Kenya (Vanheule, 2012).
Ultimately, the decision as to whether to manufacture SWTs locally or to import must be made independently for each local contextastherearemanyplace-specificfactorsthatinfluencethedecision, for example:•The availability of maintenance services for imported technology
in that particular country and more importantly, that particular region.
•The import taxes in that particular country.
•The shipping costs to get the equipment into that particular country and then into that particular region.
•The value placed on local job creation , as local manufacture shifts asignificantportionof thevaluechainintothecountryandcaneven shift it into rural areas.
•The wind regime in that particular region – locally manufactured technology can be better adapted to low wind regions (4–5 m/s annual mean wind speed).
•The planned scale of manufacture – at low volume, costs are highanditisdifficulttoensurethenecessaryqualitywithlocalmanufacture.
•The external environment – corrosive environments (heat, humidity, salinity etc.) push up the cost of locally manufactured technology (metal parts may need to be galvanized, stainless steel bolts used instead of cheaper mild steel etc.), whereas somecommercialturbinesaredesignedspecificallyformarineenvironments and have these features as standard. Lightning, sand/dust and other hazards can have similar effects.
ENERGY BOOK PRESS.indb 207 02/09/2014 14:58:04

Energy Part III chapter 3 – The details
– 208 –
•The capacity and willingness of communities to perform maintenance – locally manufactured machines require more preventative maintenance (greasing bearings, repainting blades etc.) and regularly sending engineers out to remote communities quickly becomes expensive.
3.3.2.3 Vertical axis (VAWTs), rooftop mounting and shrouded turbines
Fortunately the decision between HAWTs (horizontal axis wind turbines) and VAWTs (vertical axis wind turbines) is much clearer cut,withHAWTsmoreefficient,morereliable,cheaperandbetterunderstood than VAWTs.
Rooftop turbines are subject to high levels of turbulence and a diminished wind resource. They are more likely to annoy/endanger the occupants and cause structural damage (either through vibration orfallingparts)andarelesslikelytobemaintainedif itisdifficulttoaccess them.
Shrouded turbines add extra weight to a tower and ‘cheat’ the theoretical limit for power production by forcing air onto the blades,artificiallyraisingtheefficiency.Simplybuildingaturbinewith slightly larger blades is a safer, easier and more cost effective solution.
For more information, see Paul Gipe’s free online resource, Wind-Works.org.
3.3.2.4 Site selection and installation
InstallinganSWTisdifficultandpotentiallydangerousandshouldnot be undertaken without reading either Piggott’s (2013) Wind Turbine Recipe Book, Piggott’s (2000) Windpower Workshop, Little and Corbyn’s (2008) EWB/SIBAT Technical Guides and/or the installation instructions of the commercial machine you have purchased. The following section outlines the main steps in the site selection and installation of a Piggott turbine, but is likely to be very similar for commercial/imported machines:
ENERGY BOOK PRESS.indb 208 02/09/2014 14:58:04
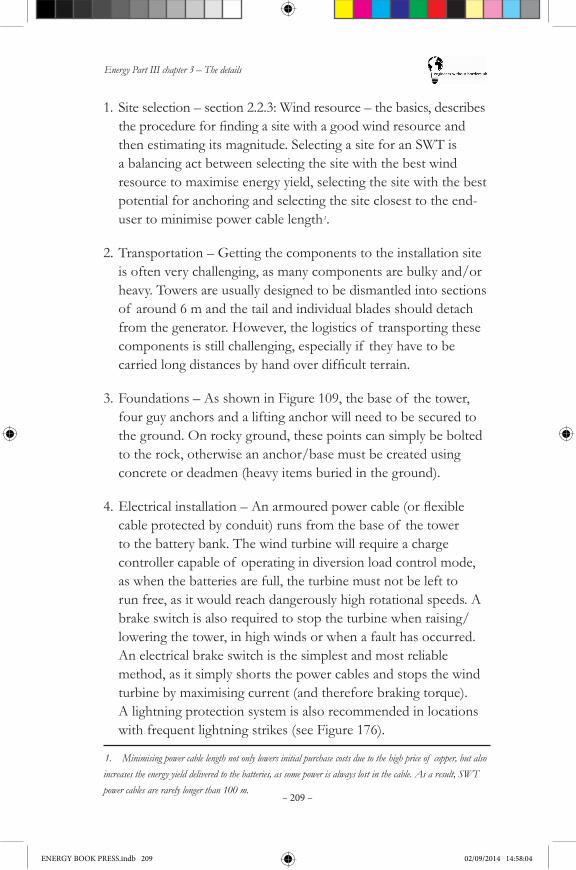
Energy Part III chapter 3 – The details
– 209 –
1. Site selection – section 2.2.3: Wind resource – the basics, describes theprocedureforfindingasitewithagoodwindresourceandthen estimating its magnitude. Selecting a site for an SWT is a balancing act between selecting the site with the best wind resource to maximise energy yield, selecting the site with the best potential for anchoring and selecting the site closest to the end-user to minimise power cable length 1.
2. Transportation – Getting the components to the installation site is often very challenging, as many components are bulky and/or heavy. Towers are usually designed to be dismantled into sections of around 6 m and the tail and individual blades should detach from the generator. However, the logistics of transporting these components is still challenging, especially if they have to be carriedlongdistancesbyhandoverdifficultterrain.
3. Foundations – As shown in Figure 109, the base of the tower, four guy anchors and a lifting anchor will need to be secured to the ground. On rocky ground, these points can simply be bolted to the rock, otherwise an anchor/base must be created using concrete or deadmen (heavy items buried in the ground).
4. Electricalinstallation–Anarmouredpowercable(orflexiblecable protected by conduit) runs from the base of the tower to the battery bank. The wind turbine will require a charge controller capable of operating in diversion load control mode, as when the batteries are full, the turbine must not be left to run free, as it would reach dangerously high rotational speeds. A brake switch is also required to stop the turbine when raising/lowering the tower, in high winds or when a fault has occurred. An electrical brake switch is the simplest and most reliable method, as it simply shorts the power cables and stops the wind turbine by maximising current (and therefore braking torque). A lightning protection system is also recommended in locations with frequent lightning strikes (see Figure 176).
1. Minimising power cable length not only lowers initial purchase costs due to the high price of copper, but also increases the energy yield delivered to the batteries, as some power is always lost in the cable. As a result, SWT power cables are rarely longer than 100 m.
ENERGY BOOK PRESS.indb 209 02/09/2014 14:58:04
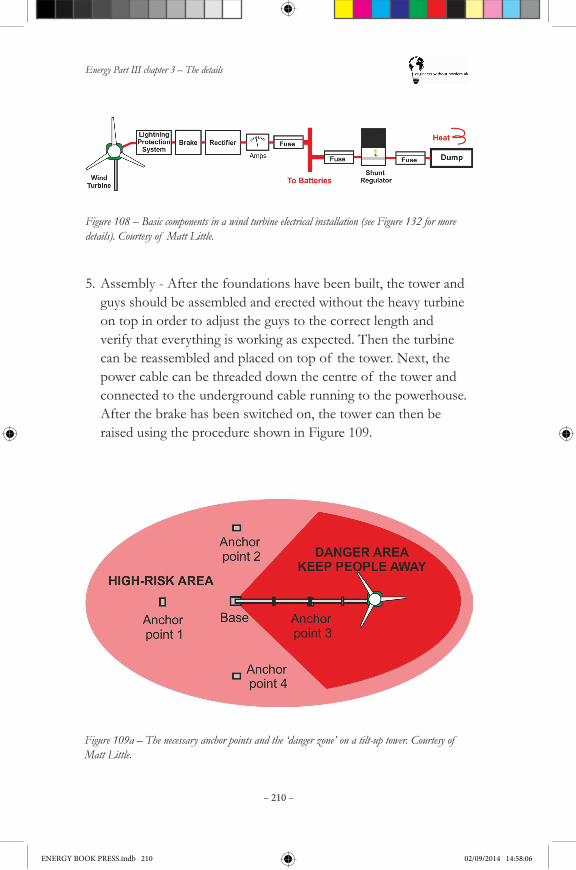
Energy Part III chapter 3 – The details
– 210 –
Figure 108 – Basic components in a wind turbine electrical installation (see Figure 132 for more details). Courtesy of Matt Little.
5. Assembly - After the foundations have been built, the tower and guys should be assembled and erected without the heavy turbine on top in order to adjust the guys to the correct length and verify that everything is working as expected. Then the turbine can be reassembled and placed on top of the tower. Next, the power cable can be threaded down the centre of the tower and connected to the underground cable running to the powerhouse. After the brake has been switched on, the tower can then be raised using the procedure shown in Figure 109.
Figure 109a – The necessary anchor points and the ‘danger zone’ on a tilt-up tower. Courtesy of Matt Little.
ENERGY BOOK PRESS.indb 210 02/09/2014 14:58:06
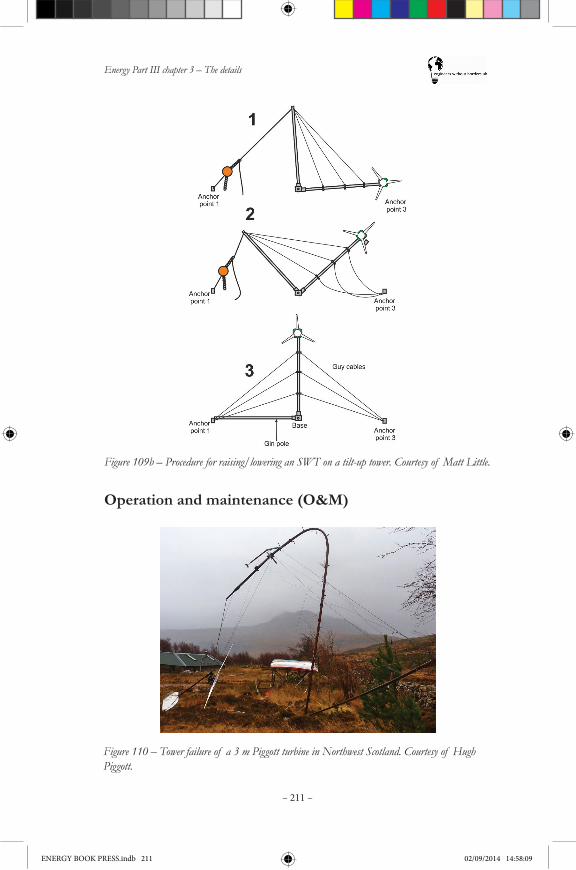
Energy Part III chapter 3 – The details
– 211 –
Figure 109b – Procedure for raising/lowering an SWT on a tilt-up tower. Courtesy of Matt Little.
Operation and maintenance (O&M)
Figure 110 – Tower failure of a 3 m Piggott turbine in Northwest Scotland. Courtesy of Hugh Piggott.
ENERGY BOOK PRESS.indb 211 02/09/2014 14:58:09
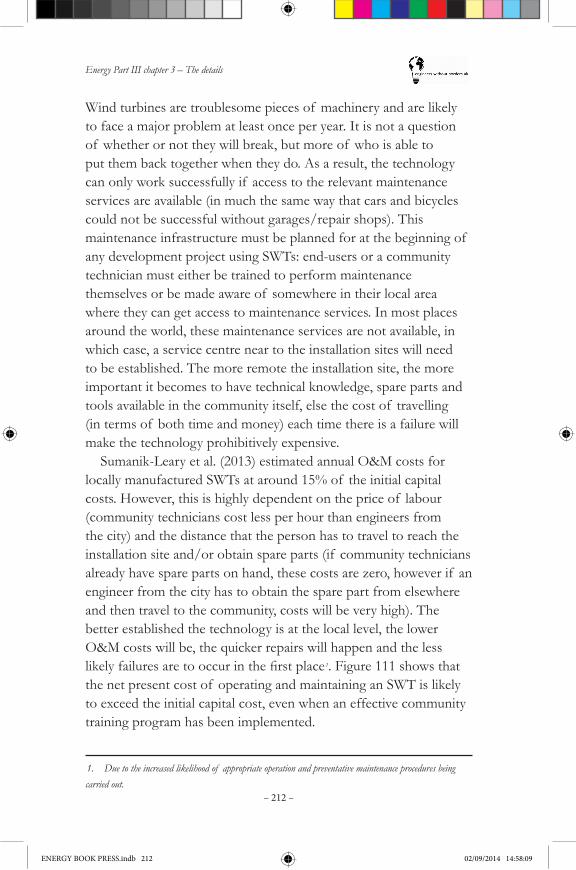
Energy Part III chapter 3 – The details
– 212 –
Wind turbines are troublesome pieces of machinery and are likely to face a major problem at least once per year. It is not a question of whether or not they will break, but more of who is able to put them back together when they do. As a result, the technology can only work successfully if access to the relevant maintenance services are available (in much the same way that cars and bicycles could not be successful without garages/repair shops). This maintenance infrastructure must be planned for at the beginning of any development project using SWTs: end-users or a community technician must either be trained to perform maintenance themselves or be made aware of somewhere in their local area where they can get access to maintenance services. In most places around the world, these maintenance services are not available, in which case, a service centre near to the installation sites will need to be established. The more remote the installation site, the more important it becomes to have technical knowledge, spare parts and tools available in the community itself, else the cost of travelling (in terms of both time and money) each time there is a failure will make the technology prohibitively expensive.
Sumanik-Leary et al. (2013) estimated annual O&M costs for locally manufactured SWTs at around 15% of the initial capital costs. However, this is highly dependent on the price of labour (community technicians cost less per hour than engineers from the city) and the distance that the person has to travel to reach the installation site and/or obtain spare parts (if community technicians already have spare parts on hand, these costs are zero, however if an engineer from the city has to obtain the spare part from elsewhere and then travel to the community, costs will be very high). The better established the technology is at the local level, the lower O&M costs will be, the quicker repairs will happen and the less likelyfailuresaretooccurinthefirstplace 1. Figure 111 shows that the net present cost of operating and maintaining an SWT is likely to exceed the initial capital cost, even when an effective community training program has been implemented.
1. Due to the increased likelihood of appropriate operation and preventative maintenance procedures being carried out.
ENERGY BOOK PRESS.indb 212 02/09/2014 14:58:09
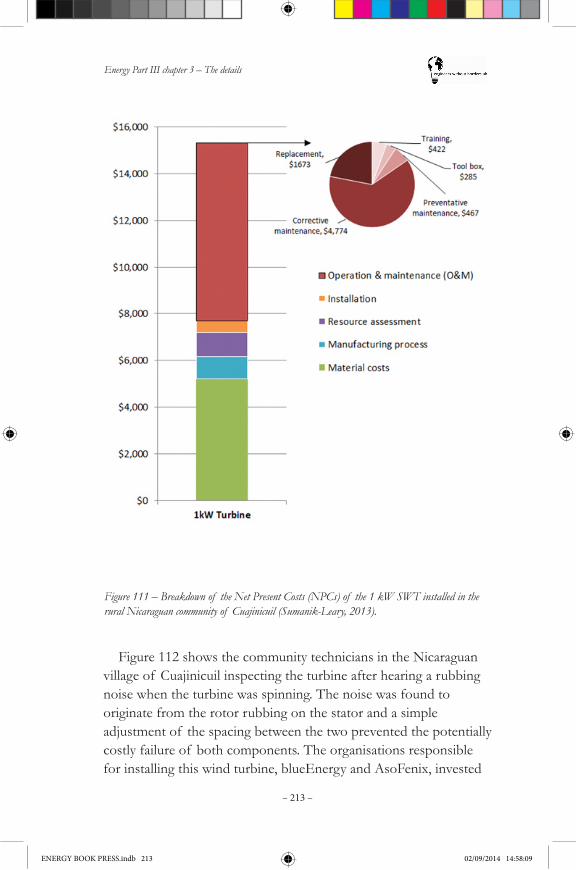
Energy Part III chapter 3 – The details
– 213 –
Figure 111 – Breakdown of the Net Present Costs (NPCs) of the 1 kW SWT installed in the rural Nicaraguan community of Cuajinicuil (Sumanik-Leary, 2013).
Figure 112 shows the community technicians in the Nicaraguan village of Cuajinicuil inspecting the turbine after hearing a rubbing noise when the turbine was spinning. The noise was found to originate from the rotor rubbing on the stator and a simple adjustment of the spacing between the two prevented the potentially costly failure of both components. The organisations responsible for installing this wind turbine, blueEnergy and AsoFenix, invested
ENERGY BOOK PRESS.indb 213 02/09/2014 14:58:09
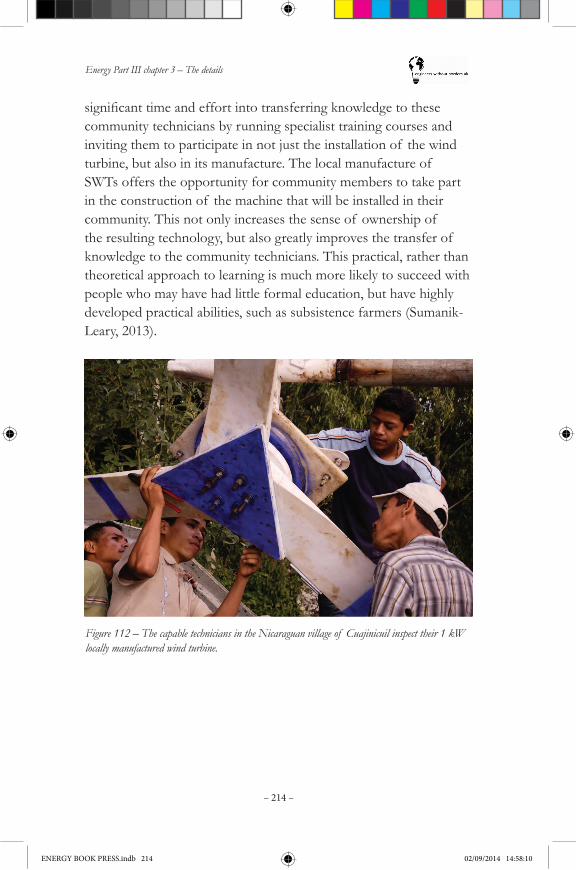
Energy Part III chapter 3 – The details
– 214 –
Figure 112 – The capable technicians in the Nicaraguan village of Cuajinicuil inspect their 1 kW locally manufactured wind turbine.
significanttimeandeffortintotransferringknowledgetothesecommunity technicians by running specialist training courses and inviting them to participate in not just the installation of the wind turbine, but also in its manufacture. The local manufacture of SWTs offers the opportunity for community members to take part in the construction of the machine that will be installed in their community. This not only increases the sense of ownership of the resulting technology, but also greatly improves the transfer of knowledge to the community technicians. This practical, rather than theoretical approach to learning is much more likely to succeed with people who may have had little formal education, but have highly developed practical abilities, such as subsistence farmers (Sumanik-Leary, 2013).
ENERGY BOOK PRESS.indb 214 02/09/2014 14:58:10
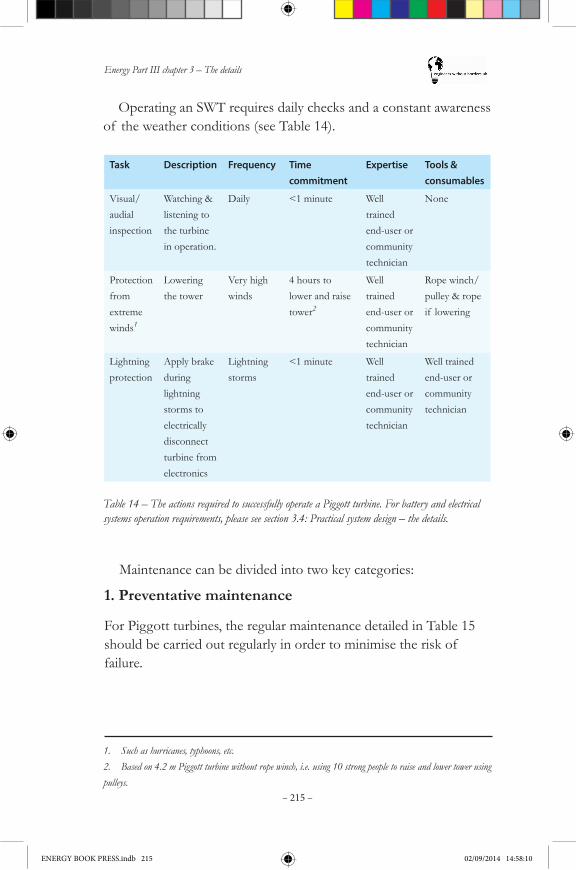
Energy Part III chapter 3 – The details
– 215 –
Task Description Frequency Time commitment
Expertise Tools & consumables
Visual/audial inspection
Watching & listening to the turbine in operation.
Daily <1 minute Well trained end-user or community technician
None
Protection from extreme winds1
Lowering the tower
Very high winds
4 hours to lower and raise tower2
Well trained end-user or community technician
Rope winch/pulley & rope if lowering
Lightning protection
Apply brake during lightning storms to electrically disconnect turbine from electronics
Lightning storms
<1 minute Well trained end-user or community technician
Well trained end-user or community technician
Table 14 – The actions required to successfully operate a Piggott turbine. For battery and electrical systems operation requirements, please see section 3.4: Practical system design – the details.
1. Such as hurricanes, typhoons, etc.2. Based on 4.2 m Piggott turbine without rope winch, i.e. using 10 strong people to raise and lower tower using pulleys.
Operating an SWT requires daily checks and a constant awareness of the weather conditions (see Table 14).
Maintenance can be divided into two key categories:
1. Preventative maintenance
For Piggott turbines, the regular maintenance detailed in Table 15 should be carried out regularly in order to minimise the risk of failure.
ENERGY BOOK PRESS.indb 215 02/09/2014 14:58:10
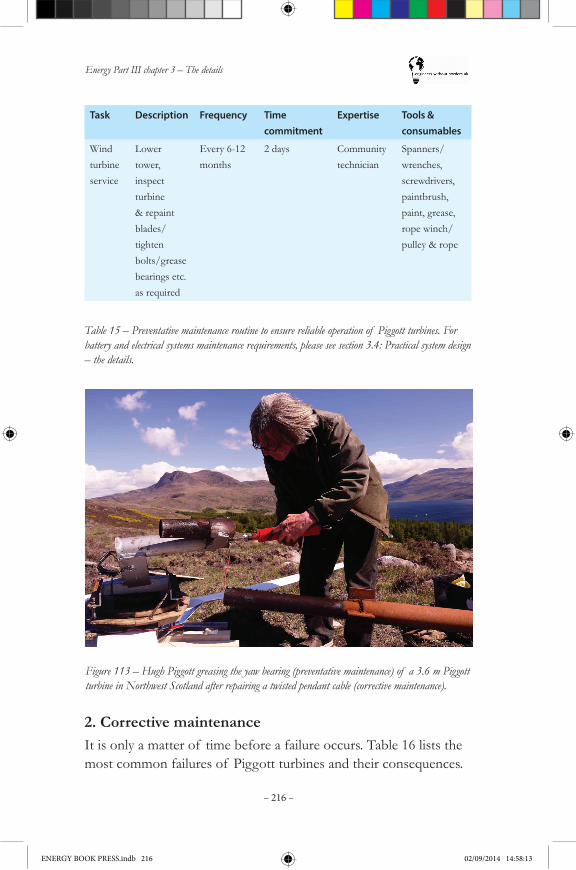
Energy Part III chapter 3 – The details
– 216 –
Task Description Frequency Time commitment
Expertise Tools & consumables
Wind turbine service
Lower tower, inspect turbine & repaint blades/tighten bolts/grease bearings etc. as required
Every 6-12 months
2 days Community technician
Spanners/wrenches, screwdrivers, paintbrush, paint, grease, rope winch/pulley & rope
Table 15 – Preventative maintenance routine to ensure reliable operation of Piggott turbines. For battery and electrical systems maintenance requirements, please see section 3.4: Practical system design – the details.
Figure 113 – Hugh Piggott greasing the yaw bearing (preventative maintenance) of a 3.6 m Piggott turbine in Northwest Scotland after repairing a twisted pendant cable (corrective maintenance).
2. Corrective maintenanceIt is only a matter of time before a failure occurs. Table 16 lists the most common failures of Piggott turbines and their consequences.
ENERGY BOOK PRESS.indb 216 02/09/2014 14:58:13
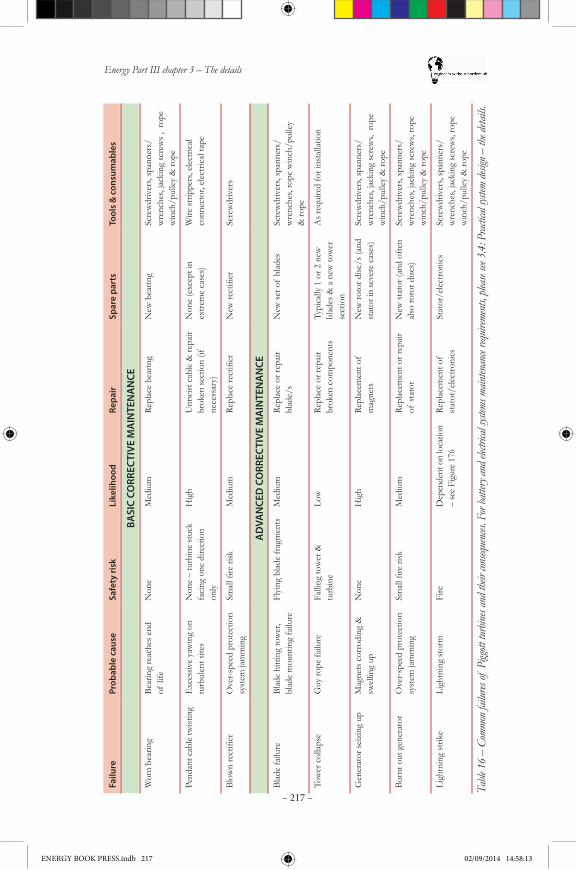
Energy Part III chapter 3 – The details
– 217 –
Failu
rePr
obab
le c
ause
Safe
ty ri
skLi
kelih
ood
Repa
irSp
are
part
sTo
ols
& c
onsu
mab
les
BASI
C CO
RREC
TIVE
MA
INTE
NA
NCE
Wor
n be
arin
gBe
arin
g re
ache
s end
of
life
Non
eM
ediu
mRe
plac
e be
arin
gN
ew b
earin
gSc
rew
driv
ers,
span
ners
/w
renc
hes,
jack
ing
scre
ws ,
rop
e w
inch
/pul
ley
& ro
pe
Pend
ant c
able
twist
ing
Exc
essiv
e ya
win
g on
tu
rbul
ent s
ites
Non
e –
turb
ine
stuc
k fa
cing
one
dire
ctio
n on
ly
Hig
hU
ntw
ist c
able
& re
pair
brok
en se
ctio
n (if
ne
cess
ary)
Non
e (e
xcep
t in
extre
me
case
s)W
ire st
rippe
rs, e
lect
rical
co
nnec
tor,
elec
trica
l tap
e
Blownrectifier
Ove
r-spe
ed p
rote
ctio
n sy
stem
jam
min
gSmallfirerisk
Med
ium
Replacerectifier
Newrectifier
Scre
wdr
iver
s
AD
VAN
CED
CO
RREC
TIVE
MA
INTE
NA
NCE
Blad
e fa
ilure
Blad
e hi
tting
tow
er,
blad
e m
ount
ing
failu
reFl
ying
bla
de fr
agm
ents
Med
ium
Repl
ace
or re
pair
blad
e/s
New
set o
f bl
ades
Scre
wdr
iver
s, sp
anne
rs/
wre
nche
s, ro
pe w
inch
/pul
ley
& ro
pe
Tow
er c
olla
pse
Guy
rope
failu
reFa
lling
tow
er &
tu
rbin
eLo
wRe
plac
e or
repa
ir br
oken
com
pone
nts
Typi
cally
1 o
r 2 n
ew
blad
es &
a n
ew to
wer
se
ctio
n
As r
equi
red
for i
nsta
llatio
n
Gen
erat
or se
izin
g up
Mag
nets
cor
rodi
ng &
sw
ellin
g up
Non
eH
igh
Repl
acem
ent o
f m
agne
tsN
ew ro
tor d
isc/s
(and
st
ator
in se
vere
cas
es)
Scre
wdr
iver
s, sp
anne
rs/
wre
nche
s, ja
ckin
g sc
rew
s, ro
pe
win
ch/p
ulle
y &
rope
Burn
t out
gen
erat
orO
ver-s
peed
pro
tect
ion
syst
em ja
mm
ing
Smallfirerisk
Med
ium
Repl
acem
ent o
r rep
air
of st
ator
New
stat
or (a
nd o
ften
also
roto
r disc
s)Sc
rew
driv
ers,
span
ners
/w
renc
hes,
jack
ing
scre
ws,
rope
w
inch
/pul
ley
& ro
pe
Ligh
tnin
g st
rike
Ligh
tnin
g st
orm
Fire
Dep
ende
nt o
n lo
catio
n –
see
Figu
re 1
76Re
plac
emen
t of
stat
or/e
lect
roni
csSt
ator
/ele
ctro
nics
Scre
wdr
iver
s, sp
anne
rs/
wre
nche
s, ja
ckin
g sc
rew
s, ro
pe
win
ch/p
ulle
y &
rope
Table
16
– Co
mmon
failu
res of
Pigg
ott tu
rbine
s and
their
cons
eque
nces.
For
batte
ry an
d elec
trical
syste
ms m
ainten
ance
requir
emen
ts, pl
ease
see 3
.4: P
racti
cal sy
stem
desig
n – th
e deta
ils.
ENERGY BOOK PRESS.indb 217 02/09/2014 14:58:13

Energy Part III chapter 3 – The details
– 218 –
3.3.2.5 Safety
Wind turbines are certainly dangerous, however so are many other technologies that are in common use across society today. The car is a great example, as many people are killed in car crashes, however people live with the risks because driving a car is so much quicker than walking. If people understand the risks and take appropriate action to minimise them, then the technology can be safely employed. For example just as people avoid crossing roads when the cars are going very fast, people can avoid going near wind turbines during high winds. Taking the following precautions can minimise the risks associated with SWTs:•Never climb the tower to inspect the turbine. The wind turbine
should always be lowered to the ground to perform maintenance.
•Keep people away from the area directly under the wind turbine at all times. If possible, fence off an area with radius 1.5 x the height of the tower as a ‘drop zone’.
•Beware of the strong magnets used in the generator. When disassembled the two rotor disks should be kept separate and away from any steel items, as they will be strongly attracted to the surface.
•Always apply the electrical brake when performing maintenance to minimize risk of electric shock.
•Only raise and lower the wind turbine in times of low wind, with the electrical brake on. Ensure that everybody involved in the raising and lowering process is fully aware of their role and what they need to do if something starts to go wrong. Ensure all spectators are kept out of the ‘danger zone’ shown in Figure 109a.
•Carry heavy components such as the generator and tower sections in teams.
•Avoid lightning prone areas, or install a lightning protection system and ensure both the turbine and electrical system are well grounded (see Wind turbine lightning protection system).
ENERGY BOOK PRESS.indb 218 02/09/2014 14:58:13

Energy Part III chapter 3 – The details
– 219 –
Please see section 3.4: Practical system design – the details, for details of the safety hazards involved with other wind power system components, such as batteries and inverters.
3.3.2.6 More information
Although this section has given more detailed information on SWTs, the reader should refer to the additional information contained in chapter 4, Further reading, and consult both an expert and a local champion before implementing any potential solutions.
3.3.3 Pico- and micro-hydropower – the details
3.3.3.1 Designing a micro-hydro project
Good design of a complete pico- or micro-hydro project requires skills in civil, mechanical and electrical engineering. Sometimes engineers who specialize in one of these three disciplines believe that the other issues are unimportant or trivial, but in fact there needs to be a balance between them. It is always worthwhile to get additional advice if a project requires skills outside the volunteer team’s area of expertise. Detailed guidance on micro-hydro systems design can be found in the following recommended resources:•Maher and Smith’s (2001) freely available Pico-hydro for village power.
•Harvey’s (1993) comprehensive textbook, Micro-hydro design manual.
As with other energy projects it is important to assess the likely demand as well as the energy resource and the cost of implementation. For a micro-hydro scheme good design will begin with the choice of intake powerhouse location and the method for conveying water from one to the other. Often the length and cost of pipe can be minimised by using a channel running nearly along the contour to a point where a small tank can be built on the slope above the power house. The best choice of power house location may be a compromise between the need to make use of as much head as possible and the need to be close to the users, so that cable costs are not excessive.
ENERGY BOOK PRESS.indb 219 02/09/2014 14:58:14

Energy Part III chapter 3 – The details
– 220 –
The overall aim of the design is to capture enough energy as needed (as opposed to as much as is physically possible), to have agoodoverallefficiencyandtoinstallareliablesystemwithintheproject budget. The pipe and the cable are often the most expensive parts of a hydro project. It is worthwhile to check that appropriate sizes are used to achieve relatively low power loss (usually 5–10 %) without high cost. More information is given in the section on economics. The selection of suitable turbine and generator for the site will depend on local availability of equipment but will also requireassessmentof efficiencyovertherangeof flowsavailableduringtheyear.Considerinthefirstplacetheminimumpowerrequired at the driest time of the year.
The basic design should consist of the main materials and components and preliminary costs for each. Micro-hydropower is a well-established technology with a range of tested designs available. For the project volunteer, unusual, innovative solutions are unlikely to be better than tried and tested methods, however some improvements in engineering materials and electrical technologies, such as permanent magnet generators, may bring scope for new technical solutions.TheflowchartinFigure114outlinesthemajorstepsinthe
design process for a micro-hydro system. Unfortunately, many proposed pico/micro-hydro projects are
notsuccessfulbecauseof issuessuchaslackof finance,lackof accountability,conflictinginterestsamongststakeholders–e.g.between different parts of a community with different priorities, between funders and equipment suppliers or scheme designer(s), lack of access to equipment, poor management of the scheme, or poor maintenance. These issues require non-technical skills to resolve, whereas poor design or installation may be a contributory factor in an unsuccessful scheme, which can be avoided by applying technical skills.
ENERGY BOOK PRESS.indb 220 02/09/2014 14:58:14
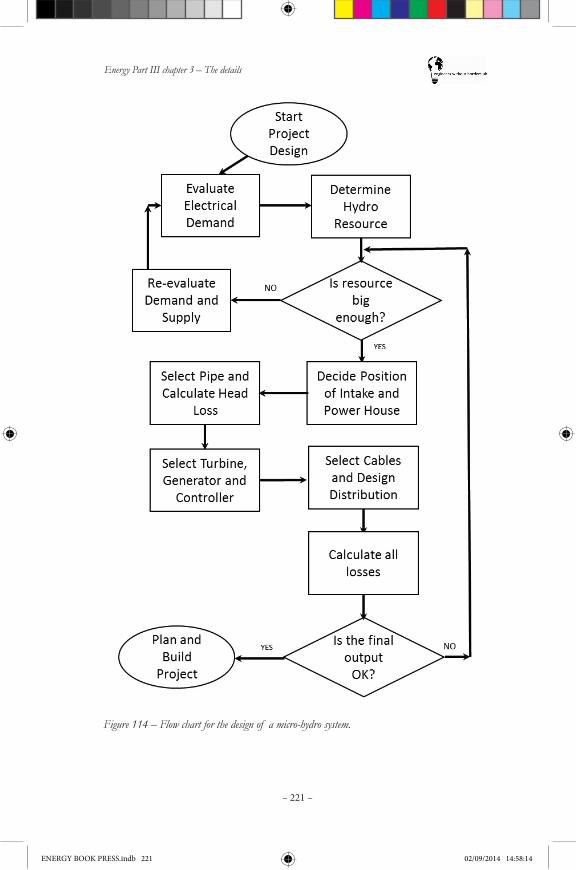
Energy Part III chapter 3 – The details
– 221 –
Figure 114 – Flow chart for the design of a micro-hydro system.
ENERGY BOOK PRESS.indb 221 02/09/2014 14:58:14

Energy Part III chapter 3 – The details
– 222 –
Case study 9 (a): A participatory approach to rural electrification through micro-hydro power
Andrew Carr, Malaysian Borneo, 2011
TONIBUNGisanon-profitcommunity-basedorganisationwhich aims to reduce poverty in rural indigenous communities in Malaysia.Theirfocusisruralelectrification(RE)throughmicro-hydropower (MHP) schemes. The schemes serve ‘Kampungs’ (villages) with populations typically ranging from 50–200, and provide 1–10 kW of power. Two EWB-UK volunteers were placed with the organisation in 2011 to complete funding applications and undertake feasibility, design, inspection and maintenance work.Theorganisationhasrecentlyundertakenaruralelectrification
programme in the remote Pensiangan district of Sabah. They have successfullyimplementedMHPschemesinfivecommunitiesinthe region, a challenging undertaking, as the communities are only accessible by longboat. Behind their success is a distinct approach informed by lessons learnt from past experiences, a thorough understanding of local indigenous community life, and knowledge shared by fellow RE practitioners abroad.
As with any form of development assistance, there are complex social issues to overcome. One such issue has been community ownership. Problems associated with lack of ownership were seen during inspections undertaken at one of the organisation’s earliest schemes. For example, stream intakes had not been maintained; the silt trap put in place had not been serviced for some time. The headrace pipe leaked in several locations, and the intake reservoir embankment was close to failure. The powerhouse building was also showing signs of neglect.
These issues are expensive to resolve and mobilisation costs for the organisation to undertake work in a remote community are very high. Donors are less inclined to provide funds for work that could have been avoided or minimised, and it also invalidates the underlying economic assessment used to obtain donor funding initially;expensivemaintenanceworksignificantlylengthensthepayback period of a scheme.
ENERGY BOOK PRESS.indb 222 02/09/2014 14:58:14
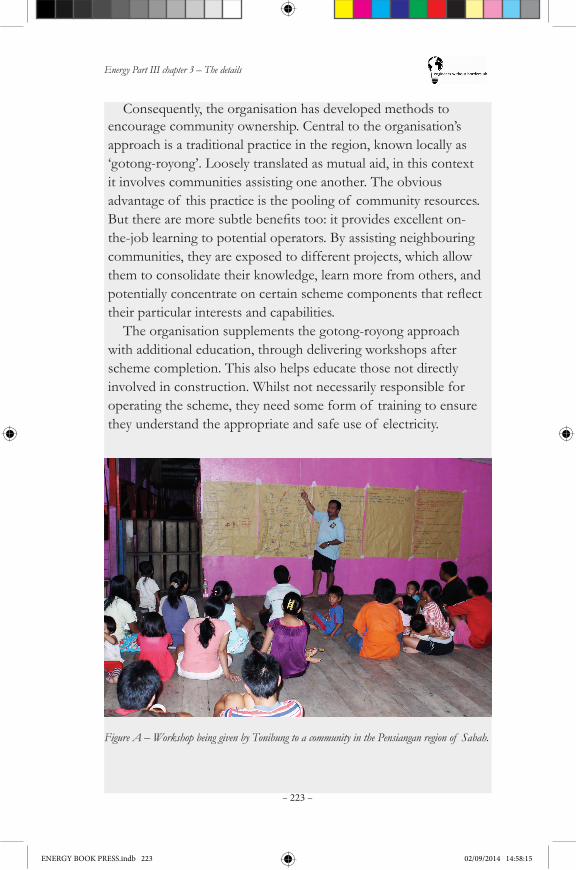
Energy Part III chapter 3 – The details
– 223 –
Consequently, the organisation has developed methods to encourage community ownership. Central to the organisation’s approach is a traditional practice in the region, known locally as ‘gotong-royong’. Loosely translated as mutual aid, in this context it involves communities assisting one another. The obvious advantage of this practice is the pooling of community resources. Buttherearemoresubtlebenefitstoo:itprovidesexcellenton-the-job learning to potential operators. By assisting neighbouring communities, they are exposed to different projects, which allow them to consolidate their knowledge, learn more from others, and potentiallyconcentrateoncertainschemecomponentsthatreflecttheir particular interests and capabilities.
The organisation supplements the gotong-royong approach with additional education, through delivering workshops after scheme completion. This also helps educate those not directly involved in construction. Whilst not necessarily responsible for operating the scheme, they need some form of training to ensure they understand the appropriate and safe use of electricity.
Figure A – Workshop being given by Tonibung to a community in the Pensiangan region of Sabah.
ENERGY BOOK PRESS.indb 223 02/09/2014 14:58:15

Energy Part III chapter 3 – The details
– 224 –
The success of this approach was seen when visiting the Pensiangan region. At one community, volunteers accompanied two local youths who had been trained to operate and maintain the system. The operators undertook thorough maintenance of thesystem,flushingsiltfromtheintakeandforebaytanks,andchecking the penstock pipe, the turbine and distribution board.
The organisation intends to continue improving community ownership by developing a training programme at a newly established training centre. The intention is to school willing community members through a series of structured training modules. The hope is these community reps will not only maintain their own schemes, but assist in developing new schemes in their home regions.
About the author: Andrew spent 4 months in Malaysian Borneo on an EWB-UK placement with TONIBUNG, carrying out feasibility studies for potential micro-hydro schemes across Malaysia.Whilstonplacement,hegainedfirst-handexperienceinthe design, construction and impacts of micro-hydro in remote indigenous communities.
About the organisation: TONIBUNG was formed in 1993 as a non-profit,community-basedorganisationbasedinSabah.Theirmainfocusisruralelectrification(RE)throughmicrohydro,andto a lesser extent solar. They have also been involved in rural computer centres, resource management planning, community mapping with GPS and GIS, and micro-enterprises.
ENERGY BOOK PRESS.indb 224 02/09/2014 14:58:15

Energy Part III chapter 3 – The details
– 225 –
In many countries, rural energy has been developed on a piecemeal basis, because there is there is no effective link between any national policy and organisations working at the local level (Ahlborg & Hammer, 2011). Several micro- and pico-hydro case studies in Nepal and Kenya are discussed in a report by Gitonga & Clemens (2006) in the context of expanding access to modern energy services. They identify the technology as having good potentialbecauseof relativelylowcapitalcostsandflexiblepowerproduction for electrical and/or mechanical equipment. The design of these schemes is based on the Pico Power Pack or pump as turbine, which have demonstrated reliable energy production over a number of years. They recommend the involvement of NGOs whohaveexperienceinmicro-hydrototapintofinancialsupportand technical expertise. Otherwise, even the most enthusiastic localentrepreneurswillhavedifficultyinimplementingsuccessfulruralprojects.Casestudies9(aandb)illustratethesignificanceof involving local organisations and of setting up resilient management of schemes at a local level. One successful model for management of village power schemes has been developed from experience in Peru of NGO Soluciones Practicas (Practical Action), which has been published by Sanchez (2006). This model allows community ownership of the project, but uses entrepreneurs within the community to act as a ‘management company’ with clear contracts to set out responsibilities and rewards.
3.3.3.2 Turbines
There are many different micro-hydro turbines available, each matchingdifferentflowandheadconditions.Theturbinescanbeclassifiedasimpulseorreactiontypeturbines;impulseturbinesuseallthekineticenergyfromtheflowtoformajetwhichimpactstheturbine runner, whilst reaction turbines use pressure differences across the turbine blades.
ENERGY BOOK PRESS.indb 225 02/09/2014 14:58:15
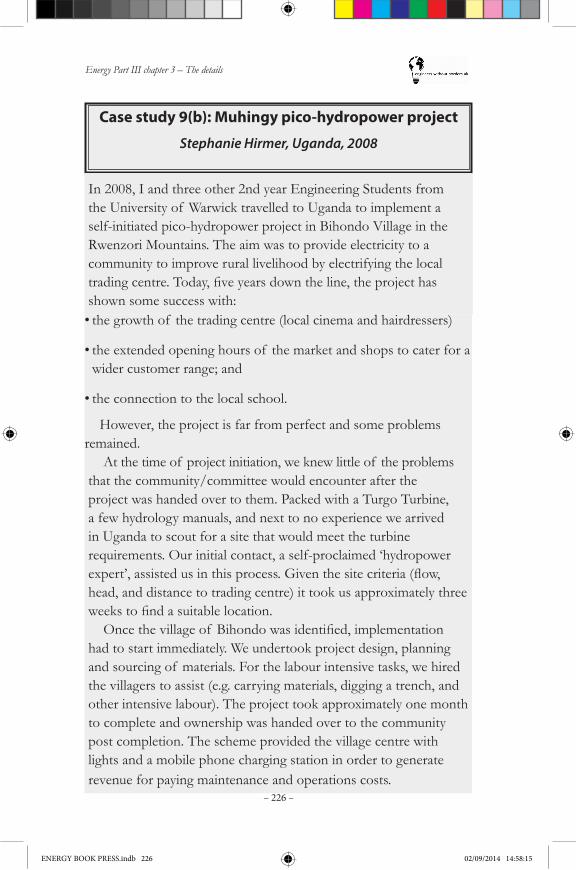
Energy Part III chapter 3 – The details
– 226 –
Case study 9(b): Muhingy pico-hydropower project
Stephanie Hirmer, Uganda, 2008
In 2008, I and three other 2nd year Engineering Students from the University of Warwick travelled to Uganda to implement a self-initiated pico-hydropower project in Bihondo Village in the Rwenzori Mountains. The aim was to provide electricity to a community to improve rural livelihood by electrifying the local tradingcentre.Today,fiveyearsdowntheline,theprojecthasshown some success with: •the growth of the trading centre (local cinema and hairdressers)
•the extended opening hours of the market and shops to cater for a wider customer range; and
•the connection to the local school.
However, the project is far from perfect and some problems remained.
At the time of project initiation, we knew little of the problems that the community/committee would encounter after the project was handed over to them. Packed with a Turgo Turbine, a few hydrology manuals, and next to no experience we arrived in Uganda to scout for a site that would meet the turbine requirements. Our initial contact, a self-proclaimed ‘hydropower expert’,assistedusinthisprocess.Giventhesitecriteria(flow,head, and distance to trading centre) it took us approximately three weekstofindasuitablelocation.Oncethevillageof Bihondowasidentified,implementation
had to start immediately. We undertook project design, planning and sourcing of materials. For the labour intensive tasks, we hired the villagers to assist (e.g. carrying materials, digging a trench, and other intensive labour). The project took approximately one month to complete and ownership was handed over to the community post completion. The scheme provided the village centre with lights and a mobile phone charging station in order to generate revenue for paying maintenance and operations costs.
ENERGY BOOK PRESS.indb 226 02/09/2014 14:58:15

Energy Part III chapter 3 – The details
– 227 –
We travelled to Kampala where we had a meeting with an energy expert who was involved in advising the Ministry of Energy and Mineral Development (MEMD) on hydropower developments and who had heard of our initiative. Unfortunately he did not share the same enthusiasm for the project as us, and we were informed that ‘Africa is not a playground’. At the time, we did not want to understand what he was referring to as we were so proud of our achievement of implementing a ‘helpful’ project with limited knowledge, resources and time. However, after seeing the project fail over and over again, the following has become clear:•The community was lacking ownership. We intruded into this
village to implement a project and had never even asked the community if they wanted such a development. We employed the community to undertake the work, as opposed to asking for contributions in labour and kind.
•Lack of responsibility and accountability. We set up a bank account to allow locals to accumulate savings for operation and maintenance costs. However, it soon came to light that money was never credited, as no one was checking or even understood where the money should go in the system.
Figure A – A group of Warwick University students and a local community member carrying materials for a micro-hydro system up a steep hill in Uganda.
ENERGY BOOK PRESS.indb 227 02/09/2014 14:58:15

Energy Part III chapter 3 – The details
– 228 –
•Lack of maintenance. We left a community (with limited educational background) to operate and maintain a project involving complex technology, and we expected that if the hydropower equipment brokedowntheywouldbeabletofixitbasedonasmallmanualwe had provided.
… and the list goes on. To date, some problems have still not abated. However, over time the community has taken the initiative to gather funds to repair the project, although still requiring help with technical tasks. From this project and my work in Uganda I learnt that simply providing a technical solution to a project is not enough and the success of a project depends on a wide array of factors many of which are of a social nature.
About the author: Stephi is a PhD student at the University of Cambridge. Stephi’s research is looking at the end-users’ perspectiveonthevalueof ruralelectrificationinitiatives.Priortocoming to Cambridge she was working in Uganda for the German Development Agency (GIZ) on the design and implementation of ruralelectrificationprojects.
About the organisation: Following the 2008 pico-hydropower project, each year students from the University of Warwick return to Uganda to implement further projects or improve the existing installations.
ENERGY BOOK PRESS.indb 228 02/09/2014 14:58:15
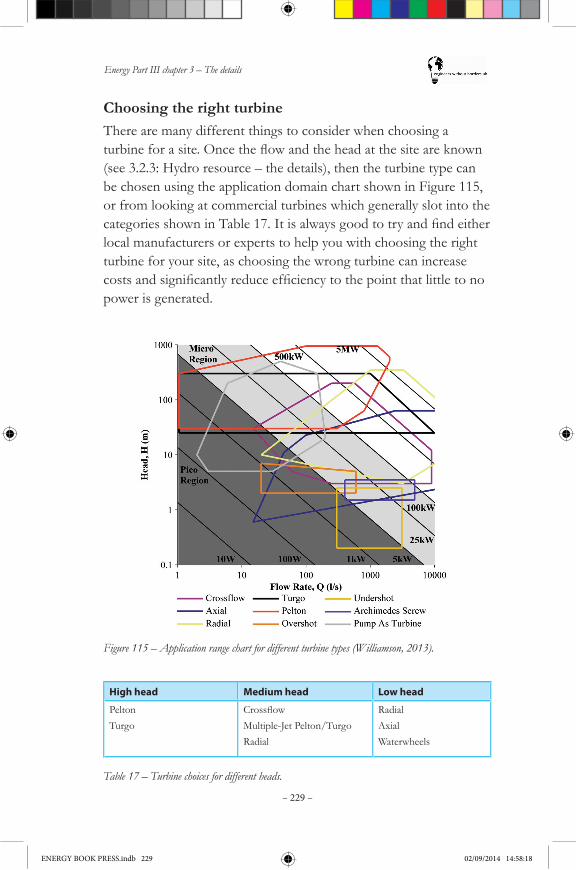
Energy Part III chapter 3 – The details
– 229 –
Choosing the right turbineThere are many different things to consider when choosing a turbineforasite.Oncetheflowandtheheadatthesiteareknown(see 3.2.3: Hydro resource – the details), then the turbine type can be chosen using the application domain chart shown in Figure 115, or from looking at commercial turbines which generally slot into the categoriesshowninTable17.Itisalwaysgoodtotryandfindeitherlocal manufacturers or experts to help you with choosing the right turbine for your site, as choosing the wrong turbine can increase costsandsignificantlyreduceefficiencytothepointthatlittletonopower is generated.
Figure 115 – Application range chart for different turbine types (Williamson, 2013).
High head Medium head Low head
PeltonTurgo
CrossflowMultiple-Jet Pelton/TurgoRadial
RadialAxialWaterwheels
Table 17 – Turbine choices for different heads.
ENERGY BOOK PRESS.indb 229 02/09/2014 14:58:18

Energy Part III chapter 3 – The details
– 230 –
Case study 10: Choosing the right turbine
Arthur Williams, Peru
Like many rural communities situated in the Andean foothills in northern Peru, the village of Magdalena has potential to produce some of its own electricity from hydropower. However, because theterrainhereisflatter,thecommonlyusedoptionsof Peltonorcrossflowturbinewerenotappropriate.AnNGOwithextensiveexperience in micro-hydro installed a scheme using a small propeller turbine, suitable for the available head of 4 m. A turbine was manufactured in Peru using basic engineering equipment, with the runner made of steel sheet, cut, bent and welded to a hub at the required angles. When tested on site, the forebay tank was emptying,indicatingthattheflowratewasnotenoughtomatchthe turbine operating conditions. In fact, power output was hardly enough to overcome losses in the belt drive and generator as information supplied by the villagers had been too optimistic when estimatingtheavailableflow.
A small university team in the UK got involved with the project at this stage and were able to show that the current turbine design wasoptimisedforaflowrateof over250l/s.Agraduateengineerfrom Peru was working as a volunteer with the NGO to gain workexperienceandwasabletomeasureaflowrateatthesiteof around160l/s.Atthisstagetheprojectbecameafieldtrialforawider project investigating small propeller turbine design funded by the Leverhulme Trust.Usingcomputationalfluiddynamics(CFD),theresearchteam
wasabletoconfirmthemismatchbetweentheturbinedesignandtheavailableflow.Adecisionhadtobemadeastowhethera complete redesign of the turbine was required, or whether it would be possible simply to change the runner. A new runner was designed of the same diameter, but with revised blade angles. CFD was used to check this design and to predict that the new runner within the same casing could achieve close to the original intended turbineefficiencyof 75%ataflowrateof 160l/s.Thisprovideda suitable solution without a large additional cost.
ENERGY BOOK PRESS.indb 230 02/09/2014 14:58:18

Energy Part III chapter 3 – The details
– 231 –
Meanwhile, improved measurement facilities were installed at the site,includingaventuriflume,designedbytheengineersinPeru.The new runner design was sent from the UK to be manufactured at a small turbine workshop in the capital, Lima. Much of the work on site was carried out by the Peruvian graduate volunteer, including the design and installation of the measurement equipment, and then assisting with the installation and testing of theimprovedturbine.Sitetestsconfirmedanelectricaloutputof nearly 4 kW – meeting the predictions of the design team.
Figure A – CFD simulations, checked against test data, were used to improve the turbine design.
Figure B – Field testing of the turbine using a torque brake. Photo courtesy of Robert Simpson.
ENERGY BOOK PRESS.indb 231 02/09/2014 14:58:19

Energy Part III chapter 3 – The details
– 232 –
Two lessons learned:
1. Forthistypeof turbine,aswithmanyothers,highefficiencyisonlypossibleforalimitedrangeof flow,soitisimportantnottooverestimate the resource available.
2. Sophisticated engineering methods, such as CFD, can be applied to developing country problems. This work led to the development of a detailed method published as an Open Source guide to design of small propeller turbines: http://www.eee.nottingham.ac.uk/picohydro/documents.html#manuals
About the author: Arthur Williams has over 25 years of experienceworkinginthefieldof small-scalerenewableenergy.He completed a PhD in micro-hydropower in 1992 and worked on various projects to develop and disseminate cost-effective technologiesforruralelectrification.In2000hewasinvitedtoPeru by Practical Action, which led to this project to develop a reliable design procedure for low-head turbines, funded by Leverhulme Trust. Most of the detailed technical work was carried out by his colleague at Nottingham Trent University, Dr Robert Simpson, who now works as a renewable energy consultant back in Australia.
ENERGY BOOK PRESS.indb 232 02/09/2014 14:58:19
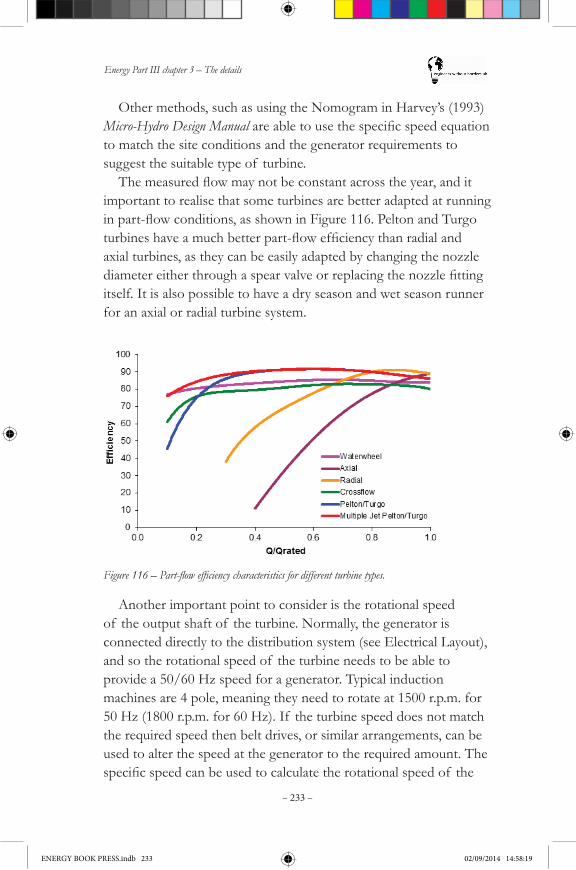
Energy Part III chapter 3 – The details
– 233 –
Other methods, such as using the Nomogram in Harvey’s (1993) Micro-Hydro Design Manualareabletousethespecificspeedequationto match the site conditions and the generator requirements to suggest the suitable type of turbine.Themeasuredflowmaynotbeconstantacrosstheyear,andit
important to realise that some turbines are better adapted at running inpart-flowconditions,asshowninFigure116.PeltonandTurgoturbineshaveamuchbetterpart-flowefficiencythanradialandaxial turbines, as they can be easily adapted by changing the nozzle diametereitherthroughaspearvalveorreplacingthenozzlefittingitself. It is also possible to have a dry season and wet season runner for an axial or radial turbine system.
Figure 116 – Part-flow efficiency characteristics for different turbine types.
Another important point to consider is the rotational speed of the output shaft of the turbine. Normally, the generator is connected directly to the distribution system (see Electrical Layout), and so the rotational speed of the turbine needs to be able to provide a 50/60 Hz speed for a generator. Typical induction machines are 4 pole, meaning they need to rotate at 1500 r.p.m. for 50 Hz (1800 r.p.m. for 60 Hz). If the turbine speed does not match the required speed then belt drives, or similar arrangements, can be used to alter the speed at the generator to the required amount. The specificspeedcanbeusedtocalculatetherotationalspeedof the
ENERGY BOOK PRESS.indb 233 02/09/2014 14:58:19
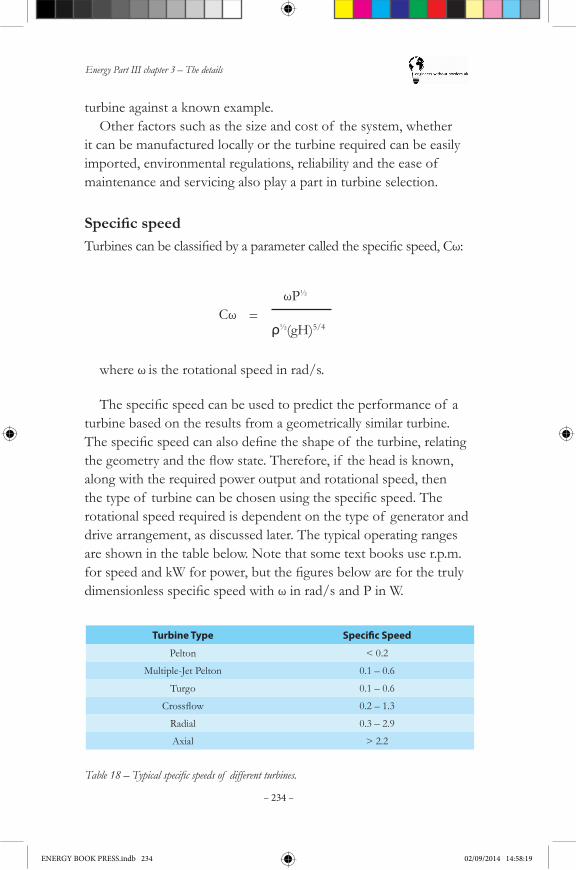
Energy Part III chapter 3 – The details
– 234 –
turbine against a known example.Other factors such as the size and cost of the system, whether
it can be manufactured locally or the turbine required can be easily imported, environmental regulations, reliability and the ease of maintenance and servicing also play a part in turbine selection.
SpecificspeedTurbinescanbeclassifiedbyaparametercalledthespecificspeed,Cω:
CωωP½
ρ½(gH)5/4=
whereω is the rotational speed in rad/s.
Thespecificspeedcanbeusedtopredicttheperformanceof aturbine based on the results from a geometrically similar turbine. Thespecificspeedcanalsodefinetheshapeof theturbine,relatingthegeometryandtheflowstate.Therefore,if theheadisknown,along with the required power output and rotational speed, then thetypeof turbinecanbechosenusingthespecificspeed.Therotational speed required is dependent on the type of generator and drive arrangement, as discussed later. The typical operating ranges are shown in the table below. Note that some text books use r.p.m. forspeedandkWforpower,butthefiguresbelowareforthetrulydimensionlessspecificspeedwithωinrad/sandPinW.
Turbine Type Specific Speed
Pelton < 0.2
Multiple-Jet Pelton 0.1 – 0.6
Turgo 0.1 – 0.6
Crossflow 0.2 – 1.3
Radial 0.3 – 2.9
Axial > 2.2
Table 18 – Typical specific speeds of different turbines.
ENERGY BOOK PRESS.indb 234 02/09/2014 14:58:19
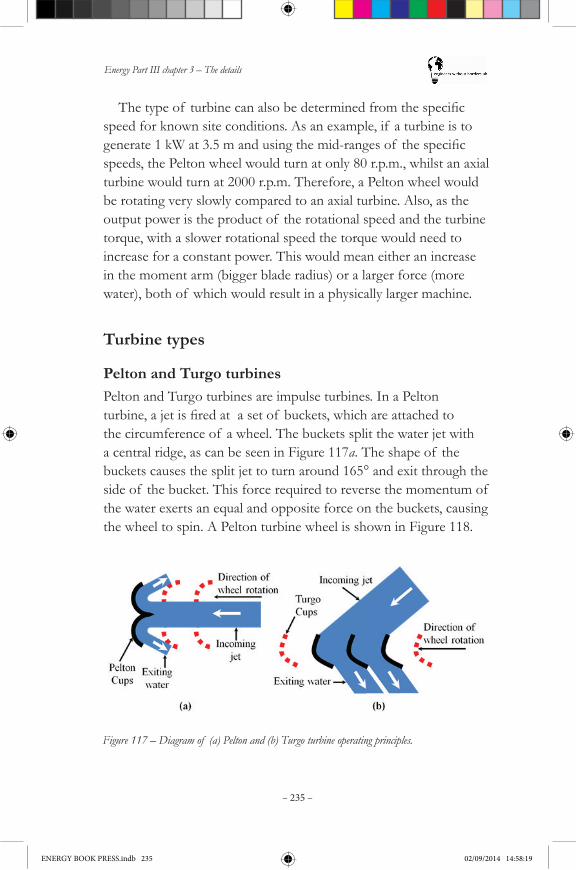
Energy Part III chapter 3 – The details
– 235 –
Thetypeof turbinecanalsobedeterminedfromthespecificspeed for known site conditions. As an example, if a turbine is to generate1kWat3.5mandusingthemid-rangesof thespecificspeeds, the Pelton wheel would turn at only 80 r.p.m., whilst an axial turbine would turn at 2000 r.p.m. Therefore, a Pelton wheel would be rotating very slowly compared to an axial turbine. Also, as the output power is the product of the rotational speed and the turbine torque, with a slower rotational speed the torque would need to increase for a constant power. This would mean either an increase in the moment arm (bigger blade radius) or a larger force (more water), both of which would result in a physically larger machine.
Turbine types
Pelton and Turgo turbinesPelton and Turgo turbines are impulse turbines. In a Pelton turbine,ajetisfiredatasetof buckets,whichareattachedtothe circumference of a wheel. The buckets split the water jet with a central ridge, as can be seen in Figure 117a. The shape of the buckets causes the split jet to turn around 165° and exit through the side of the bucket. This force required to reverse the momentum of the water exerts an equal and opposite force on the buckets, causing the wheel to spin. A Pelton turbine wheel is shown in Figure 118.
Figure 117 – Diagram of (a) Pelton and (b) Turgo turbine operating principles.
ENERGY BOOK PRESS.indb 235 02/09/2014 14:58:19
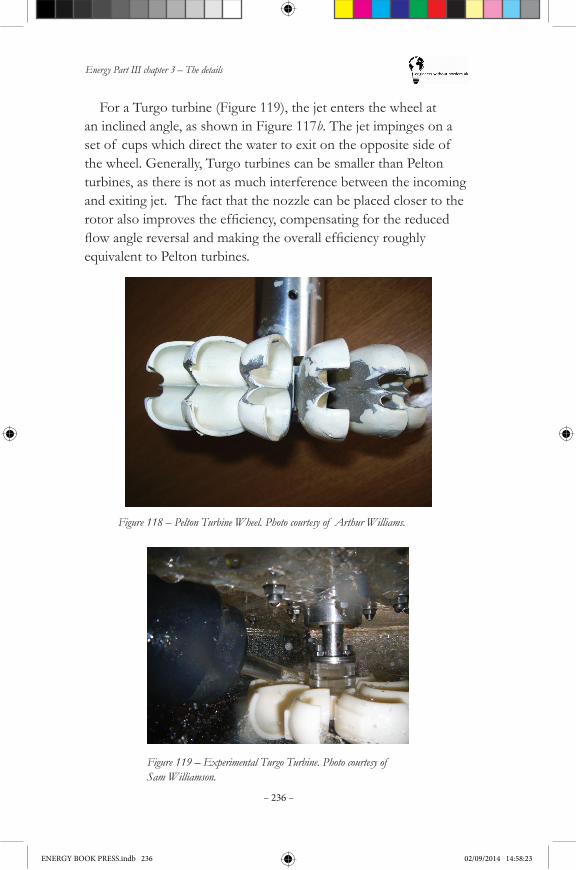
Energy Part III chapter 3 – The details
– 236 –
For a Turgo turbine (Figure 119), the jet enters the wheel at an inclined angle, as shown in Figure 117b. The jet impinges on a set of cups which direct the water to exit on the opposite side of the wheel. Generally, Turgo turbines can be smaller than Pelton turbines, as there is not as much interference between the incoming and exiting jet. The fact that the nozzle can be placed closer to the rotoralsoimprovestheefficiency,compensatingforthereducedflowanglereversalandmakingtheoverallefficiencyroughlyequivalent to Pelton turbines.
Figure 118 – Pelton Turbine Wheel. Photo courtesy of Arthur Williams.
Figure 119 – Experimental Turgo Turbine. Photo courtesy of Sam Williamson.
ENERGY BOOK PRESS.indb 236 02/09/2014 14:58:23
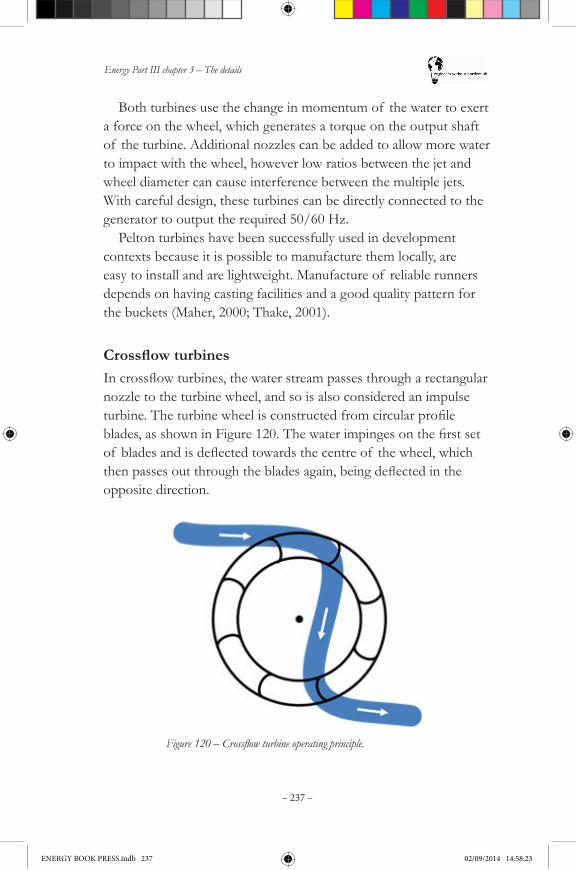
Energy Part III chapter 3 – The details
– 237 –
Both turbines use the change in momentum of the water to exert a force on the wheel, which generates a torque on the output shaft of the turbine. Additional nozzles can be added to allow more water to impact with the wheel, however low ratios between the jet and wheel diameter can cause interference between the multiple jets. With careful design, these turbines can be directly connected to the generator to output the required 50/60 Hz.
Pelton turbines have been successfully used in development contexts because it is possible to manufacture them locally, are easy to install and are lightweight. Manufacture of reliable runners depends on having casting facilities and a good quality pattern for the buckets (Maher, 2000; Thake, 2001).
CrossflowturbinesIncrossflowturbines,thewaterstreampassesthrougharectangularnozzle to the turbine wheel, and so is also considered an impulse turbine.Theturbinewheelisconstructedfromcircularprofileblades,asshowninFigure120.Thewaterimpingesonthefirstsetof bladesandisdeflectedtowardsthecentreof thewheel,whichthenpassesoutthroughthebladesagain,beingdeflectedintheopposite direction.
Figure 120 – Crossflow turbine operating principle.
ENERGY BOOK PRESS.indb 237 02/09/2014 14:58:23
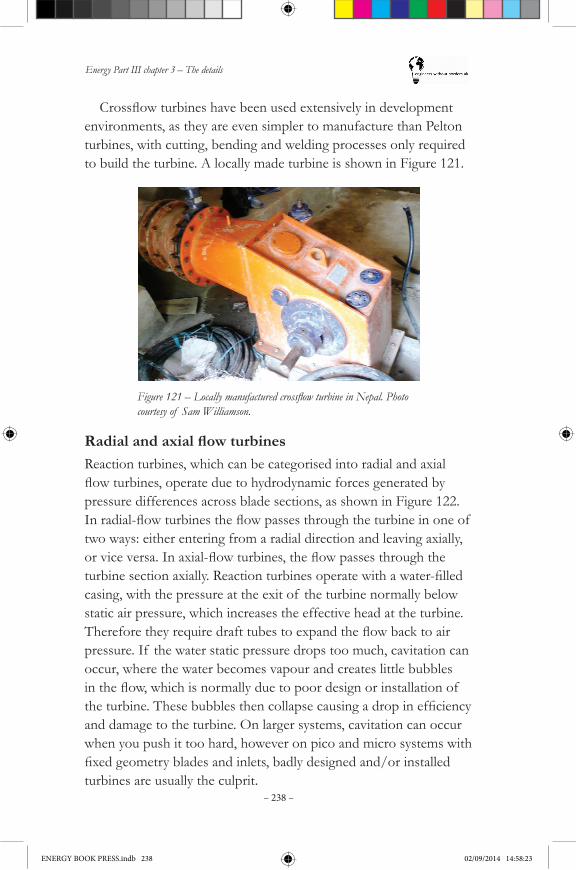
Energy Part III chapter 3 – The details
– 238 –
Crossflowturbineshavebeenusedextensivelyindevelopmentenvironments, as they are even simpler to manufacture than Pelton turbines, with cutting, bending and welding processes only required to build the turbine. A locally made turbine is shown in Figure 121.
Figure 121 – Locally manufactured crossflow turbine in Nepal. Photo courtesy of Sam Williamson.
RadialandaxialflowturbinesReaction turbines, which can be categorised into radial and axial flowturbines,operateduetohydrodynamicforcesgeneratedbypressure differences across blade sections, as shown in Figure 122. Inradial-flowturbinestheflowpassesthroughtheturbineinoneof two ways: either entering from a radial direction and leaving axially, orviceversa.Inaxial-flowturbines,theflowpassesthroughtheturbinesectionaxially.Reactionturbinesoperatewithawater-filledcasing, with the pressure at the exit of the turbine normally below static air pressure, which increases the effective head at the turbine. Thereforetheyrequiredrafttubestoexpandtheflowbacktoairpressure. If the water static pressure drops too much, cavitation can occur, where the water becomes vapour and creates little bubbles intheflow,whichisnormallyduetopoordesignorinstallationof theturbine.Thesebubblesthencollapsecausingadropinefficiencyand damage to the turbine. On larger systems, cavitation can occur when you push it too hard, however on pico and micro systems with fixedgeometrybladesandinlets,badlydesignedand/orinstalledturbines are usually the culprit.
ENERGY BOOK PRESS.indb 238 02/09/2014 14:58:23
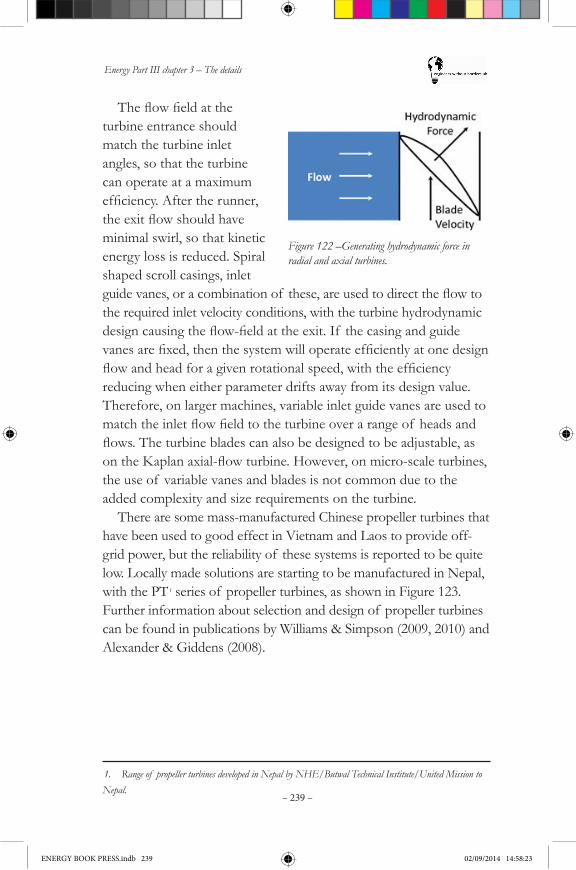
Energy Part III chapter 3 – The details
– 239 –
Figure 122 –Generating hydrodynamic force in radial and axial turbines.
Theflowfieldattheturbine entrance should match the turbine inlet angles, so that the turbine can operate at a maximum efficiency.Aftertherunner,theexitflowshouldhaveminimal swirl, so that kinetic energy loss is reduced. Spiral shaped scroll casings, inlet guidevanes,oracombinationof these,areusedtodirecttheflowtothe required inlet velocity conditions, with the turbine hydrodynamic designcausingtheflow-fieldattheexit.If thecasingandguidevanesarefixed,thenthesystemwilloperateefficientlyatonedesignflowandheadforagivenrotationalspeed,withtheefficiencyreducing when either parameter drifts away from its design value. Therefore, on larger machines, variable inlet guide vanes are used to matchtheinletflowfieldtotheturbineoverarangeof headsandflows.Theturbinebladescanalsobedesignedtobeadjustable,asontheKaplanaxial-flowturbine.However,onmicro-scaleturbines,the use of variable vanes and blades is not common due to the added complexity and size requirements on the turbine.
There are some mass-manufactured Chinese propeller turbines that have been used to good effect in Vietnam and Laos to provide off-grid power, but the reliability of these systems is reported to be quite low. Locally made solutions are starting to be manufactured in Nepal, with the PT 1 series of propeller turbines, as shown in Figure 123. Further information about selection and design of propeller turbines can be found in publications by Williams & Simpson (2009, 2010) and Alexander & Giddens (2008).
1. Range of propeller turbines developed in Nepal by NHE/Butwal Technical Institute/United Mission to Nepal.
ENERGY BOOK PRESS.indb 239 02/09/2014 14:58:23
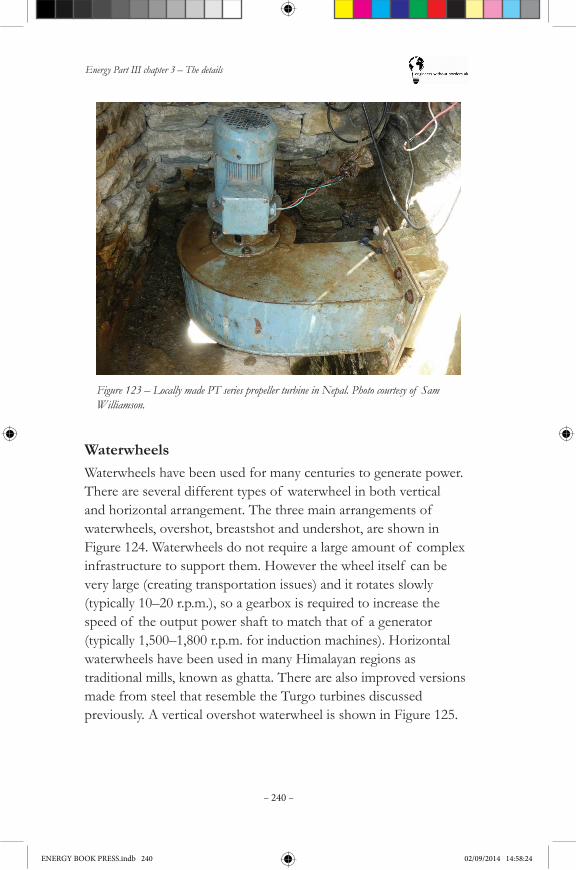
Energy Part III chapter 3 – The details
– 240 –
Figure 123 – Locally made PT series propeller turbine in Nepal. Photo courtesy of Sam Williamson.
WaterwheelsWaterwheels have been used for many centuries to generate power. There are several different types of waterwheel in both vertical and horizontal arrangement. The three main arrangements of waterwheels, overshot, breastshot and undershot, are shown in Figure 124. Waterwheels do not require a large amount of complex infrastructure to support them. However the wheel itself can be very large (creating transportation issues) and it rotates slowly (typically 10–20 r.p.m.), so a gearbox is required to increase the speed of the output power shaft to match that of a generator (typically 1,500–1,800 r.p.m. for induction machines). Horizontal waterwheels have been used in many Himalayan regions as traditional mills, known as ghatta. There are also improved versions made from steel that resemble the Turgo turbines discussed previously. A vertical overshot waterwheel is shown in Figure 125.
ENERGY BOOK PRESS.indb 240 02/09/2014 14:58:24
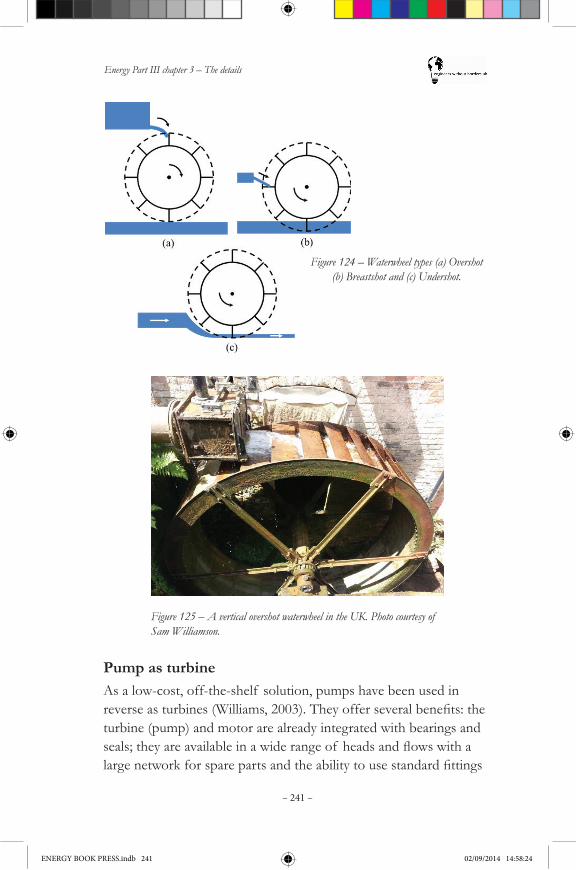
Energy Part III chapter 3 – The details
– 241 –
Figure 124 – Waterwheel types (a) Overshot (b) Breastshot and (c) Undershot.
Figure 125 – A vertical overshot waterwheel in the UK. Photo courtesy of Sam Williamson.
Pump as turbineAs a low-cost, off-the-shelf solution, pumps have been used in reverseasturbines(Williams,2003).Theyofferseveralbenefits:theturbine (pump) and motor are already integrated with bearings and seals;theyareavailableinawiderangeof headsandflowswithalargenetworkforsparepartsandtheabilitytousestandardfittings
ENERGY BOOK PRESS.indb 241 02/09/2014 14:58:24
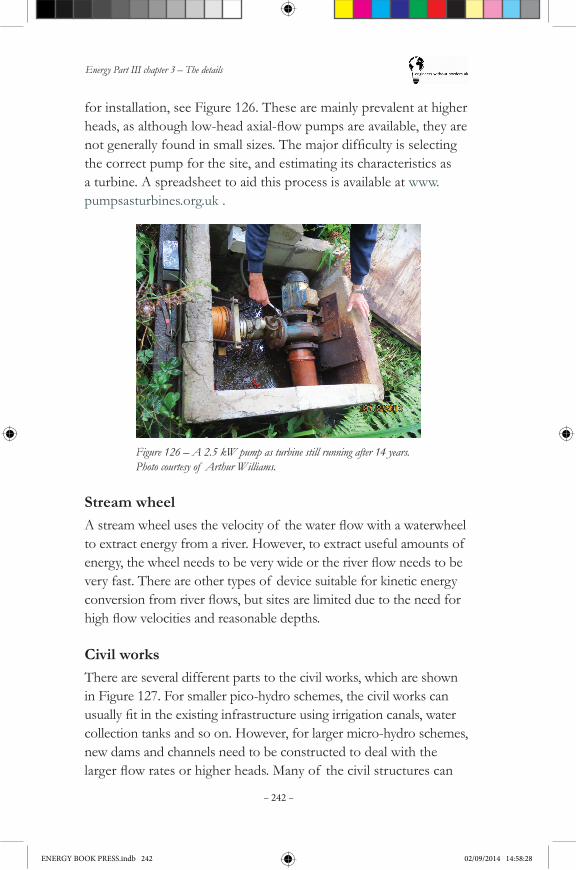
Energy Part III chapter 3 – The details
– 242 –
Figure 126 – A 2.5 kW pump as turbine still running after 14 years. Photo courtesy of Arthur Williams.
for installation, see Figure 126. These are mainly prevalent at higher heads,asalthoughlow-headaxial-flowpumpsareavailable,theyarenotgenerallyfoundinsmallsizes.Themajordifficultyisselectingthe correct pump for the site, and estimating its characteristics as a turbine. A spreadsheet to aid this process is available at www.pumpsasturbines.org.uk .
Stream wheel Astreamwheelusesthevelocityof thewaterflowwithawaterwheelto extract energy from a river. However, to extract useful amounts of energy,thewheelneedstobeverywideortheriverflowneedstobevery fast. There are other types of device suitable for kinetic energy conversionfromriverflows,butsitesarelimitedduetotheneedforhighflowvelocitiesandreasonabledepths.
Civil worksThere are several different parts to the civil works, which are shown in Figure 127. For smaller pico-hydro schemes, the civil works can usuallyfitintheexistinginfrastructureusingirrigationcanals,watercollection tanks and so on. However, for larger micro-hydro schemes, new dams and channels need to be constructed to deal with the largerflowratesorhigherheads.Manyof thecivilstructurescan
ENERGY BOOK PRESS.indb 242 02/09/2014 14:58:28
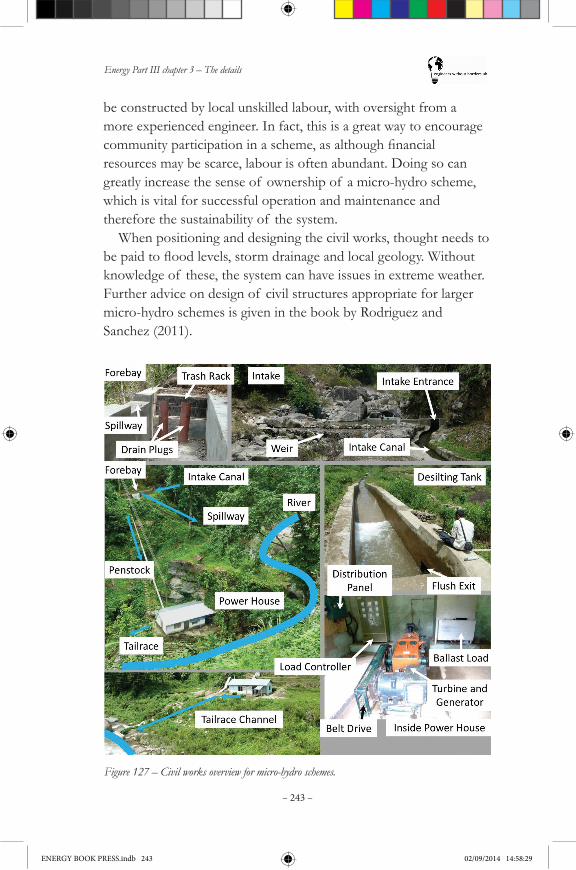
Energy Part III chapter 3 – The details
– 243 –
Figure 127 – Civil works overview for micro-hydro schemes.
be constructed by local unskilled labour, with oversight from a more experienced engineer. In fact, this is a great way to encourage communityparticipationinascheme,asalthoughfinancialresources may be scarce, labour is often abundant. Doing so can greatly increase the sense of ownership of a micro-hydro scheme, which is vital for successful operation and maintenance and therefore the sustainability of the system.
When positioning and designing the civil works, thought needs to bepaidtofloodlevels,stormdrainageandlocalgeology.Withoutknowledge of these, the system can have issues in extreme weather. Further advice on design of civil structures appropriate for larger micro-hydro schemes is given in the book by Rodriguez and Sanchez (2011).
ENERGY BOOK PRESS.indb 243 02/09/2014 14:58:29
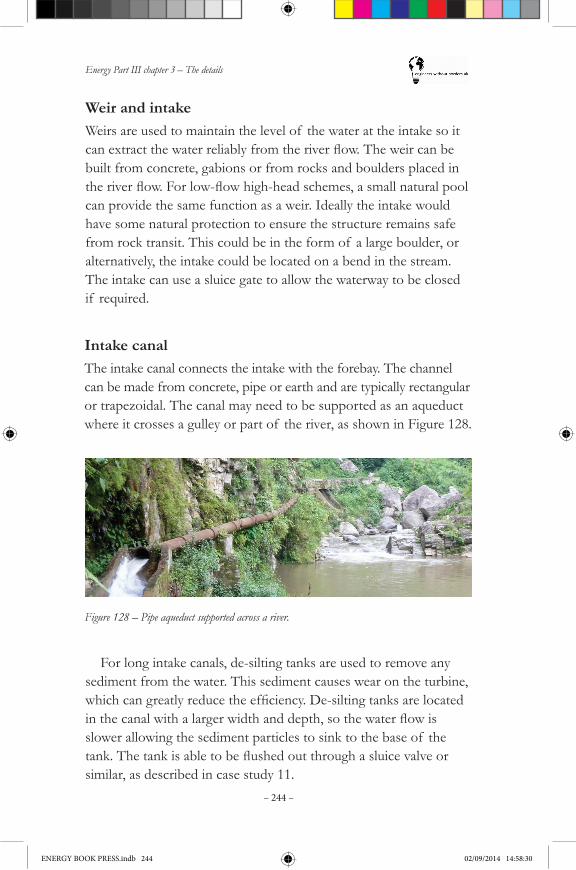
Energy Part III chapter 3 – The details
– 244 –
Weir and intakeWeirs are used to maintain the level of the water at the intake so it canextractthewaterreliablyfromtheriverflow.Theweircanbebuilt from concrete, gabions or from rocks and boulders placed in theriverflow.Forlow-flowhigh-headschemes,asmallnaturalpoolcan provide the same function as a weir. Ideally the intake would have some natural protection to ensure the structure remains safe from rock transit. This could be in the form of a large boulder, or alternatively, the intake could be located on a bend in the stream. The intake can use a sluice gate to allow the waterway to be closed if required.
Intake canalThe intake canal connects the intake with the forebay. The channel can be made from concrete, pipe or earth and are typically rectangular or trapezoidal. The canal may need to be supported as an aqueduct where it crosses a gulley or part of the river, as shown in Figure 128.
Figure 128 – Pipe aqueduct supported across a river.
For long intake canals, de-silting tanks are used to remove any sediment from the water. This sediment causes wear on the turbine, whichcangreatlyreducetheefficiency.De-siltingtanksarelocatedinthecanalwithalargerwidthanddepth,sothewaterflowisslower allowing the sediment particles to sink to the base of the tank.Thetankisabletobeflushedoutthroughasluicevalveorsimilar, as described in case study 11.
ENERGY BOOK PRESS.indb 244 02/09/2014 14:58:30
Energy Part III chapter 3 – The details
– 245 –
Case study 11: Rural electrification through micro-hydropower: dealing with siltation
Andrew Carr, Malaysian Borneo, 2011
TONIBUNGisanon-profitcommunity-basedorganisationwhich aims to reduce poverty in rural indigenous communities. TONIBUNG’sfocusisruralelectrification(RE)throughmicro-hydropower (MHP) schemes, typically ranging from 1–10 kW. Two EWB volunteers were placed with TONIBUNG in 2011 to undertake feasibility work, funding applications, design work, and inspection and maintenance work.
MHP can offer a constant, reliable, and cost effective supply of renewable energy. However, with TONIBUNG’s schemes, there were certain technical issues that reduced reliability and cost effectiveness. One of these issues was siltation of the system; causing blockage at the intake and damage to the turbine.
Good intake design and construction can stop silt entering the system. For example, the Coanda screen – a self-cleaning intake screen – traps silt sized debris (1 mm), and requires little maintenance. Implementing this was explored, but found to be unfeasible, as they are expensive (expected to increase system costs by around a third), not widely available, and cannot be fabricated easily due to the precise geometry crucial to their successful function.
An effective and appropriate solution was a series of gabions (essentiallyarock-filledcage–seecasestudyphotograph)forminga coarse weir, placed upstream of the intake. This creates an upstream pool of water, allowing mobile sediment to settle. The permeabilityof thegabionsisnotanissue,astheflowvelocityis still adequately reduced. Note gabions will not remove all silt – therefore secondary screening is also required downstream of the intake, using a forebay tank for example.
Gabions are more appropriate than concrete here, as they are simpleandcheaptoconstruct,usinglocallyavailablerockfill.The steel wire mesh that forms the cage must be obtained from a supplier, but is cheap, widely available, and easily transported.
ENERGY BOOK PRESS.indb 245 02/09/2014 14:58:31
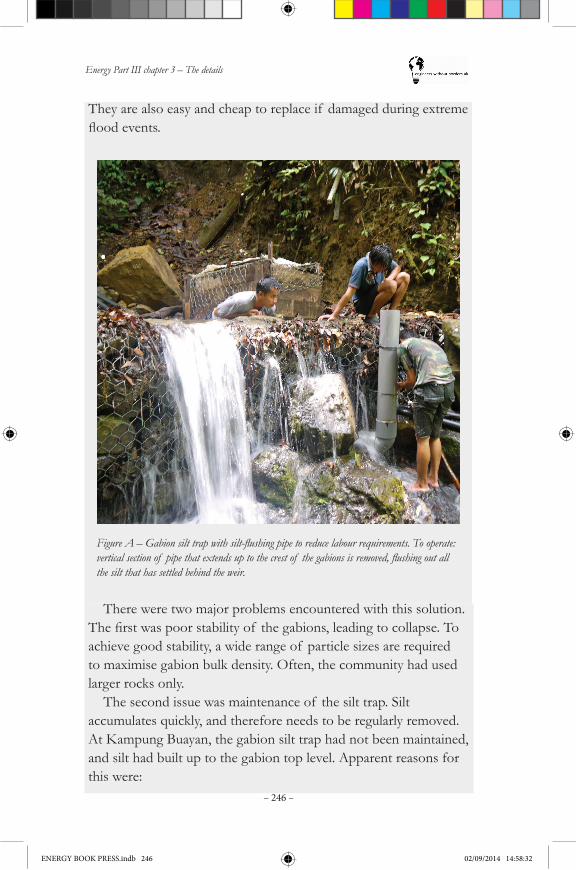
Energy Part III chapter 3 – The details
– 246 –
They are also easy and cheap to replace if damaged during extreme floodevents.
There were two major problems encountered with this solution. Thefirstwaspoorstabilityof thegabions,leadingtocollapse.Toachieve good stability, a wide range of particle sizes are required to maximise gabion bulk density. Often, the community had used larger rocks only.
The second issue was maintenance of the silt trap. Silt accumulates quickly, and therefore needs to be regularly removed. At Kampung Buayan, the gabion silt trap had not been maintained, and silt had built up to the gabion top level. Apparent reasons for this were:
Figure A – Gabion silt trap with silt-flushing pipe to reduce labour requirements. To operate: vertical section of pipe that extends up to the crest of the gabions is removed, flushing out all the silt that has settled behind the weir.
ENERGY BOOK PRESS.indb 246 02/09/2014 14:58:32
Energy Part III chapter 3 – The details
– 247 –
•Nowhere to dispose the excavated silt, with steep riverbanks either side of the stream.
•Difficultanddangerousaccesstotheintake;beingalmost2kmup the stream gorge, along a path rarely walked.
•The perception in the community that it wasn’t necessary; a long period of no maintenance hadn’t resulted in disruption to the electricity supply.
These issues can be avoided in future by appropriate education, and improved maintenance planning. For example, TONIBUNG’s more recent gabion silt trap shown in the photo incorporated a silt-flushingpipetoreducelabourrequirements.Thedownstreamintake structure had also been designed so that the operator would beabletotemporarilyclosetheintaketostopsiltflowingdirectlyinto the intake.
About the author: Andrew spent 4 months in Malaysian Borneo on an EWB-UK placement with TONIBUNG, carrying out feasibility studies for potential micro-hydro schemes across Malaysia.Whilstonplacement,hegainedfirst-handexperienceinthe design, construction and impacts of micro-hydro in remote indigenous communities.
About the organisation: TONIBUNG was formed in 1993 as a non-profit,community-basedorganisationbasedinPenampang,Sabah.Theirmainfocusisruralelectrification(RE)throughmicro-hydro and solar energy, but they have also been involved in rural computer centres, resource management planning, community mapping with GPS and GIS, and micro-enterprises.
ENERGY BOOK PRESS.indb 247 02/09/2014 14:58:32
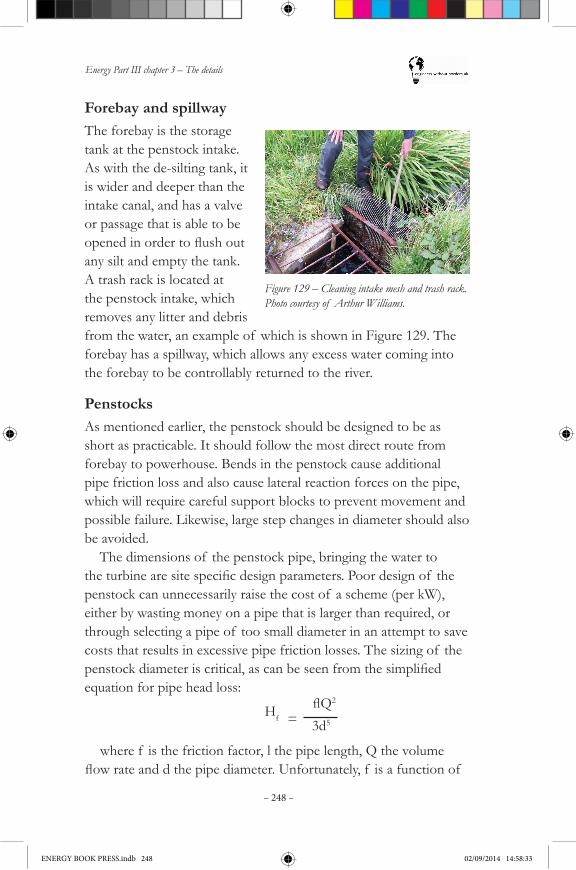
Energy Part III chapter 3 – The details
– 248 –
Forebay and spillwayThe forebay is the storage tank at the penstock intake. As with the de-silting tank, it is wider and deeper than the intake canal, and has a valve or passage that is able to be openedinordertoflushoutany silt and empty the tank. A trash rack is located at the penstock intake, which removes any litter and debris from the water, an example of which is shown in Figure 129. The forebay has a spillway, which allows any excess water coming into the forebay to be controllably returned to the river.
Figure 129 – Cleaning intake mesh and trash rack. Photo courtesy of Arthur Williams.
PenstocksAs mentioned earlier, the penstock should be designed to be as short as practicable. It should follow the most direct route from forebay to powerhouse. Bends in the penstock cause additional pipe friction loss and also cause lateral reaction forces on the pipe, which will require careful support blocks to prevent movement and possible failure. Likewise, large step changes in diameter should also be avoided.
The dimensions of the penstock pipe, bringing the water to theturbinearesitespecificdesignparameters.Poordesignof thepenstock can unnecessarily raise the cost of a scheme (per kW), either by wasting money on a pipe that is larger than required, or through selecting a pipe of too small diameter in an attempt to save costs that results in excessive pipe friction losses. The sizing of the penstockdiameteriscritical,ascanbeseenfromthesimplifiedequation for pipe head loss:
Hf =flQ2
3d5
where f is the friction factor, l the pipe length, Q the volume flowrateanddthepipediameter.Unfortunately, f is a function of
ENERGY BOOK PRESS.indb 248 02/09/2014 14:58:33

Energy Part III chapter 3 – The details
– 249 –
flowvelocityandpipewallroughness,sothisequationcanonlybesolved by iteration. It is usually found using the Moody diagram. Other equations such as Hazen-Williams or Colebrook-White may be used directly.
The choice of penstock pipe material and wall thickness will depend on the site head, because at the lower end of a medium or highheadschemethepressurecanbesignificant.Thepipeneedsto be of the correct pressure rating, which is normally based on the static pressure, e.g. for a 60 m gross head, the pressure at the lower end of the pipe is
p = ρgH = 1000 x 9.8 x 60 = 5.9 x 10⁵ MPa = 5.9 bar.
The nearest pressure rating is 6 bar, which includes a safety factor that takes account of typical transient pressures. Consider as well whetheraflexiblepipematerialwithfewerjoints(suchasHDPE)will be easier to install.
Some text books include an analysis of pipe losses which shows that the optimum power output from a given diameter of pipe occurs when the head loss is one third of the gross head. However, this criterion is not suitable for selecting pipe sizes for hydro schemes, as it results in the pipe loss being too large. The additional cost of a larger diameter pipe is worthwhile as this is only a small part of the total scheme cost and results in improved power output. For a typical scheme layout, the recommended pipe head loss is between 5% and 10% of gross head (Williams & Simpson, 2008).Sincepipesareavailableinfixeddiameters,itissometimescost-effective to use a larger diameter pipe for the section nearer to the intake, where a lower pressure rating can be employed. This increases the net turbine head at minimal extra cost.
Powerhouse and tailraceThe powerhouse accommodates the turbine, generator, load controller, ballast load and distribution panel. A drain underneath the turbine allows the water discharged to exit through the tailrace and re-enter the river. The powerhouse should be located above the floodinglevelandnottooclosetotheriver,withanywaterrun-off ideally directed away through gullies and landscaping the ground
ENERGY BOOK PRESS.indb 249 02/09/2014 14:58:33
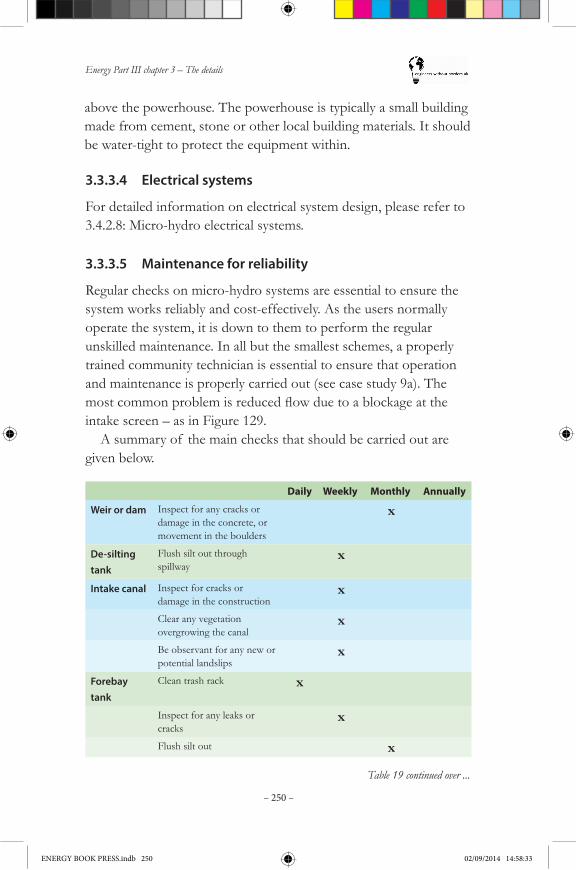
Energy Part III chapter 3 – The details
– 250 –
above the powerhouse. The powerhouse is typically a small building made from cement, stone or other local building materials. It should be water-tight to protect the equipment within.
3.3.3.4 Electrical systems
For detailed information on electrical system design, please refer to 3.4.2.8: Micro-hydro electrical systems.
3.3.3.5 Maintenance for reliability
Regular checks on micro-hydro systems are essential to ensure the system works reliably and cost-effectively. As the users normally operate the system, it is down to them to perform the regular unskilled maintenance. In all but the smallest schemes, a properly trained community technician is essential to ensure that operation and maintenance is properly carried out (see case study 9a). The mostcommonproblemisreducedflowduetoablockageattheintake screen – as in Figure 129.
A summary of the main checks that should be carried out are given below.
Daily Weekly Monthly Annually
Weir or dam Inspect for any cracks or damage in the concrete, or movement in the boulders
x
De-silting tank
Flush silt out through spillway
x
Intake canal Inspect for cracks or damage in the construction
x
Clear any vegetation overgrowing the canal
x
Be observant for any new or potential landslips
x
Forebay tank
Clean trash rack x
Inspect for any leaks or cracks
x
Flush silt out x
Table 19 continued over ...
ENERGY BOOK PRESS.indb 250 02/09/2014 14:58:33
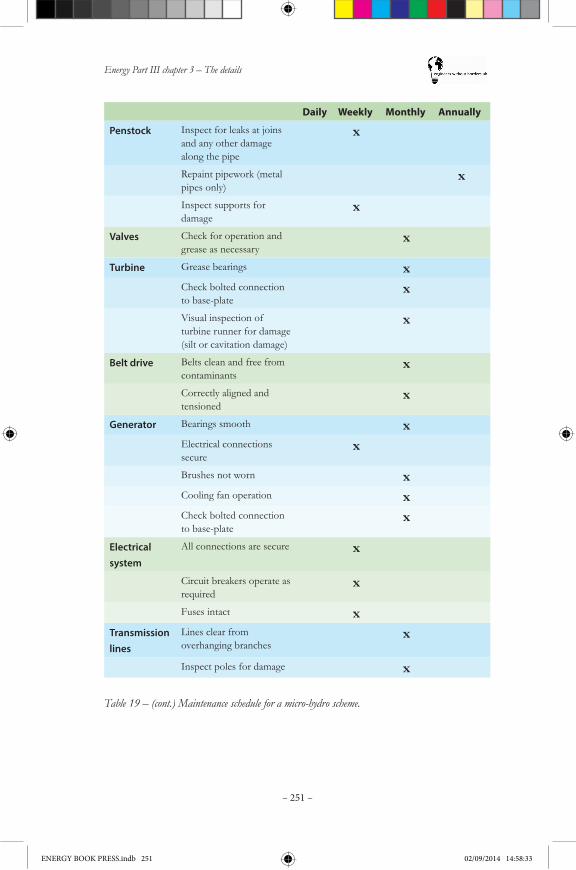
Energy Part III chapter 3 – The details
– 251 –
Daily Weekly Monthly Annually
Penstock Inspect for leaks at joins and any other damage along the pipe
x
Repaint pipework (metal pipes only)
x
Inspect supports for damage
x
Valves Check for operation and grease as necessary
x
Turbine Grease bearings xCheck bolted connection to base-plate
x
Visual inspection of turbine runner for damage (silt or cavitation damage)
x
Belt drive Belts clean and free from contaminants
x
Correctly aligned and tensioned
x
Generator Bearings smooth xElectrical connections secure
x
Brushes not worn xCooling fan operation xCheck bolted connection to base-plate
x
Electrical system
All connections are secure x
Circuit breakers operate as required
x
Fuses intact xTransmission lines
Lines clear from overhanging branches
x
Inspect poles for damage x
Table 19 – (cont.) Maintenance schedule for a micro-hydro scheme.
ENERGY BOOK PRESS.indb 251 02/09/2014 14:58:33

Energy Part III chapter 3 – The details
– 252 –
3.3.3.6 More information
Although this section has given more detailed information on pico- and micro-hydropower, the reader should refer to the additional information contained in chapter 4, Further reading, and consult both an expert and a local champion before implementing any potential solutions.
3.3.4 Improved cookstoves – the details
3.3.4.1 Measuring performance
Cookstoveefficiencyprovidesameasureof theheatoutputof asystemperunitfuelinput.Althoughefficiencieshavebeentestedforsomemajorstovedesigns,itremainsdifficulttofindaccuratedata on a vast majority of ICS. A major problem with measuring stoveefficienciesinanon-labconditionisthelackof controlledthermodynamicenvironmentandtheuncertaintyinthecalorificcontent of various fuel sources. It is often more realistic to use relative performance tests which compare the amount of time and fuelneededfordifferentstovestoachievethesamespecifictasks.Somestandardwaysof measuringperformanceinthefieldareoutlined below, with links to full methodological descriptions:
•The international standard water-boiling test may be used to provideanabsolutemeasureof theefficiency.Thisisquitecomplex and requires a controlled environment – it is unlikely one would be able to perform this test in situ. A complete description of the test can be found here: http://www.aprovecho.org/lab/component/rubberdoc/doc/231/raw.
•An adapted comparative water boiling test can be used to compare theefficienciesbetweendifferenttypesof stoves.Thebasicprincipleistofindhowmuchfuelisneededtobringapotof watertotheboil and how long a simmering temperature can be sustained with a given mass of fuel. If compared to a reference standard (a stove forwhichtheefficiencyisknown)thisshouldgiveanestimatefortheabsoluteefficiencyof theICS.Thefulldetailsof thetestforeither wood or charcoal can be found in the HEDON toolkits: http://www.hedon.info/ComparativeWaterBoilingTest.
ENERGY BOOK PRESS.indb 252 02/09/2014 14:58:33
Energy Part III chapter 3 – The details
– 253 –
•The controlled cooking test is very similar to the comparative water boiling test but is more adapted to real-life usage of the cookstove: instead of boiling water the monitored process is that of the end-user using the stove to cook a standard meal. The advantage of this test is that it reproduces a real-life situation andisthereforeaneffectiveefficiencymeasure.Fulldetailscanbe found here: http://www.aprovecho.org/lab/component/rubberdoc/doc/231/raw.
Summarised versions of the water-boiling test and the controlled cooking test as well as excel data calculation spreadsheets can be found on the Approchevo website here: http://www.aprovecho.org/lab/pubs/testing.
It is essential that any stoves built are rigorously tested by EWB-UK volunteers, and the data could be reported to the databases mentionedintheintroductiontothissection,helpingfillimportantdata gaps. Ideally, stoves should also be tested for safety, including the use of monitoring devices (e.g. the UCB particle monitor) to monitor particulate matter and ambient carbon monoxide levels. Without such tests, it is not possible to determine whether or not these stoves are safe to use in households.
3.3.4.2 Implementation and final considerations
Many ICS programmes are being implemented across the world in low-income areas, as they can be a relatively simple yet effective solution to the problems of deforestation, smoke inhalation and the drudgery involved in fuel collection faced by almost half the world’s population. As a result there is a lot of political will to foster such programmes.A major potential of ICS programmes is to build capacity within communities, for example working with women’s groups to set up a social enterprise to build and sell cookstoves. This creates business opportunities which can provide positive feedback within the energy access challenge (see Figure 3 in the introduction to this chapter). Although initial purchase costs are relatively low, they are still too high for many people stuck in the poverty trap and micro-financeloansareoftenneededtoovercomethisbarrier.Thereisan
ENERGY BOOK PRESS.indb 253 02/09/2014 14:58:33

Energy Part III chapter 3 – The details
– 254 –
increasing amount of interest in using carbon markets to provide financingforsuchinitiatives(GIZ,2011),ascookstovesprovideafast way to reduce greenhouse gas emissions and deforestation. Case studies 12 and 13 provide some insight on the opportunities and pitfalls of implementing cookstove programmes.
Another important factor to consider is that cooking is part of everyday life and culture, with deeply-rooted traditions. Many stoves or cooking methods will be found unsuitable by an end-user; case study 2 gives an example where a family would not use a smokeless stove because the smoke from traditional cooking methods was perceivedtokeepthefliesaway.Similarly,Figure130(left) shows a household in a damp and cold area of the Philippines where termites and insects degrade the wooden structure of houses if left unchallenged. Smoke from traditional cooking methods can prevent such problems. This highlights the importance of end-user involvement throughout the design process, and also requires effectiveandtransparentcommunicationonthebenefitsanddrawbacks of the technology from both parties, as well as clear instructions on how to use it.
Figure 130 – (left) A household in Ag Agama (Luzon island, Philippines) where smoke generated from a 3-stone fire keeps structural wood-degrading termites and insects away. Note in the background how the woodfuel is being kept dry by placing it on racks above the fire. Photo credit: Matt Little. (right) Cooking outside, if appropriate, is a simple way to reduce smoke inhalation in constrained places. Photo courtesy of EWB-UK.
ENERGY BOOK PRESS.indb 254 02/09/2014 14:58:34

Energy Part III chapter 3 – The details
– 255 –
Thereareotherwaystoimprovecookingefficienciesandreduceharmful indoor emissions, but again these are sometimes culturally unsuitable or not readily adopted. Examples include (Practical Action, 2010):
•Cooking outdoors (Figure 130 right).
•Spending as little time as possible near the stove or in the room while cooking, and keep children away as much as possible.
•Preparing food before cooking, such as cutting food into smaller pieces, grinding dried pulses or pre-soaking beans.
•Using a pot lid.
ENERGY BOOK PRESS.indb 255 02/09/2014 14:58:34
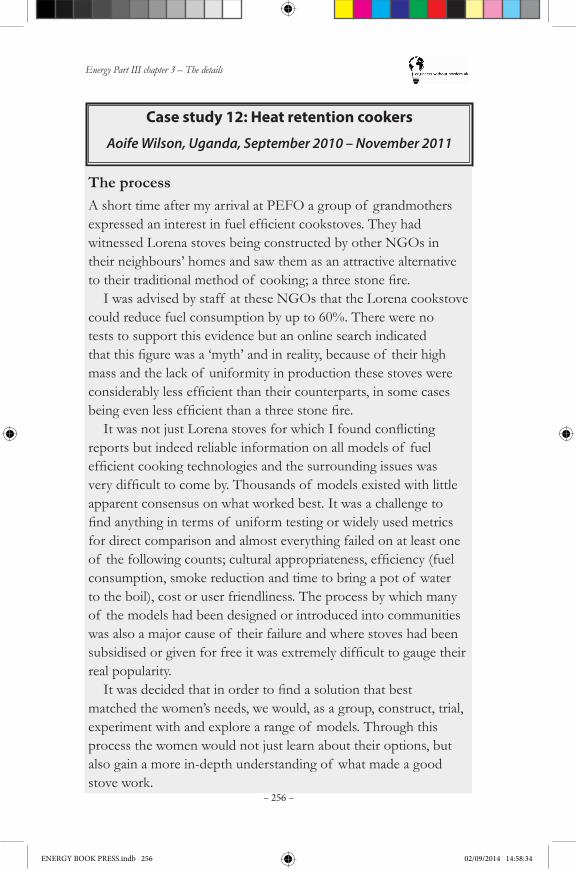
Energy Part III chapter 3 – The details
– 256 –
Case study 12: Heat retention cookers
Aoife Wilson, Uganda, September 2010 – November 2011
The processA short time after my arrival at PEFO a group of grandmothers expressedaninterestinfuelefficientcookstoves.Theyhadwitnessed Lorena stoves being constructed by other NGOs in their neighbours’ homes and saw them as an attractive alternative totheirtraditionalmethodof cooking;athreestonefire.
I was advised by staff at these NGOs that the Lorena cookstove could reduce fuel consumption by up to 60%. There were no tests to support this evidence but an online search indicated thatthisfigurewasa‘myth’andinreality,becauseof theirhighmass and the lack of uniformity in production these stoves were considerablylessefficientthantheircounterparts,insomecasesbeingevenlessefficientthanathreestonefire.ItwasnotjustLorenastovesforwhichIfoundconflicting
reports but indeed reliable information on all models of fuel efficientcookingtechnologiesandthesurroundingissueswasverydifficulttocomeby.Thousandsof modelsexistedwithlittleapparent consensus on what worked best. It was a challenge to findanythingintermsof uniformtestingorwidelyusedmetricsfor direct comparison and almost everything failed on at least one of thefollowingcounts;culturalappropriateness,efficiency(fuelconsumption, smoke reduction and time to bring a pot of water to the boil), cost or user friendliness. The process by which many of the models had been designed or introduced into communities was also a major cause of their failure and where stoves had been subsidisedorgivenforfreeitwasextremelydifficulttogaugetheirreal popularity.Itwasdecidedthatinordertofindasolutionthatbest
matched the women’s needs, we would, as a group, construct, trial, experiment with and explore a range of models. Through this process the women would not just learn about their options, but also gain a more in-depth understanding of what made a good stove work.
ENERGY BOOK PRESS.indb 256 02/09/2014 14:58:34
Energy Part III chapter 3 – The details
– 257 –
•Togetherwefirstbuiltaonepotmudstoveusingamanualfrom the Ugandan Ministry of Energy and the Environment (in partnership with GTZ) which I found online. The materials were all available nearby for free (https://energypedia.info/images/9/93/GTZ-HOUSEHOLD_Stoves_Construction_Manual_June_2008.pdf).
•We then built a Lorena stove under the guidance of a local lady who had learned how to build them from another NGO. This way the women could prove themselves that the stove was less efficientandexplorethereasonswhy.
•We learned how to build 6-brick rocket stoves (both a portable and in situ) from a man who had built these for an NGO in Northern Uganda. Unfortunately given the quantity of people involved and our inexperience, the end results were a little misshapen. The women preferred the portable model but this required the additional purchase of a used paint tin in which to house the cooker.
•We borrowed an Okelo Kuc stove and large solar cooker for examination and trial. Both of these models were outside the women’s budgets however, and there were additional concerns regarding the solar cooker.
Each model was tested using a selection of tests from the Aprovecho Research Centre (http://www.aprovecho.org/lab/pubs/testing).
Before, during and after each of these sessions we also discussed many of the surrounding issues, both technical and non-technical. I did some basic experiments with the women to demonstrate principals of thermodynamics such as insulators V conductors and they taught me a lot about the properties of local materials amongst other things. During the reviews, the women were often more interested in the social issues relating to the cookers over the technical. For example, the women decided to put a plinth beneath the one pot mud stove as they said that being able to sit on a stove was a sign of the changing times and would afford them more respect.
ENERGY BOOK PRESS.indb 257 02/09/2014 14:58:34

Energy Part III chapter 3 – The details
– 258 –
Thefinalproductwetriedwasaheatretentioncooker.Technicallythisisabeautifullyefficientconceptbutitdoesrequiresome changes in the behaviour of the cook. This was however selected by the women as their favourite solution and they agreed it would be appropriate to develop a business around it.Ourfirstattemptatsellingthecookerswentverybadly.We
eventually gave some out in exchange for feedback and discovered the customers’ primary complaints were that the cookers were ‘shabby’.
After multiple design irritations, using every combination of insulation and container available (dried, plaited banana leaves, rice husks, coffee husks, feathers, shredded dried banana leaves, cardboard boxes, recycled cloth, baskets galore) I was introduced toanEnglishladywhohadcomeupwithaveryfinishedlookingproduct that could be produced using cloth from the town and offcuts from a mattress factory as insulation. The women were very keen on this model and learned how to construct it quickly, soon after raising money to produceafirstbatch.
PEFO provided business training and continued to support the women as their small business grew for a few months after my departure; loaning sewing machines, providing them with space in a shop in town etc. Today the women run the business themselves and sell the products locally.
Figure A – Heat retention cookers, using offcuts from a mattress factory for insulation and cloth to have an aesthetically pleasing final product.
Lessons learned
1. If I were to do this again, I would spend considerably more timeatthebeginninggettingtoknowthekeyplayersinthisfield– not just in the district, but in the whole country, particularly thecapital.ItwasonlyinmyfinalfewweeksthatIdiscoveredthe Centre for Research in Energy and Energy Conservation
ENERGY BOOK PRESS.indb 258 02/09/2014 14:58:34

Energy Part III chapter 3 – The details
– 259 –
(CREEC) which houses a fully equipped, internationally recognised stove testing centre (creec.or.ug). There are a number of other successful groups and businesses who are doing fantastic work in the design, production and sales of fuel efficientcookstoves,howevertheyrarelyseemtointeract.
2. Ivastlyunderminedthesignificanceof aproduct’saestheticsatfirst.Itwasonlywhenourcookersfailedtosell(andthegrandmothers got in debt as a result) that I was made painfully awareof itsimportance.Ourfinalproduct,despitebeingmoreexpensive, was considerably more popular because it was an attractivefinishedproduct,notathirdworldsolution.
3. Iequallysignificantlyunderestimatedthecomplicationsinvolved in setting up and running a small local business. The vast majority of issues in this area, however, were to do with relationships within the group. In hindsight I would dedicate a lot more time to business training and planning.
4. As an engineering graduate my interest and as such my focus was largely on design and construction for the vast majority of my stay. My time may have been more wisely spent looking at the bigger picture and considering how a market could have been built for an existing product – taking advantage of others’ expertise and economies of scale, and letting the women focus onsellingtheproductandmanagingthefinances.
5. Fuel consumption can be considerably reduced by just using a pot lid, cutting food into smaller pieces or pre-soaking beans.
Project blog http://lemonadesoldiers.wordpress.com/Photos: http://on.fb.me/166YG3G
About the author: Aoife Wilson had recently graduated from Trinity College Dublin with a degree in Civil, Structural and Environmental Engineering when she travelled to Uganda in 2010. Since returning to Ireland she has become very involved in growing EWB here.
ENERGY BOOK PRESS.indb 259 02/09/2014 14:58:34

Energy Part III chapter 3 – The details
– 260 –
About the organisation: PEFO Uganda is a grassroots NGO who work with grandmothers and HIV positive women who have become the primary caregivers of vulnerable children. PEFO work with them in a number of programme areas, including health, education,livelihoods,microfinanceandaffordablehousing.Thegrandmothers and HIV positive caregivers meet once a week in regional groups. Group meetings are led by the women themselves. The staff, who are all Ugandan, interact with the women during their weekly community meetings, in their homes and at the PEFO Farm School.The Foundation for Sustainable Development: EWB Ireland did not have an overseas programme in 2010, so I arranged my placement through the Foundation for Sustainable Development.FSD is an American organisation who recruit, train and place volunteers with grassroots organisations and local families. MyfirstweekwasspentwithFSD’sin-countryteam,receiving
training in cultural integration, concepts and best practice in thefieldof sustainabledevelopment,locallanguage,projectplanning etc. Following this, I moved in with my host family and commenced work with PEFO.
FSD require that their volunteers do not develop a project proposal until they have spent some time with their host organisation. So, it was only after some weeks getting to know the organisation, the grandmothers, the scope of their work together and the surrounding issues that I submitted a budget and detailed project plan to FSD. Once this had been reviewed and approved, I received a $200 stipend for the project. Additionally I submitted weekly progress reports to the in-country FSD team. I was awarded an $800 grant further on in the project.
I extended my stay following my placement with FSD and continued to work with PEFO as a member of their staff.
ENERGY BOOK PRESS.indb 260 02/09/2014 14:58:34
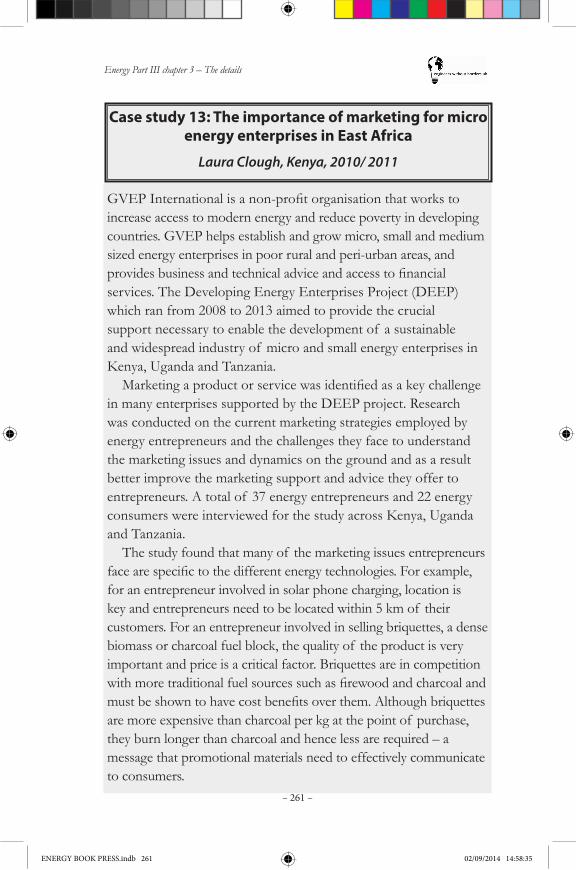
Energy Part III chapter 3 – The details
– 261 –
Case study 13: The importance of marketing for micro energy enterprises in East Africa
Laura Clough, Kenya, 2010/ 2011
GVEPInternationalisanon-profitorganisationthatworkstoincrease access to modern energy and reduce poverty in developing countries. GVEP helps establish and grow micro, small and medium sized energy enterprises in poor rural and peri-urban areas, and providesbusinessandtechnicaladviceandaccesstofinancialservices. The Developing Energy Enterprises Project (DEEP) which ran from 2008 to 2013 aimed to provide the crucial support necessary to enable the development of a sustainable and widespread industry of micro and small energy enterprises in Kenya, Uganda and Tanzania.Marketingaproductorservicewasidentifiedasakeychallenge
in many enterprises supported by the DEEP project. Research was conducted on the current marketing strategies employed by energy entrepreneurs and the challenges they face to understand the marketing issues and dynamics on the ground and as a result better improve the marketing support and advice they offer to entrepreneurs. A total of 37 energy entrepreneurs and 22 energy consumers were interviewed for the study across Kenya, Uganda and Tanzania.
The study found that many of the marketing issues entrepreneurs facearespecifictothedifferentenergytechnologies.Forexample,for an entrepreneur involved in solar phone charging, location is key and entrepreneurs need to be located within 5 km of their customers. For an entrepreneur involved in selling briquettes, a dense biomass or charcoal fuel block, the quality of the product is very important and price is a critical factor. Briquettes are in competition withmoretraditionalfuelsourcessuchasfirewoodandcharcoalandmustbeshowntohavecostbenefitsoverthem.Althoughbriquettesare more expensive than charcoal per kg at the point of purchase, they burn longer than charcoal and hence less are required – a message that promotional materials need to effectively communicate to consumers.
ENERGY BOOK PRESS.indb 261 02/09/2014 14:58:35

Energy Part III chapter 3 – The details
– 262 –
The results from the studyhelpedinfluencethesupport that GVEP offered to entrepreneurs through the DEEP program. Market Development Activities were given an integral role in the program in which entrepreneurs and other stakeholders are invited to a local marketplace to engage in promotional activities and sell products. These events not only allow entrepreneurs to increase their sales for that month but also provide useful linkages with new customers, many of whom make orders after the event. The entrepreneurs take increasing responsibility in successive marketing events to encourage them to eventually engage in the marketing without assistance.
Figure A – Entrepreneurs engaging in promotional activities at a market development event organised by the DEEP program.
It is important to note that even simple marketing techniques such as signboards, posters and simple branding can have a significanteffect.Thestudyshowedthatwordof mouthwasacommon marketing technique used and entrepreneurs can utilise social networks for marketing such as women’s groups, church groups or community meetings. The price and availability of aproductarealsofactorsthatstronglyinfluenceconsumerspurchasing choices.
We conducted work with SCODE, an improved cookstove retailer in Nakuru, Kenya to encourage the use of branding for their products. A series of labels, stickers and stencils were provided enabling SCODE to paint their logo onto multiple stoves and experiment with different colours and designs. Initial results showed that the branded SCODE stoves sold quickly and at a premium price of 1000 KES compared to 720 KES for the non-branded model. Customers were also prepared to wait for the next batch of branded stoves rather than take a non-branded version.
ENERGY BOOK PRESS.indb 262 02/09/2014 14:58:35

Energy Part III chapter 3 – The details
– 263 –
Further information about the study and the DEEP program can be found at:•http://www.gvepinternational.org/sites/default/files/marketing_report_final_2_1_final_for_web.pdf
•http://www.hedon.info/View+Article&itemId=12683.
About the author: Laura Clough completed an EWB-UK placement in 2010 with GVEP International and has since taken on a permanent role with the organisation. She has now worked with GVEP for 3 years based in Kenya providing technical support and more recently leading GVEP’s technical activities for biomass related businesses including those making improved cookstove and biomass briquettes. Laura graduated from the University of Birmingham with a Master’s degree in Mathematical Engineering.
About the organisation: GVEP International (Global Village Energy Partnership) reduces poverty by increasing access to affordable modern energy services in developing countries, where state or large utilities’ interventions are slow to reach. We help establish and grow micro, small and medium size energy enterprises so that they can deliver sustainable access to clean energy, and in turn improve quality of life for people in developing countries. Our work towards delivering improved access to clean andsustainableenergyhasapositiveimpactinthefieldsof health,agriculture, small businesses, households and education.
Figure B – Experiments branding energy efficient stoves and using stickers and logos as a form of marketing.
ENERGY BOOK PRESS.indb 263 02/09/2014 14:58:35
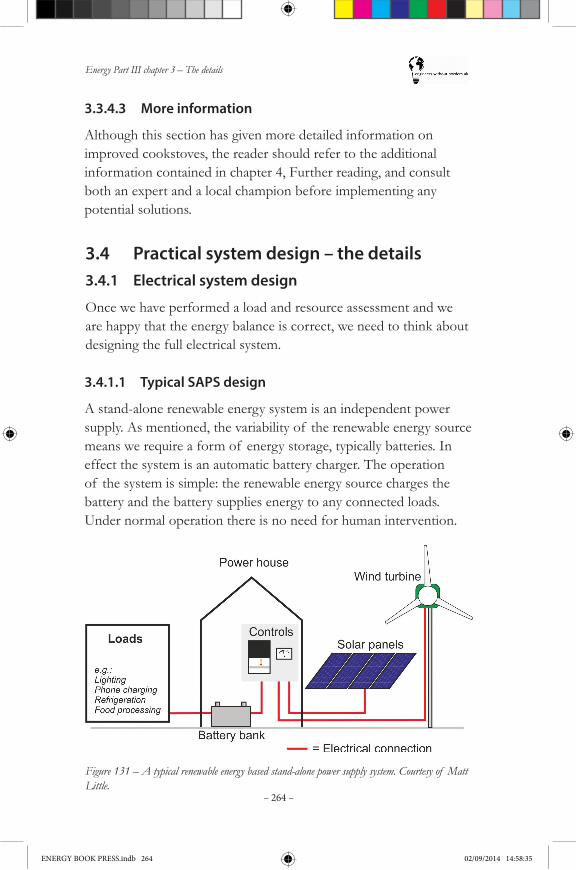
Energy Part III chapter 3 – The details
– 264 –
3.3.4.3 More information
Although this section has given more detailed information on improved cookstoves, the reader should refer to the additional information contained in chapter 4, Further reading, and consult both an expert and a local champion before implementing any potential solutions.
3.4 Practical system design – the details3.4.1 Electrical system design
Once we have performed a load and resource assessment and we are happy that the energy balance is correct, we need to think about designing the full electrical system.
3.4.1.1 Typical SAPS design
A stand-alone renewable energy system is an independent power supply. As mentioned, the variability of the renewable energy source means we require a form of energy storage, typically batteries. In effect the system is an automatic battery charger. The operation of the system is simple: the renewable energy source charges the battery and the battery supplies energy to any connected loads. Under normal operation there is no need for human intervention.
Figure 131 – A typical renewable energy based stand-alone power supply system. Courtesy of Matt Little.
ENERGY BOOK PRESS.indb 264 02/09/2014 14:58:35
Energy Part III chapter 3 – The details
– 265 –
There are four primary elements to a typical product or system:•Renewable energy generator(s)
•A charge controller – this protects the battery and loads
•A battery (or battery bank) – to buffer the variability of the renewable energy source
•Load equipment (appliances).
The battery is the most important component of the system and hasthegreatestinfluenceonoperationandperformance.Itoftendefinesmanyotheraspectsof thesystemdesign.
3.4.1.2 Design techniques
Bespoke designs can be produced for extended operating life in extreme temperatures, harsh environments and for highly specialised applications.
In addition to providing highly reliable systems, specialist design techniques can be used to allow or provide the following:•Ease of installation – systems can be installed and commissioned
by third parties or the end customer. Aspects such as unique plug and socket connection prevent incorrect assembly.
•Pre-failurenotification–largersystemscansendanalarmif theenergy is running out – whatever the cause. The alarm can be audible, a text message or an email message.
•Remote monitoring – all system parameters can be accessed over a telecom link if required.
•No specialised tools required - all installation and maintenance performed with a basic set of commonly available tools.
•Security – theft and damage resistant measures for all major components can be incorporated.
•Safety – electrical and mechanical protection is incorporated in accordance to the requirements of the application and those using it.
ENERGY BOOK PRESS.indb 265 02/09/2014 14:58:35
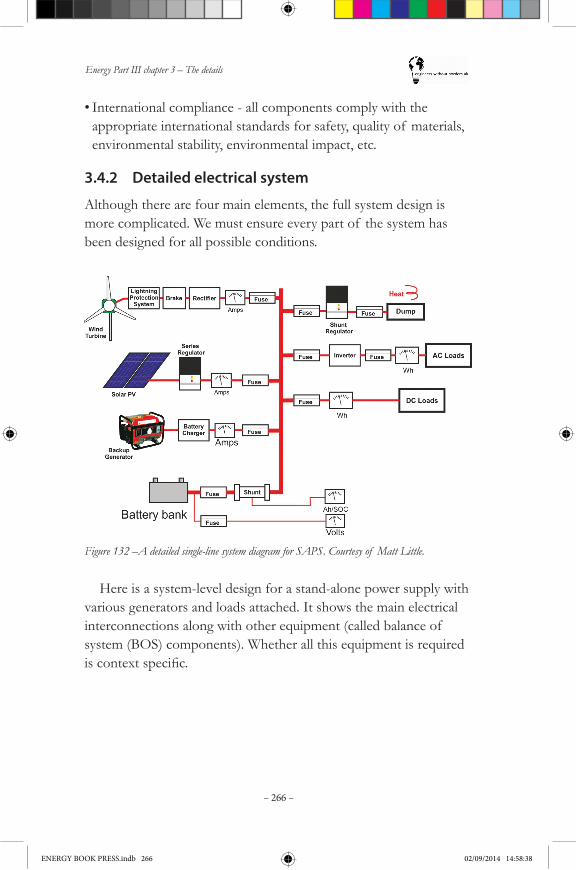
Energy Part III chapter 3 – The details
– 266 –
•International compliance - all components comply with the appropriate international standards for safety, quality of materials, environmental stability, environmental impact, etc.
3.4.2 Detailed electrical system
Although there are four main elements, the full system design is more complicated. We must ensure every part of the system has been designed for all possible conditions.
Figure 132 –A detailed single-line system diagram for SAPS. Courtesy of Matt Little.
Here is a system-level design for a stand-alone power supply with various generators and loads attached. It shows the main electrical interconnections along with other equipment (called balance of system (BOS) components). Whether all this equipment is required iscontextspecific.
ENERGY BOOK PRESS.indb 266 02/09/2014 14:58:38
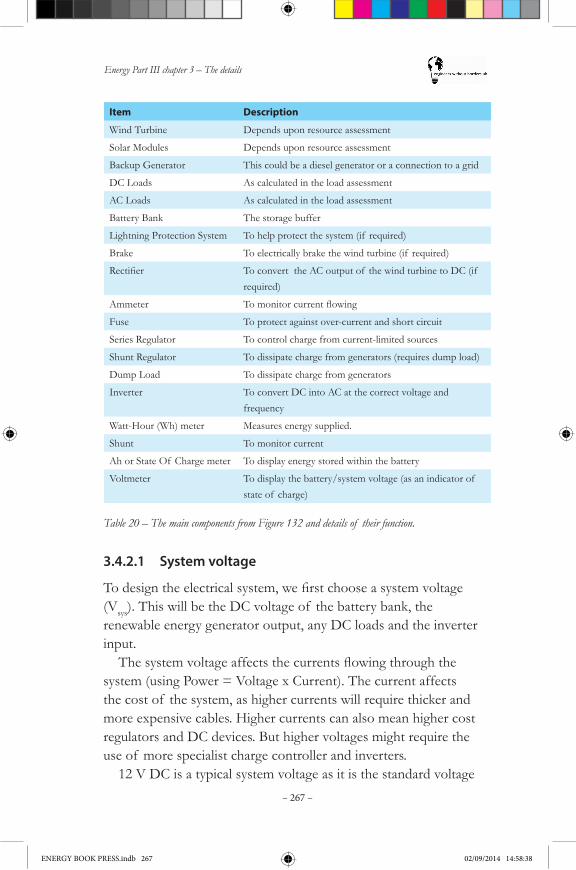
Energy Part III chapter 3 – The details
– 267 –
Item Description
Wind Turbine Depends upon resource assessment
Solar Modules Depends upon resource assessment
Backup Generator This could be a diesel generator or a connection to a grid
DC Loads As calculated in the load assessment
AC Loads As calculated in the load assessment
Battery Bank The storage buffer
Lightning Protection System To help protect the system (if required)
Brake To electrically brake the wind turbine (if required)
Rectifier To convert the AC output of the wind turbine to DC (if required)
Ammeter Tomonitorcurrentflowing
Fuse To protect against over-current and short circuit
Series Regulator To control charge from current-limited sources
Shunt Regulator To dissipate charge from generators (requires dump load)
Dump Load To dissipate charge from generators
Inverter To convert DC into AC at the correct voltage and frequency
Watt-Hour (Wh) meter Measures energy supplied.
Shunt To monitor current
Ah or State Of Charge meter To display energy stored within the battery
Voltmeter To display the battery/system voltage (as an indicator of state of charge)
3.4.2.1 System voltage
Todesigntheelectricalsystem,wefirstchooseasystemvoltage(Vsys). This will be the DC voltage of the battery bank, the renewable energy generator output, any DC loads and the inverter input. Thesystemvoltageaffectsthecurrentsflowingthroughthe
system (using Power = Voltage x Current). The current affects the cost of the system, as higher currents will require thicker and more expensive cables. Higher currents can also mean higher cost regulators and DC devices. But higher voltages might require the use of more specialist charge controller and inverters.
12 V DC is a typical system voltage as it is the standard voltage
Table 20 – The main components from Figure 132 and details of their function.
ENERGY BOOK PRESS.indb 267 02/09/2014 14:58:38
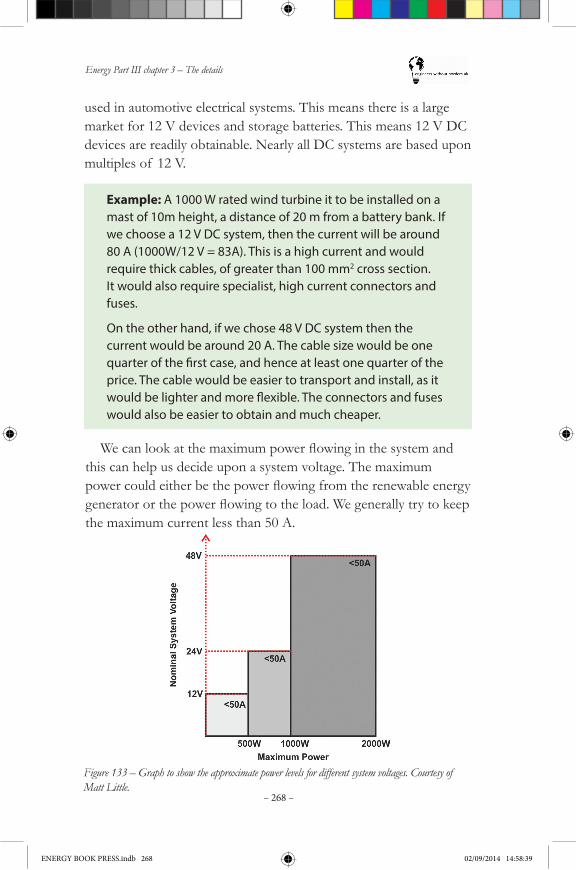
Energy Part III chapter 3 – The details
– 268 –
used in automotive electrical systems. This means there is a large market for 12 V devices and storage batteries. This means 12 V DC devices are readily obtainable. Nearly all DC systems are based upon multiples of 12 V.
Example: A 1000 W rated wind turbine it to be installed on a mast of 10m height, a distance of 20 m from a battery bank. If we choose a 12 V DC system, then the current will be around 80 A (1000W/12 V = 83A). This is a high current and would require thick cables, of greater than 100 mm2 cross section. It would also require specialist, high current connectors and fuses.
On the other hand, if we chose 48 V DC system then the current would be around 20 A. The cable size would be one quarter of the first case, and hence at least one quarter of the price. The cable would be easier to transport and install, as it would be lighter and more flexible. The connectors and fuses would also be easier to obtain and much cheaper.
Wecanlookatthemaximumpowerflowinginthesystemandthis can help us decide upon a system voltage. The maximum powercouldeitherbethepowerflowingfromtherenewableenergygeneratororthepowerflowingtotheload.Wegenerallytrytokeepthe maximum current less than 50 A.
Figure 133 – Graph to show the approximate power levels for different system voltages. Courtesy of Matt Little.
ENERGY BOOK PRESS.indb 268 02/09/2014 14:58:39

Energy Part III chapter 3 – The details
– 269 –
Unfortunately, deciding the system voltage is not a straightforward choice.Thefinalchoiceof thesystemvoltagewilldependuponanumber of factors:•cost of cable
•availability of components rated at the system voltage (e.g. the inverter)
•voltage requirement of the loads (e.g. are all the loads at 12 V DC?).
These factors must be weighed up by the system designer. It might be good to have a system voltage which is the same as
a local ‘standard’ voltage (such as a 12 V DC system which can use standard automobile electrical parts). This would mean replacement parts are easily available locally at a low price. On the other hand, if the designer is worried that the system might be used to power additional, potentially unauthorised, loads (such as DVDs and video machines) which would affect the system performance, they may choose to use a relatively non-standard voltage (e.g. 48 V DC). This would help to stop unauthorised use of the power, but would mean the system is dependent upon specialised and more expensive replacement parts, which may not be available locally.Thefinaldecisionisusuallyabalancebetweencostof thecable
and components against the usefulness of the system voltage.
Example: With a maximum power requirement of 260 W, a system voltage of 12 V DC is chosen for our example system.
3.4.2.2 System layout
An important aspect of system installation is a good system layout. This requires skill and experience from the system designer. General points to consider include:•Ensure battery bank and power house is as cool as possible and
well ventilated.
ENERGY BOOK PRESS.indb 269 02/09/2014 14:58:39
Energy Part III chapter 3 – The details
– 270 –
•Ensure no electrical devices are placed directly above the battery bank.
•Ensure very thick cable used to join individual batteries within the battery bank.
•Take the positive and negative cables from different ends of the battery bank. This should ensure more even discharging of the batteries.
•Ensure high current cable runs are kept as short as possible.
•Ensure all cables and system components are accessible and removable in case of testing or repair.
•Ensure the layout of the meters and breakers is thought through to make them easy to read, but without excessive cable run deviations.
•Try to ‘insect-proof ’ the various system components. Use screens or sealant. Use insect repellent every month if infestations occur.
•The use of bus bars as a power distribution system makes it easy to connect the various generators and loads.
•Ensure all cable connections are well constructed. Remember this should be designed for a lifetime of 20 years or more.
Build and test as much of the system as possible before going to the site. Depending upon how remote the site is, it might be best to build and test as much as possible of the system (such as the bus bars, system voltmeter and ammeters) in a workshop. This can then be transported to the site and installed relatively quickly and easily.
A system layout plan should be made using the correct sizes of equipment to help the installation when on site.
ENERGY BOOK PRESS.indb 270 02/09/2014 14:58:39
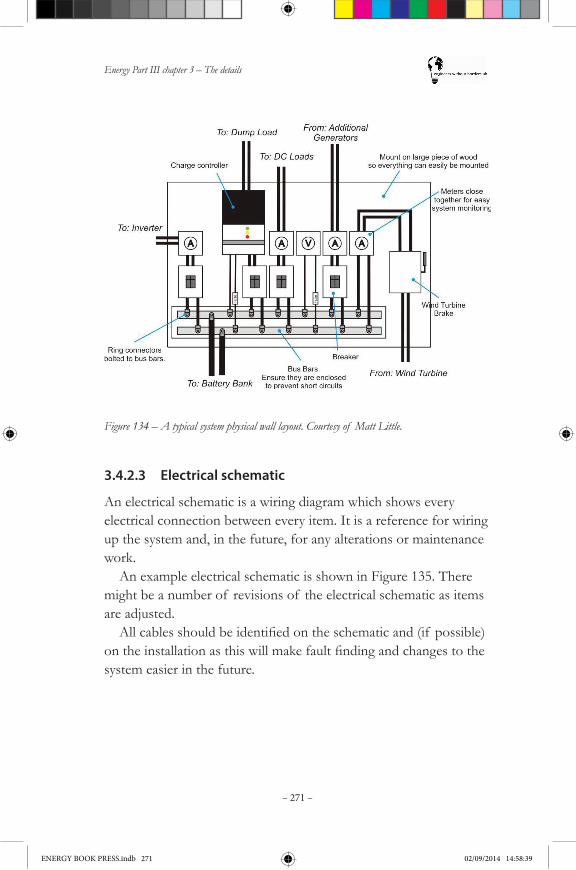
Energy Part III chapter 3 – The details
– 271 –
Figure 134 – A typical system physical wall layout. Courtesy of Matt Little.
3.4.2.3 Electrical schematic
An electrical schematic is a wiring diagram which shows every electrical connection between every item. It is a reference for wiring up the system and, in the future, for any alterations or maintenance work.
An example electrical schematic is shown in Figure 135. There might be a number of revisions of the electrical schematic as items are adjusted.Allcablesshouldbeidentifiedontheschematicand(if possible)
ontheinstallationasthiswillmakefaultfindingandchangestothesystem easier in the future.
ENERGY BOOK PRESS.indb 271 02/09/2014 14:58:39
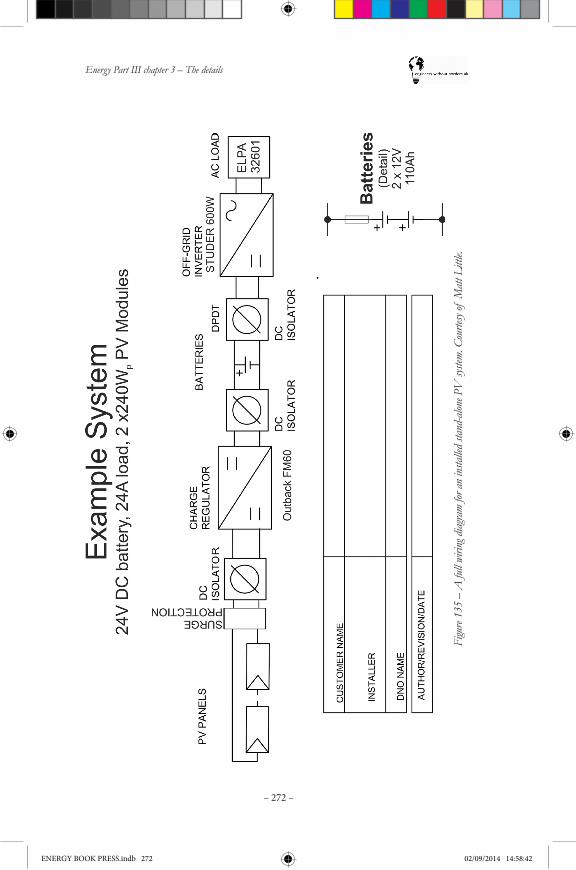
Energy Part III chapter 3 – The details
– 272 –
Figu
re 13
5 –
A fu
ll wi
ring d
iagra
m for
an in
stalle
d stan
d-alo
ne P
V sy
stem.
Cou
rtesy
of M
att L
ittle.
ENERGY BOOK PRESS.indb 272 02/09/2014 14:58:42

Energy Part III chapter 3 – The details
– 273 –
3.4.2.4 Installation practice
We must ensure good installation practice. This includes:•Ensure cable runs are kept as short possible and neat.
•Monitoring information must be easily accessible and easy to interpret.
•Propercableidentification.
•Full electrical circuit diagram/schematic is always required.
•Include copies of any manuals on the equipment installed.
•This must be kept in case of any maintenance required later on – always remember that you may not be around so ensure that it is understandable by another person
•Make sure the layout is clear, as although you may understand what everything does and where all the wires go, you are not the one who will be maintaining the system. It is likely to be somebody with little knowledge of electricity, so even going as far as labelling key components and where cables lead to can often be useful.
Figure 136b – A very clear electrical installation. The community struggled to maintain the first system, (above) whilst the community technician shown on the left was capable of performing all but the most complicated maintenance operations. Photos courtesy of Jon Sumanik-Leary.
Figure 136a – A very confusing electrical installation
ENERGY BOOK PRESS.indb 273 02/09/2014 14:58:43
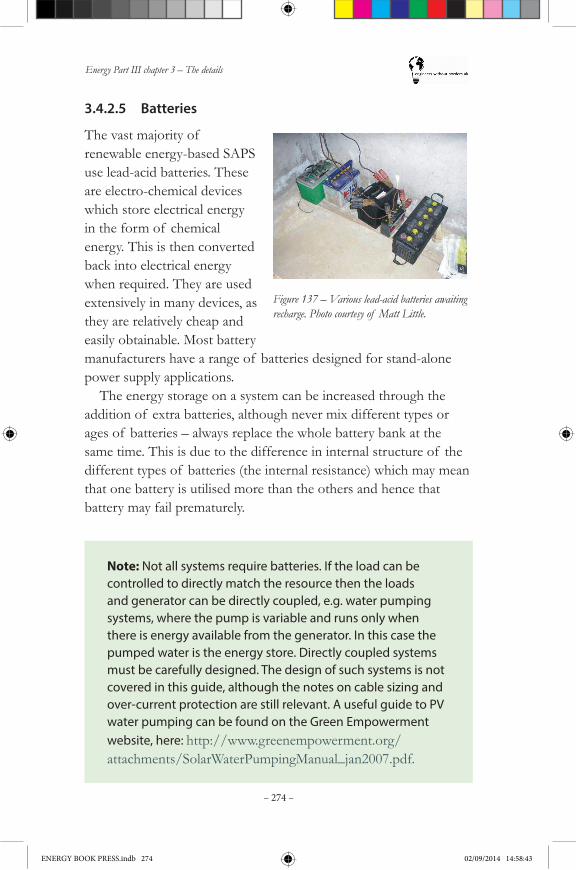
Energy Part III chapter 3 – The details
– 274 –
3.4.2.5 Batteries
The vast majority of renewable energy-based SAPS use lead-acid batteries. These are electro-chemical devices which store electrical energy in the form of chemical energy. This is then converted back into electrical energy when required. They are used extensively in many devices, as they are relatively cheap and easily obtainable. Most battery manufacturers have a range of batteries designed for stand-alone power supply applications.
The energy storage on a system can be increased through the addition of extra batteries, although never mix different types or ages of batteries – always replace the whole battery bank at the same time. This is due to the difference in internal structure of the different types of batteries (the internal resistance) which may mean that one battery is utilised more than the others and hence that battery may fail prematurely.
Figure 137 – Various lead-acid batteries awaiting recharge. Photo courtesy of Matt Little.
Note: Not all systems require batteries. If the load can be controlled to directly match the resource then the loads and generator can be directly coupled, e.g. water pumping systems, where the pump is variable and runs only when there is energy available from the generator. In this case the pumped water is the energy store. Directly coupled systems must be carefully designed. The design of such systems is not covered in this guide, although the notes on cable sizing and over-current protection are still relevant. A useful guide to PV water pumping can be found on the Green Empowerment website, here: http://www.greenempowerment.org/attachments/SolarWaterPumpingManual_jan2007.pdf.
ENERGY BOOK PRESS.indb 274 02/09/2014 14:58:43

Energy Part III chapter 3 – The details
– 275 –
Types of battery
Automotive batteries•Not suitable for long-term energy storage.
DO NOT USE in an off-grid system.•The lead plates have a weak sponge design
which is damaged by excessive charge-cycling.
Flooded or Wet Cells•Very common lead-acid battery for off-grid
systems.•Ensure they are ‘leisure’ or ‘deep cycle’ types.
High-cycle types should always be used for renewable energy systems, if available.•Not sealed so user can check and replenish
electrolyte.•Lower cost.•Cannot use full capacity in PV systems as
they require an initialisation charge (typically 48hrs continuously) – which is not possible with stand-alone PV, which generate nothing at night.
Absorbed Glass Mat (AGM)•AGMbatteriesuseafibre-glass-like
separator to hold electrolyte in place.•This makes AGM spill proof and impact
resistant.•Sealedandcannotberefilledwith
electrolyte. DO NOT OVER-CHARGE.•Use same voltage set-points as wet cells,
so can be used as direct replacement for floodedbatteries.•Higher cost.
ENERGY BOOK PRESS.indb 275 02/09/2014 14:58:44
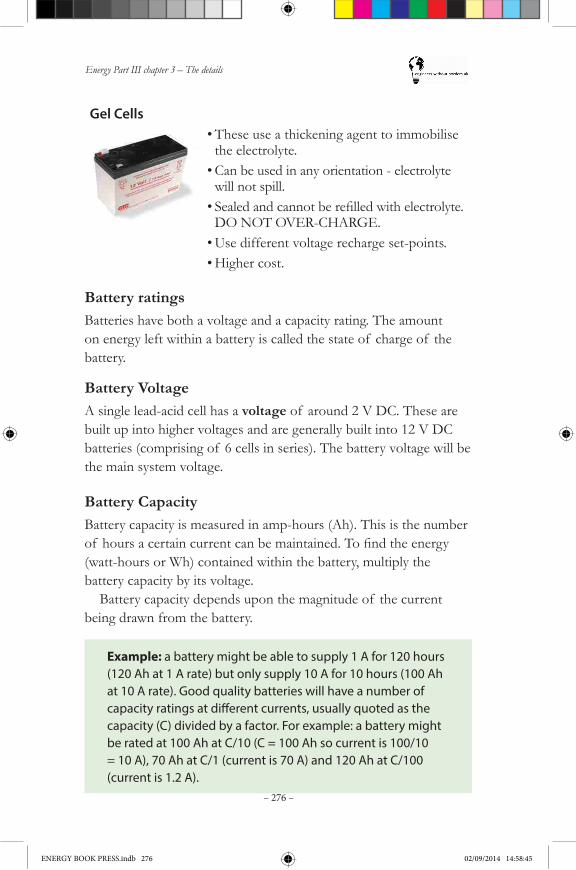
Energy Part III chapter 3 – The details
– 276 –
Gel Cells•These use a thickening agent to immobilise
the electrolyte.•Can be used in any orientation - electrolyte
will not spill.•Sealedandcannotberefilledwithelectrolyte.
DO NOT OVER-CHARGE.•Use different voltage recharge set-points.•Higher cost.
Battery ratingsBatteries have both a voltage and a capacity rating. The amount on energy left within a battery is called the state of charge of the battery.
Battery VoltageA single lead-acid cell has a voltage of around 2 V DC. These are built up into higher voltages and are generally built into 12 V DC batteries (comprising of 6 cells in series). The battery voltage will be the main system voltage.
Battery CapacityBattery capacity is measured in amp-hours (Ah). This is the number of hoursacertaincurrentcanbemaintained.Tofindtheenergy(watt-hours or Wh) contained within the battery, multiply the battery capacity by its voltage.
Battery capacity depends upon the magnitude of the current being drawn from the battery.
Example: a battery might be able to supply 1 A for 120 hours (120 Ah at 1 A rate) but only supply 10 A for 10 hours (100 Ah at 10 A rate). Good quality batteries will have a number of capacity ratings at different currents, usually quoted as the capacity (C) divided by a factor. For example: a battery might be rated at 100 Ah at C/10 (C = 100 Ah so current is 100/10 = 10 A), 70 Ah at C/1 (current is 70 A) and 120 Ah at C/100 (current is 1.2 A).
ENERGY BOOK PRESS.indb 276 02/09/2014 14:58:45
Energy Part III chapter 3 – The details
– 277 –
It is best to ensure the average charge current is not greater than the C/10 rate of the battery, otherwise there will be greater heat dissipation(andhencepowerloss)makingthesystemlessefficient.
Battery state of chargeState of charge is the total energy left in the battery as a percentage of the full capacity of the battery.
Example: 25 Ah have been removed from a 100 Ah battery. This is a depth of discharge of 25%, leaving 75 Ah within the battery, hence the state of charge is 75 Ah/100 Ah = 75%. The state of charge of a battery is a very useful system variable. Factors influencing state of charge include: age of battery, temperature, the number of battery cycles and the magnitude of current flowing. This makes accurately assessing the state of charge of a battery bank very difficult.
Itisverydifficulttoaccuratelyassesshowmuchenergyiscontained within a battery. As a result batteries are generally not well maintained and frequently fail before other parts of the system. Therearethreemaintechniquesforfindingstateof chargeof alead-acid battery:
ElectrolytespecificgravityThespecificgravity(density)of thebatteryelectrolytewillchangedepending upon the SOC. This can be tested with a battery hydrometer.Thistechniqueonlyworkswithopenvented/floodedlead-acid batteries with access to the electrolyte. This method can be very accurate.
Please use the chart and instructions which come with your hydrometer. You will have to make corrections for temperature, as the temperature will affect the density.
Always wear acid-resistant gloves and goggles when taking hydrometer readings.Figure138showstheapproximatespecificgravity,batteryvoltage
and state of charge of an open-vented lead-acid battery bank.
ENERGY BOOK PRESS.indb 277 02/09/2014 14:58:45
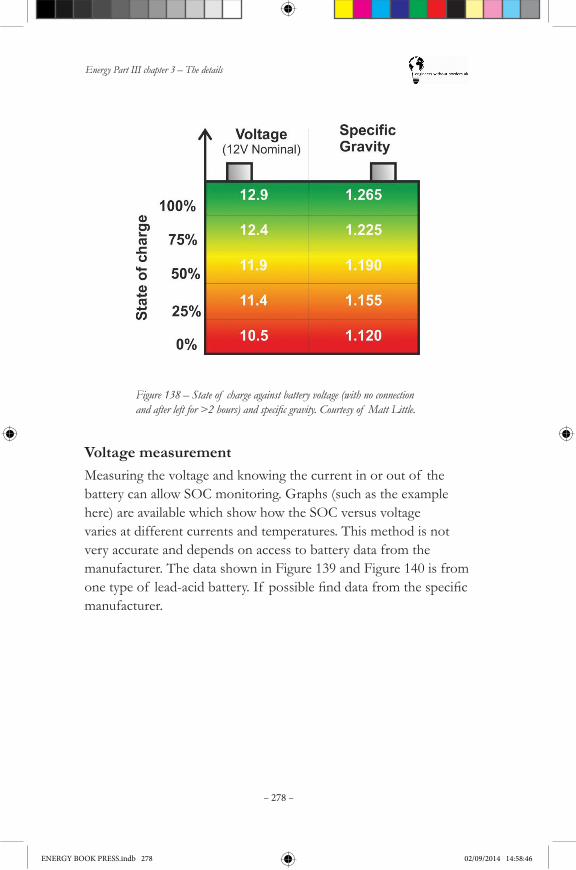
Energy Part III chapter 3 – The details
– 278 –
Figure 138 – State of charge against battery voltage (with no connection and after left for >2 hours) and specific gravity. Courtesy of Matt Little.
Voltage measurementMeasuring the voltage and knowing the current in or out of the battery can allow SOC monitoring. Graphs (such as the example here) are available which show how the SOC versus voltage varies at different currents and temperatures. This method is not very accurate and depends on access to battery data from the manufacturer. The data shown in Figure 139 and Figure 140 is from onetypeof lead-acidbattery.If possiblefinddatafromthespecificmanufacturer.
ENERGY BOOK PRESS.indb 278 02/09/2014 14:58:46
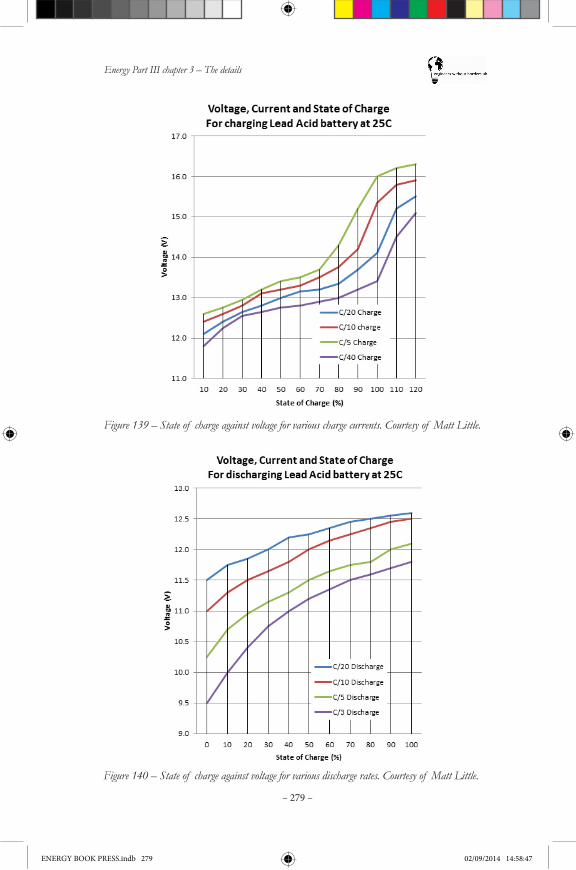
Energy Part III chapter 3 – The details
– 279 –
Figure 139 – State of charge against voltage for various charge currents. Courtesy of Matt Little.
Figure 140 – State of charge against voltage for various discharge rates. Courtesy of Matt Little.
ENERGY BOOK PRESS.indb 279 02/09/2014 14:58:47
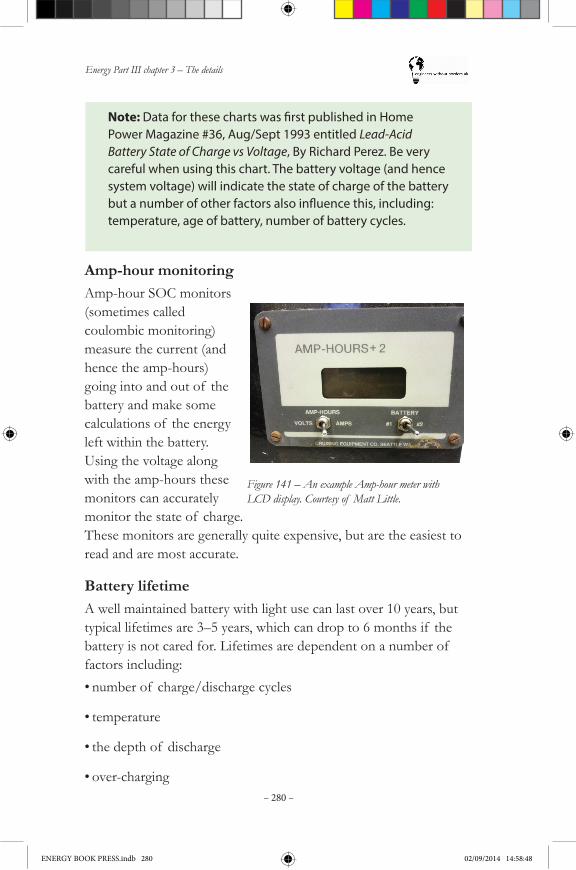
Energy Part III chapter 3 – The details
– 280 –
Note: Data for these charts was first published in Home Power Magazine #36, Aug/Sept 1993 entitled Lead-Acid Battery State of Charge vs Voltage, By Richard Perez. Be very careful when using this chart. The battery voltage (and hence system voltage) will indicate the state of charge of the battery but a number of other factors also influence this, including: temperature, age of battery, number of battery cycles.
Amp-hour monitoringAmp-hour SOC monitors (sometimes called coulombic monitoring) measure the current (and hence the amp-hours) going into and out of the battery and make some calculations of the energy left within the battery. Using the voltage along with the amp-hours these monitors can accurately monitor the state of charge. These monitors are generally quite expensive, but are the easiest to read and are most accurate.
Figure 141 – An example Amp-hour meter with LCD display. Courtesy of Matt Little.
Battery lifetimeA well maintained battery with light use can last over 10 years, but typical lifetimes are 3–5 years, which can drop to 6 months if the battery is not cared for. Lifetimes are dependent on a number of factors including: •number of charge/discharge cycles
•temperature
•the depth of discharge
•over-charging
ENERGY BOOK PRESS.indb 280 02/09/2014 14:58:48

Energy Part III chapter 3 – The details
– 281 –
•over-discharging
•whether any damage occurred during transportation and installation.
Theefficiencywithwhichenergyisstoredandretrievedfromthebatterydependsonthecurrent.Typicalbatteryefficiencyisaround70–80%.
Battery safety Batteries can be dangerous, especially if incorrectly handled or installed. The higher the SOC, the more concentrated the acid inside is and the more potential for harm exists. Before working on a battery system please review these important safety measures.
When working with batteries always ensure:•NO SMOKINGorflamesinthepowerhouse.
•Batteries generate explosive hydrogen gas when recharging. Ensure adequate ventilation.
•DO NOT short circuit the battery terminals. Extremely high currentscanflowwhichcancauselargesparks,startfiresandcause severe burns.
•DO NOT wear jewellery or metal items while working on batteries.
•Wear acid resistant gloves.
•Wear goggles for eye protection.
•Batteries are heavy. Ensure correct lifting procedure.
•Have a companion within hearing range to come to your aid in case of problems.
•Have plenty of fresh water and soap around in case of battery acid contacting skin, clothes etc.
•If acid splashed onto clothes or skin wash thoroughly with soap and clean water.
ENERGY BOOK PRESS.indb 281 02/09/2014 14:58:48

Energy Part III chapter 3 – The details
– 282 –
•If acidsplashedintoeye,flushwithcleanwaterforaleast20minutes and immediately get medical attention (this may be difficultinremoteareassoalways wear eye protection).
•Neutralise any spills with a supply of an alkaline powder (such as baking power).
•Extremelyhighcurrentscanflowif thebatteryisshortcircuited.Thiscancauseburnsandcaneasilystartfires.Henceover-current protection must be used on all cables to and from the battery bank.
Battery safety protection kit:A battery safety protection kit should be included with all systems using open-vented lead acid batteries. It is sensible to include this kit with any lead-acid battery based system.
This kit should include:◊ Acid-resistant gloves
◊ Goggles
◊ Apron
◊ Neutralising alkali (baking soda) / Electrolyte spill kit.For much more information on batteries, including their
maintenance and safe operation, refer to the International Energy Agency battery guide available free to download from: http://iea-pvps.org/products/rep3_06.htm.
Battery bank sizingThe system voltage has already been chosen, we must now calculate the required battery bank capacity. The capacity required depends upon two factors: the required number of days of autonomy and maximum current. A battery bank capacity can be calculated for both these factors and then the larger of the two values must be used as the actual battery bank capacity.
ENERGY BOOK PRESS.indb 282 02/09/2014 14:58:48
Energy Part III chapter 3 – The details
– 283 –
Method 1: Number of days autonomy battery capacityThe basic calculation for the battery bank size is: how much energy does it need to store?
Typically, the renewable energy input will be variable and the total energyflowingintothesystemwillvaryfromdaytoday.Theresourceassessment will have shown that there is enough average daily energy, butthisdoesnotmeanthateverydaythismuchenergywillflowintothe system. In order to compensate for this batteries are used.
To do this, an educated guess must be taken on the number of days that the system can supply the load with no energy input. This is called the days of autonomy.
This value is a trade-off between the system reliability required and the cost of additional storage. Typically, a value of between 3 and 5 days of autonomy is chosen. The higher the days of autonomy, the more reliable the system, but it will also mean a larger and hence more expensive battery bank. Lower values will mean a smaller, and hence less expensive, battery bank but it will be less reliable in times of low renewable energy resource.
Note: Lead acid batteries cannot store energy for very long periods (months). This is due to their self-discharge (if left with no input, a small percentage of the charge is lost each day, over time this can totally discharge the battery). This means that a battery bank cannot smooth out seasonal variations. As noted in the ‘energy balance’ section, if large seasonal variations are seen in the resource assessment this may affect the system design. Rather than using the annual daily average values for energy input, it would be best to take the month with the minimum resource and design for that value. This would ensure that the system will operate throughout any low resource period.
Another factor to take into account is the depth of discharge of the battery bank. The depth of discharge relates to the amount of energythatcanbetakenfromthebattery.Thishasasignificanteffect on cycle life, and is usually shown as a percentage of capacity removed.
ENERGY BOOK PRESS.indb 283 02/09/2014 14:58:48
Energy Part III chapter 3 – The details
– 284 –
Example: a 100 Ah battery has a load of 5 A applied for 5 hours. This means 5 A x 5 hrs = 25 Ah have been removed from a 100Ah battery. Therefore there should be 75 Ah left. The depth of discharge is 25 Ah out of 100 Ah = 25% (Note: this is a simplistic analysis as a number of other factors affect this value, but will work for a basic battery capacity calculation).
To help ensure a long battery lifetime, a maximum depth of discharge of 50% should be used in the calculation of battery capacity.Thecalculationsrequiredtofindthebatterycapacityfromthe
‘number of days’ autonomy’ are:Find the average daily total load required (Eloads) in watt-hours
(this should be calculated in the load analysis). Using the days autonomy required (Dautonomy) and the maximum
depth of discharge of the battery (DODmax), the storage requirement of the battery can be calculated (Estore).
This, along with the system voltage (Vsys), will give the amp-hour capacity of the battery (Cbat_1):
Estore =
Eloads∙Dautonomy∙100
DODmax
Example: Using the Peruvian health centre example:The daily load requirement (from ‘energy balance’ section) is 658 Wh. System voltage = 12 VDays of autonomy = 4Maximum depth of discharge = 50%Estore = (658x4x100)/50 = 5264 Wh
Battery capacity (method 1) = 5264 Wh / 12 V = 438 Ah
ENERGY BOOK PRESS.indb 284 02/09/2014 14:58:48
Energy Part III chapter 3 – The details
– 285 –
Method 2: Maximum current battery capacityDue to the electro-chemical characteristics of the battery, more currentintooroutof thebatterymakesitlessefficient.Toensureareasonablyefficientbatterybank,themaximumcurrentmagnitudeinto the battery should be limited to 1/8th of the battery bank rated Ah capacity:
Cbat_2 = Imax x 8
The Imax value is either the maximum current from the generators or the maximum current to the loads, whichever is greater.
This gives a second calculation of the battery bank capacity, whichmustalsobefulfilled.
Example:
The maximum load is 260 W, which is 21.6 A on the 12 V system.The maximum generation is 150 W, which is 12.5 A on the 12 V system.Using the larger value, the minimum Ah capacity of the battery should be:
Battery capacity (method 2) = 21.6 A x 8 = 173 Ah.
Final battery bank capacityTwo battery bank capacities have been calculated (Cbat_1 from the number of days of autonomy method and Cbat_2 from the maximum current method). Both these values must be met, therefore use the larger value as the design value.
The battery bank will be comprised of batteries connected in series (to increase the voltage) and parallel (to increase the capacity). Batteries are only available in certain Ah capacities. Therefore, multiple batteries connected in parallel may be needed to get the required capacity. Also, the capacity required may not be an exact multiple of the available battery sizes. If this is the case, always try to over-size the battery bank using the available battery capacities.
ENERGY BOOK PRESS.indb 285 02/09/2014 14:58:48

Energy Part III chapter 3 – The details
– 286 –
Example:
Cbat_1 = 438 Ah, Cbat_2 = 173 Ah, therefore use Cbat = 438 Ah.
Available batteries are 12 V, 150 Ah.
Vsys = 12 V, and each series string will be rated at 12 V and 150 Ah.
Total capacity is 438 Ah, therefore 438 Ah / 150 Ah = 2.92 parallel strings are required. This must be rounded up to the nearest whole value; therefore 3 parallel strings are required.The final design is for 3 x 12 V 150 Ah batteries. 3 parallel strings are required.
The total capacity (Cbat) = 150 Ah x 3 = 450 Ah.
ENERGY BOOK PRESS.indb 286 02/09/2014 14:58:48
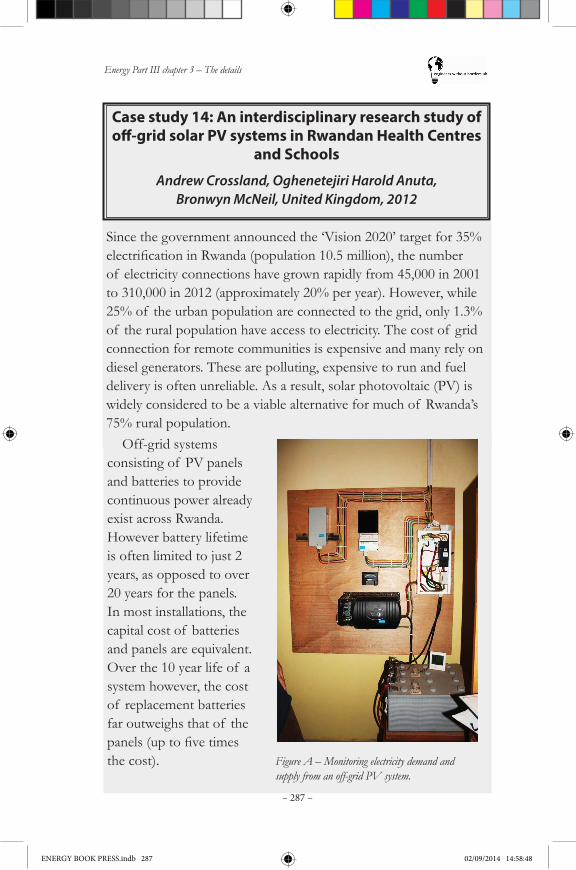
Energy Part III chapter 3 – The details
– 287 –
Case study 14: An interdisciplinary research study of off-grid solar PV systems in Rwandan Health Centres
and Schools
Andrew Crossland, Oghenetejiri Harold Anuta, Bronwyn McNeil, United Kingdom, 2012
Since the government announced the ‘Vision 2020’ target for 35% electrificationinRwanda(population10.5million),thenumberof electricity connections have grown rapidly from 45,000 in 2001 to 310,000 in 2012 (approximately 20% per year). However, while 25% of the urban population are connected to the grid, only 1.3% of the rural population have access to electricity. The cost of grid connection for remote communities is expensive and many rely on diesel generators. These are polluting, expensive to run and fuel delivery is often unreliable. As a result, solar photovoltaic (PV) is widely considered to be a viable alternative for much of Rwanda’s 75% rural population.
Off-grid systems consisting of PV panels and batteries to provide continuous power already exist across Rwanda. However battery lifetime is often limited to just 2 years, as opposed to over 20 years for the panels. In most installations, the capital cost of batteries and panels are equivalent. Over the 10 year life of a system however, the cost of replacement batteries far outweighs that of the panels(uptofivetimesthe cost). Figure A – Monitoring electricity demand and
supply from an off-grid PV system.
ENERGY BOOK PRESS.indb 287 02/09/2014 14:58:48
Energy Part III chapter 3 – The details
– 288 –
This greatly reduces system viability and acceptance. As a result, research was conducted by students at Durham University into the causes and effects of low battery lifetime in rural health centres and schools. A total of thirteen geographically dispersed sites were surveyed in Rwanda, comprising nine health centres and two schools. These included sites where•PV systems were donated by foreign organisations.
•PV systems were considered in the future.
•PV systems had failed.
At each site, technical and social data were collected by conducting a system survey, installation of energy monitors to measure electricity demand and semi-structured interviews with ownersandinstallers.Themainsystembenefitswerefoundtobe:•Improved night-time services, especially in maternity wards.
•Improved educational services (IT and late night working).
•Improved mobility and safety at night.
•Access to computers for administrative work and external communication.
The key factors found to reduce performance and lifetime of the batteries were:•Heavy night-time use, which reduces battery lifetime by
discharging them more deeply.
•Minimal operator training and consequent low understanding of operation and maintenance.
•Lack of demand management by operators, especially during cloudy periods.
•Overloading due to purchasing/donation of new equipment.
•Perception of solar energy as ‘free’, which leads to a more carefree attitude towards operation and maintenance.
ENERGY BOOK PRESS.indb 288 02/09/2014 14:58:48
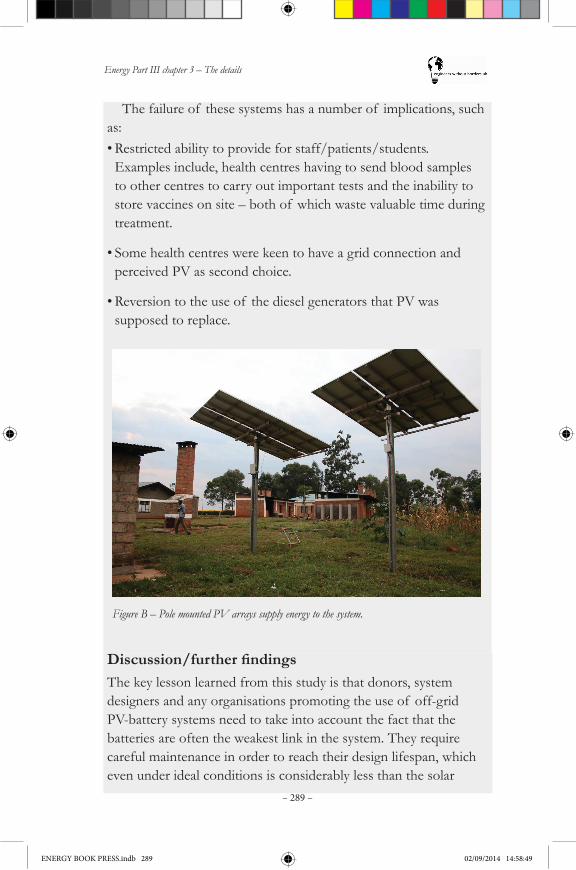
Energy Part III chapter 3 – The details
– 289 –
The failure of these systems has a number of implications, such as:•Restricted ability to provide for staff/patients/students.
Examples include, health centres having to send blood samples to other centres to carry out important tests and the inability to store vaccines on site – both of which waste valuable time during treatment.
•Some health centres were keen to have a grid connection and perceived PV as second choice.
•Reversion to the use of the diesel generators that PV was supposed to replace.
Discussion/furtherfindingsThe key lesson learned from this study is that donors, system designers and any organisations promoting the use of off-grid PV-battery systems need to take into account the fact that the batteries are often the weakest link in the system. They require careful maintenance in order to reach their design lifespan, which even under ideal conditions is considerably less than the solar
Figure B – Pole mounted PV arrays supply energy to the system.
ENERGY BOOK PRESS.indb 289 02/09/2014 14:58:49

Energy Part III chapter 3 – The details
– 290 –
panels themselves. Proper training should be given to system operators before or during installation and replacement batteries should be budgeted for in the initial planning of the system. Otherwise, owners are likely to be left with the harsh decision of either: stumping up the cash for expensive battery replacement, purchasing a diesel generator and keeping it supplied with fuel or reducing the amount of medical/educational equipment they run.
About the authors: Mr Crossland and Mr Anuta are PhD engineering students at Durham University. They study the benefitsof energystorageontheUKgrid.MissMcNeilisananthropologist who gained her Master’s from the University of Southampton. Dr Wade is involved with research across the storage industry in the UK.
About the organisation: The Durham Energy Institute is a leading energy research institute based at Durham University. It completes cross disciplinary research into the societal aspects of energy technology development and use.
Great Lakes Energy headed by Sam Dargan is a local company based in Rwanda that provide solar energy systems, and solar systems training and consulting services across East Africa.
ENERGY BOOK PRESS.indb 290 02/09/2014 14:58:49
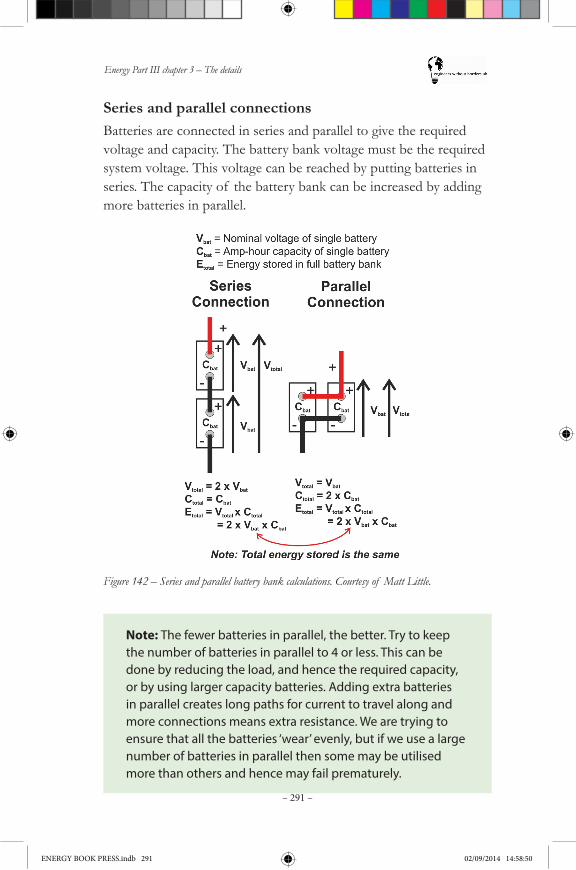
Energy Part III chapter 3 – The details
– 291 –
Series and parallel connectionsBatteries are connected in series and parallel to give the required voltage and capacity. The battery bank voltage must be the required system voltage. This voltage can be reached by putting batteries in series. The capacity of the battery bank can be increased by adding more batteries in parallel.
Figure 142 – Series and parallel battery bank calculations. Courtesy of Matt Little.
Note: The fewer batteries in parallel, the better. Try to keep the number of batteries in parallel to 4 or less. This can be done by reducing the load, and hence the required capacity, or by using larger capacity batteries. Adding extra batteries in parallel creates long paths for current to travel along and more connections means extra resistance. We are trying to ensure that all the batteries ‘wear’ evenly, but if we use a large number of batteries in parallel then some may be utilised more than others and hence may fail prematurely.
ENERGY BOOK PRESS.indb 291 02/09/2014 14:58:50
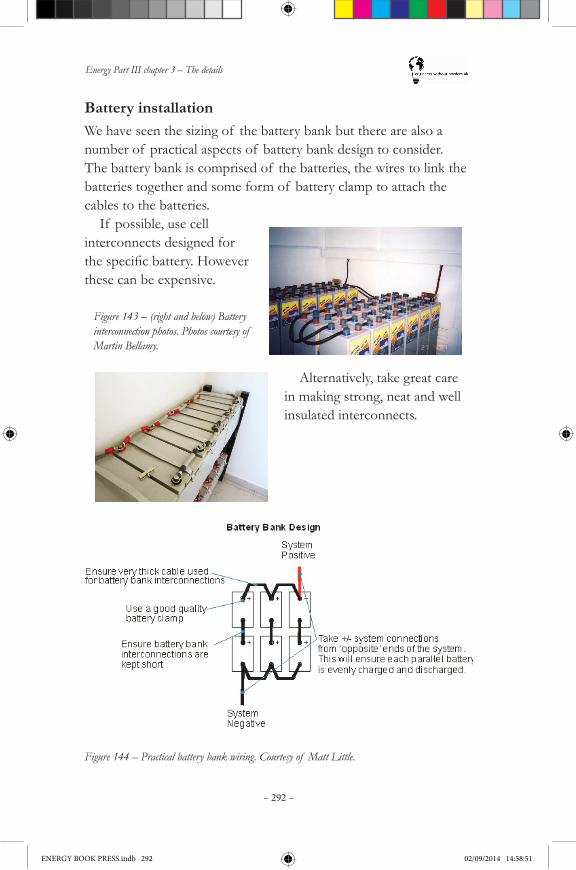
Energy Part III chapter 3 – The details
– 292 –
Battery installationWe have seen the sizing of the battery bank but there are also a number of practical aspects of battery bank design to consider. The battery bank is comprised of the batteries, the wires to link the batteries together and some form of battery clamp to attach the cables to the batteries.
If possible, use cell interconnects designed for thespecificbattery.Howeverthese can be expensive.
Figure 143 – (right and below) Battery interconnection photos. Photos courtesy of Martin Bellamy.
Alternatively, take great care in making strong, neat and well insulated interconnects.
Figure 144 – Practical battery bank wiring. Courtesy of Matt Little.
ENERGY BOOK PRESS.indb 292 02/09/2014 14:58:51
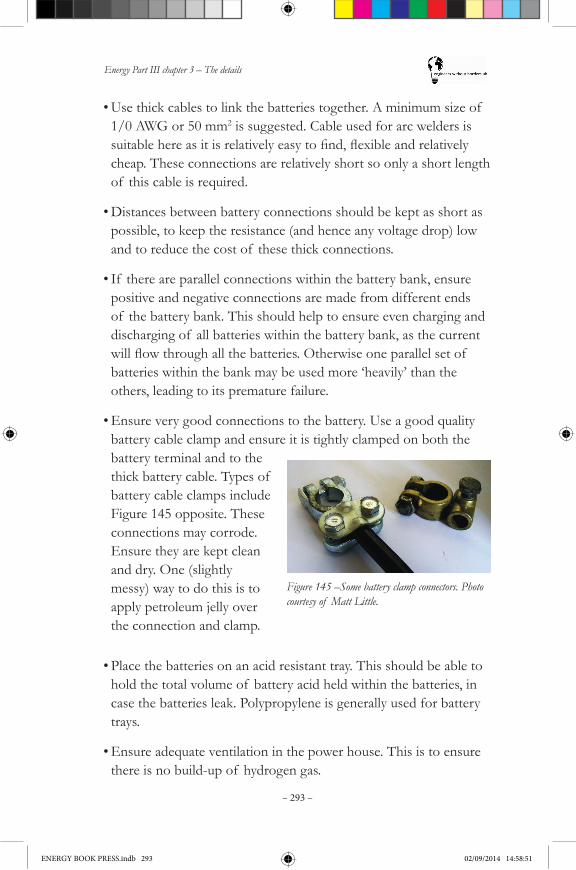
Energy Part III chapter 3 – The details
– 293 –
•Use thick cables to link the batteries together. A minimum size of 1/0 AWG or 50 mm2 is suggested. Cable used for arc welders is suitablehereasitisrelativelyeasytofind,flexibleandrelativelycheap. These connections are relatively short so only a short length of this cable is required.
•Distances between battery connections should be kept as short as possible, to keep the resistance (and hence any voltage drop) low and to reduce the cost of these thick connections.
•If there are parallel connections within the battery bank, ensure positive and negative connections are made from different ends of the battery bank. This should help to ensure even charging and discharging of all batteries within the battery bank, as the current willflowthroughallthebatteries.Otherwiseoneparallelsetof batteries within the bank may be used more ‘heavily’ than the others, leading to its premature failure.
•Ensure very good connections to the battery. Use a good quality battery cable clamp and ensure it is tightly clamped on both the battery terminal and to the thick battery cable. Types of battery cable clamps include Figure 145 opposite. These connections may corrode. Ensure they are kept clean and dry. One (slightly messy) way to do this is to apply petroleum jelly over the connection and clamp.
Figure 145 –Some battery clamp connectors. Photo courtesy of Matt Little.
•Place the batteries on an acid resistant tray. This should be able to hold the total volume of battery acid held within the batteries, in case the batteries leak. Polypropylene is generally used for battery trays.
•Ensure adequate ventilation in the power house. This is to ensure there is no build-up of hydrogen gas.
ENERGY BOOK PRESS.indb 293 02/09/2014 14:58:51
Energy Part III chapter 3 – The details
– 294 –
•Ensure no equipment that could produce sparks (switches, relays etc.) is located directly above the battery bank.
•Ensure battery safety signs are visible close to the battery bank.
•Never use different types and ages of batteries within the same battery bank.
•Ensure the batteries are disposed of properly at the end of their lifetime. Batteries contain lead and sulphuric acid which are both toxic.
Battery cable This cable handles the current from the battery bank to the rest of the system. It must be sized to handle the highest currents with a low voltage drop (see ‘cable sizing’ section for details on cable design calculations). This cable will carry the highest currents within the system so it should not be too long: ensure the system layout does not make this cable excessively long.
The maximum system current (Imax) is used to calculate the minimum size for the battery cable.
Usually, a voltage drop of just 1% is used to calculate the size of this cable. This is lower than the usual 5% as the voltage drop along this cable can affect the performance of some equipment on the system. If possible, use an even larger cable size to ensure the voltage drop is very small. This should not incur much of an additional cost as this cable should be relatively short.
See the ‘DC cable sizing’ section for more information.
Battery equalisation chargeNote: an equalisation charge is only required for open-vented ‘wet’ lead acid batteries.
An equalisation charge is a higher voltage charge (around 15 V DC for a 12 V system) for the battery bank.
It ensures that all the cells within the battery bank are brought up to the same state of charge (i.e. all fully charged). This charge does resultinsomelostenergybutisbeneficialintermsof batterylifetime.
ENERGY BOOK PRESS.indb 294 02/09/2014 14:58:51
Energy Part III chapter 3 – The details
– 295 –
The equalisation charge should be applied until all the cells within the bank are ‘gassing’, where small bubbles of gas are generated on the plates of the batteries (typically around two hours when applied to a full battery bank).
Ensure that the electrolyte levels are checked after an equalisation charge (performed by a charge controller) and any cells topped up with distilled water, if required.
Battery operationThe main factors affecting the lifetime and operation of lead-acid batteries are:
Temperature Higher operating temperatures will reduce battery capacity and lead to shorter lifetimes. Very low temperatures will also affect the performance of the battery.
Depth of dischargeThe depth to which the battery has been discharged will affect the current absorbed. Lead acid batteries dislike being discharged to a low level and then left. Always try to recharge the battery as soon as possible. Precautions must be taken to ensure that the battery is never discharged too far.
Lead-acid batteries must NOT be regularly discharged to below 20% state-of-charge. This will permanently damage the battery and greatly impact its lifetime.
Number of charge-discharge cyclesThe number of times a battery is cycled (discharged and then recharged) will gradually reduce the available capacity. If treated well a battery can last for a large number of cycles (100’s to 1000’s), but any abuse will greatly reduce the battery capacity.
Depth of discharge and cycle lifeThe greater the percentage of energy drawn each discharge-charge cycle, the fewer total cycles the battery will sustain.
The example graph (Figure 146) shows the relationship between
ENERGY BOOK PRESS.indb 295 02/09/2014 14:58:51
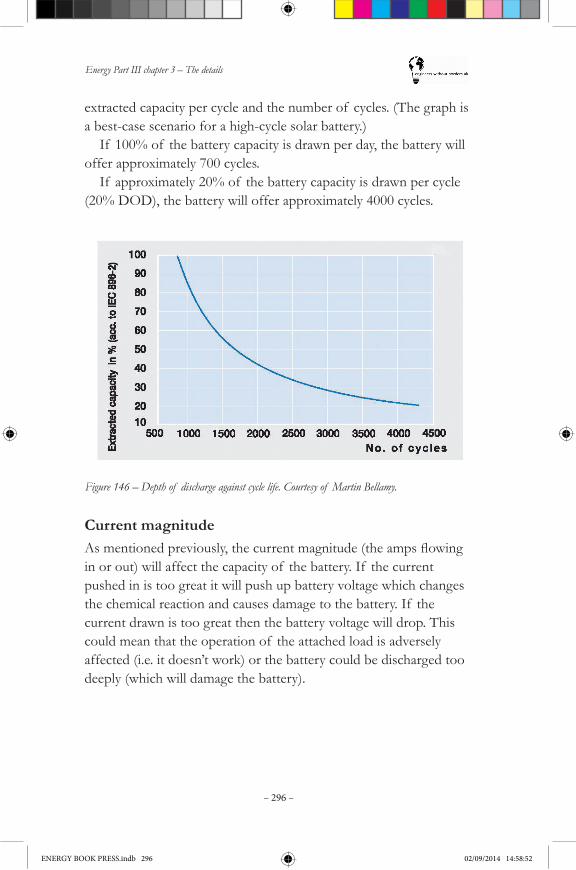
Energy Part III chapter 3 – The details
– 296 –
Figure 146 – Depth of discharge against cycle life. Courtesy of Martin Bellamy.
Current magnitude Asmentionedpreviously,thecurrentmagnitude(theampsflowingin or out) will affect the capacity of the battery. If the current pushed in is too great it will push up battery voltage which changes the chemical reaction and causes damage to the battery. If the current drawn is too great then the battery voltage will drop. This could mean that the operation of the attached load is adversely affected (i.e. it doesn’t work) or the battery could be discharged too deeply (which will damage the battery).
extracted capacity per cycle and the number of cycles. (The graph is a best-case scenario for a high-cycle solar battery.)
If 100% of the battery capacity is drawn per day, the battery will offer approximately 700 cycles.
If approximately 20% of the battery capacity is drawn per cycle (20% DOD), the battery will offer approximately 4000 cycles.
ENERGY BOOK PRESS.indb 296 02/09/2014 14:58:52
Energy Part III chapter 3 – The details
– 297 –
Battery problemsThe lead-acid battery is usually the weak point within a stand-alone renewable energy system. Even for a well maintained system the battery bank will have to be changed once or twice during the lifetime of the project.Problems with lead-acid batteries include:•They self-discharge at a rate of 1–5% total energy per day. This
means they are only practical for short-term energy storage.
•Temperature affects both capacity and lifetime (IEA, 1999, Rydh and Sanden, 2005). A large number of stand-alone systems are installed in the developing world, where temperatures are generally higher. The battery lifetimes are generally lower which increases the associated system cost. In colder climates, the battery capacity is reduced.
•Capacity is dependent upon current. Much larger stores are required with increasing amounts of generation or load.
•Lifetime is dependent upon discharge cycles and depth of discharge. Larger stores are required to ensure reasonable lifetimes and only partial use of full nameplate capacity can be made.
•Their storage density is approximately 30 to 40 Wh/kg. In comparison to diesel, with an energy density of 11600 Wh/kg (Zittel and Wurster, Accessed 30th August 2006), a lead-acid battery store will be very large.
•A periodic equalisation charge is required (Green, 1998). This increases maintenance costs.
•Lead acid batteries cost around £40 per kWh. Although this is low, the technology has been around for over 100 years, and there is little potential for cost reduction.
Often cheap car batteries with lead sponge plates are used rather than deep-cycle batteries especially designed for stand-alone operation which exacerbates these problems.
ENERGY BOOK PRESS.indb 297 02/09/2014 14:58:52
Energy Part III chapter 3 – The details
– 298 –
Simple controlThe most basic control system would be an on/off switch to control a load. This could also be a timer switch, perhaps to run a pump or lighting system for a few hours a day.
Battery disposalThe lead within a lead-acid battery is toxic. At the end of their lifetime you must ensure that correct disposal procedures are followed. The facilities available will depend upon the location and it is irresponsible to install lead-acid batteries without making the user aware of the facilities available in their area.
Additional battery resourcesBatteries are complex electro-chemical devices. This section only brieflycoversthemaindetails.Tryandgetasmuchinformationanddata as possible from your battery supplier. Recommended information includes:•IEA Battery Guide: http://www.iea-pvps.org/products/rep3_06.
htm
•Article on State Of Charge monitoring from ‘Homepower’ Magazine: http://www.arttec.net/Solar_Mower/4_Electrical/Battery%20Charging.pdf
•Practical Action battery information: http://practicalaction.org/practicalanswers/product_info.php?cPath=21&products_id=126
Control systemsAll the devices on the system must be controlled to ensure stable operation. This includes simple control, such as a switch to control a load and a control system to ensure the battery is kept within its operational limits. The main items to control are:
•Loads
•Generators
ENERGY BOOK PRESS.indb 298 02/09/2014 14:58:52
Energy Part III chapter 3 – The details
– 299 –
Switch ratingsAny switches in the cable must be rated for the maximum cable current and at the correct AC or DC voltage.
As with the over-current protection devices, if AC ratings are used then the switch must have an AC rating at least twice that of the DC current, or a switch with an AC rating of maximum cable current can be used with both positive and negative lines switched at the same time (i.e. use a double pole switch).
Charge regulatorsA lead-acid battery will be damaged by overcharging or over discharging.
If the battery is full and there is no load on the system, but there is still power coming from the wind turbine, what happens? With nowhereelsetogo,thepowerwouldstillflowintothebattery,thesystem voltage would rise and the battery would be over-charged which could severely damage the battery.
Hence we must protect against both of those conditions.To ensure that the battery is not over-charged we must control
the generators to reduce their generation as the battery becomes full. This is called over-charge protection.
To ensure the battery is not over-discharged we must control the loads, reducing the load as the battery is emptied. This is called over-discharge protection.
These functions are performed by a charge controller. This is a generic term for a device which controls the charge into or out of a system. Some charge controllers just protect against over-charging, while other implement this and protect against over-discharge.Charge regulators can also be used as a system monitor and to perform more complex control, such as switching on a generator if the voltage drops too low.
Over-charge regulationIn order to stop the battery being over charged some form of charge controller is required. Such controllers either disconnect the generator or divert the excess power into another load when the
ENERGY BOOK PRESS.indb 299 02/09/2014 14:58:52
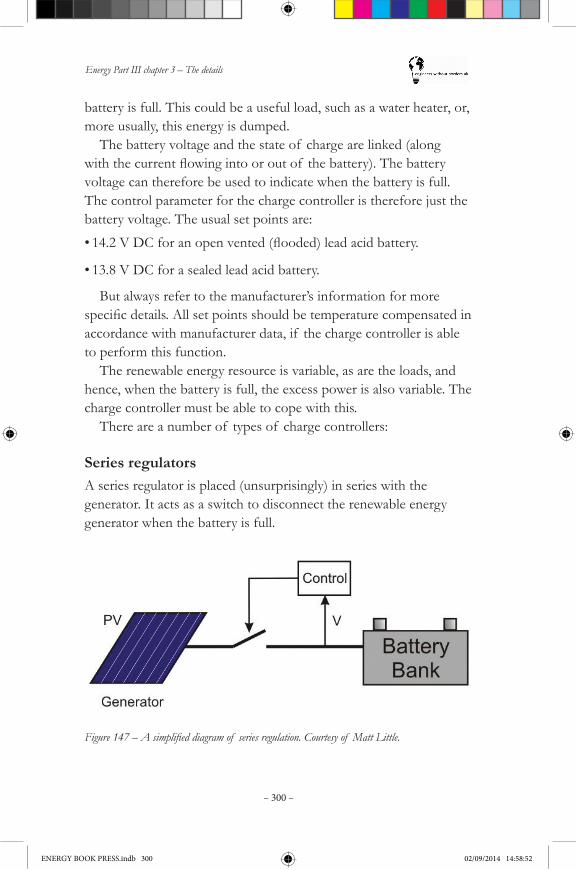
Energy Part III chapter 3 – The details
– 300 –
Series regulatorsA series regulator is placed (unsurprisingly) in series with the generator. It acts as a switch to disconnect the renewable energy generator when the battery is full.
Figure 147 – A simplified diagram of series regulation. Courtesy of Matt Little.
battery is full. This could be a useful load, such as a water heater, or, more usually, this energy is dumped.
The battery voltage and the state of charge are linked (along withthecurrentflowingintooroutof thebattery).Thebatteryvoltage can therefore be used to indicate when the battery is full. The control parameter for the charge controller is therefore just the battery voltage. The usual set points are:
•14.2VDCforanopenvented(flooded)leadacidbattery.
•13.8 V DC for a sealed lead acid battery.
But always refer to the manufacturer’s information for more specificdetails.Allsetpointsshouldbetemperaturecompensatedinaccordance with manufacturer data, if the charge controller is able to perform this function.
The renewable energy resource is variable, as are the loads, and hence, when the battery is full, the excess power is also variable. The charge controller must be able to cope with this.
There are a number of types of charge controllers:
ENERGY BOOK PRESS.indb 300 02/09/2014 14:58:52
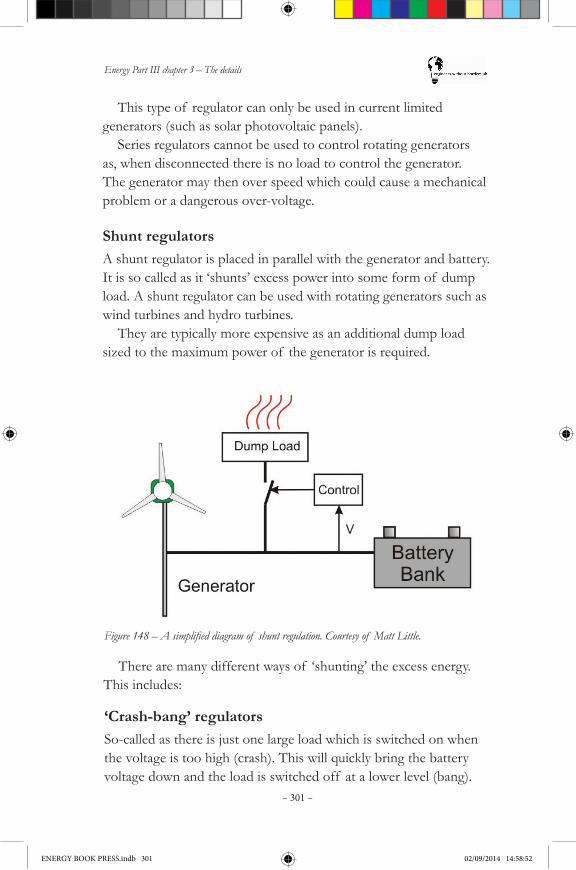
Energy Part III chapter 3 – The details
– 301 –
This type of regulator can only be used in current limited generators (such as solar photovoltaic panels).
Series regulators cannot be used to control rotating generators as, when disconnected there is no load to control the generator. The generator may then over speed which could cause a mechanical problem or a dangerous over-voltage.
Shunt regulators A shunt regulator is placed in parallel with the generator and battery. It is so called as it ‘shunts’ excess power into some form of dump load. A shunt regulator can be used with rotating generators such as wind turbines and hydro turbines.
They are typically more expensive as an additional dump load sized to the maximum power of the generator is required.
Figure 148 – A simplified diagram of shunt regulation. Courtesy of Matt Little.
There are many different ways of ‘shunting’ the excess energy. This includes:
‘Crash-bang’ regulators So-called as there is just one large load which is switched on when the voltage is too high (crash). This will quickly bring the battery voltage down and the load is switched off at a lower level (bang).
ENERGY BOOK PRESS.indb 301 02/09/2014 14:58:52

Energy Part III chapter 3 – The details
– 302 –
This type of regulator is simple (normally a good thing) but not particularly clever and treats the battery pretty harshly. The sudden changes in voltage caused by the dump load switching on and off can cause sudden changes in battery voltage which may cause problems with the other loads and generators.
Stepped load regulators A slightly more sophisticated regulator is the stepped load controller. This is similar to the ‘crash-bang’ regulator but with a number of smaller dump loads, rather than one large dump load. The switch on voltage for each dump load is slightly different. The excess power causes the battery voltage to rise and hence a varying number of dump loads to switch on. When the excess power drops the voltage drops and the dump loads switch off.
This type of converter is a good balance between simplicity and relatively smooth power regulation. The greater the number of small dump loads, the smoother the regulation, but using more than four dump loads makes the controller excessively complex.
Pulse width modulated regulators Pulse width modulated (PWM) converters usually provide the best shunt regulation. They control the excess power by rapidly switching on and off a dump load. The technique of pulse width modulation involves using a high frequency pulse train, the width of each pulse is modulated anywhere from 0% (never switched on) to 100% (on all the time). This allows very fast control of the dump load and hence very good voltage regulation. A comparator circuit is used to compare the actual battery voltage with the set-point battery voltage and hence adjust the pulse width. The frequency of the pulse train is typically above human audible frequencies (from 100s Hz to 100s of kHz).
ENERGY BOOK PRESS.indb 302 02/09/2014 14:58:52
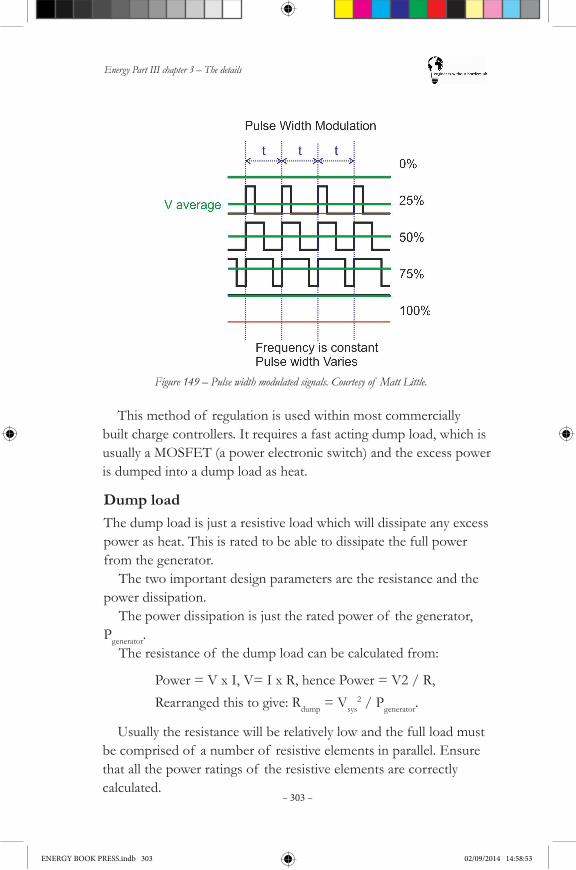
Energy Part III chapter 3 – The details
– 303 –
Figure 149 – Pulse width modulated signals. Courtesy of Matt Little.
This method of regulation is used within most commercially built charge controllers. It requires a fast acting dump load, which is usually a MOSFET (a power electronic switch) and the excess power is dumped into a dump load as heat.
Dump loadThe dump load is just a resistive load which will dissipate any excess power as heat. This is rated to be able to dissipate the full power from the generator.
The two important design parameters are the resistance and the power dissipation.
The power dissipation is just the rated power of the generator, Pgenerator.
The resistance of the dump load can be calculated from:
Usually the resistance will be relatively low and the full load must be comprised of a number of resistive elements in parallel. Ensure that all the power ratings of the resistive elements are correctly calculated.
Power = V x I, V= I x R, hence Power = V2 / R, Rearranged this to give: Rdump = Vsys
2 / Pgenerator.
ENERGY BOOK PRESS.indb 303 02/09/2014 14:58:53
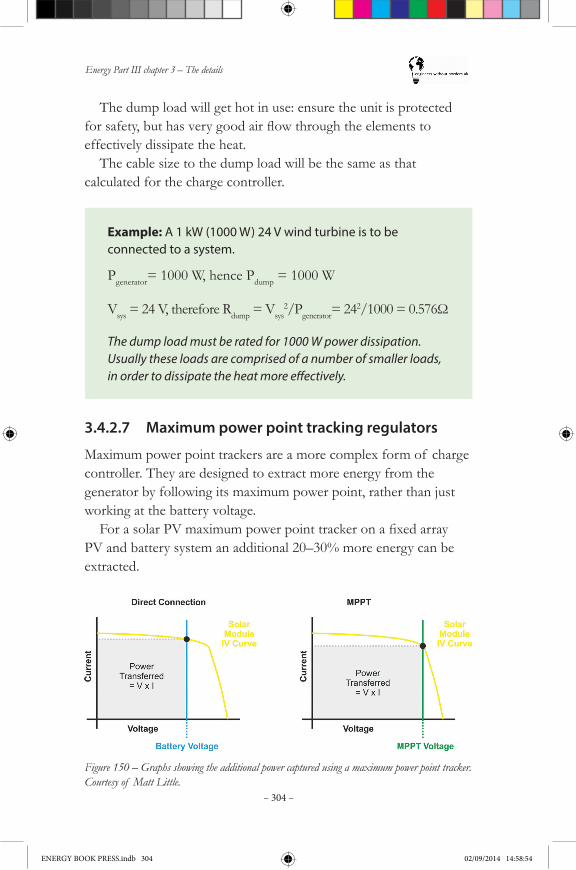
Energy Part III chapter 3 – The details
– 304 –
Example: A 1 kW (1000 W) 24 V wind turbine is to be connected to a system.
Pgenerator= 1000 W, hence Pdump = 1000 W
Vsys = 24 V, therefore Rdump = Vsys2/Pgenerator= 242/1000=0.576Ω
The dump load must be rated for 1000 W power dissipation. Usually these loads are comprised of a number of smaller loads, in order to dissipate the heat more effectively.
3.4.2.7 Maximum power point tracking regulators
Maximum power point trackers are a more complex form of charge controller. They are designed to extract more energy from the generator by following its maximum power point, rather than just working at the battery voltage.ForasolarPVmaximumpowerpointtrackeronafixedarray
PV and battery system an additional 20–30% more energy can be extracted.
The dump load will get hot in use: ensure the unit is protected forsafety,buthasverygoodairflowthroughtheelementstoeffectively dissipate the heat.
The cable size to the dump load will be the same as that calculated for the charge controller.
Figure 150 – Graphs showing the additional power captured using a maximum power point tracker. Courtesy of Matt Little.
ENERGY BOOK PRESS.indb 304 02/09/2014 14:58:54

Energy Part III chapter 3 – The details
– 305 –
They utilise DC-to-DC conversion to supply power to the system at the correct voltage. They also include voltage level control to ensure the battery bank does not get over-charged.
These are typically used for solar PV- based SAPS.They have additional cost and complexity, but can extract more
energy from the renewable energy source which may make them economically viable.
ENERGY BOOK PRESS.indb 305 02/09/2014 14:58:54
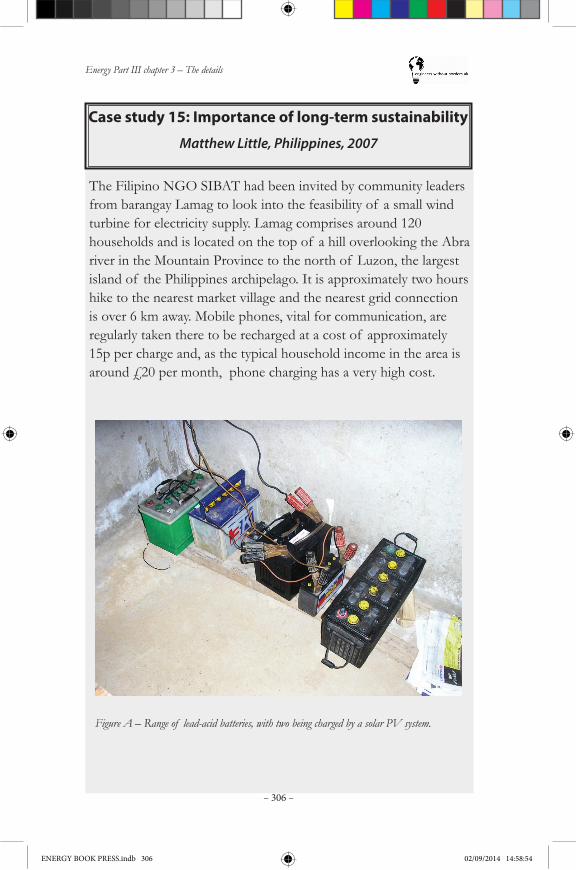
Energy Part III chapter 3 – The details
– 306 –
Case study 15: Importance of long-term sustainability
Matthew Little, Philippines, 2007
The Filipino NGO SIBAT had been invited by community leaders from barangay Lamag to look into the feasibility of a small wind turbine for electricity supply. Lamag comprises around 120 households and is located on the top of a hill overlooking the Abra river in the Mountain Province to the north of Luzon, the largest island of the Philippines archipelago. It is approximately two hours hike to the nearest market village and the nearest grid connection is over 6 km away. Mobile phones, vital for communication, are regularly taken there to be recharged at a cost of approximately 15p per charge and, as the typical household income in the area is around £20 per month, phone charging has a very high cost.
Figure A – Range of lead-acid batteries, with two being charged by a solar PV system.
ENERGY BOOK PRESS.indb 306 02/09/2014 14:58:54
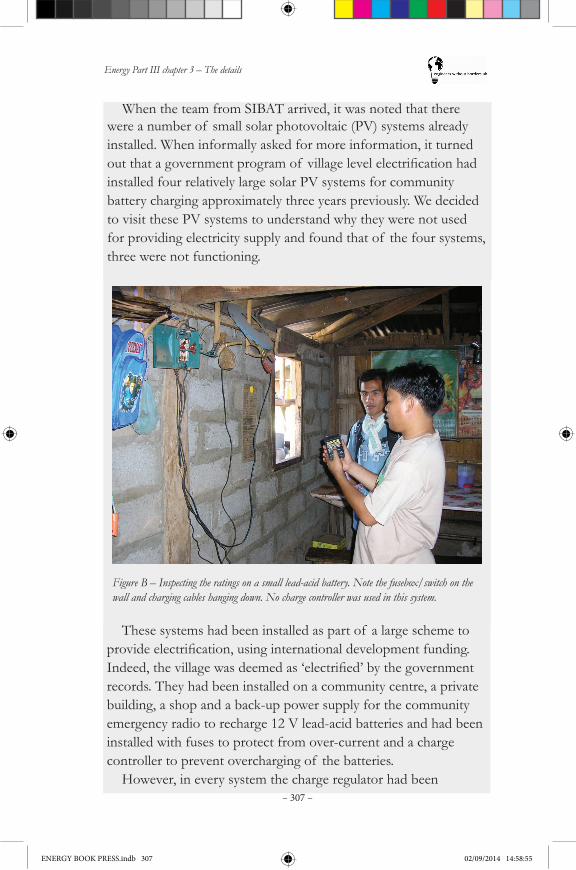
Energy Part III chapter 3 – The details
– 307 –
Figure B – Inspecting the ratings on a small lead-acid battery. Note the fusebox/switch on the wall and charging cables hanging down. No charge controller was used in this system.
These systems had been installed as part of a large scheme to provideelectrification,usinginternationaldevelopmentfunding.Indeed,thevillagewasdeemedas‘electrified’bythegovernmentrecords. They had been installed on a community centre, a private building, a shop and a back-up power supply for the community emergency radio to recharge 12 V lead-acid batteries and had been installed with fuses to protect from over-current and a charge controller to prevent overcharging of the batteries.
However, in every system the charge regulator had been
When the team from SIBAT arrived, it was noted that there were a number of small solar photovoltaic (PV) systems already installed. When informally asked for more information, it turned outthatagovernmentprogramof villagelevelelectrificationhadinstalled four relatively large solar PV systems for community battery charging approximately three years previously. We decided to visit these PV systems to understand why they were not used for providing electricity supply and found that of the four systems, three were not functioning.
ENERGY BOOK PRESS.indb 307 02/09/2014 14:58:55
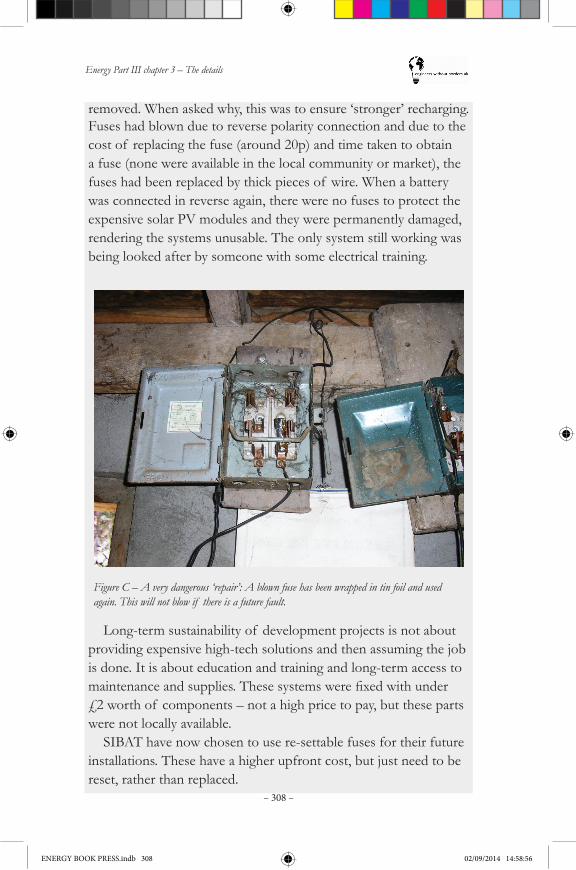
Energy Part III chapter 3 – The details
– 308 –
removed. When asked why, this was to ensure ‘stronger’ recharging. Fuses had blown due to reverse polarity connection and due to the cost of replacing the fuse (around 20p) and time taken to obtain a fuse (none were available in the local community or market), the fuses had been replaced by thick pieces of wire. When a battery was connected in reverse again, there were no fuses to protect the expensive solar PV modules and they were permanently damaged, rendering the systems unusable. The only system still working was being looked after by someone with some electrical training.
Long-term sustainability of development projects is not about providing expensive high-tech solutions and then assuming the job is done. It is about education and training and long-term access to maintenanceandsupplies.Thesesystemswerefixedwithunder£2 worth of components – not a high price to pay, but these parts were not locally available.
SIBAT have now chosen to use re-settable fuses for their future installations. These have a higher upfront cost, but just need to be reset, rather than replaced.
Figure C – A very dangerous ‘repair’: A blown fuse has been wrapped in tin foil and used again. This will not blow if there is a future fault.
ENERGY BOOK PRESS.indb 308 02/09/2014 14:58:56

Energy Part III chapter 3 – The details
– 309 –
We need to ensure that projects are appropriate, give a high level of training to the community and that there are adequate supply chains for replacement parts.
About the author: Matthew Little is an electrical engineer who works on the electrical integration of renewable energy systems. After completing a research project on stand-alone power supply systems, he went on a 12 month EWB-UK placement with SIBAT in the Philippines, working on Small Wind Turbines, solar PV and micro-hydro systems.
About the organisation: Sibol ng Agham at Teknolohiya (SIBAT) are a Filipino NGO that advocates and develops technologies using science and technology that are appropriate for community development for the Filipino people. They work on community-based approaches for sustainable agriculture and renewable energy systems.
ENERGY BOOK PRESS.indb 309 02/09/2014 14:58:56
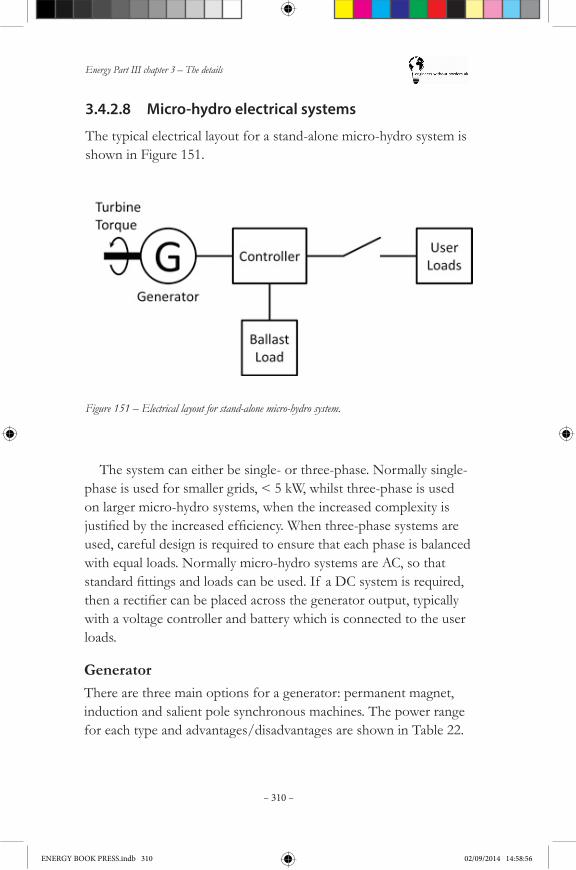
Energy Part III chapter 3 – The details
– 310 –
3.4.2.8 Micro-hydro electrical systems
The typical electrical layout for a stand-alone micro-hydro system is shown in Figure 151.
The system can either be single- or three-phase. Normally single-phase is used for smaller grids, < 5 kW, whilst three-phase is used on larger micro-hydro systems, when the increased complexity is justifiedbytheincreasedefficiency.Whenthree-phasesystemsareused, careful design is required to ensure that each phase is balanced with equal loads. Normally micro-hydro systems are AC, so that standardfittingsandloadscanbeused.If aDCsystemisrequired,thenarectifiercanbeplacedacrossthegeneratoroutput,typicallywith a voltage controller and battery which is connected to the user loads.
Figure 151 – Electrical layout for stand-alone micro-hydro system.
GeneratorThere are three main options for a generator: permanent magnet, induction and salient pole synchronous machines. The power range for each type and advantages/disadvantages are shown in Table 22.
ENERGY BOOK PRESS.indb 310 02/09/2014 14:58:56
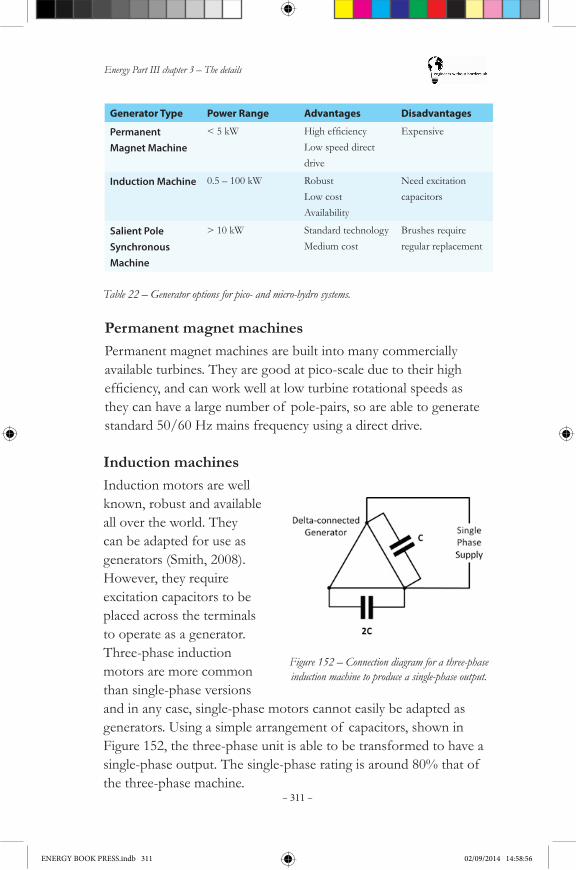
Energy Part III chapter 3 – The details
– 311 –
Generator Type Power Range Advantages Disadvantages
Permanent Magnet Machine
< 5 kW HighefficiencyLow speed direct drive
Expensive
Induction Machine 0.5 – 100 kW RobustLow costAvailability
Need excitation capacitors
Salient Pole Synchronous Machine
> 10 kW Standard technologyMedium cost
Brushes require regular replacement
Table 22 – Generator options for pico- and micro-hydro systems.
Permanent magnet machinesPermanent magnet machines are built into many commercially available turbines. They are good at pico-scale due to their high efficiency,andcanworkwellatlowturbinerotationalspeedsasthey can have a large number of pole-pairs, so are able to generate standard 50/60 Hz mains frequency using a direct drive.
Induction machinesInduction motors are well known, robust and available all over the world. They can be adapted for use as generators (Smith, 2008). However, they require excitation capacitors to be placed across the terminals to operate as a generator. Three-phase induction motors are more common than single-phase versions and in any case, single-phase motors cannot easily be adapted as generators. Using a simple arrangement of capacitors, shown in Figure 152, the three-phase unit is able to be transformed to have a single-phase output. The single-phase rating is around 80% that of the three-phase machine.
Figure 152 – Connection diagram for a three-phase induction machine to produce a single-phase output.
ENERGY BOOK PRESS.indb 311 02/09/2014 14:58:56

Energy Part III chapter 3 – The details
– 312 –
Salient pole synchronous machines typically have inbuilt voltage controllers, known as Automatic Voltage Regulators (AVR). They require excitation for the rotor, which is normally achieved through slip rings and brushes which need replacing during the life of the machine.
Controller and ballast loadThe controller is used to regulate the output of the generator.
There are a number of ways to control and maintain a reasonable power quality (voltage and frequency):
Human operator
•Human operator monitors the power demand and controls the flowvalvetoregulatetheoutputpower.
•Requires full time operator which is costly, boring and a human operator may not react quickly enough.
Mechanicalflowcontrol
•Flow is controlled via a mechanical control to follow the load.
•The main problem is the slow response and additional expensive mechanical requirements.
Electronic load control•Settheflowrateanduseanelectronicallycontrolledballastloadto
dump excess power and follow the load
•Fast response.
•Requires relatively complex power electronics.
•Different controllers are required for synchronous machines and induction machines.
Unless there is a very good reason, then electronic load control should always be used.
The controller uses the ballast load to keep the overall load on the generator constant, allowing the turbine to rotate at a constant
ENERGY BOOK PRESS.indb 312 02/09/2014 14:58:56
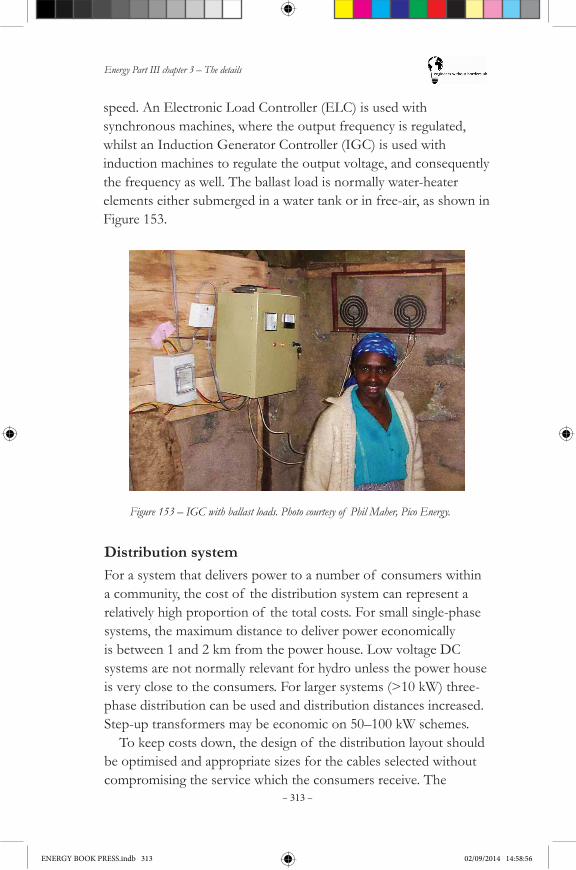
Energy Part III chapter 3 – The details
– 313 –
Figure 153 – IGC with ballast loads. Photo courtesy of Phil Maher, Pico Energy.
Distribution systemFor a system that delivers power to a number of consumers within a community, the cost of the distribution system can represent a relatively high proportion of the total costs. For small single-phase systems, the maximum distance to deliver power economically is between 1 and 2 km from the power house. Low voltage DC systems are not normally relevant for hydro unless the power house is very close to the consumers. For larger systems (>10 kW) three-phase distribution can be used and distribution distances increased. Step-up transformers may be economic on 50–100 kW schemes.
To keep costs down, the design of the distribution layout should be optimised and appropriate sizes for the cables selected without compromising the service which the consumers receive. The
speed. An Electronic Load Controller (ELC) is used with synchronous machines, where the output frequency is regulated, whilst an Induction Generator Controller (IGC) is used with induction machines to regulate the output voltage, and consequently the frequency as well. The ballast load is normally water-heater elements either submerged in a water tank or in free-air, as shown in Figure 153.
ENERGY BOOK PRESS.indb 313 02/09/2014 14:58:56
Energy Part III chapter 3 – The details
– 314 –
parameter that should be minimised is the cost of the distribution; the key constraint is the voltage drop from the power house to the most remote consumer. The limit for voltage drop is usually set at 10% relative to the generator voltage. The generator voltage can be set at 5% above the nominal voltage, so that all consumers are supplied with a voltage within +/- 5% of the nominal. This limit prevents excessive losses in the cables and also ensures that lights and electrical equipment work effectively.
It is also important to have a system to prevent consumers putting large loads onto the system and overloading either cables or generator. One practical method is to use small load limiting circuits(basedonpositivetemperaturecoefficient(PTC)devices)whicharefixedtothedistributionpole,wheretheycannotbeeasilybypassed. Each consumer has a power limit, e.g. 20 or 50 W, and their monthly tariff is based on the rating of their load limiter. If they try to exceed the load, either the voltage falls, or the limiter trips until the load is removed. Some devices also need resetting. The layout of the distribution grid can be designed with the help of computer programmes such as Village Power Optimization Model for Renewables (ViPOR), which is available free from www.homerenergy.com.
User loads The user loads on a typical micro-hydro system are lighting, televisions, radios, mobile phone charging and computers for domestic applications, as well as induction motors (used as motors) for income generation. Many modern domestic loads have a poor powerfactor,especiallycompactfluorescentandLEDlamps.Poor power factor is caused by a phase angle difference between voltage and current, which means that there is a greater current for the same power delivered. This results in additional strain on the generator and increased losses in the distribution system. Care must be also taken when installing induction motors on small systems, asthesecandrawoverfivetimestheratedcurrentonstart-up.Asa rule of thumb, a 10 kW generator can only start a 1 kW motor unless the starting torque is low, such as for driving a fan.
ENERGY BOOK PRESS.indb 314 02/09/2014 14:58:57
Energy Part III chapter 3 – The details
– 315 –
Mechanical driveWhere a drive is required for food processing, it often makes sense to make the power house large enough to house this equipment and to drive it using a mechanical drive from the turbine at times when the electrical load is low. Generators with shaft extensions or additional pulleys and belt drive can be used for this purpose. It enables larger loads to be connected than could be driven from an electric motor, since motors require large starting currents, as explained above. Leaving the generator connected while driving the mechanical load has the advantage of giving better control of the turbine speed.
Safety issuesWhen designing and installing the system, be aware that any voltage above 50 V can give a severe, even fatal, shock. Electrical installation work should be carried out and supervised by adequately trained people. Figure 153 shows a couple of common faults in wiring – the wires from the controller to the ballast are not attached to the wall, so could easily be accidentally snagged; also the terminals on the heater elements have not been insulated, even though they are within easy reach.
Basic safety procedures should be followed to prevent accidental shock, such as disconnecting the supply and putting a label on the main switch when working elsewhere. The system should be adequately earthed and it is good practice to install a residual current device (RCD) otherwise known as an earth leakage circuit breaker (ELCB). This will trip and protect users in case of accidental connection between live parts of equipment and earth. In many countries it will also be advisable to add some lightning protection to prevent lightning strikes from damaging equipment and causing firehazards.Finally,beawareof safetyissuesduringconstruction,as hydro sites often involve working on sloping ground or near water, and some components can be heavy.
ENERGY BOOK PRESS.indb 315 02/09/2014 14:58:57
Energy Part III chapter 3 – The details
– 316 –
3.4.2.9 Low voltage disconnects
If the battery voltage drops too far then we must protect the battery from over-discharge. We can do this by either increasing the generation or reducing the load. If we are reliant upon renewable energy sources we can usually not increase the generator, hence we must reduce the load.
This function could be performed by the system operator who would monitor the system voltage and reduce the load if it is dropping too low. This would need human interaction and very regular monitoring.
A low voltage disconnect (LVD) monitors the system voltage and controls the output loads. If the voltage drops below a certain threshold then the load is disconnected from the battery bank until the voltage has risen to another threshold. This is called ‘hysteresis control’.
Sometimes critical loads, such as refrigeration or lighting, are not controlled by the LVD, but non-critical loads are. This gives the system operators time to adjust usage to maintain the system.
The low voltage disconnect function is often built into the function of the charge controller, but they are also available as separate units.
The current rating of the LVD must be equal to the total load placed on it.
CablesA very important, but often overlooked, aspect of electrical system design is the correct sizing of cables. As there are many cables to the different components, the calculations for sizing cables will be repeated many times. This section shows the calculation steps required to correctly size a DC cable at a given voltage and power rating. Also the various types of cable available and their features and ratings will be discussed here.
We will also look at making good cable connections.
ENERGY BOOK PRESS.indb 316 02/09/2014 14:58:57
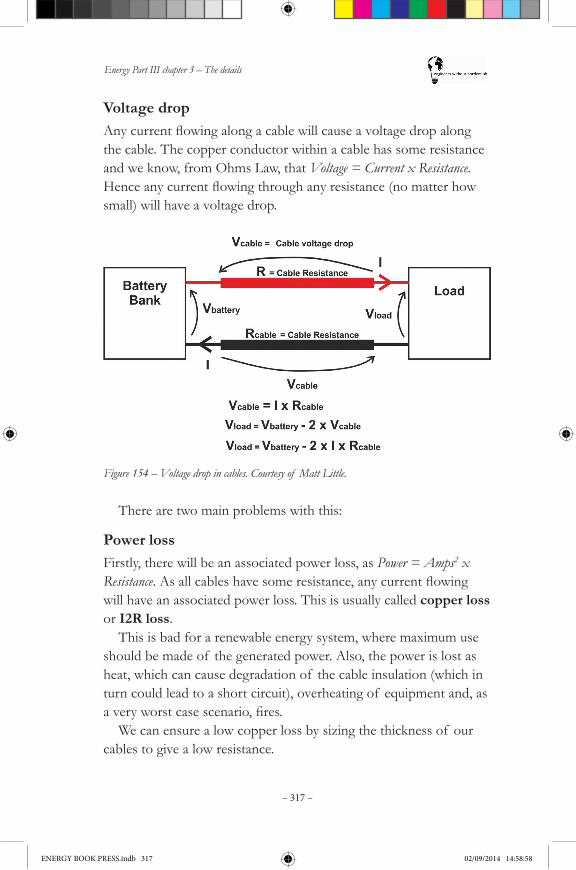
Energy Part III chapter 3 – The details
– 317 –
Voltage dropAnycurrentflowingalongacablewillcauseavoltagedropalongthe cable. The copper conductor within a cable has some resistance and we know, from Ohms Law, that Voltage = Current x Resistance. Henceanycurrentflowingthroughanyresistance(nomatterhowsmall) will have a voltage drop.
Figure 154 – Voltage drop in cables. Courtesy of Matt Little.
There are two main problems with this:
Power lossFirstly, there will be an associated power loss, as Power = Amps2 x Resistance.Asallcableshavesomeresistance,anycurrentflowingwill have an associated power loss. This is usually called copper loss or I2R loss.
This is bad for a renewable energy system, where maximum use should be made of the generated power. Also, the power is lost as heat, which can cause degradation of the cable insulation (which in turn could lead to a short circuit), overheating of equipment and, as averyworstcasescenario,fires.
We can ensure a low copper loss by sizing the thickness of our cables to give a low resistance.
ENERGY BOOK PRESS.indb 317 02/09/2014 14:58:58
Energy Part III chapter 3 – The details
– 318 –
Reduced voltageSecondly, if the voltage drop is too high, some system components will not function correctly. For example, if the voltage drop is 2 V in a 12 V system, the device will only ‘see’ 10 V. This may cause the device to function incorrectly.
Due to the relatively low voltages used in battery-based renewable energy systems, coupled with quite high powers, the currents flowingthroughthecablescanbeveryhigh(rememberpower= voltage x current). This means that voltage drop can be a very serious problem.
Cables should always be correctly sized to ensure a low voltage drop. Typically the cable should be sized to ensure a cable drop of less that 5%, although this must be reviewed in every situation.
Voltage drop calculationThe voltage drop can be calculated using the size and length of the cable, the resistance of copper and the current, using the equation:
Resistance = (ρ x L) / AWhere ρ is the resistivity of copper, L is the length of the cable run and A is the cross-sectional area of the copper in the cable.
The resistivity of copper (ρ) is a function of temperature, hence the approximate ambient temperature (tambient) of the system should also be known, along with a resistivity at a known temperature (tknown).
The resistivity at the ambient temperature can then be calculated from the equation:
ρambient = ρknown (1+((tambient - tknown) x c )),
where c is a constant which depends upon the conductor material. Usually copper cables are used, in which case c = 0.00323. Once ρambient has been calculated, it can be used for all the cable sizing calculations. A typical value of ρknown = 1.724 x 10⁻⁸Ωm at 20ºC, hence ρambient = 1.668 x 10⁻⁸Ωmat30ºC.Inalltheequations that follow, the symbol ρ is used to denote ρambient.
ENERGY BOOK PRESS.indb 318 02/09/2014 14:58:58

Energy Part III chapter 3 – The details
– 319 –
Quick cable sizingTypically we try to keep the worst-case voltage drop under 5%. The diagram below shows the current carrying capacity and maximum length of cables to keep the voltage drop under 5%.
Use the graph in Figure 155 to quickly assess the size of cable required for your system.
The voltage drop in one cable will be:
Current x Resistance = I x ((ρ x L) / A)
This voltage drop will occur in both cables, i.e. there will be resistance in both the positive and negative cables supplying the device. Hence the total voltage drop is:
Total voltage drop, Vd
= 2 x Current x Resistance
= 2 x I x ((ρ x L) / A)
The voltage drop is usually expressed as a percentage of the system voltage:
Voltage drop percentage, Vd_% = (Vd / Vsys) x 100
The above equations can be rearranged in terms of the minimum required cross-sectional area, Amin:
Amin = (2 x Imax x ρ x L) / ((Vsys x Vd_%) / 100)
ENERGY BOOK PRESS.indb 319 02/09/2014 14:58:58
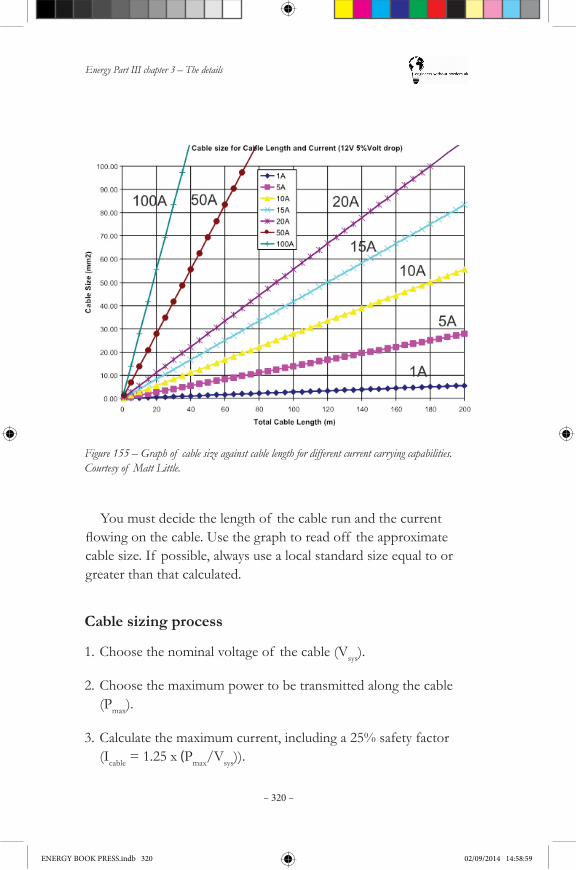
Energy Part III chapter 3 – The details
– 320 –
Figure 155 – Graph of cable size against cable length for different current carrying capabilities. Courtesy of Matt Little.
You must decide the length of the cable run and the current flowingonthecable.Usethegraphtoreadoff theapproximatecable size. If possible, always use a local standard size equal to or greater than that calculated.
Cable sizing process
1. Choose the nominal voltage of the cable (Vsys).
2. Choose the maximum power to be transmitted along the cable (Pmax).
3. Calculate the maximum current, including a 25% safety factor (Icable = 1.25 x (Pmax/Vsys)).
ENERGY BOOK PRESS.indb 320 02/09/2014 14:58:59

Energy Part III chapter 3 – The details
– 321 –
Installation Method Current De-rating Factor
Free cable 1
Cable in conduit 0.7
4. Choose the ambient temperature and hence calculate the resistivity of copper at this temperature (ρ).
5. Measure the length of the cable run (L). The actual cable required will be twice this length (two cables required, positive and negative).
6. Choose the maximum allowable voltage drop as a percentage of the nominal voltage (Vd_%). Typically this is 5%.
7. Use the equation: Amin = (2 x Icable x ρ x L) / ( (Vsys x Vd_%) / 100) to calculate the absolute minimum cross-sectional area of the cable conductor (Amin).
8. Depending upon the cable installation method, there may be a de-rating factor required to stop the cable overheating. The options are:
The cable must be larger if it is installed within conduit, as it will get warmer, hence divide the minimum cross-sectional area (Amin) by the de-rating factor to give the installed minimum cross-sectional area, (Amin_inst).
9. This value can then be compared to lists of standard available conductor sizes, both for metric and AWG (American Wire Gauge). Depending upon the available cables, the closest larger value should be chosen.
Note: Cables can also be placed in parallel to reach the required conductor size. This could save money if, say, just one size cable is ordered and the larger cables are made from using two pieces in parallel. If this technique is used then the cables should be carefully marked, securely fixed and be exactly the same length.
ENERGY BOOK PRESS.indb 321 02/09/2014 14:58:59

Energy Part III chapter 3 – The details
– 322 –
Oversized cables This design process will give the minimum required cable size for the voltage drop. If possible, it is best to oversize the cable.
The advantages of this include: Minimise volt-drop. Less overheating under fault conditions or high currents. Circuits can be added to without up-rating cables (as long as they are still large enough). Simplifiesordering(wholedrumsof cablebeusedforlotsof different circuits).Disadvantages of oversized cables include:x More costly.x Canbemoredifficulttorunduetolackof flexibility.
Types of cableThere are numerous types of cable for use in various installations. The main choices to make are:•the number of strands in the cable, and
•the type of insulation.
10. The cable has now been chosen. It is useful to re-check the maximumvoltagedropandpowerdissipatedbythefinalchosencable, to ensure the values look reasonable.
Number of strands within cableThenumberof strandsaffectstheflexibilityof thecable.Asinglestrandcablewillbefarlessflexiblethanacablewith100strands,but a single strand cable will maintain its shape once installed, whereas a multi-strand cable will not.
ENERGY BOOK PRESS.indb 322 02/09/2014 14:58:59

Energy Part III chapter 3 – The details
– 323 –
Figure 156 – Different cable types. Courtesy of Matt Little.
Solid core cable
Typically cheapest. Will maintain position when installed.x Notflexible,especiallyforthickcables.Thismakesinstallationdifficult.
Few strand cableTypically 7–19 strands. Will maintain position when installed. Mediumflexibilitybutstilldifficulttoworkwiththickcables.
Multiple strand cableTypically more than 20 strands. Veryflexible,evenforthickcables(especiallyweldingtypecable).x Relatively expensive.x Sometimesdifficulttoattachconnectorsduetonumberof strands.
Note:Sourcesof flexible,highcurrent(largecross-sectionalarea) and relatively economical cable include:
•automotive cable
•welding cables.
ENERGY BOOK PRESS.indb 323 02/09/2014 14:59:00

Energy Part III chapter 3 – The details
– 324 –
Cable insulationThe metal wire within a cable is wrapped in some form of insulation. Cables are insulated to provide protection from both electric shock and short circuits and for mechanical protection of the physical cable.
There is a huge variety of cable with very different insulation materials and properties for different applications. The type of cable used depends upon its application, the cost and the availability.The main cable insulation parameters are:
UV ratingUltra-violet light (such as sunlight) can cause damage to some plastic insulation. If the cable is outside or it will be exposed to sun-light then you can either:•choose some form of UV stable cable insulation
•install standard cable within UV stable conduit.
Voltage ratingThe insulation of the cable will have a breakdown voltage. This means if you apply a greater voltage than its breakdown voltage then there is the potential risk of electric shock.
Typically breakdown voltages are in the order of 500 or 1000 V. Generally this is not a problem in low-voltage stand-alone power systems, but for higher voltage systems this must be designed correctly. Any voltage over 55 V is dangerous, so check voltage ratings if your system will have any section with a higher voltage than this.
Temperature ratingHeat causes plastic insulation to degrade quicker. All cables have a temperature rating, above which the cable insulation will start to degrade.Thisisgenerallyanissueif thereisahighcurrentflowingthrough the cable or the cable is installed within some form of conduit which does not allow heat transfer. Typical temperature ratings are 85°C or 105°C.
ENERGY BOOK PRESS.indb 324 02/09/2014 14:59:00

Energy Part III chapter 3 – The details
– 325 –
Double insulatedDouble insulated cables have (unsurprisingly) two layers of insulation. One is to provide electrical protection and one is to provide mechanical protection of the whole cable.
Most solar PV modules come with double insulated cables so they can be integrated into higher voltage DC systems.
The use of double insulated cables or cables run within conduit is advised as this will provide a robust level of protection, even if low voltages are used. Disadvantages of this would be the cost of cable and equipment and the extra time required for installation.
Figure 157 – Double insulated solar PV cable. Photo courtesy of Matt Little.
Cable connectionsNumerous electrical connections will be made within the renewable energy system. It is very important to ensure that all these connections are well made, with very low resistance, high mechanical strength and resistance to corrosion. Weak and badly made electrical connections can seriously affect system performance.
Due to the low voltages and hence relatively high currents, any small resistance will introduce some power loss (remember I2R losses?). In addition, bad connections can become corroded or loose and this will affect system reliability. If a connection fails it may also mean that temporary repairs are made, which could cause other problems.
A renewable energy system should be designed for a 15 to 20 year lifespan – this includes all electrical connections.
There are numerous ways of making electrical connections between two cables. The choice of connector will depend upon locally available parts and skills. Always check local techniques and available equipment. A few typical types of connector are shown in Figure 158. Plugs and sockets for high currents are usually very expensive and not standard, hence are not typically used.
ENERGY BOOK PRESS.indb 325 02/09/2014 14:59:01
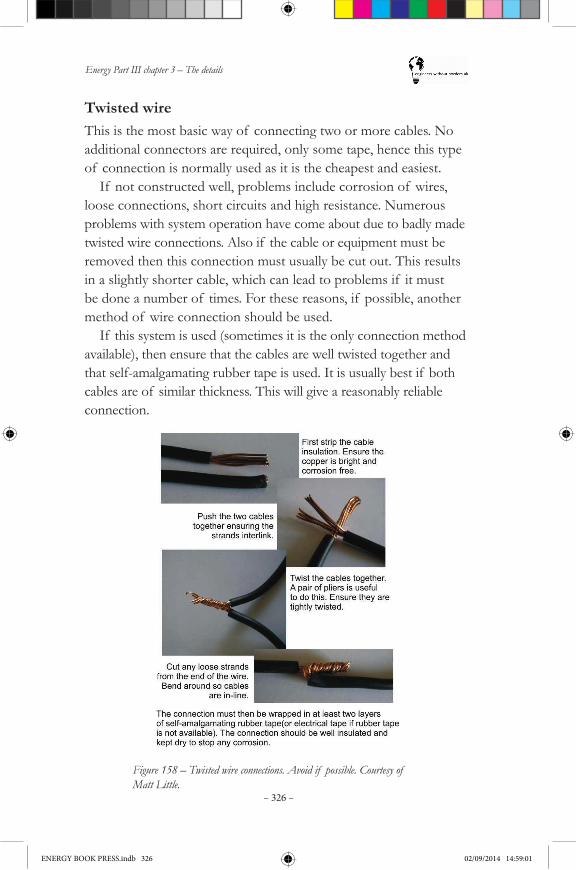
Energy Part III chapter 3 – The details
– 326 –
Twisted wireThis is the most basic way of connecting two or more cables. No additional connectors are required, only some tape, hence this type of connection is normally used as it is the cheapest and easiest.
If not constructed well, problems include corrosion of wires, loose connections, short circuits and high resistance. Numerous problems with system operation have come about due to badly made twisted wire connections. Also if the cable or equipment must be removed then this connection must usually be cut out. This results in a slightly shorter cable, which can lead to problems if it must be done a number of times. For these reasons, if possible, another method of wire connection should be used.
If this system is used (sometimes it is the only connection method available), then ensure that the cables are well twisted together and that self-amalgamating rubber tape is used. It is usually best if both cables are of similar thickness. This will give a reasonably reliable connection.
Figure 158 – Twisted wire connections. Avoid if possible. Courtesy of Matt Little.
ENERGY BOOK PRESS.indb 326 02/09/2014 14:59:01

Energy Part III chapter 3 – The details
– 327 –
Take great care to ensure a conductor is not partially cut when removing the insulation – as this will reduce conductivity.
Connector blockA popular connection method is the use of a connector block. The connector block comprises a number of metal connecting tubes set into plastic. Wires can enter the metal tubes from each side and a metal screw is tightened to hold the wire in place. They are designed mainly for higher voltage AC connections, but high current versions can be found. Ensure the connector block you are using is correctly rated for the current and voltage.
Typically the whole block is encased in tape, although, if within an enclosure, this should not be necessary.
This is a simple, cheap and easily available method for cable connection, which also allows relatively easy disconnection. Some problems do occur including loose connections (a very common problem), broken wires (the wire sometimes bends near the entry point and can break at that point) and problems with corrosion.
Also, if more than two wires are to be connected, then the smaller diameter cable can sometimes fall out as the screw will only hold the larger cable.
The stop any potential problems, ensure that the screws are tightened very well and that it ‘bites’ well onto the cable, ensure the connector block is not ‘wiggled’ too much and that the block is coated with electrical or rubber self-amalgamating tape.
ENERGY BOOK PRESS.indb 327 02/09/2014 14:59:01

Energy Part III chapter 3 – The details
– 328 –
Figure 159 – Connector block connections. Avoid if possible. Photos courtesy of Matt Little.
Bolted ring connectorsThis technique provides a reliable connection which can relatively easily be disconnected. It is also a relatively cheap method which does not require too many additional parts.
The technique involves putting a good quality ring connector onto the end of both cables. These ring connectors can then be bolted together with a standard nut and bolt, along with a spring washer.
ENERGY BOOK PRESS.indb 328 02/09/2014 14:59:01

Energy Part III chapter 3 – The details
– 329 –
Figure 160 – Bolted ring connections. Photos courtesy of Matt Little.
Advantages are that numerous cables can easily be connected together, the cables can be relatively easily disconnected and a good electrical connection is made. Good quality ring connectors with a thick metal ring must be used. The cable must be well crimped into the connector (and soldered if the facilities are available).
The whole connection must be covered in rubber, self-amalgamating tape to provide a layer of electrical insulation and somewaterproofing.Oneproblemisthatthistapemustbecutoff if the cable must be disconnected, although the same problem occurs with most connection methods.
ENERGY BOOK PRESS.indb 329 02/09/2014 14:59:02
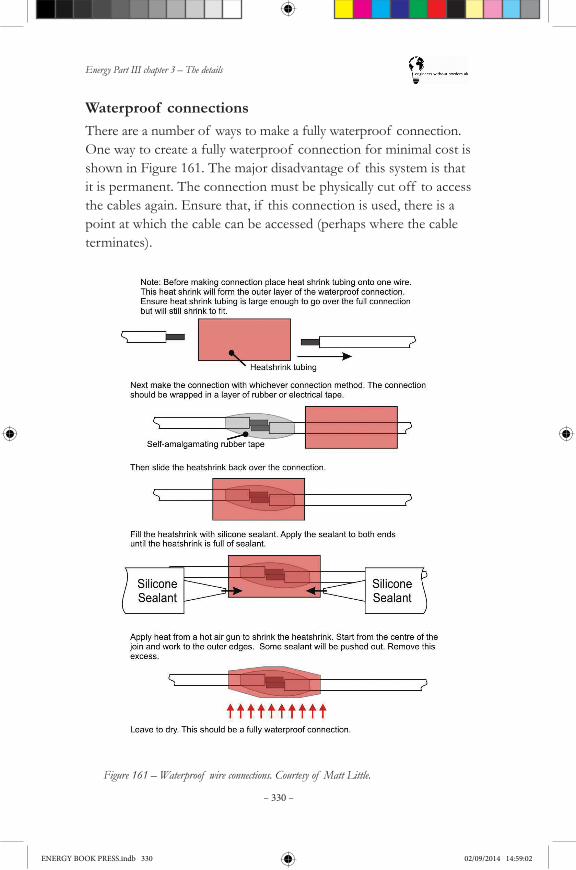
Energy Part III chapter 3 – The details
– 330 –
Waterproof connectionsThere are a number of ways to make a fully waterproof connection. One way to create a fully waterproof connection for minimal cost is shown in Figure 161. The major disadvantage of this system is that it is permanent. The connection must be physically cut off to access the cables again. Ensure that, if this connection is used, there is a point at which the cable can be accessed (perhaps where the cable terminates).
Figure 161 – Waterproof wire connections. Courtesy of Matt Little.
ENERGY BOOK PRESS.indb 330 02/09/2014 14:59:02
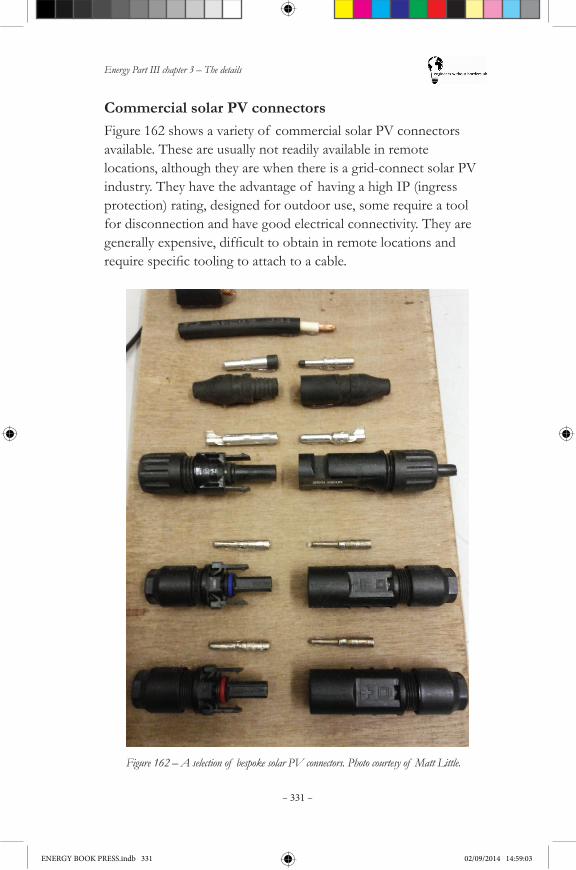
Energy Part III chapter 3 – The details
– 331 –
Commercial solar PV connectorsFigure 162 shows a variety of commercial solar PV connectors available. These are usually not readily available in remote locations, although they are when there is a grid-connect solar PV industry. They have the advantage of having a high IP (ingress protection) rating, designed for outdoor use, some require a tool for disconnection and have good electrical connectivity. They are generallyexpensive,difficulttoobtaininremotelocationsandrequirespecifictoolingtoattachtoacable.
Figure 162 – A selection of bespoke solar PV connectors. Photo courtesy of Matt Little.
ENERGY BOOK PRESS.indb 331 02/09/2014 14:59:03

Energy Part III chapter 3 – The details
– 332 –
Bus bars and multi-wire connectionsAnother technique to connect a number of cables together is to use bus bars.
These are metal bars which have a number of threaded connection points where various cable lugs can be attached.
Using bus bars is a very good way of keeping the electrical system ordered and adaptable.
Generally there will be two bus bars (one positive and one negative) attached (via over-current protection devices) to the battery terminals.Thesewillbeseparatedtoensurethatitisdifficulttoshort the two bars together (for example, with a dropped spanner).
As there are numerous connection points all the generators and loads can be connected to different terminals which makes fault findingandremovalof adeviceveryeasy.
The bus bar should be rated for the maximum system current, Imax, or higher.
Place the bus bars close to, but not directly above (due to spark and hydrogen gas explosion risk) the battery bank.
Long distribution cablesSometimes the generation equipment (typically wind turbines and hydro plant) must be sited a relatively long distances (over 100 m) from the load they must supply (e.g. the community).
If possible site the generator as close as possible to the load. This will minimise the cost of the project both in terms of cost of the cables and losses.
If it is not possible then there are a number of techniques that could be used to transmit the power. The various options and their features are discussed here.
ENERGY BOOK PRESS.indb 332 02/09/2014 14:59:03
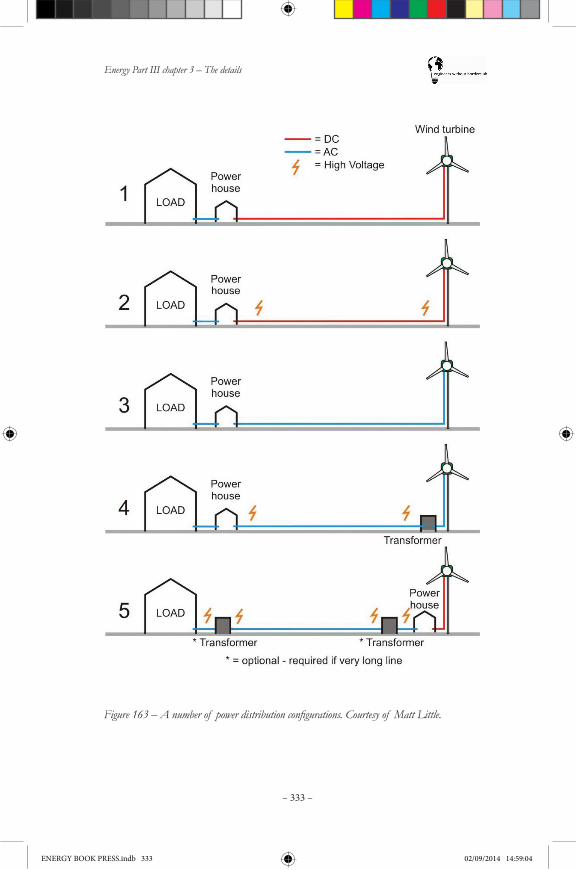
Energy Part III chapter 3 – The details
– 333 –
Figure 163 – A number of power distribution configurations. Courtesy of Matt Little.
ENERGY BOOK PRESS.indb 333 02/09/2014 14:59:04

Energy Part III chapter 3 – The details
– 334 –
1. Low voltage DC cable
•The most obvious technique would be to run a long, low voltage (i.e. 12 to 48 V DC) cable. The powerhouse would be located close to the load.
•The advantages of this include:
◊ Simple.
◊ Requires no additional complex equipment.
◊ Powerhouse close to load which is usually close to the community.
•Disadvantages include:
◊ Either very high losses within cables (this is due to the high currents and the resistive losses).
◊ Or very expensive, thick cables required.
2. High voltage DC cable.
•The voltage generated by the stator could be much higher. This could be adjusted by increasing the number of turns in the coils within the stator. The powerhouse is located near the load. Depending upon the voltage of the storage system (if lead acid batteries are used) some form of DC to DC converter might be required.
•The advantages of this include:
◊ Higher voltage, hence thinner cheaper wires can be used.
◊ Adjusting stator voltage at the design stage if manufacturing locally has virtually zero cost.
•Disadvantages include:
◊ Any voltage above 55 V DC is dangerous. Additional safety measures would have to be in place.
◊ Mustensuretherectifierissuitableforthevoltage.
ENERGY BOOK PRESS.indb 334 02/09/2014 14:59:04

Energy Part III chapter 3 – The details
– 335 –
◊ An additional DC/DC converter may be required which may be non-standard, expensive and introduce more losses.
◊ Generally smaller stand-alone power systems do not need to use higher voltage DC cables due to safety risks and problems with obtaining higher voltage DC-rate equipment.
3. Low voltage AC cable.
•Another technique could be to send the AC output of the stator from the wind turbine to the powerhouse, located close to the load.Therectifierwouldthenbehousedwithinthepowerhouse.
4. High voltage AC cable, powerhouse near load.
•The power house is placed close to the load. The AC generated by the stator is stepped up to a higher AC voltage through a transformer. Another transformer steps down the voltage within the powerhouse.
•The advantages of this include:
◊ High voltage, hence lower cable losses.
◊ Less expensive, thin cables can be used.
•Disadvantages include:
◊ Requires a number of additional transformers.
◊ Transformers must deal with the variable frequency, variable voltage output of the wind turbine. They may need to be specially designed.
5. High voltage AC cable, powerhouse near wind turbine.
•The powerhouse is placed near the wind turbine. The DC cables from the wind turbine are kept short. An inverter is used within the powerhouse. The cable from the powerhouse to the loads would be at the standard output from the inverter.
•The advantages of this include:◊ higher voltage AC, hence thinner, less expensive cables.
ENERGY BOOK PRESS.indb 335 02/09/2014 14:59:04

Energy Part III chapter 3 – The details
– 336 –
◊ Standard voltages, hence standard equipment can be used.
•Disadvantages include:
◊ An inverter is required.
◊ Although may systems would require an inverter already.
◊ Powerhouse could be far from the community which could makeitdifficultfortheoperator.
◊ If the distance is very far then, perhaps, additional transformers are required to step up and step down the voltage.
3.4.2.11 Over-current protection
When short-circuited (the terminals are connected together), batteries can supply incredibly high currents (1000s of amps). Some generators can also provide very high currents during fault conditions.If thereisashortcircuitthentheseveryhighcurrentscanflow
whichcausesthecabletogetveryhotandpotentiallystartafire,orcause damage to other equipment on the system.
To protect against this some form or over-current protection MUST be used.
These are simply and easily available in the form of fuses or circuit breakers.
Within an electrical power system, ALL cables should be protected by over-current protection.
Types of over-current protection devices include:
Figure 164 – Various fuses and circuit breakers for over-current protection. Courtesy of Matt Little.
Note: the range of different sizes and types is incredibly varied.
Note: Over-current protection devices do NOT protect uses or installers from electric shock; they protect the installation from heat andfiredamageduetoover-current.
ENERGY BOOK PRESS.indb 336 02/09/2014 14:59:04

Energy Part III chapter 3 – The details
– 337 –
FusesA fuse contains a thin piece of metal which is designed to melt ataspecificcurrent.Oncethefuse blows then no current can flowwithinthecircuit.Thefuseprotects the cable downstream of the fuse.
The current rating of the fuse must be carefully chosen so that it will not trip in normal operation, but will blow reliably and quickly in the event of an over-current.
Figure 165 – An automotive ‘blade’ type fuse. Photo courtesy of Matt Little.
Cartridge fusesTypically used as the main fuse for AC household supplies (shown here):
Many different types and sizes available. Relatively cheap.x Must be replaced when they blow.
Automotive-type ‘blade’ fusesSimilar to cartridge type fuses but usually used in DC automotive applications:
Cheap and readily available. Cheap for medium current ratings. Suitable for low voltage DC systems.x Must be replaced when they blow.x Typically not manufactured to a good tolerance.x Difficulttofindfuseholders–perhapstryautomotivesuppliers.
Circuit breakersCircuit breakers are electro-mechanical devices which are also designed to disconnect in the event of an over-current condition. Circuit breakers have a set of contacts which are opened when a
ENERGY BOOK PRESS.indb 337 02/09/2014 14:59:05
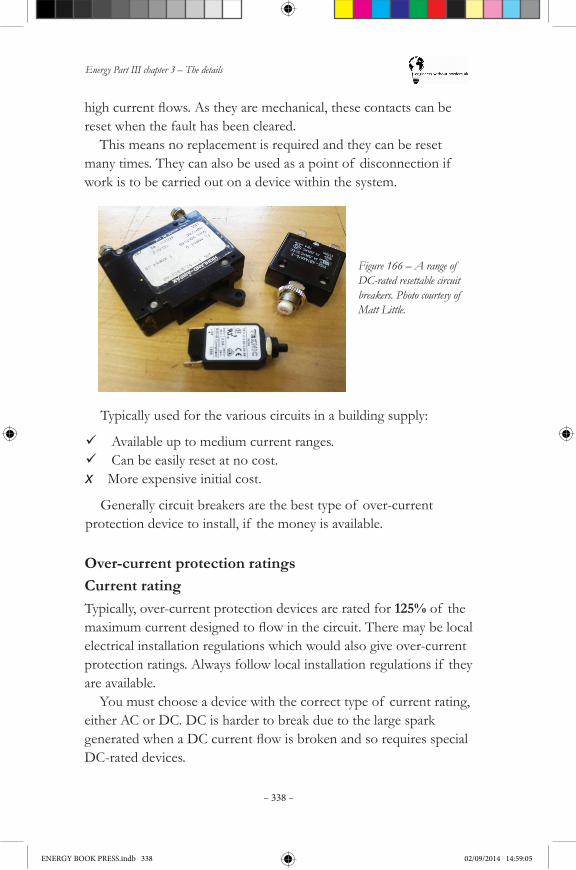
Energy Part III chapter 3 – The details
– 338 –
Figure 166 – A range of DC-rated resettable circuit breakers. Photo courtesy of Matt Little.
Typically used for the various circuits in a building supply:
Available up to medium current ranges. Can be easily reset at no cost.x More expensive initial cost.
Generally circuit breakers are the best type of over-current protection device to install, if the money is available.
Over-current protection ratingsCurrent ratingTypically, over-current protection devices are rated for 125% of the maximumcurrentdesignedtoflowinthecircuit.Theremaybelocalelectrical installation regulations which would also give over-current protection ratings. Always follow local installation regulations if they are available.
You must choose a device with the correct type of current rating, either AC or DC. DC is harder to break due to the large spark generatedwhenaDCcurrentflowisbrokenandsorequiresspecialDC-rated devices.
highcurrentflows.Astheyaremechanical,thesecontactscanbereset when the fault has been cleared.
This means no replacement is required and they can be reset many times. They can also be used as a point of disconnection if work is to be carried out on a device within the system.
ENERGY BOOK PRESS.indb 338 02/09/2014 14:59:05
Energy Part III chapter 3 – The details
– 339 –
Example: A load of 23 A would require a fuse of 23 A x 1.25 = 28.75 A. The next standard size is 30 A, so a 30 A fuse would be used in this situation.
Voltage ratingThe over-current protection device must be rated at the correct voltage.
If AC fuses (with no DC voltage rating) are used within a DC system, then their AC current rating must be either:•Twice the required DC current value (i.e. Ifuse_AC = 2 x Ifuse), or
•Two AC fuses, rated at the required DC current level, can be used, one in each line, positive and negative (i.e. two fuses or a double pole breaker is required).
Note: Good sources of low-voltage DC fuses are automotive supplies, which stock 12 V DC items for cars and 24 V DC items for trucks.
Over-current protection installationTheover-currentprotectiondeviceshouldbefittedasclosetothesupply (in this case, the battery) as possible in order to protect the whole length of the cable.
Cable size should never be reduced unless an over-current protectiondeviceisfitted.Thecablesizefromtheoutputof theover-current protection device can then be reduced, as long as it is correctly sized for the over-current protection device rating.If possibleover-currentprotectiondevicesshouldbefittedin
both the positive and negative cables, directly from the battery. If thisisnotfeasible,over-currentprotectionshouldbefittedin
the positive line.
DC load branchesOften, the maximum DC load is comprised of a number of smaller DC loads. It is advisable to break the loads into small ‘branches’
ENERGY BOOK PRESS.indb 339 02/09/2014 14:59:05
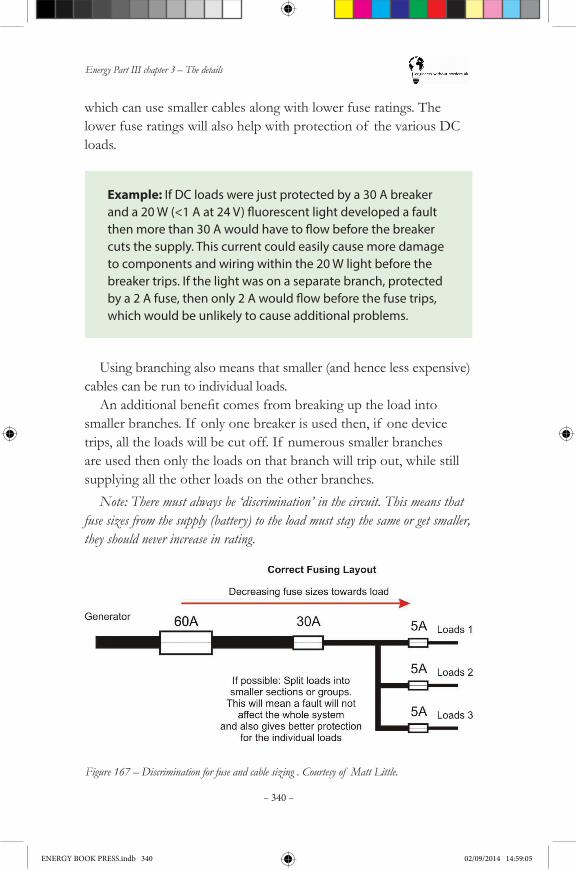
Energy Part III chapter 3 – The details
– 340 –
Example: If DC loads were just protected by a 30 A breaker and a 20 W (<1 A at 24 V) fluorescent light developed a fault then more than 30 A would have to flow before the breaker cuts the supply. This current could easily cause more damage to components and wiring within the 20 W light before the breaker trips. If the light was on a separate branch, protected by a 2 A fuse, then only 2 A would flow before the fuse trips, which would be unlikely to cause additional problems.
Using branching also means that smaller (and hence less expensive) cables can be run to individual loads. Anadditionalbenefitcomesfrombreakinguptheloadinto
smaller branches. If only one breaker is used then, if one device trips, all the loads will be cut off. If numerous smaller branches are used then only the loads on that branch will trip out, while still supplying all the other loads on the other branches.
Note: There must always be ‘discrimination’ in the circuit. This means that fuse sizes from the supply (battery) to the load must stay the same or get smaller, they should never increase in rating.
which can use smaller cables along with lower fuse ratings. The lower fuse ratings will also help with protection of the various DC loads.
Figure 167 – Discrimination for fuse and cable sizing . Courtesy of Matt Little.
ENERGY BOOK PRESS.indb 340 02/09/2014 14:59:05
Energy Part III chapter 3 – The details
– 341 –
Fuse problemsGenerally over-current protection devices are robust and reliable. If they have tripped, then always check for the reason why before resetting the device.
Some problems which can occur:
Incorrect replacementIt has been seen many times that, when a fuse blows and a replacement fuse is not available, then the fuse is bypassed in some way – typically with thick wire or tin foil used to short out the blow fuse. This is very dangerous as the fuse is there to protect the equipment installed. This generally leads to more serious problems. Case study 15 shows that the reasons for doing this usually are lack of funds to buy a replacement fuse and lack of access to the correct fuse (in remote areas).
Nuisance trippingSometimes over-current protection devices trip during normal operation, this is called nuisance tripping.
This could be due to the rating of the over-current device being very close to its normal operation, in which case a slightly higher value fuse should be used.
It could also be due to in-rush current. This is a high peak currentwhichflowswhenaloadisfirstswitchedon.Thiscansometimes be enough to trip the over-current device.
Example: When a compressor is first switched on the in-rush currents can be up to ten times the normal operational current for a very brief period.
Special over-current protection devices designed for high in-rush currents can be obtained quite easily. They are usually called ‘slow-blow’ fuses.
ENERGY BOOK PRESS.indb 341 02/09/2014 14:59:05
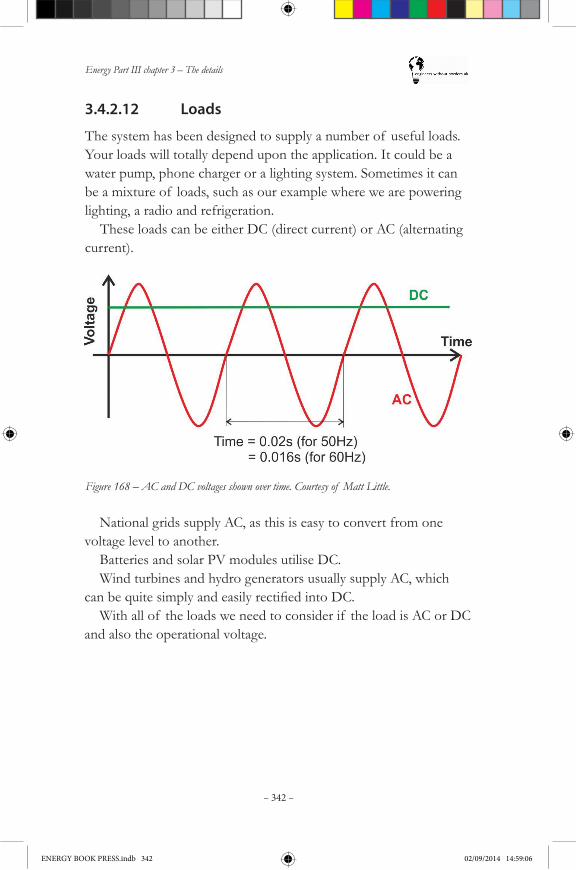
Energy Part III chapter 3 – The details
– 342 –
3.4.2.12 Loads
The system has been designed to supply a number of useful loads. Your loads will totally depend upon the application. It could be a water pump, phone charger or a lighting system. Sometimes it can be a mixture of loads, such as our example where we are powering lighting, a radio and refrigeration.
These loads can be either DC (direct current) or AC (alternating current).
Figure 168 – AC and DC voltages shown over time. Courtesy of Matt Little.
National grids supply AC, as this is easy to convert from one voltage level to another.
Batteries and solar PV modules utilise DC.Wind turbines and hydro generators usually supply AC, which
canbequitesimplyandeasilyrectifiedintoDC.With all of the loads we need to consider if the load is AC or DC
and also the operational voltage.
ENERGY BOOK PRESS.indb 342 02/09/2014 14:59:06
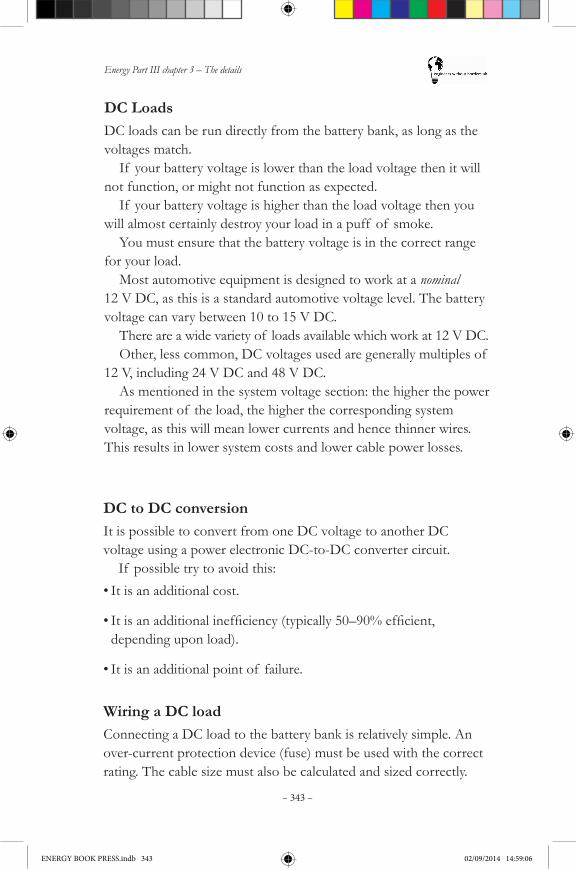
Energy Part III chapter 3 – The details
– 343 –
DC LoadsDC loads can be run directly from the battery bank, as long as the voltages match.
If your battery voltage is lower than the load voltage then it will not function, or might not function as expected.
If your battery voltage is higher than the load voltage then you will almost certainly destroy your load in a puff of smoke.
You must ensure that the battery voltage is in the correct range for your load.
Most automotive equipment is designed to work at a nominal 12 V DC, as this is a standard automotive voltage level. The battery voltage can vary between 10 to 15 V DC.
There are a wide variety of loads available which work at 12 V DC.Other, less common, DC voltages used are generally multiples of
12 V, including 24 V DC and 48 V DC.As mentioned in the system voltage section: the higher the power
requirement of the load, the higher the corresponding system voltage, as this will mean lower currents and hence thinner wires. This results in lower system costs and lower cable power losses.
DC to DC conversionIt is possible to convert from one DC voltage to another DC voltage using a power electronic DC-to-DC converter circuit.
If possible try to avoid this:•It is an additional cost.
•Itisanadditionalinefficiency(typically50–90%efficient,depending upon load).
•It is an additional point of failure.
Wiring a DC loadConnecting a DC load to the battery bank is relatively simple. An over-current protection device (fuse) must be used with the correct rating. The cable size must also be calculated and sized correctly.
ENERGY BOOK PRESS.indb 343 02/09/2014 14:59:06
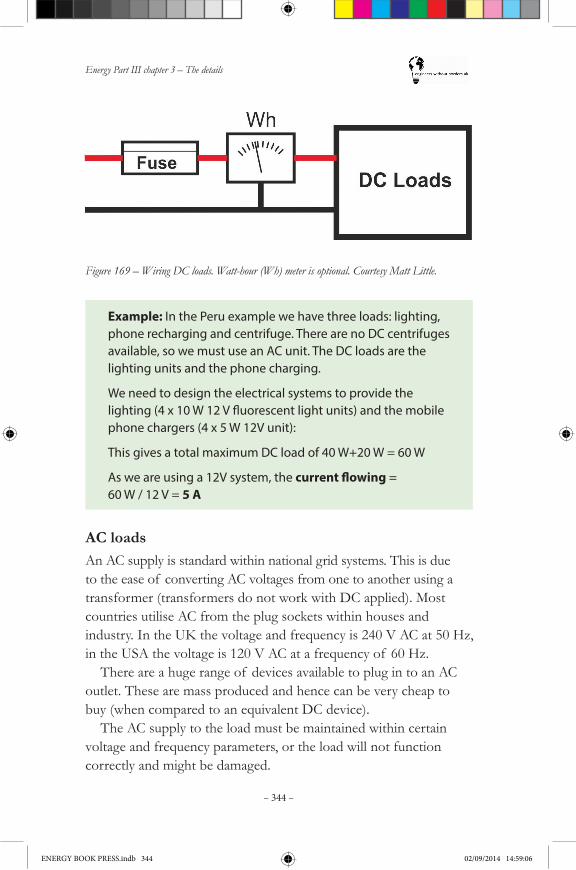
Energy Part III chapter 3 – The details
– 344 –
Figure 169 – Wiring DC loads. Watt-hour (Wh) meter is optional. Courtesy Matt Little.
Example: In the Peru example we have three loads: lighting, phone recharging and centrifuge. There are no DC centrifuges available, so we must use an AC unit. The DC loads are the lighting units and the phone charging.
We need to design the electrical systems to provide the lighting (4 x 10 W 12 V fluorescent light units) and the mobile phone chargers (4 x 5 W 12V unit):
This gives a total maximum DC load of 40 W+20 W = 60 W
As we are using a 12V system, the current flowing = 60 W / 12 V = 5 A
AC loadsAn AC supply is standard within national grid systems. This is due to the ease of converting AC voltages from one to another using a transformer (transformers do not work with DC applied). Most countries utilise AC from the plug sockets within houses and industry. In the UK the voltage and frequency is 240 V AC at 50 Hz, in the USA the voltage is 120 V AC at a frequency of 60 Hz.
There are a huge range of devices available to plug in to an AC outlet. These are mass produced and hence can be very cheap to buy (when compared to an equivalent DC device).
The AC supply to the load must be maintained within certain voltage and frequency parameters, or the load will not function correctly and might be damaged.
ENERGY BOOK PRESS.indb 344 02/09/2014 14:59:06

Energy Part III chapter 3 – The details
– 345 –
We are looking at battery bank systems which are DC. In order to change the battery bank DC voltage into an AC voltage and frequency for the load we need to use a power electronic device called an inverter.
InvertersAn inverter is a power electronic device that changes a DC input voltage into the correct AC output voltage and frequency.
Inverters are rated in terms of their output power, input voltage, the output voltage and frequency and the ‘type’ of AC output.
Obviously the input voltage must be the same as the system voltage. Indeed, the availability of a suitable inverter may have influencedthechoiceof systemvoltageinthefirstplace.
All PV systems were off-grid in the early years of the industry, but subsidies for grid-connection (among other factors) has drastically reduced the focus on stand-alone solutions. The value of off-grid systems has not changed, but grid-connection has dominated to the point that even ‘PV engineers’ often have little or no design knowledge of off-grid systems.
A consequence of this is the widespread tendency to include inverters into off-grid systems. For a wide range of applications they are not only unnecessary, but can drastically reduce reliability and increasecosts.Takecarewhenresearching‘standardconfigurations’forsystemsolutions.Pleasesee3.1.3:Energyefficiency,formoreinformation.
Sizing an inverterThe maximum AC load, Ploads_AC_max, comes from the load assessment. The inverter output power rating must be able to supply this maximum load hence Ploads_AC_max will determine the minimum output power rating. Inverters are only available in certain output power ratings. Hence choose the next available size up, Pinv.
The output voltage and frequency will be determined by the available loads. Usually this is the same as the local grid supply voltage and frequency as compatible AC loads are readily available at low cost.
ENERGY BOOK PRESS.indb 345 02/09/2014 14:59:06
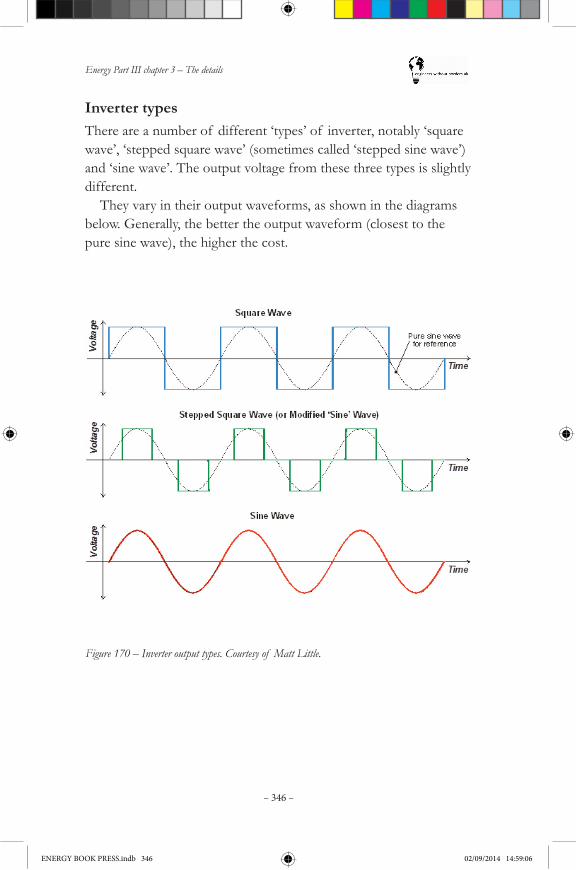
Energy Part III chapter 3 – The details
– 346 –
Inverter typesThere are a number of different ‘types’ of inverter, notably ‘square wave’, ‘stepped square wave’ (sometimes called ‘stepped sine wave’) and ‘sine wave’. The output voltage from these three types is slightly different.
They vary in their output waveforms, as shown in the diagrams below. Generally, the better the output waveform (closest to the pure sine wave), the higher the cost.
Figure 170 – Inverter output types. Courtesy of Matt Little.
ENERGY BOOK PRESS.indb 346 02/09/2014 14:59:06
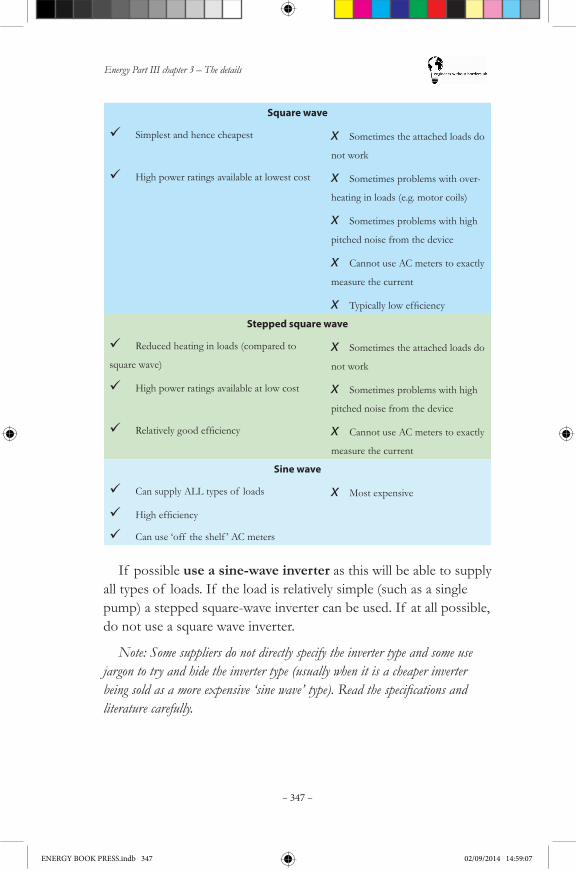
Energy Part III chapter 3 – The details
– 347 –
Square wave
Simplest and hence cheapest x Sometimes the attached loads do
not work
High power ratings available at lowest cost x Sometimes problems with over-
heating in loads (e.g. motor coils)
x Sometimes problems with high
pitched noise from the device
x Cannot use AC meters to exactly
measure the current
x Typicallylowefficiency
Stepped square wave
Reduced heating in loads (compared to
square wave)
x Sometimes the attached loads do
not work
High power ratings available at low cost x Sometimes problems with high
pitched noise from the device
Relativelygoodefficiency x Cannot use AC meters to exactly
measure the current
Sine wave
Can supply ALL types of loads x Most expensive
Highefficiency
Can use ‘off the shelf ’ AC meters
If possible use a sine-wave inverter as this will be able to supply all types of loads. If the load is relatively simple (such as a single pump) a stepped square-wave inverter can be used. If at all possible, do not use a square wave inverter.
Note: Some suppliers do not directly specify the inverter type and some use jargon to try and hide the inverter type (usually when it is a cheaper inverter being sold as a more expensive ‘sine wave’ type). Read the specifications and literature carefully.
ENERGY BOOK PRESS.indb 347 02/09/2014 14:59:07
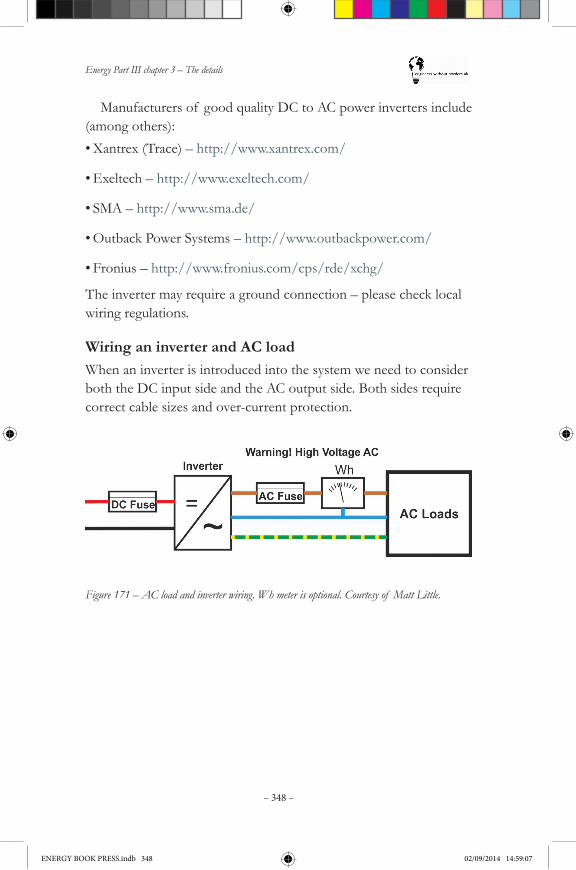
Energy Part III chapter 3 – The details
– 348 –
Wiring an inverter and AC loadWhen an inverter is introduced into the system we need to consider both the DC input side and the AC output side. Both sides require correct cable sizes and over-current protection.
Figure 171 – AC load and inverter wiring. Wh meter is optional. Courtesy of Matt Little.
Manufacturers of good quality DC to AC power inverters include (among others):•Xantrex (Trace) – http://www.xantrex.com/
•Exeltech – http://www.exeltech.com/
•SMA – http://www.sma.de/
•Outback Power Systems – http://www.outbackpower.com/
•Fronius – http://www.fronius.com/cps/rde/xchg/
The inverter may require a ground connection – please check local wiring regulations.
ENERGY BOOK PRESS.indb 348 02/09/2014 14:59:07
Energy Part III chapter 3 – The details
– 349 –
GroundingIf the system includes a higher voltage (e.g. 110 or 240 V) AC section then a system ground is required. This provides a path for current in the event of a fault and ensures that any fuses within the system function correctly. Only one system ground is required from which all ground connections should be made.
A number of techniques can be used to create a system ground including:•Copper grounding rod hammered into the ground.
•Metal rebar of building foundations used to form ground.
Example: The centrifuge is an AC unit which requires a maximum power of 200 W. A stepped-square wave inverter will be used, but only 400 W units are available. We need to design the cable and the over-current protection for the maximum current which may flow in normal operation.So, on the DC side:
400 W / 12 V = 33.3 A The inverter is only 2m from the battery; hence the cable can be 4 mm2
All over-current protection, connectors and switches must be rated for 33.3 A or higher, generally 40 A would be the minimum value used.On the AC side:
400 W / 240 V = 1.66 A
The cable run to the centrifuge is 20 m, but due to the low current, this cable only needs a cross-sectional area of 2.5 mm2. This cable is carrying a dangerous voltage; hence it must be double insulated.
All switch-gear, over-current protection and connectors must be sized for greater than 1.66 A. Typically a 2 A or 3 A fuse would be used.
ENERGY BOOK PRESS.indb 349 02/09/2014 14:59:07
Energy Part III chapter 3 – The details
– 350 –
•Large metal object with high surface area (e.g. car radiator) buried into the ground.
If using any of these techniques, an earth resistance test must be made using a special earth resistance tester (used by all electricians). This applies a voltage and measures the resistance to ensure that, if there is a fault to ground, the resistance is low enough for a current toflowandhenceoperateanyfusesorbreakers.
The ground type (e.g. dry sand or wet earth) must be taken into account, as this will affect the earth resistance readings.Grounding AC systems is a specialist job. The local electrical regulations must be followed with the installation of any system grounding. For this section it is usually best to ask a local electrician.
A thick (typically 10 mm2/6 AWG – again, check the local electrical regulations) earth cable must be connected to the system ground and taken to a point where all the ground connections can be made. Measures should be taken to ensure that this connection is well made and that there will be no corrosion for the lifetime of the system.
Grounding for electrical safety is not the same as grounding for a lightning protection system: two separate systems are required. Lightning protection must divert very high voltages (tens of thousands of volts) to ground as directly as possible. Electrical grounding provides a fault current path, typically at the system voltage, which helps to ensure fuses will blow under fault conditions.
3.4.2.13 Generators
The generators on the system supply the energy for the loads. We are focusing on renewable energy supplies, but this also includes diesel generators. Information on the various renewable energy generators can be found in 2.3: Conversion technologies – the basics. Here we do a short overview of the main design calculations and installation techniques.
ENERGY BOOK PRESS.indb 350 02/09/2014 14:59:07
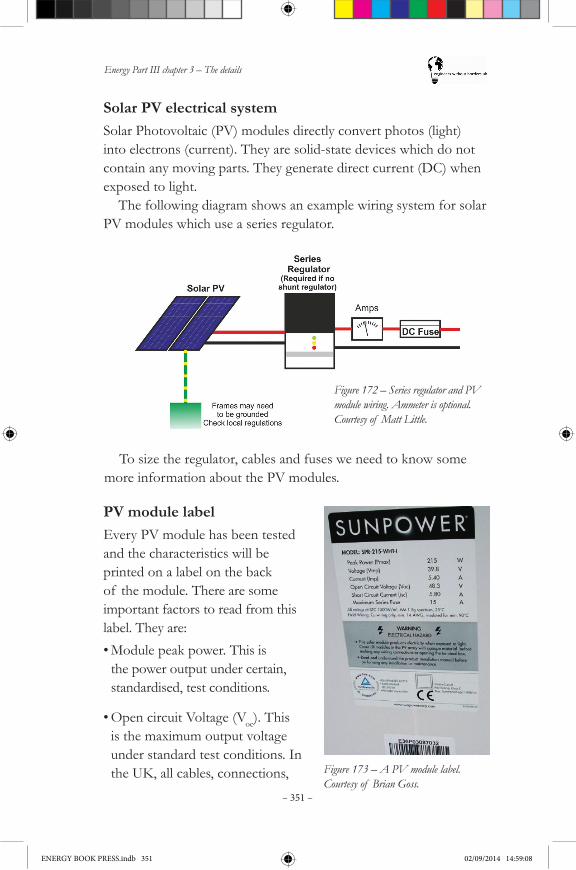
Energy Part III chapter 3 – The details
– 351 –
Solar PV electrical systemSolar Photovoltaic (PV) modules directly convert photos (light) into electrons (current). They are solid-state devices which do not contain any moving parts. They generate direct current (DC) when exposed to light.
The following diagram shows an example wiring system for solar PV modules which use a series regulator.
Figure 172 – Series regulator and PV module wiring. Ammeter is optional. Courtesy of Matt Little.
To size the regulator, cables and fuses we need to know some more information about the PV modules.
PV module labelEvery PV module has been tested and the characteristics will be printed on a label on the back of the module. There are some important factors to read from this label. They are:•Module peak power. This is
the power output under certain, standardised, test conditions.
•Open circuit Voltage (Voc). This is the maximum output voltage under standard test conditions. In the UK, all cables, connections, Figure 173 – A PV module label.
Courtesy of Brian Goss.
ENERGY BOOK PRESS.indb 351 02/09/2014 14:59:08
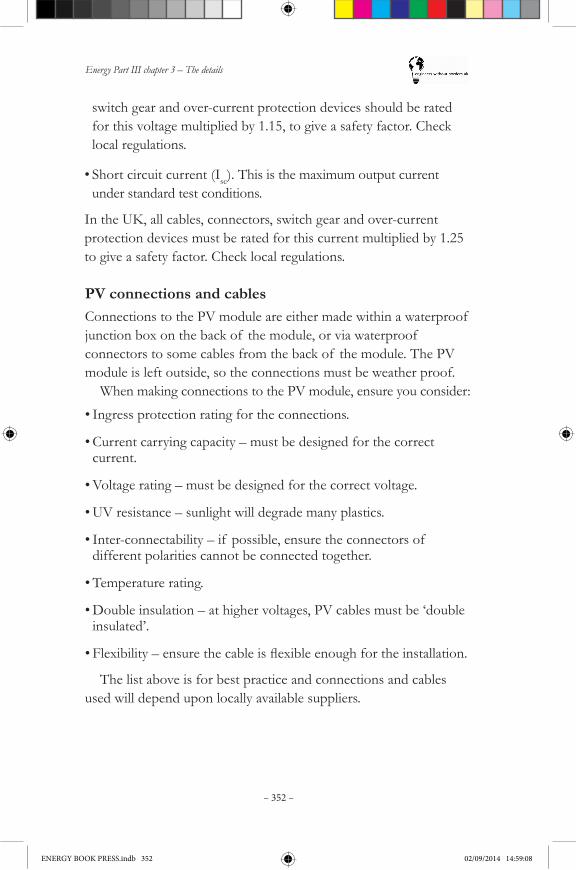
Energy Part III chapter 3 – The details
– 352 –
switch gear and over-current protection devices should be rated for this voltage multiplied by 1.15, to give a safety factor. Check local regulations.
•Short circuit current (Isc). This is the maximum output current under standard test conditions.
In the UK, all cables, connectors, switch gear and over-current protection devices must be rated for this current multiplied by 1.25 to give a safety factor. Check local regulations.
PV connections and cablesConnections to the PV module are either made within a waterproof junction box on the back of the module, or via waterproof connectors to some cables from the back of the module. The PV module is left outside, so the connections must be weather proof.
When making connections to the PV module, ensure you consider:
•Ingress protection rating for the connections.
•Current carrying capacity – must be designed for the correct current.
•Voltage rating – must be designed for the correct voltage.
•UV resistance – sunlight will degrade many plastics.
•Inter-connectability – if possible, ensure the connectors of different polarities cannot be connected together.
•Temperature rating.
•Double insulation – at higher voltages, PV cables must be ‘double insulated’.
•Flexibility–ensurethecableisflexibleenoughfortheinstallation.
The list above is for best practice and connections and cables used will depend upon locally available suppliers.
ENERGY BOOK PRESS.indb 352 02/09/2014 14:59:08
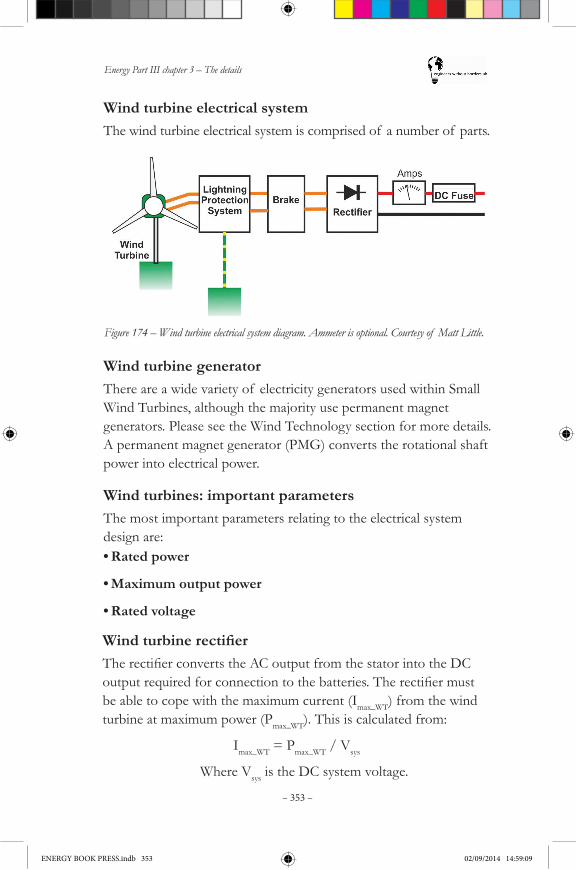
Energy Part III chapter 3 – The details
– 353 –
Wind turbine electrical systemThe wind turbine electrical system is comprised of a number of parts.
Figure 174 – Wind turbine electrical system diagram. Ammeter is optional. Courtesy of Matt Little.
Wind turbine generatorThere are a wide variety of electricity generators used within Small Wind Turbines, although the majority use permanent magnet generators. Please see the Wind Technology section for more details.A permanent magnet generator (PMG) converts the rotational shaft power into electrical power.
Wind turbines: important parametersThe most important parameters relating to the electrical system design are:•Rated power
•Maximum output power
•Rated voltage
WindturbinerectifierTherectifierconvertstheACoutputfromthestatorintotheDCoutputrequiredforconnectiontothebatteries.Therectifiermustbe able to cope with the maximum current (Imax_WT) from the wind turbine at maximum power (Pmax_WT). This is calculated from:
Imax_WT = Pmax_WT / Vsys
Where Vsys is the DC system voltage.
ENERGY BOOK PRESS.indb 353 02/09/2014 14:59:09
Energy Part III chapter 3 – The details
– 354 –
Wind turbine cable sizingThe current used to size the cable should be the maximum current from the wind turbine,
Imax_WT = Pmax_WT / Vsys
with a safety factor of 25% added,
IWT_cbl_min = 1.25 x Imax_WT.
The voltage drop in this cable is less important here for a number of reasons:•The wind turbine can spin slightly faster to generate a higher
voltage to ‘compensate’ for voltage drop and hence charge the battery.
•The wind turbine will only produce the rated maximum power for relatively short periods of time. The losses in the cable are only high when the wind turbine is producing at its maximum power, hence the energy lost due to copper loss in the wind turbine cable will usually be quite low.
•The additional cost of larger cable often does not justify the reduction in energy lost to copper loss.
An acceptable voltage drop is between 10% and 30%, depending upon cable length.
Sometimestherectifierisplacedatthetopof thewindturbinetower to ensure adequate cooling from the wind. Sometimes the rectifierisbuiltintothebodyof thewindturbineunit.
Wind turbine brakeFor a safety measure there must be some way of stopping the wind turbine rotating. This could be in the form of a mechanical brake or, more usually, an electrical brake (see 3.3.2: Small Wind Turbines (SWTs) – the details, for more information).
A wind turbine electrical brake shorts the output from the wind turbinei.e.theoutputvoltageof therectifieriseffectivelyzero.Thismakesthealternatorverydifficulttoturnandeffectivelylimitstherotational speed of the blades. Any power developed is dissipated in
ENERGY BOOK PRESS.indb 354 02/09/2014 14:59:09
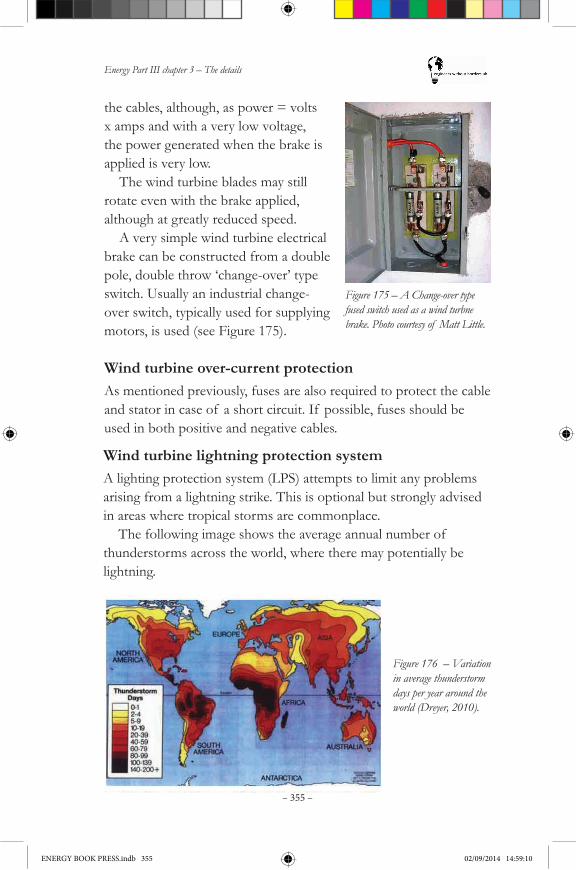
Energy Part III chapter 3 – The details
– 355 –
Figure 175 – A Change-over type fused switch used as a wind turbne brake. Photo courtesy of Matt Little.
Wind turbine over-current protectionAs mentioned previously, fuses are also required to protect the cable and stator in case of a short circuit. If possible, fuses should be used in both positive and negative cables.
Wind turbine lightning protection systemA lighting protection system (LPS) attempts to limit any problems arising from a lightning strike. This is optional but strongly advised in areas where tropical storms are commonplace.
The following image shows the average annual number of thunderstorms across the world, where there may potentially be lightning.
Figure 176 – Variation in average thunderstorm days per year around the world (Dreyer, 2010).
the cables, although, as power = volts x amps and with a very low voltage, the power generated when the brake is applied is very low.
The wind turbine blades may still rotate even with the brake applied, although at greatly reduced speed.
A very simple wind turbine electrical brake can be constructed from a double pole, double throw ‘change-over’ type switch. Usually an industrial change-over switch, typically used for supplying motors, is used (see Figure 175).
ENERGY BOOK PRESS.indb 355 02/09/2014 14:59:10
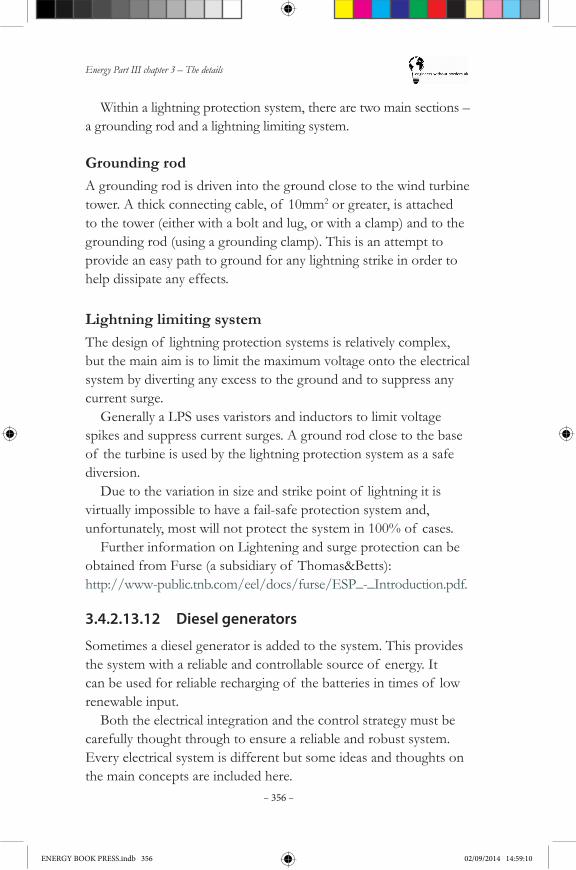
Energy Part III chapter 3 – The details
– 356 –
Within a lightning protection system, there are two main sections – a grounding rod and a lightning limiting system.
Grounding rodA grounding rod is driven into the ground close to the wind turbine tower. A thick connecting cable, of 10mm2 or greater, is attached to the tower (either with a bolt and lug, or with a clamp) and to the grounding rod (using a grounding clamp). This is an attempt to provide an easy path to ground for any lightning strike in order to help dissipate any effects.
Lightning limiting systemThe design of lightning protection systems is relatively complex, but the main aim is to limit the maximum voltage onto the electrical system by diverting any excess to the ground and to suppress any current surge.
Generally a LPS uses varistors and inductors to limit voltage spikes and suppress current surges. A ground rod close to the base of the turbine is used by the lightning protection system as a safe diversion.
Due to the variation in size and strike point of lightning it is virtually impossible to have a fail-safe protection system and, unfortunately, most will not protect the system in 100% of cases.
Further information on Lightening and surge protection can be obtained from Furse (a subsidiary of Thomas&Betts):http://www-public.tnb.com/eel/docs/furse/ESP_-_Introduction.pdf.
3.4.2.13.12 Diesel generators
Sometimes a diesel generator is added to the system. This provides the system with a reliable and controllable source of energy. It can be used for reliable recharging of the batteries in times of low renewable input.
Both the electrical integration and the control strategy must be carefully thought through to ensure a reliable and robust system.Every electrical system is different but some ideas and thoughts on the main concepts are included here.
ENERGY BOOK PRESS.indb 356 02/09/2014 14:59:10
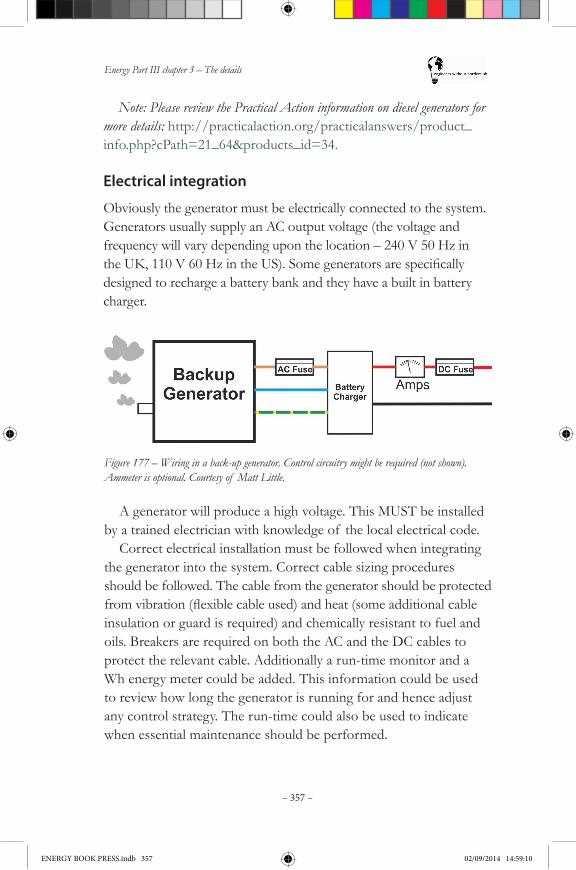
Energy Part III chapter 3 – The details
– 357 –
Electrical integration
Obviously the generator must be electrically connected to the system. Generators usually supply an AC output voltage (the voltage and frequency will vary depending upon the location – 240 V 50 Hz in theUK,110V60HzintheUS).Somegeneratorsarespecificallydesigned to recharge a battery bank and they have a built in battery charger.
Figure 177 – Wiring in a back-up generator. Control circuitry might be required (not shown). Ammeter is optional. Courtesy of Matt Little.
A generator will produce a high voltage. This MUST be installed by a trained electrician with knowledge of the local electrical code.
Correct electrical installation must be followed when integrating the generator into the system. Correct cable sizing procedures should be followed. The cable from the generator should be protected fromvibration(flexiblecableused)andheat(someadditionalcableinsulation or guard is required) and chemically resistant to fuel and oils. Breakers are required on both the AC and the DC cables to protect the relevant cable. Additionally a run-time monitor and a Wh energy meter could be added. This information could be used to review how long the generator is running for and hence adjust any control strategy. The run-time could also be used to indicate when essential maintenance should be performed.
Note: Please review the Practical Action information on diesel generators for more details: http://practicalaction.org/practicalanswers/product_info.php?cPath=21_64&products_id=34.
ENERGY BOOK PRESS.indb 357 02/09/2014 14:59:10
Energy Part III chapter 3 – The details
– 358 –
Sizing generators
Generators are rated in terms of the VA (volt-amps) they can supply. This is the apparent power that the generator can supply, as opposed to the real power, measured in watts (W). Due to power factor (which shows that not all of the apparent power does useful ‘real’ work), it is the apparent power which is the most important value when sizing a generator.
The generator must be sized correctly to recharge the battery bank. The general rule is that a battery should be charged at a current equal to 1/10th to 1/8th of the battery bank Ah capacity.
Example: If the battery capacity is 1000 Ah, then the ideal recharge current for the battery is between 1000/8 = 125 A and 1000/10 = 100 A. This must be supplied at the correct system voltage. If the battery bank is at 24 V then the power supplied to the battery must be 125 A x 24 V = 3000 W.
If used, the power factor of the battery charger must also be taken into account. This would be in the region of 0.8, hence the generator VA rating must be able to supply the real power at the stated power factor. Therefore a generator sized around 3000 / 0.8 = 3750 VA (3.75k VA) is required.
Obviously a larger or smaller generator could be used but this could lead to issues. A generator which is too small might not be able to keep the battery charged when it is required. A generator thatistoolargewouldnotbeefficientasitwouldberunningata low load for the majority of the time and would consume more dieselthanacorrectlysizedunit.Thisisduetothelowefficiencyof a generator at low loading levels, as shown in Figure 178.
ENERGY BOOK PRESS.indb 358 02/09/2014 14:59:10
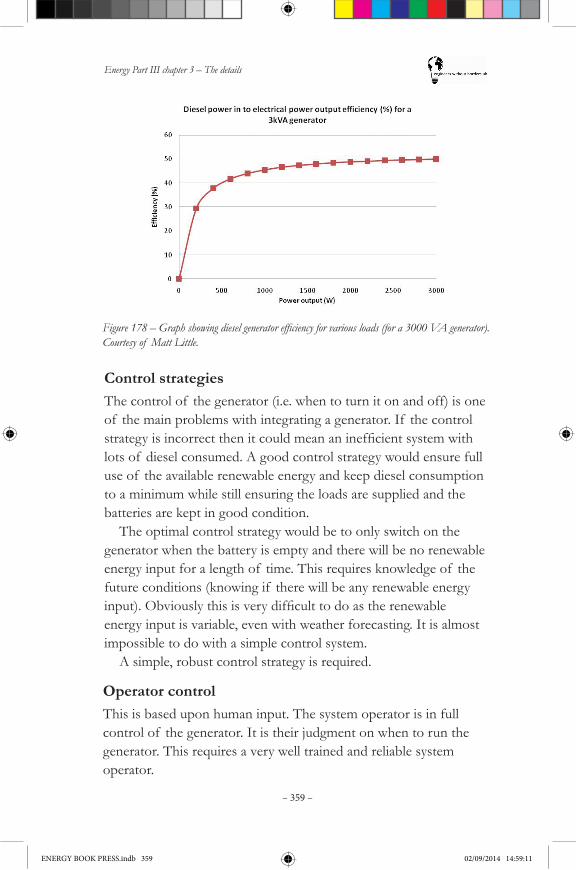
Energy Part III chapter 3 – The details
– 359 –
Figure 178 – Graph showing diesel generator efficiency for various loads (for a 3000 VA generator). Courtesy of Matt Little.
Control strategiesThe control of the generator (i.e. when to turn it on and off) is one of the main problems with integrating a generator. If the control strategyisincorrectthenitcouldmeananinefficientsystemwithlots of diesel consumed. A good control strategy would ensure full use of the available renewable energy and keep diesel consumption to a minimum while still ensuring the loads are supplied and the batteries are kept in good condition.
The optimal control strategy would be to only switch on the generator when the battery is empty and there will be no renewable energy input for a length of time. This requires knowledge of the future conditions (knowing if there will be any renewable energy input).Obviouslythisisverydifficulttodoastherenewableenergy input is variable, even with weather forecasting. It is almost impossible to do with a simple control system.
A simple, robust control strategy is required.
Operator controlThis is based upon human input. The system operator is in full control of the generator. It is their judgment on when to run the generator. This requires a very well trained and reliable system operator.
ENERGY BOOK PRESS.indb 359 02/09/2014 14:59:11

Energy Part III chapter 3 – The details
– 360 –
The advantages of this include: Very adaptable. Can make judgements on future system use. Ensures the system is fully checked before running the generator. Can respond to any problems.
Disadvantages include:x Requires training.x Requires an operator to regularly check the system.
Automatic controlAn automatic control system can remove the need for a system operator, although it will still need to be checked. Based upon various system information (typically battery voltage and currents flowing),someformof electroniccontrolwillstartorstopthegenerator to ensure the loads are supplied and the battery is kept in optimum condition.
There are many ways this can be implemented including various levels of intelligence.
The best strategy is a compromise between intelligence (with associated complexity) and reliability (simpler systems tend to be more robust and hence reliable).
Automatic control requires that the generator has an automatic starter.
A few types of automatic control are explained here.
Timer controlThe generator is controlled by a simple timer. The generator will be switched on at a set time and off at a later time. The generator will then recharge the battery for this time. The generator will run regardless of whether or not the battery is full. This would lead to increased diesel consumption. This loss can be reduced by adjusting the timing to work with the general trend of the renewable energy supply and the loads. For example, if the system is just based upon solar power and the loads are mainly used at night, it would be best to run the generator just after the loads have been used. This would
ENERGY BOOK PRESS.indb 360 02/09/2014 14:59:11
Energy Part III chapter 3 – The details
– 361 –
Voltage controlVoltage control involves looking at the battery bank voltage and using that value to control when to switch on and off the generator. This could also contain some form of timing control.
This type of control can be implemented with various levels of intelligence. The basic control would be to monitor the battery voltage and, at a certain value, the generator is switched on. At a separate voltage value the generator is switched off. Other forms could include monitoring the voltage over time and if the voltage has been too low for a certain length of time then switch on the generator.
The advantages of this include: The generator ought not to run unless the battery is empty. Could be relatively intelligent (but with added complexity).
Disadvantages include:x Various levels of complexity.x Without clever control this could mean that the generator runs to the detriment of renewable energy use (i.e. mainly diesel system rather than mainly renewable energy).
ensure that the generator would run at a high power level (which wouldbemostefficient)asthebatterywouldbeempty.Thesolarpowerwouldthenprovidethefinalchargetoensurethebatteryisfull. Obviously other factors could affect the run-time and it would bealearningactivitytofindthelengthof timethegeneratormustrun for.
The advantages of this include: Simple. Easy.
Disadvantages include:x Generatorcouldrunevenwithafullbattery(i.e.inefficientuseof fuel).x Must still be monitored and adjusted by an operator.
ENERGY BOOK PRESS.indb 361 02/09/2014 14:59:11
Energy Part III chapter 3 – The details
– 362 –
Energy balance controlThis type of control system would look at the energy into the system and the energy out of the system and perform an energy balance calculation. If the loads have consumed more energy than hasbeensupplied(takingintoaccountvarioussysteminefficiencies)then the generator run-time could then be calculated in proportion tothedeficit.
The advantages of this strategy include: Relatively intelligent. Should lead to reduction in diesel consumed if correctly adjusted.
Disadvantages include:x Very complex (hence less robust).x Requiresaccuratemonitoringof powerflowswithinthesystem.
Diesel generators usually need to be started periodically to prevent mechanical seizure and internal corrosion. Manufacturer information should be consulted for further details.
It is also important to consider the logistics of fuel delivery and storage. It could be that a maximum of, say, 500 litres of fuel can be delivered in a single vehicle (or stored on site). If access to site is restricted for periods of time – such as monsoon seasons or winter months – then the operational hours of the generator should be carefully calculated to ensure adequate fuel is available.
3.4.3 System monitoring and involving the user
Monitoring a stand-alone power supply system is very important for its reliable long-term operation. The community using the system must be trained to check the system and have an understanding of the various parameters. They can report any unusual conditions to the group in charge of maintenance.
Readings from the system monitors can be used, for example, to check if the battery is charged, if the wind turbine has been generating energy during high winds or if a very large load has been connected to the system.
For every system a group of people should be placed in charge
ENERGY BOOK PRESS.indb 362 02/09/2014 14:59:11

Energy Part III chapter 3 – The details
– 363 –
3.4.3.1 Involving the user
The user is typically the most important aspect of an off-grid system. Evenforfixedlocationsolutionsrequiringnouserintervention,alackof awareness by those around can result in reduced performance.
A real example of this was a local woman in Rwanda washing her clothes and laying them on an array of warm, flat and clean PV modules every morning.
Aside from general considerations of the equipment – for safetyandotherreasons,if theuserhasaninfluenceonenergyconsumption (or generation) it is essential they understand how the system operates. We need to convey the principle that the battery only has a limited amount of energy – which is dependent on sunlight, wind or rainfall intensity and the devices connected to it.
We want the energy in the battery to become analogous to water in a bottle: the owner can choose how to use it. They can take true ownership of their energy, every day.
For example in a domestic home with several lights, a TV, computer and a fridge, devices can be switched off by the user to ensure the fridge does not run out of power.
After becoming familiar with daily system operation, the user will likely be able to estimate the remaining battery time compared to how they use the appliance(s) powered by the system.
System operatorLarger systems (typically systems supplying power to more than one household) are generally better maintained if they have a dedicated system operator.
This person or group would be responsible for daily/weekly/monthly maintenance. Tasks include:
of operation and maintenance. They would check the system monitoring equipment daily and record certain values on some form of log,whichcanbeusedforfaultfindingandmaintenance.
This is a very important but often-over looked area. Monitoring devices can add to the cost of the system, so their purchase must be included within the initial budget.
ENERGY BOOK PRESS.indb 363 02/09/2014 14:59:11

Energy Part III chapter 3 – The details
– 364 –
•Checking battery voltage
•Checking loads current
•Checking renewable supply current
•Checking/maintaining generator
•Keeping battery room clean and tidy
•Topping up water in open-vented batteries
•Checking for insect infestations
•Ensuring supply of simple spare parts
•Reporting any issues to an engineer or the installation group
•Recording energy generation readings
The system operator/maintainer would have to be trained and, if possible, paid for their work. Typically a number of operators are trained for each system. Due to the nature of life in remote locations, people frequently move to cities for work. This can cause issueswhenthetrainedoperatorsmovetofindpaidworkinotherlocations. Sometimes the systems are then not maintained well and they can fail early.
One way to reduce the movement of trained operators is to train up women with children or the elders in the community. This has anumberof benefits–firstlytheyaremorelikelytostayinthelocation of the system and, secondly, and,secondly, this can increase the social status of women and provide some income to these households.
Any group installing stand-alone systems should ensure that there is provision for long-term engineering and maintenance support for these systems. This would typically be in the form of a regional engineer who can perform more specialist repairs. This must be organised and included within the cost of installing the system from the beginning. All too often this aspect is overlooked and these, very expensive, renewable energy systems can fail within a couple of years.
ENERGY BOOK PRESS.indb 364 02/09/2014 14:59:11
Energy Part III chapter 3 – The details
– 365 –
User displaysA user display shows the amount of energy remaining in the battery at any given time. There is no effect on the energy system; it is simply a display, not a control device.
The display must be easy to understand by anyone – no words or numbers. Displaying voltages, power numbers or other written information will be useless in most cases. Typically these are a row or rows of Red-Amber-Green LEDs, battery symbols (as used on mobile phones) or a combination of both. Displays are often incorporated into charge controllers.
The value of a display
•Simple displays help increase renewable energy system value.
•For a renewable energy system with lots of equipment, the user is the most important factor.
•Allowing the user to understand energy consumption greatly increases the reliability and life of the system.
•The display also allows the user to understand the limitations of the system.
Where the display can be used
•Domestic homes – with multiple appliances such as lights, TV, radio, fridge, etc.
•Classrooms – with several computers and other equipment. It can also be an education tool.
•Medical facilities – with several items of equipment. Especially important if some devices are more critical than others.
•Businesses – where some equipment is more important than others – computer, Internet access, lights, fans, radio, etc.
ENERGY BOOK PRESS.indb 365 02/09/2014 14:59:11
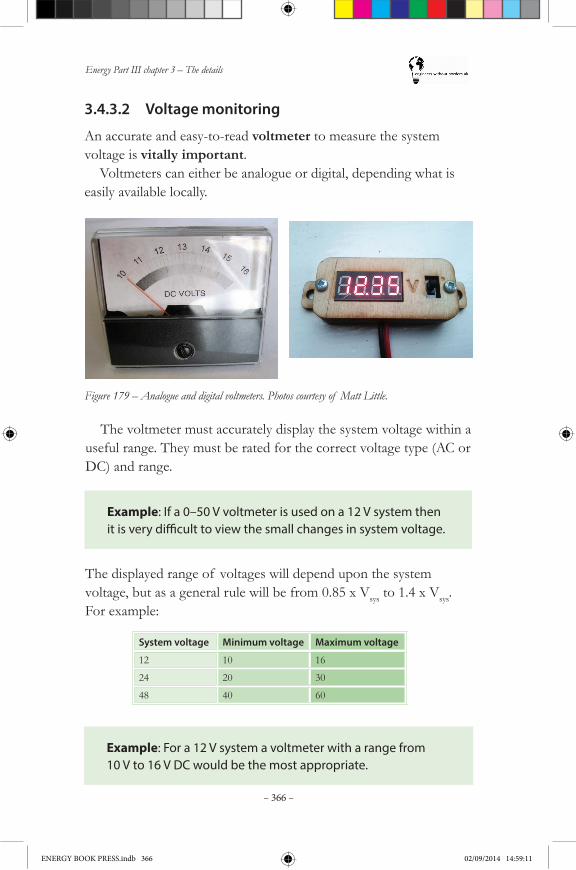
Energy Part III chapter 3 – The details
– 366 –
3.4.3.2 Voltage monitoring
An accurate and easy-to-read voltmeter to measure the system voltage is vitally important.
Voltmeters can either be analogue or digital, depending what is easily available locally.
Figure 179 – Analogue and digital voltmeters. Photos courtesy of Matt Little.
The voltmeter must accurately display the system voltage within a useful range. They must be rated for the correct voltage type (AC or DC) and range.
Example: If a 0–50 V voltmeter is used on a 12 V system then it is very difficult to view the small changes in system voltage.
The displayed range of voltages will depend upon the system voltage, but as a general rule will be from 0.85 x Vsys to 1.4 x Vsys. For example:
System voltage Minimum voltage Maximum voltage
12 10 16
24 20 30
48 40 60
Example: For a 12 V system a voltmeter with a range from 10 V to 16 V DC would be the most appropriate.
ENERGY BOOK PRESS.indb 366 02/09/2014 14:59:11
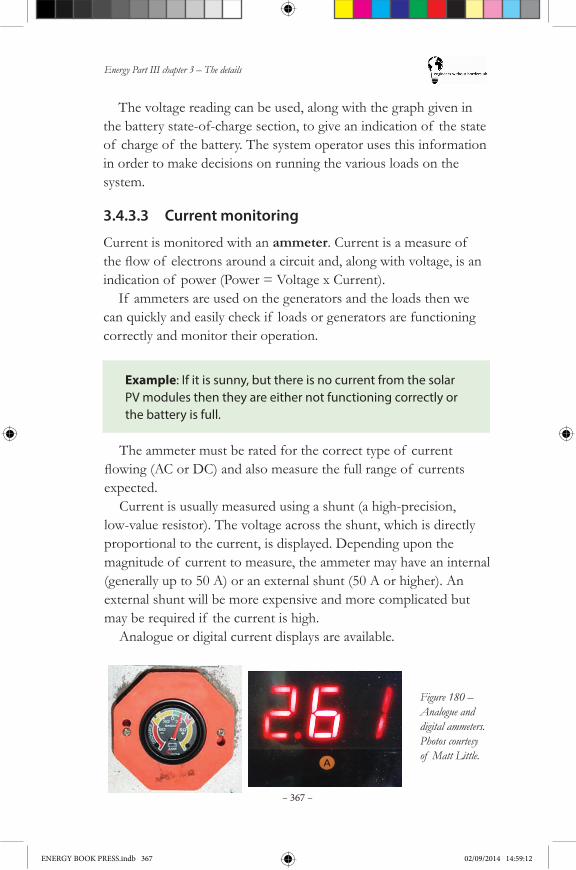
Energy Part III chapter 3 – The details
– 367 –
The voltage reading can be used, along with the graph given in the battery state-of-charge section, to give an indication of the state of charge of the battery. The system operator uses this information in order to make decisions on running the various loads on the system.
3.4.3.3 Current monitoring
Current is monitored with an ammeter. Current is a measure of theflowof electronsaroundacircuitand,alongwithvoltage,isanindication of power (Power = Voltage x Current).
If ammeters are used on the generators and the loads then we can quickly and easily check if loads or generators are functioning correctly and monitor their operation.
Example: If it is sunny, but there is no current from the solar PV modules then they are either not functioning correctly or the battery is full.
The ammeter must be rated for the correct type of current flowing(ACorDC)andalsomeasurethefullrangeof currentsexpected.
Current is usually measured using a shunt (a high-precision, low-value resistor). The voltage across the shunt, which is directly proportional to the current, is displayed. Depending upon the magnitude of current to measure, the ammeter may have an internal (generally up to 50 A) or an external shunt (50 A or higher). An external shunt will be more expensive and more complicated but may be required if the current is high.
Analogue or digital current displays are available.
Figure 180 – Analogue and digital ammeters. Photos courtesy of Matt Little.
ENERGY BOOK PRESS.indb 367 02/09/2014 14:59:12
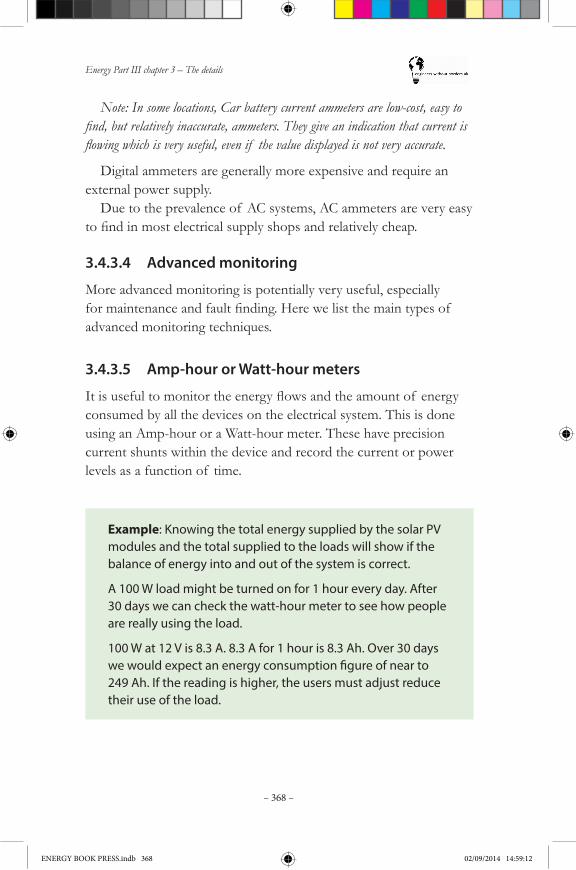
Energy Part III chapter 3 – The details
– 368 –
Note: In some locations, Car battery current ammeters are low-cost, easy to find, but relatively inaccurate, ammeters. They give an indication that current is flowing which is very useful, even if the value displayed is not very accurate.
Digital ammeters are generally more expensive and require an external power supply.
Due to the prevalence of AC systems, AC ammeters are very easy tofindinmostelectricalsupplyshopsandrelativelycheap.
3.4.3.4 Advanced monitoring
More advanced monitoring is potentially very useful, especially formaintenanceandfaultfinding.Herewelistthemaintypesof advanced monitoring techniques.
3.4.3.5 Amp-hour or Watt-hour meters
Itisusefultomonitortheenergyflowsandtheamountof energyconsumed by all the devices on the electrical system. This is done using an Amp-hour or a Watt-hour meter. These have precision current shunts within the device and record the current or power levels as a function of time.
Example: Knowing the total energy supplied by the solar PV modules and the total supplied to the loads will show if the balance of energy into and out of the system is correct.
A 100 W load might be turned on for 1 hour every day. After 30 days we can check the watt-hour meter to see how people are really using the load.
100 W at 12 V is 8.3 A. 8.3 A for 1 hour is 8.3 Ah. Over 30 days we would expect an energy consumption figure of near to 249 Ah. If the reading is higher, the users must adjust reduce their use of the load.
ENERGY BOOK PRESS.indb 368 02/09/2014 14:59:12
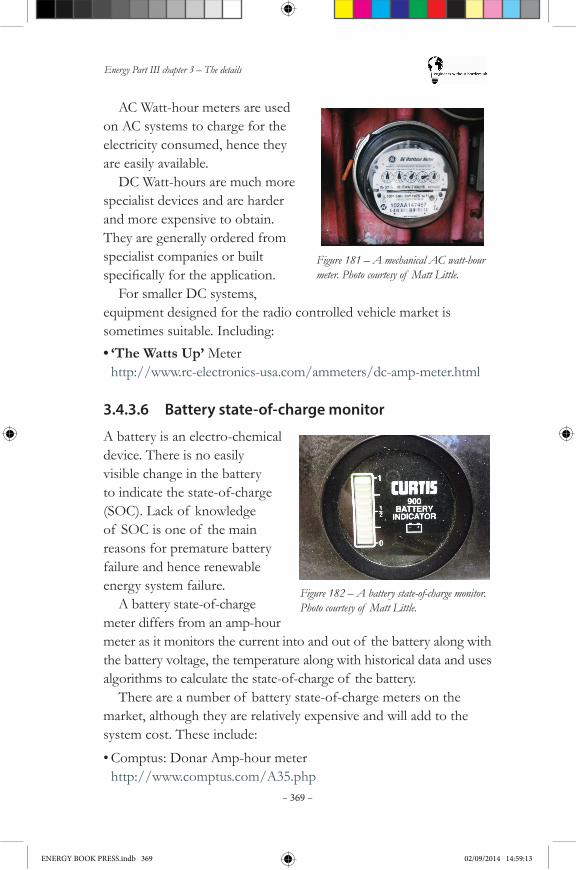
Energy Part III chapter 3 – The details
– 369 –
Figure 181 – A mechanical AC watt-hour meter. Photo courtesy of Matt Little.
3.4.3.6 Battery state-of-charge monitor
A battery is an electro-chemical device. There is no easily visible change in the battery to indicate the state-of-charge (SOC). Lack of knowledge of SOC is one of the main reasons for premature battery failure and hence renewable energy system failure.
A battery state-of-charge meter differs from an amp-hour meter as it monitors the current into and out of the battery along with the battery voltage, the temperature along with historical data and uses algorithms to calculate the state-of-charge of the battery.
There are a number of battery state-of-charge meters on the market, although they are relatively expensive and will add to the system cost. These include:
•Comptus: Donar Amp-hour meter http://www.comptus.com/A35.php
Figure 182 – A battery state-of-charge monitor. Photo courtesy of Matt Little.
AC Watt-hour meters are used on AC systems to charge for the electricity consumed, hence they are easily available.
DC Watt-hours are much more specialist devices and are harder and more expensive to obtain. They are generally ordered from specialist companies or built specificallyfortheapplication.
For smaller DC systems, equipment designed for the radio controlled vehicle market is sometimes suitable. Including:•‘The Watts Up’ Meter
http://www.rc-electronics-usa.com/ammeters/dc-amp-meter.html
ENERGY BOOK PRESS.indb 369 02/09/2014 14:59:13
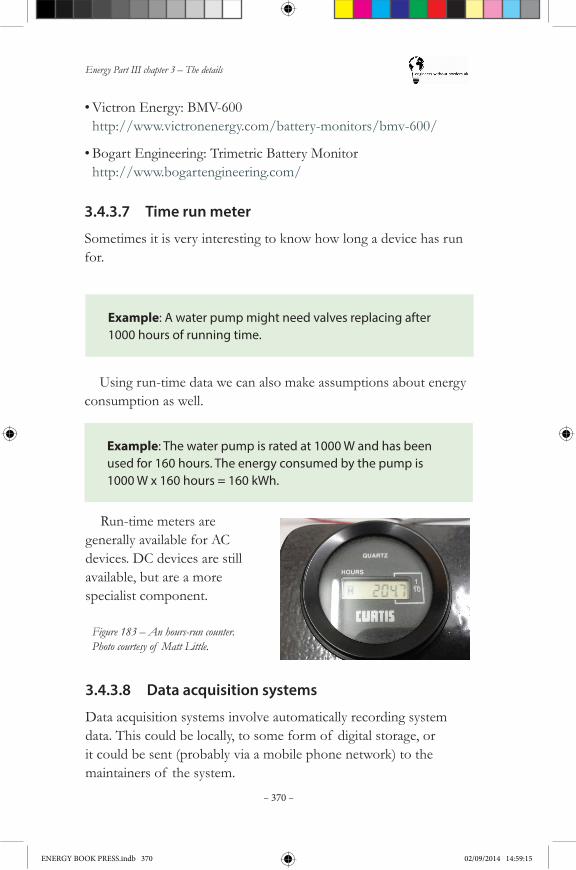
Energy Part III chapter 3 – The details
– 370 –
•Victron Energy: BMV-600 http://www.victronenergy.com/battery-monitors/bmv-600/
•Bogart Engineering: Trimetric Battery Monitor http://www.bogartengineering.com/
3.4.3.7 Time run meter
Sometimes it is very interesting to know how long a device has run for.
Example: A water pump might need valves replacing after 1000 hours of running time.
Using run-time data we can also make assumptions about energy consumption as well.
Example: The water pump is rated at 1000 W and has been used for 160 hours. The energy consumed by the pump is 1000 W x 160 hours = 160 kWh.
Run-time meters are generally available for AC devices. DC devices are still available, but are a more specialist component.
Figure 183 – An hours-run counter. Photo courtesy of Matt Little.
3.4.3.8 Data acquisition systems
Data acquisition systems involve automatically recording system data. This could be locally, to some form of digital storage, or it could be sent (probably via a mobile phone network) to the maintainers of the system.
ENERGY BOOK PRESS.indb 370 02/09/2014 14:59:15
Energy Part III chapter 3 – The details
– 371 –
3.4.4 Tools for electrical systems
There are many tools available for electrical technicians. Here is a list of the essential tools which should be in every community technician’s toolkit.
Note: None of these tools should be used without training, as testing electrical equipment is potentially very dangerous. If in any doubt seek specialist help.
•Multimeter
◊ This should be good quality with both AC and DC voltage and current ranges. A continuity test range is also very useful.
◊ A ‘true RMS’ multimeter is useful for testing inverters and power electronics.
◊ Ensure good quality and well maintained test leads.
This has quite a high additional expense, although that cost is coming down.
A whole range of system parameters can be recorded to allowassessmentof performanceandaidfault-finding.Datacanspecificallybeusedto:
•Ensure the installations perform as they should.
•Identify battery end-of-life in advance of system failure.
•Show proof of operation for promotional purposes such as future planning applications or as proof of environmental savings.
Although external or stand-alone data loggers can be used, these either draw energy from the PV system or have their own battery – which will require replacement. It is recommended that charge controllers with integrated data logging are used as they allow data to be stored for many years.
If the power supply system is a prototype system then it would beagoodideatomonitorallenergyflows,alongwithweatherinformation, using a data acquisition unit. This information could be used to show how the system functions over time (this would help to validate any energy generation claims made and help to prove the suitability of the technology).
ENERGY BOOK PRESS.indb 371 02/09/2014 14:59:15

Energy Part III chapter 3 – The details
– 372 –
•Screwdrivers
◊ A range of sizes. Insulated electricians tools should be used.•Cable cutters
◊ Insulated handles for electricians.•Knife
•Battery safety protection kit:
◊Acid-resistant gloves◊Goggles◊Apron◊Neutralising alkali (baking soda)•Pliers
◊ Insulated handles for electricians•Set of Allen Keys
More specialist tools that might be useful include:•Hydrometer
◊ For measuring battery electrolyte and state-of-charge.•Cable crimps
◊Designed to electrically and mechanically crimp cables to connectors.
•Clamp ammeter
◊ To non-invasively measure currents. •Solar Irradiance meter
◊ For testing solar PV modules.•Battery terminal cleaning tool
◊A special wire brush for cleaning battery terminals to make good connections.
ENERGY BOOK PRESS.indb 372 02/09/2014 14:59:15

Energy Part III chapter 3 – The details
– 373 –
3.4.5 Trouble shooting and fault finding electrical systems
Finding faults within complex electrical systems is a specialist activity. It can also be very dangerous. Please only attempt fault finding diagnostics if you have relevant training and are able to stay safe.
There are a wide range of parts which can fail within stand-alone renewableenergysystems.Knowinghowtofindafaultcomeswith experience. Sometimes a fault will only manifest itself when something else does not work. The main failures will be due to: •Battery failure (generally due to over-discharging).
•Fuse failure (generally due to short circuit resulting from moisture, insects or mechanical fault).
•Connection failure (generally due to bad connections, weather or insect damage).
•Power electronics failure (generally due to weather or insect damage).
Figure184showsasimplefault-findingflowchart.Itshouldhelpfindfaults,butitisverydifficulttocoverallaspects.
Some faults can lead to other parts of the system failing. For example: moisture causes a short circuit from the solar PV modules. This blows the fuse to the PV modules. This is not noticed by the system operators and, as no energy is coming into the system, eventually the batteries fail as they are fully discharged.
Note: There are a wide range of faults which can occur within a renewable energy system, for which you will often need to seek specialist advice.
ENERGY BOOK PRESS.indb 373 02/09/2014 14:59:15
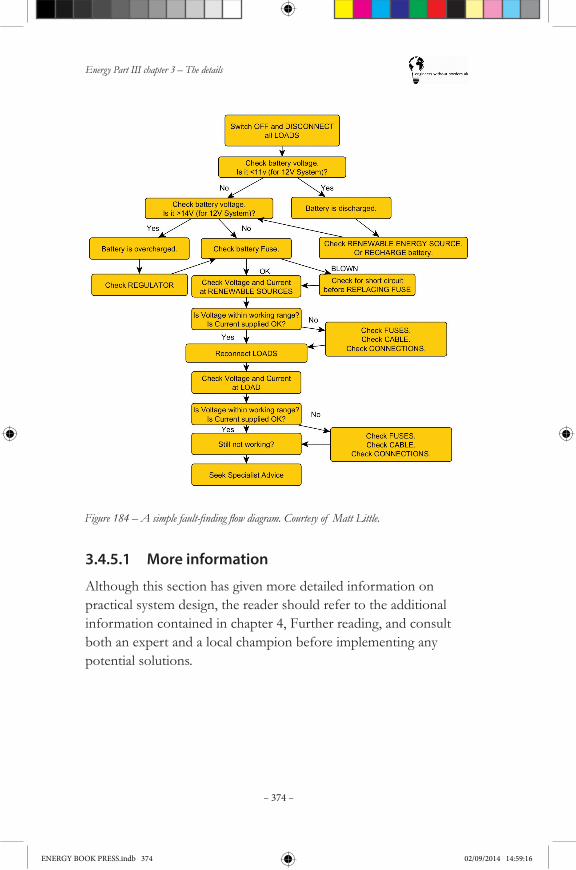
Energy Part III chapter 3 – The details
– 374 –
Figure 184 – A simple fault-finding flow diagram. Courtesy of Matt Little.
3.4.5.1 More information
Although this section has given more detailed information on practical system design, the reader should refer to the additional information contained in chapter 4, Further reading, and consult both an expert and a local champion before implementing any potential solutions.
ENERGY BOOK PRESS.indb 374 02/09/2014 14:59:16
Energy Part III chapter 4 – Further reading
– 375 –
4 Further reading4.1 Energy access 4.1.1 General
Practical Action’s Poor People’s Energy Outlook series – detailed picture of the importance of energy access for development; available in print or at: http://practicalaction.org/ppeo2010 http://practicalaction.org/ppeo2012 http://practicalaction.org/ppeo2013
Appropedia – website on collaborative solutions in sustainability, appropriate technology and poverty reduction; available at: http://www.appropedia.org/Welcome_to_Appropedia
Energypedia – development-focused renewable energy wiki; available at: https://energypedia.info/wiki/Main_Page
Small is beautiful: A study of economics as if people mattered by E. F. Schumacher (1973) – collection of essays on intermediate technology.
Sustainable Energy for All – website set up by the United Nations with lots of information on global targets and frameworks to achieve them with respects to universal energy access; available at: http://www.se4all.org/
Practical Action’s Development Bookshop – over 50 energy-related books; available at: http://developmentbookshop.com/energy.html
Practical Answers – free online resource on a range of appropriate technologies from solar PV to mud stoves in Kenya; available at: http://practicalaction.org/practicalanswers/
Practical Action’s Interactive Renewable Energy Toolkit (iRET) – freely available interactive multimedia renewable energy toolkit; available at: http://practicalaction.org/iret
ENERGY BOOK PRESS.indb 375 02/09/2014 14:59:17
Energy Part III chapter 4 – Further reading
– 376 –
4.1.2 Access to finance
The economics of micro-finance by B. Armendáriz & J. Morduch (2005).
Mainstreaming Microfinance: How Lending to the Poor Began, Grew and Came of Age in Bolivia by E Rhyne (2001).
Women at the Center: Grameen Bank Borrowers After One Decade by H. Todd (1996).
Small, Short and Unsecured: Informal Rural Finance in India by F. J. A. Bouman (1990).
Selling Solar: The Diffusion of Renewable Energy in Emerging Markets by D. Miller (2010).
4.2 Assessing energy demand
Total Energy Wiki – download Practical Action’s Total Energy Access questionnaire,easy-to-filldatasheetsandrelatedinformation;available at: https://energypedia.info/wiki/Total_Energy_Wiki
A Handbook of Small-scale Energy Technologies: Practical Answers by Neil Noble (2012) – on the generation, delivery and use of appropriate decentralized energy technologies, contains a lot of information on loads.
A Practical Guide to Solar Photovoltaic Systems for Technicians by Jean-Paul Louineau (2008) – essential manual for technicians working on solar PV in rural areas, contains information on loads and energy efficiency.
Determining Electric Motor Load and Efficiency, U.S. Department of Energy – can be used as a guide for sizing electric systems; available at: https://www1.eere.energy.gov/manufacturing/tech_assistance/pdfs/10097517.pdf
ENERGY BOOK PRESS.indb 376 02/09/2014 14:59:17

Energy Part III chapter 4 – Further reading
– 377 –
4.3.1 Solar
NASA data resource – data taken from satellite based measurements over the past 20 years. This site is not colourful or particularly user friendly but the raw data is very good. It will take a while to learn howtousebuteachfieldhas‘parameterdefinition’notesonwhatthe numbers and various options mean; available at: http://eosweb.larc.nasa.gov/cgi-bin/sse/grid.cgi
Animation of net radiation available at: http://earthobservatory.nasa.gov/GlobalMaps/view.php?d1=CERES_NETFLUX_M
Earth observatory maps available at: http://earthobservatory.nasa.gov/GlobalMaps/
Highly recommended solar insolation map of Africa available at: http://re.jrc.ec.europa.eu/pvgis/
The interactive maps are useful for thinking about how the software is calculating the summarised values (click ‘stand-alone PV’ top right of the page); available at: http://re.jrc.ec.europa.eu/pvgis/apps4/pvest.php?map=africa
Solar Pathfinder – captures a digital image of shading and prints it onto a sun-path diagram. Useful if numerous site assessments are being performed; available at: http://www.solarpathfinder.com
IRENA Global Atlas for Renewable Energy – overlays many relevant layers (solar/wind resource, grid lines, road network, population density, etc.) onto a Google Maps base layer, making assessing a new region’s viability for renewable power generation much quicker and easier; available at: http://irena.masdar.ac.ae/
4.3 Energy resources and conversion technologies
ENERGY BOOK PRESS.indb 377 02/09/2014 14:59:17

Energy Part III chapter 4 – Further reading
– 378 –
4.3.2 Wind
NASA’s Atmospheric Science Data Centre – use with caution (see main text on wind resource); available at: https://eosweb.larc.nasa.gov/cgi-bin/sse/grid.cgi
Scoraig Wind – Hugh Piggott’s blog, where you can buy his books (Wind Power Workshop, Wind Turbine Recipe Book etc.), keep up to date with the world of locally manufactured SWTs and get in touch with the world expert on locally manufactured SWT technology; available at: http://scoraigwind.co.uk/
Wind-Works – an online archive of articles and commentary on wind and solar energy by Paul Gipe, an independent expert and author of a series of textbooks that make a great introduction to the theoretical and practical issues surrounding wind power; available at: www.windworks.org
Wind Empowerment – a global association for the development of locallymanufacturedSWTsforsustainableruralelectrification.Conducts and publishes relevant research, hosts a document library, runs a series of webinars, provides links to member organisations, hosts a discussion forum for technical queries and more; available at: http://windempowerment.org/
V3Power – Nottingham based DIY renewable energy co-operative specialising in Piggott turbine construction courses; available at: http://v3power.co.uk/
Stand-Alone Solar Electric Systems: the Earthscan Expert Handbook for Planning, Design and Installation by Mark Hankins (2010) – hands-on guide,notspecifictodevelopment,onoff-gridsolarsystems.
A Practical Guide to Solar Photovoltaic Systems for Technicians by Jean-Paul Louineau (2008) – essential manual for technicians working on solar PV in rural areas.
ENERGY BOOK PRESS.indb 378 02/09/2014 14:59:17
Energy Part III chapter 4 – Further reading
– 379 –
EWB/SIBAT Design Guides – A series of technical guides for the design, manufacture and installation of small-scale off-grid wind and solar hybrid systems written by Matt Little & Drew Corbyn during their EWB-UK placements with the Filipino NGO, SIBAT. Coverseverythingfromelectricalsystemdesigntofibreglassblademanufacture to resource assessment.
Bright Planet Education– a smaller and simpler wind turbine designed for local manufacture and tested in the UK by John Simnett; available at: http://bright-planet.org.uk/
The Danish Wind Energy Association’s Wind Know-how – online resource that offers an introduction to the basics of wind energy; available at: http://www.windpower.org/en/knowledge.html
4.3.3 Hydro
Books:
Micro-hydro design manual: A guide to small-scale water power schemes, by Adam Harvey, Andy Brown, Priyantha Hettiarachi and Allen Inversin (1993) – comprehensive overview which examines every stage of planning an installation.
The Micro-hydro Pelton Turbine Manual: Design, Manufacture and Installation for Small-scale Hydro-power, by Jeremy Thake (2000).
Pumps as Turbines: A User’s Guide, by Arthur Williams (2nd edition, 2003) – concerns the use of standard pump units as a low-cost alternative to conventional turbines to provide stand-alone electricity generation in remote locations.
Motors as Generators for Micro-hydro Power, by Nigel Smith (2nd edition, 2008) – concerns the use of induction motors for electricity generation in remote locations.
Designing and Building Mini and Micro-hydro Power Schemes: A Practical Guide, by Luis Rodriguez & Teodoro Sanchez (2011).
ENERGY BOOK PRESS.indb 379 02/09/2014 14:59:17

Energy Part III chapter 4 – Further reading
– 380 –
Papers:
A. A. Williams and R. Simpson, Pico-hydro – Reducing technical risksforruralelectrification,Renewable Energy, vol. 34, pp.1985–1991, 2009.
K. V. Alexander and E. P. Giddens, Micro-hydro: Cost-effective, modular systems for low heads, Renewable Energy, vol. 33, pp.1379–1391, 2008.
Documents:
The Pico Power Pack case study by Phil Maher & Nigel Smith (2000); available at: http://www.eee.nottingham.ac.uk/picohydro/documents.html#casestudies
Five gallon bucket hydroelectric generator build manual by Sam Redfield;availableat: http://www.five-gallon-bucket-hydroelectric.org/build-manuals/
Design of propeller turbines for pico-hydro – Robert Simpson & Arthur Williams (2010); available at: http://www.eee.nottingham.ac.uk/picohydro/documents.html#manuals
Websites:
Pico-hydro website – lots of useful documents and guides on locally madePeltonandaxialflowturbines:availableat www.picohydro.org.uk
Pumps as Turbines website – useful information for designing a pump as a turbine micro-hydro system; available at: www.pumpsasturbines.org.uk
Hydromatch website – gives access to a free trial of micro-hydro equipment selection software; available at: www.hydromatch.com
ENERGY BOOK PRESS.indb 380 02/09/2014 14:59:17
Energy Part III chapter 4 – Further reading
– 381 –
4.3.4 Improved cookstoves
HEDON Household Energy Network – a big repository of useful information on energy technologies for households, including a searchable improved cookstoves database; available at: www.hedon.info For the searchable database, see http://www.hedon.info/Databases
Aprochevo Research Centre – researching, developing and disseminating clean cookstove technologies. Lots of information including links to design manuals and stoves performance testing; available at: www.aprovecho.org
For the performance tests, see http://www.aprovecho.org/lab/pubs/testing
GIZ HERA Cooking Energy Compendium – a practical guidebook for implementers of cooking energy interventions; available at: https://energypedia.info/index.php/GIZ_HERA_Cooking_Energy_Compendium
Practical Action – contains lots of practical information on cookstove implementation, including technical resource sheets; available at: http://practicalaction.org/
Global alliance for clean cookstoves – again, a large repository of useful information and links on improved cookstoves; available at: http://www.cleancookstoves.org/
BioEnergy Discussion Lists – mailing lists, discussion forums and a wealth of information on improved biomass cookstoves is available through this website; also contains information on biochar and gasification;availableat: http://www.bioenergylists.org/
ENERGY BOOK PRESS.indb 381 02/09/2014 14:59:17

Energy Part III chapter 4 – Further reading
– 382 –
For guides on preparation techniques for clay-based technologies, see the GVEP DEEP factsheet on improved cookstoves production; available at: http://gvepinternational.org/sites/default/files/factsheet_ics_web_final.pdf
And the Practical Action Sudan manual for clay-based technologies; available at: http://practicalaction.org/docs/region_sudan/clay-based-technologies.pdf
Gasifiersareanothertypeof improvedcookstovesthatarenottalked about in the text but are relevant – see this GVEP factsheet; available at: http://www.gvepinternational.org/sites/default/files/factsheet_gasifier_web_final.pdf?gclid=CL-3lOTNqKsCFUO_zAod7mgb1A
Design Principles for wood burning cookstoves – manual from Aprochevo Research Center; available at: http://www.bioenergylists.org/stovesdoc/Pcia/Design%20Principles%20for%20Wood%20Burning%20Cookstoves.pdf
A Comparison of Wood burning Cookstoves for Uganda: Testing and Development, GTZ (2010); available at: http://www.bioenergylists.org/stovesdoc/George/A%20Comparison%20of%20Woodburning.pdf
Wonderbags – the most successful heat retention cooker product currently on the market (South Africa); available at: http://nb-wonderbag.com/
CarbonfinancingforstovesinUganda;availableat: http://www.ugandacarbon.org/images/uploads/ICSEA%20Flyer%2003.pdf
ENERGY BOOK PRESS.indb 382 02/09/2014 14:59:17
Energy Part III chapter 4 – Further reading
– 383 –
4.4.3 Computer simulation tools
There are now a number of computer simulation tools available to help produce a system design. These contain mathematical models to simulate how the system would perform under various weather conditions. Usually, meteorological data can either be downloaded or entered by hand.
Here is a list of some software available:Note: This list is not exclusive, nor is it a recommendation for any one of these simulations.
4.4 Practical system design4.4.1 Diesel generators
Practical Action’s Diesel Generator worksheets – for more information on selecting, operating and maintaining a diesel generator; available at: http://practicalaction.org/diesel-engines http://practicalaction.org/diesel-engine-repair-maintenance http://practicalaction.org/practicalanswers/product_info.php?cPath=21_64&products_id=34
4.4.2 Stand-alone power supply
Here are some useful books and online resources relating to stand-alone power supply design. Please note this list is not exhaustive and there are many more available:
Off the Grid: Managing Independent Renewable Electricity Systems by Duncan Kerridge with David Linsley Hood, Paul Allen and Bob Todd (3rd edition, 2008).
Stand-Alone Solar Electric Systems: the Earthscan Expert Handbook for Planning, Design and Installation by Mark Hankins (2010).
A Practical Guide to Solar Photovoltaic Systems for Technicians by Jean-Paul Louineau (2008).
ENERGY BOOK PRESS.indb 383 02/09/2014 14:59:17

Energy Part III chapter 4 – Further reading
– 384 –
4.4.4 Batteries
For more information on batteries, including their maintenance and safe operation, see:
IEA Battery Guide: http://www.iea-pvps.org/products/rep3_06.htm
Article on State Of Charge monitoring from Homepower Magazine: http://www.arttec.net/Solar_Mower/4_Electrical/Battery%20Charging.pdf
Practical Action battery information: http://practicalaction.org/practicalanswers/product_info.php?cPath=21&products_id=126
HOMER: http://homerenergy.com/ Energy modelling software for Hybrid Renewable Energy Systems.
RETscreen : http://www.retscreen.net/ang/home.php Based upon Excel. Windows based.
TRNSYS: http://sel.me.wisc.edu/trnsys/features/features.html Models transient systems, such as solar PV system.
PVPlanner: http://solargis.info/doc/4 Gives PV resource information to help system sizing
Archelios Pro: http://www.archelios.com/ PV simulation and design package.
PV*SOL: http://www.valentin.de/en Simulation package which can also model battery based systems.
PVSYST: http://www.pvsyst.com/en/ PV simulation package.
Note: Never rely upon a computer simulation – always perform the basic design calculations and ensure that every factor has been included. There are many social and technological factors which should be included by the system designer, but might not be included within the computer model.
ENERGY BOOK PRESS.indb 384 02/09/2014 14:59:17

Energy Part III chapter 4 – Further reading
– 385 –
4.4.5 Other
A useful guide to PV water pumping can be found on the Green Empowerment website; available at: http://www.greenempowerment.org/attachments/SolarWaterPumpingManual_jan2007.pdf
Information on Lightening and surge protection can be obtained from Furse (a subsidiary of Thomas & Betts); available at: http://www-public.tnb.com/eel/docs/furse/ESP_-_Introduction.pdf
ENERGY BOOK PRESS.indb 385 02/09/2014 14:59:17
Energy Part III chapter 5 – Bibliography
– 386 –
5 Bibliography3TIER (2010) Global Wind, Solar and Hydro Resource Maps. Available from http://www.3tier.com/en/support/resource-maps/ [Accessed: 3rd March 2014].
Ahlborg, H. and Hammer, L. (2011) Drivers and barriers to rural electrification in Tanzania and Mozambique – grid extension, off-grid and renewable energy sources. Sweden: World Renewable Energy Congress.
Aman, M., Jasmon, G. B., Mokhlis, H., & Bakar, A. H. A. (2013) Analysis of the performance of domestic lighting lamps. Energy Policy. 52. pp.482–500.
Bazilian, M., Nussbaumer, P., Cabraal, A., Centurelli, R., Detchon, R., Gielen, D., Rogner, H., Howells, M., McMahon, H., Modi, V., Nakicenovic, N., O’Gallachoir, B., Radka, M., Rijal, K., Takada, M., & Ziegler, F. (2010) Measuring energy access: Supporting a global target. New York: Earth Institute, Columbia University.
Brew-Hammond, A. (2010) Energy access in Africa: Challenges ahead. Energy Policy. 38 (5). pp.2291–2301.
Danish Wind Energy Association. (2014) Wind know-how [Online] Available at http://www.motiva.fi/myllarin_tuulivoima/windpower%20web/en/tour/wres/index.htm [Accessed: 24th February 2014].
Dreyer, A. (2010) Lightning Protection study. London: National Lightning Protection Institute.
Ferrer-Martí, L., A. Garwood, J. Chiroque, B. Ramirez, O. Marcelo, M. Garfí and E. Velo (2012). Evaluating and comparing three communitysmall-scalewindelectrificationprojects.Renewable and Sustainable Energy Reviews.16 (7). pp.5379–5390.
Ferrer-Martí, L., A. Garwood, J. Chiroque, R. Escobar, J. Coello and M. Castro (2010). A Community Small-Scale Wind Generation Project in Peru. Wind Engineering. 34 (3). pp.277–288.
ENERGY BOOK PRESS.indb 386 02/09/2014 14:59:18
Energy Part III chapter 5 – Bibliography
– 387 –
Gipe, P. (1999) Wind Energy Basics. A Guide to Small and Micro Wind Systems. Vermont: Chelsea Green Publishing Co, White River Junction.
Gipe, P. (2004) Wind Power: Renewable Energy for Home, Farm, and Business. Vermont: Chelsea Green Publishing Co, White River Junction.
Gipe, P. (2014) Wind Works [Online] Available at http://www.wind-works.org/cms/index.php?id=17 [Accessed: 3rd March 2014].
Gitonga, S., Clemens, E. (eds.) (2006) Expanding access to modern energy services: Replicating, Scaling up and Mainstreaming at the local level. New York: UNDP.
GIZ (2011) Carbon markets for improved cooking stoves – a GIZ guide for project operators. [Online] Available at http://www.gtz.de/de/dokumente/giz2011-en-carbon-markets-for-improved-stoves.pdf [Accessed: 3rd March 2014].
Green, M. A. (1998) Solar Cells: Operating Principles, Technology and System Applications. Australia: Prentice-Hall, University of New South Wales.
GTZ (2010) Energy-saving stoves – some of the popular models used in GTZ programmes. [Online] Available at http://www.giz.de/Themen/en/dokumente/gtz2010-en-models-energy-saving-stoves-HERA.pdf [Accessed: 3rd March 2014].
Harvey, A. Brown, P. Hettiarachi & Inversin, A. (1993) Micro-hydro design manual: A guide to small-scale water power schemes. Rugby: Practical Action Publishing.
Huld T., Šúri M., Dunlop E., Albuisson M, Wald L. (2005). Integration of HelioClim-1 database into PVGIS to estimate solar electricity potential in Africa. Proceedings from 20th European Photovoltaic Solar Energy Conference and Exhibition. 6–10 June 2005, Barcelona, Spain. Available at: http://re.jrc.ec.europa.eu/pvgis/.
ENERGY BOOK PRESS.indb 387 02/09/2014 14:59:18
Energy Part III chapter 5 – Bibliography
– 388 –
IEA (1999) Lead-Acid Battery Guide for Stand-Alone Photovoltaic System (Task III Report IEA-PVPS-3-06) [Online] Available at: http://www.iea-pvps.org/products/rep3_06.htm [Accessed: 3rd March 2014]
IRENA (2013) Global Atlas for Renewable Energy [Online] Available at: http://irena.masdar.ac.ae/.
Khadka, S.S., Maskey, R. K. (2012) Performance study of micro-hydro system in Nepal. IEEE ICSET (2012). Kathmandu, Nepal.
Khan, N., & Abas, N. (2011) Comparative study of energy saving light sources. Renewable and Sustainable Energy Reviews. 15 (1), pp.296–309.
Khennas, S., Dunnett, S., and Piggott, H. (2008) Small Wind Systems for Rural Energy Services. Rugby: Practical Action Publishing.
Leary, J., While, A., Howell, R. (2012). Locally manufactured wind powertechnologyforsustainableruralelectrification.Energy Policy 43 (0). pp.173–183.
Little, M. & Corbyn, D. (2008) EWB/SIBAT Design Guides. Philippines. [Online] Available from www.re-innovation.co.uk/ [Accessed: 3rd March 2014].
Logic Energy. (2013) Logic Energy Shop. [Online] Available at: http://shop.logicenergy.com/ [Accessed:11th May, 2013].
Louineau, JP. (2008) A Practical Guide to Solar Photovoltaic Systems for Technicians. Rugby: Practical Action Publishing.
Maher, P. & Smith, N. (2001) Pico Hydro for Village Power: A Practical Manual for Schemes up to 5 kW in Hilly Areas. Nottingham: Nottingham Trent University.
Mapoux, M. (2011) ‘Small Wind’ for Development. Portland, Oregon: USA: Green Empowerment.
ENERGY BOOK PRESS.indb 388 02/09/2014 14:59:18
Energy Part III chapter 5 – Bibliography
– 389 –
Marandin, L., Craig, M., Casillas, C. & Sumanik-Leary, J. (2013) Market Assessment for Small Scale Wind Turbines in Nicaragua 2012–13. Managua: Green Empowerment.
Meteosim Truewind S. L., Latin Bridge Business S. A. (2008) Atlas Eólico del Perú. [Online] Available at http://dger.minem.gob.pe/atlaseolico/PeruViento.html [Accessed: 3rd March 2014].
Neil Noble, ed. (2012) A Handbook of Small-scale Energy Technologies: Practical Answers. Rugby: Practical Action Publishing.
New Roots Energy: Wind Report. New Roots Energy (2013) [Online] Available from http://www.newrootsenergy.com/ [Accessed: 3rd March 2014].
NREL (1986) Wind Energy Resource Atlas of the United States. [Online] Available from http://rredc.nrel.gov/wind/pubs/atlas/tables/1-1T.html [Accessed: 3rd March 2014].
Power Predictor (2013) [Online] Available from http://www2.powerpredictor.com/ [Accessed: 3rd March 2014].
Practical Action (2010) Poor People’s Energy Outlook 2010. Rugby: Practical Action Publishing.
Practical Action (2011) Practical Answers – Energy from the Wind. Available from http://practicalaction.org/energy-from-the-wind [Accessed: 3rd March 2014].
Practical Action (2011) Interactive renewable energy toolkit – iRET. Available from http://practicalaction.org/iret [Accessed: 3rd March 2014].
Practical Action (2012) Poor People’s Energy Outlook 2012: Energy for earning a living. Rugby: Practical Action Publishing.
Practical Action (2013) Poor people’s energy outlook 2013: Energy for community services. Rugby: Practical Action Publishing.
ENERGY BOOK PRESS.indb 389 02/09/2014 14:59:18
Energy Part III chapter 5 – Bibliography
– 390 –
Ranaboldo, M., Ferrer-Martí, L., and Velo, E. (2014). Micro-scale windresourceassessmentforoff-gridelectrificationprojectsinrural communities. A case study in Peru. International Journal of Green Energy. 11 (1). pp.75–90.
Rydh, C. J. & Sanden, B. A. (2005) Energy analysis of batteries in photovoltaic systems. Part I: Performance and energy requirements. Energy Conversion and Management. 46. pp.1957–1979.
Sanchez, T. (2006) Electricity Services in Remote Rural Communities: The Small Enterprise Model. Rubgy: Practical Action Publishing.
Soluciones Practicas (2013) [Online] Available at http://www.solucionespracticas.org.pe/ [Accessed: 3rd March 2014].
Sumanik-Leary, J. (2013) Small Wind Turbines for decentralised rural electrification: case studies in Peru, Nicaragua and Scotland. Doctor of Philosophy,TheUniversityof Sheffield.
Sumanik-Leary, J., Piggott, H., Howell, R. & While, A. (2013) Locally manufactured Small Wind Turbines – how do they compare to commercial machines? 9th PhD Seminar on Wind Energy in Europe. Uppsala University Campus Gotland, Sweden.
Suvire, G. O., (ed.) (2011) Wind Farm – Technical Regulations, Potential Estimation and Siting Assessment, InTech publishing [Open access book].
Thake (2001) The Micro-Hydro Pelton Turbine Manual : Design, Manufacture and Installation for Small-Scale Hydropower. Rugby: Practical Action Publishing.
U.S. Department of Energy, Determining Electric Motor Load and Efficiency, Motor Challenge. Available at https://www1.eere.energy.gov/manufacturing/tech_assistance/pdfs/10097517.pdf [Accessed: 3rd March 2014].
ENERGY BOOK PRESS.indb 390 02/09/2014 14:59:18

Energy Part III chapter 5 – Bibliography
– 391 –
Vanheule, L. (2012) Small Wind Turbines in Kenya – An Analysis with Strategic Niche Management. Sustainable Energy Technology Master’s, Delft University of Technology.
WHO (2009) Global health risks report: Mortality and burden of disease attributable to selected major risk. Available at http://www.who.int/entity/healthinfo/global_burden_disease/GlobalHealthRisks_report_full.pdf [Accessed: 3rd March 2014].
Williamson, S. (2013) Modular and Scalable Low-Head Pico-Hydro Generation for Off-Grid Networks. Doctor of Philosophy, University of Bristol.
World Bank (2012) Measuring Financial Inclusion: The Global Findex Database. Policy Research Working Paper 6025, World Bank.
WRI (2004) World Resources 2002–2004: Decisions for the Earth: Balance, voice, and power. Washington DC: WRI.
Zittel, W. & Wurster, R. Hydrogen in the Energy Sector [Online]. Available at http://www.hydrogen.org/Knowledge/w-i-energiew-eng.html [Accessed: 3rd March 2014].
ENERGY BOOK PRESS.indb 391 02/09/2014 14:59:18