energy balance closure of two bog surfaces in central...
TRANSCRIPT

LUND UNIVERSITY
PO Box 117221 00 Lund+46 46-222 00 00
Energy balance closure of two bog surfaces in central Sweden
Mölder, Meelis; Erik, Kellner
Published: 2002-01-01
Link to publication
Citation for published version (APA):Mölder, M., & Erik, K. (2002). Energy balance closure of two bog surfaces in central Sweden. (Lund electronicreports in physical geography; Vol. 4). Department of Physical Geography and Ecosystem Science, LundUniversity.
General rightsCopyright and moral rights for the publications made accessible in the public portal are retained by the authorsand/or other copyright owners and it is a condition of accessing publications that users recognise and abide by thelegal requirements associated with these rights.
• Users may download and print one copy of any publication from the public portal for the purpose of private studyor research. • You may not further distribute the material or use it for any profit-making activity or commercial gain • You may freely distribute the URL identifying the publication in the public portalTake down policyIf you believe that this document breaches copyright please contact us providing details, and we will removeaccess to the work immediately and investigate your claim.

Energy balance closure of two bog surfaces in central Sweden
Meelis Möldera, Erik Kellnerb
aDepartment of Physical Geography and Ecosystems Analysis,
Lund University, P.O. Box 118,
SE-221 00 Lund, Sweden bDepartment of Earth Sciences/Hydrology, Uppsala University, Villavägen 16,
SE-752 36 Uppsala, Sweden
Abstract
Typical bogs in the boreal forest zone can be characterised by hummock and hollow micro-topography
and sparsely vegetated surfaces. Their energy balance has been studied much less than for other types of
surface, i.e. fields and forests. Micrometeorological measurements were carried out in central Sweden at
two bogs in different summer seasons. From the measured profiles of wind speed, air temperature and
humidity, the turbulent sensible and latent heat fluxes were calculated according to the Monin-Obukhov
similarity theory. The daytime sensible and latent heat fluxes were typically of similar size, with the latent
heat fluxes still being slightly higher. Independent measurements of turbulent, radiative and ground heat
fluxes allowed to consider the surface energy balance closure. During fair weather conditions, the net
radiation exceeded the sum of turbulent and ground heat fluxes by up to 200 W m-2 when measurements
with ground heat flux plates were used in the analysis. It is difficult to attribute this discrepancy to errors
in turbulent fluxes, because the fetch was long enough (400 m or more). Also, the size and shape of the
two bogs and the positions of the tower were different, but the discrepancies in the energy budget were
very similar. It is, however, known that measurements with heat flux plates in the peat are problematic.
The ground heat flux measured with plates was very low and was considered to be the most unreliable
component of the surface energy balance. An alternative method from the literature, which used
temperature measurements in the peat and at the surface but did not require any information on the soil
thermal properties near the surface, was used for alternative ground-heat-flux calculations. The use of this
method improved the closure of the surface energy balance, but an about 100 W m-2 large discrepancy still
remained unexplained. A further improvement is expected when lateral heat exchange in the hummocks
could be taken into account.
Keywords: Sensible heat flux; Latent heat flux; Ground heat flux, Net radiation, Similarity theory

2
1. Introduction
Wetlands are spread all over the Earth; specifically they occupy 10–20% of the boreal forest zone
and even more in the northern parts, thus, being a considerable component effecting weather and
climate. Much research by micrometeorologists in the past has been devoted to wetland
evaporation – an important component of energy and water balances. At present, energy-
partitioning data are available for different wetland types: aquatic wetlands (Souch et al., 1996;
Burba et al., 1999), fens (Lafleur et al., 1997; Moore et al., 1994) and a variety of bogs (Campbell
and Williamson, 1997; den Hartog et al., 1994; Moors et al., 1998; Spieksma et al., 1997;
Thompson et al., 1999). However, wetlands have much less been studied than other surface types,
i.e. fields and forests. Also, several studies with independent flux measurements have pointed out
the problem of obtaining a good energy balance closure for this type of a complex surface
(Lafleur et al., 1997; Thompson et al., 1999).
In this paper, the micrometeorological measurements over two bogs in central Sweden have been
analysed. These bogs are typical bogs in the boreal forest zone, which are characterised by
hummock and hollow micro-topography and sparsely vegetated surfaces. In other studies, the
season-long measurements at the same bogs have mainly been analysed using the Bowen ratio
method. This study, unlike the others, concentrates on short summer periods and the Monin-
Obukhov similarity theory is used for calculating the turbulent fluxes. This approach allows to
discover problems in the surface energy balance closure, which otherwise using the Bowen-ratio
method is not possible. The present study is accompanied by another paper (Mölder and Kellner,
2002) which is dedicated to the excess resistance or the kB-1 factor for these bogs.
The purpose of this paper is to demonstrate that large discrepancies in the bog surface energy
balance may occur. Since the discrepancies are strikingly similar despite of the fact that the
measurements were made over two bogs with different size and shape and location of the
measurement tower and that the fetches were long enough, it is concluded that the turbulent
fluxes are measured accurately enough. It is confirmed that the ground heat flux measurements
with plates in peat are unreliable and should not be used in combination with the Bowen ratio
method. An alternative method to determine the ground heat flux, which is relying on
temperature and moisture measurements in the peat, is shown to give larger values for the flux
3
and that in turn improves the surface energy balance closure, but it does not explain the whole
discrepancy, however. It seems that to solve the problem, even more complex peat temperature
and moisture measurements in combination with 3D modelling taking the structure of hummocks
into account are required.
2. Materials and Methods
Season-long measurements were established at the bog Ryggmossen (60°00’N, 17°15’E; altitude
58 m) from May to November in 1994. The bog is situated ca. 25 km northwest of Uppsala in
Sweden. The study aimed mainly to determine the evaporation by the Energy-Balance-Bowen-
Ratio method (Phersson and Pettersson, 1997). The measurements were complemented with
wind-speed and surface radiation-temperature measurements from 14 June to 12 July and the data
from this period have been analysed here. The following year a new bog station was established
on the bog Stormossen (60°07’N, 17°05’E; altitude 48 m), where continuous measurements were
conducted mainly during the vegetation periods in 1996 and 1997 (Kellner, 2002; Kellner and
Halldin, 2002). This bog is situated ca. 50 km northwest of Uppsala. High-quality measurements
of surface radiation temperature were carried out here during the short period of 19–29 August
1996. This period has been used in the analysis.
2.1. Surface features
The surface looked similar on both bogs having a typical structure of hummocks and hollows
(Fig.1). The concentration of hummocks was more variable on Ryggmossen, where the fraction
of hummocks was estimated to be 0.14 and 0.43 for two different areas, respectively. On
Stormossen, the fraction of hummocks was 0.30. Thus, roughly 30% of the bog was occupied by
hummocks and 70% by hollows on both bogs. The height of the hummocks was also similar,
varying between 0.20 and 0.40 m with a mean of 0.28 m. The vegetation consisted mostly of
Sphagnum mosses and sparsely present low vascular plants. Hollows were dominated by
Sphagnum species belonging to the Cuspidata section (S. balticum, S. tenellum) and Hare’s-tail
cottongrass (Eriophorum vaginatum) dominated the cover of vascular plants. Ridges and
hummocks were made up by denser Sphagnum species (S. fuscum, S. rubellum). The cottongrass,

4
Fig. 1. A view over the Stormossen bog.
present on both hummocks and hollows, had a height of 0.2–0.3 m. On hummocks and elongated
ridges, low Ericaceaeus shrub of heather (Calluna vulgaris) and crowberry (Empetrum nigrum)
was an important feature. There was also a small amount of bog rosemary (Andromeda polifolia)
present on hummocks, usually 0.12–0.15 m high. Occasional cloudberry plants (Rubus
chamaemorus) could be found, usually on hummocks and in drier parts. Spots of lichens
(Cladonia) also occurred on hummocks, but not abundantly. Single trees (Pinus sylvestris) – up
to 1.5 m high, were present even in the central parts of the bogs and could slightly influence the
measurements. However, the closest 25–30 m from the towers were tree free.
With dominating southerly and westerly winds, the fetch was 400 m or more over both bogs. The
fetch was shortest in the northern direction. On Ryggmossen it was restricted by a nearly straight
forest edge, about 200 m away. On Stormossen, the forest was only 70 m away, but in a form of a
small island.
Ground water level was always below the surface of hollows during the study periods. Porosity
of the peat was estimated to be 94–97% in the surface layers.
5
2.2. Instrumentation
2.2.1. Ryggmossen
Air temperature and humidity were measured at three levels: 1.1, 2.1, and 3.1 m with a
Thermometer Interchange System (TIS) (In Situ Instrument, Ockelbo, Sweden) (Lindroth and
Halldin, 1990). Absolute temperature was measured at the uppermost level; differential
measurements were made between 1.1 and 2.1 m, and 2.1 and 3.1 m. The sensors changed their
positions every 5 minutes in order to minimize systematic errors. The reversing sensors consisted
of an air temperature sensor, and a dry and a wet temperature sensor for humidity which were
placed in a ventilated radiation shield. Wind speed was measured on a separate mast with cup
anemometers at 0.76, 1.21, 1.96, and 2.98 m. These were the same anemometers as used by
Mölder et al. (1999). The two masts were separated by about 10 m.
Surface radiation temperature was measured with an infrared thermometer (IRT) (model 4000;
Everest Interscience, Tucson, USA) measuring in the spectral band of 8–14 µm and having a
viewing angle of 60°. It was installed at the top of the anemometer mast at 4-m height, was
inclined 10° from the vertical, approximately towards the west. Thus, the IRT could see roughly a
circle with a diameter of 4.5 m. Net radiation, and up and down dwelling short-wave radiation
were measured with a Schenk net radiometer (type 8111; Vienna, Austria) and two Kipp &
Zonen pyranometers (type CM5; Delft, The Netherlands), respectively, at about 1.5-m height.
Ground heat flux was measured with two plates (type Middleton CN3; Carter-Scott Design,
Brunswick, Victoria, Australia) at 2-cm depth. Soil temperatures were not measured at this site.
2.2.2. Stormossen
Air temperature and humidity were measured at 1, 2, and 3 m with another, but a similar TIS.
Cup anemometers (In Situ Instrument, Ockelbo, Sweden) were attached to the reversing arms of
the TIS.

6
The same IRT as on Ryggmossen was used also here, but it was installed on a photo tripod some
15 m from the TIS at about 1.5-m height and was inclined 10° from the vertical to the southeast.
It could see a spot on the ground having a diameter of 1.5 m.
Radiation and soil measurements were conducted in another station some 100 m from the TIS.
The same net radiometer and pyranometers were used as on Ryggmossen. Ground heat fluxes
(using the same plates as on Ryggmossen) and soil temperatures were measured at several
locations along a hummock-hollow transect. One representative profile in a hummock and a
hollow, respectively, is used in the analysis (Table 1). At this station, also soil water content
measurements were made with a Time Domain Reflectometer (TDR) (Tektronix 1502C;
Beaverton, OR, USA), by using horizontally placed probes (Dynamax Inc., Houston, Tx., USA)
at a hummock-hollow transect (Kellner and Halldin, 2002).
Since a Schenk net radiometer measures separately fluxes from the upper and lower hemispheres
and also the body temperature, it allows evaluation of the surface temperature if also the reflected
short-wave radiation is known. This was done to obtain a more representative surface
temperature for the ground heat flux calculation.
A mobile IRT (model 4000; Everest Interscience, Tucson, USA) with 15° viewing angle was
used to measure surface temperature variations over Ryggmossen in 1995.
The air temperature sensors were calibrated by manufacturer (In Situ Instruments, Ockelbo,
Sweden) several years ago. As they are made of platinum, they are very stable. The Ryggmossen
TIS sensors were checked in stirred water after the campaign. The anemometers were calibrated
before the campaign in a small wind tunnel against a reference hand-held anemometer, the latter
being calibrated at the Estonian Hydrological and Meteorological Institute. The In Situ
anemometers were calibrated prior to the experiment at a large wind tunnel of the Building
Institute in Gävle, Sweden. The IRT was checked against a black body (Reemann’s design) and
the output was accurate within 0.1–0.3 K. A laboratory calibration in sandy soil was carried out
for all the soil heat flux plates. The thermocouples in the soil were made of a standard copper-
constantan cable, so its standard sensitivity was used. The Schenk net radiometer was calibrated
properly at Ultuna in 1992, and once a year at Marsta (Halldin et al., 1999) (both places near
7
Uppsala). The TDR measurements were laboratory calibrated by using samples from Stormossen
(Kellner and Lundin, 2001).
2.3. Weather conditions
2.3.1. Ryggmossen
First half of the period (14 June – 12 July 1994) was cloudy with five days of rain – totally 25
mm. The second half had few clouds and no precipitation. Maximum temperatures increased
gradually from 12 to 28 °C during the period. Night temperatures were falling to nearly 0 °C at
the beginning of the period and 8–15 °C in the later part. Winds were 1–5.5 m s-1, predominantly
from the south, southwest, and west.
2.3.2. Stormossen
During the shorter period (19–29 Augusti 1996) the weather did not change much. Skies were
clear or with a few clouds; daytime maximum air temperatures 20–27 °C, minimums at nights 7–
17 °C; winds were less than 4 m s-1 from the southeast and southwest. In the later part of the
period, 26–29 August, there were more clouds and occasional small amounts of rain. The total
amount of rain was less than 4 mm.
3. Theory
3.1. Atmospheric surface layer
Atmospheric surface layer profiles of wind speed, u, air temperature, T, and humidity, q, are
given as (Brutsaert, 1982):
Ψ+
Ψ−
=
Lz
Lz
zzuu ou
uuou
* lnk
, (1)
Ψ+
Ψ−
+=
Lz
Lz
zzTTT oT
TToT
*s ln
k (2)
and

8
Ψ+
Ψ−
+=
Lz
Lz
zzqqq q
oqq
oq
*s ln
k, (3)
where Ts and qs are the surface values; u* is the friction velocity; T* and q* are the turbulent
scales; k=0.4 is the von Kármán constant; Ψu, ΨT, and Ψq are the integrated stability correction
functions; z is the height, zou, zoT, and zoq are the roughness lengths, and L is the Obukhov length.
The indices u, T, and q denote that the corresponding quantity refers to wind speed, temperature
or humidity, respectively.
The fluxes of sensible, H, and latent heat, LE, are given:
**pρc TuH −= (4)
and
**λρ quLE −= (5)
where ρ is the density of air, cp is the specific heat of air at constant pressure and λ is the latent
heat of vapourisation of water.
3.2. Ground heat flux
As soil heat flux measurements with plates are uncertain (Halliwell and Rouse, 1987), we have
also used the method by de Silans et al. (1997). An advantage of the method is that it does not
require any information on the soil physical properties. To apply this method, temperatures have
to be measured at a certain depth in the soil and also at the surface. Ground heat flux has to be
measured or calculated at the same depth as the measured temperature in the soil. The essence of
the method is as follows. When temperature, soil heat flux, and depth are scaled suitably, the
differential transfer equations take the same form for both the temperature and the flux.
Therefore, the mathematical operator that transforms the scaled temperature at a depth to that at
the surface is the same that transforms the scaled flux at a depth to the flux at the surface. Some
useful expressions are given below.
Variations in temperature, T, and soil heat flux, G, at a specific depth z can be expressed with
help of Fourier series:
( ) ( )∑ ++=n
φtiATtzTi
ziziz sin, ω (6)

9
and
( ) ( )∑ ++=n
δtiBGtzGi
ziziz sin, ω , (7)
where Tz and Gz are average temperature and flux at the depth z, respectively; Azi and Bzi are
amplitudes of the i-th harmonic, n is the number of harmonics, ϕzi and δzi are phase shifts of the
i-th harmonic, and ω is the frequency of the main harmonic.
Similarly, temperature and flux at the surface are given:
( ) ( )∑ ++=n
φtiATtTi
iio sin,0 ω (8)
and
( ) ( )∑ ++=n
δtiBGtGi
iio sin,0 ω , (9)
where To, Go, Ai, Bi, ϕi and δi have the same meaning as above, but represent the surface.
The unknown parameters for G(0,t) are related to the other, known parameters as:
zizi
i
1/2
zz
ooi κC
κCB
AAB
= , (10)
( )ziizii φφδδ −+= (11)
The factor in Eq. (10) containing heat capacities, C, and thermal conductivities, κ, is given
through average temperatures:
2
o
z
1/2
zz
oo
κCκC
=
TT (12)
This factor specifies also the ratio of average fluxes:
1/2
zz
oo
2
z
o
κCκC
=
GG (13)

10
4. Data processing
4.1. Profiles and fluxes
The measured profiles of wind speed, temperature, and humidity were fitted to the theoretical
Eqs. (1) – (3) using the least square method and an iteration procedure (Zilitinkevich, 1970;
Mölder, 1997). The universal stability functions given by Högström (1996) were used. Fitting of
profiles gave the turbulent scales u*, T*, and q*, which in turn gave the fluxes of H and LE,
according to Eqs. (4) and (5).
Daytime measurements of profiles have been analysed only, the selection criterion being a
positive net radiation (Rn>0 W m-2). Wind profiles measured at Ryggmossen were checked
graphically, profile by profile. Those uncertain profiles, where some of the anemometers had not
been rotating properly at low winds, were excluded from the analysis. For Stormossen, all
profiles, where some of the measured wind speeds was below 1 m s-1, were also excluded from
the analysis.
4.2. Ground heat flux
Calculations according to the above-given theory are based on measured temperatures and water
contents in August 1996. Fortunately, the measured soil water content was almost constant over
the study period. Moreover, in each of the examined profiles (hummock and hollow), a layer with
nearly constant water content with depth could be distinguished, where also a pair of temperature
sensors was available (Table 1). In the hummock profile, water content was about 40% at 10 and
20 cm depths. Temperature sensors were also available at these depths. In the hollow profile,
water content was near 95% at 15 and 25 cm depths, and temperatures were measured at 14 and
20 cm. Since water content was nearly constant, it allows us to determine the thermal
conductivity confidently and calculate ground heat fluxes from temperature gradients/differences.
Thermal conductivity is a function of volumetric water content of soil, xw (%), in peat (Farouki,
1986). Moreover, the relationship κ=0.0048xw+0.04 for peat is similar for many organic materials
11
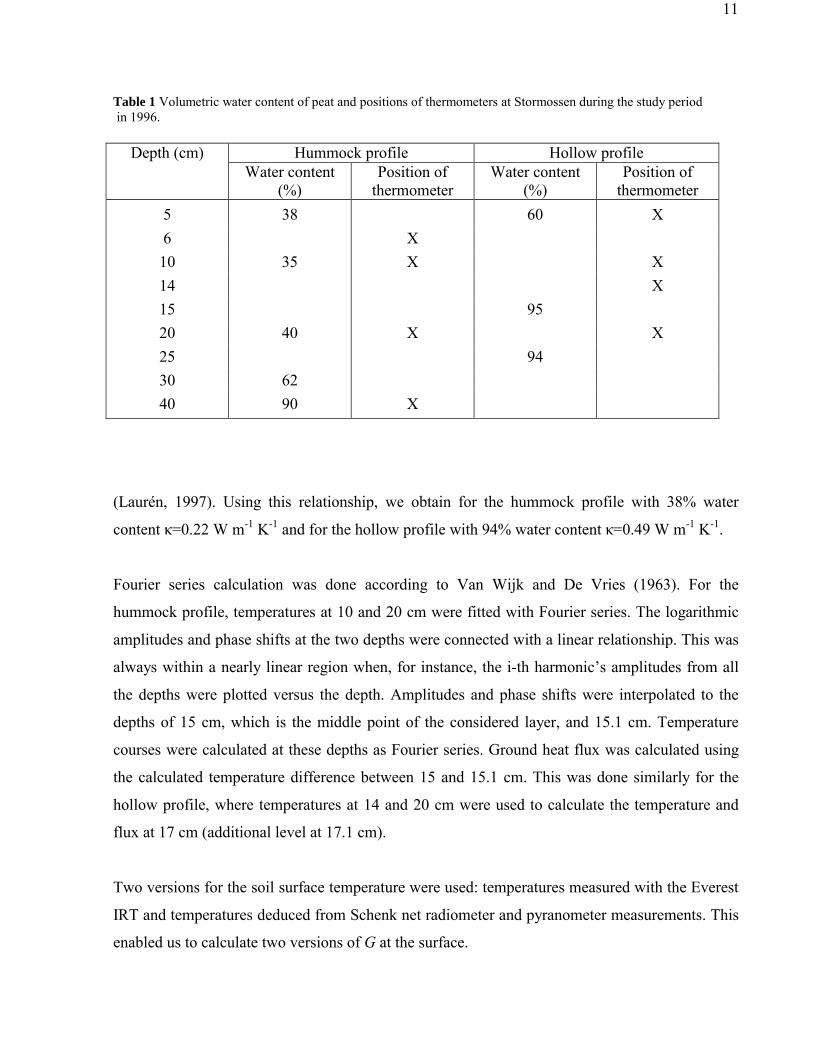
Table 1 Volumetric water content of peat and positions of thermometers at Stormossen during the study period in 1996.
Hummock profile Hollow profile Depth (cm) Water content
(%) Position of
thermometer Water content
(%) Position of
thermometer 5 38 60 X 6 X 10 35 X X 14 X 15 95 20 40 X X 25 94 30 62 40 90 X
(Laurén, 1997). Using this relationship, we obtain for the hummock profile with 38% water
content κ=0.22 W m-1 K-1 and for the hollow profile with 94% water content κ=0.49 W m-1 K-1.
Fourier series calculation was done according to Van Wijk and De Vries (1963). For the
hummock profile, temperatures at 10 and 20 cm were fitted with Fourier series. The logarithmic
amplitudes and phase shifts at the two depths were connected with a linear relationship. This was
always within a nearly linear region when, for instance, the i-th harmonic’s amplitudes from all
the depths were plotted versus the depth. Amplitudes and phase shifts were interpolated to the
depths of 15 cm, which is the middle point of the considered layer, and 15.1 cm. Temperature
courses were calculated at these depths as Fourier series. Ground heat flux was calculated using
the calculated temperature difference between 15 and 15.1 cm. This was done similarly for the
hollow profile, where temperatures at 14 and 20 cm were used to calculate the temperature and
flux at 17 cm (additional level at 17.1 cm).
Two versions for the soil surface temperature were used: temperatures measured with the Everest
IRT and temperatures deduced from Schenk net radiometer and pyranometer measurements. This
enabled us to calculate two versions of G at the surface.

12
The Fourier series analysis was done for each day separately, calculating ω with the 24 h period
and using four harmonics only.
The G values using the Everest and Schenk meters were averaged for both the hummock and the
hollow profile. These in turn were weight averaged, giving a 0.30 weight to hummocks and 0.70
weight to hollows.
5. Results and Discussion
5.1. Roughness length zou
No displacement height, d, was included in Eqs. (1) – (3) and in the analyses, because the
hummocks were relatively low and the grass was low and sparse. If we had used a d greater than
zero, the turbulent fluxes would have been smaller. The bad closure of the surface energy balance
discussed in the next section would then be even worse.
Daily mean values of the roughness length zou for Ryggmossen vary between 1 and 3 cm with an
average value of 1.86 cm. No significant dependence on wind direction was observed. The scatter
in the Stormossen data was much higher; zou values could exceed 20 cm and the mean was 7.4
cm. We cannot see any reason for Stormossen zou to be more than three times higher than for
Ryggmossen because the surfaces were very similar. A careful inspection of the Stormossen wind
data, profile by profile, revealed that many profiles supported zou=2 cm and that the series giving
too high values of zou could have been due to an underestimated wind speed at the lowest
measurement level. The cup anemometer could have been stalled at low wind speeds, if not
continuously then at least occasionally. Therefore, it was decided to use zou=2 cm even for
Stormossen data analysis. In order to reduce random errors in u* estimates, all the wind profiles
were finally evaluated with a fixed zou.
5.2. Surface energy balance – partitioning of components and closure
13
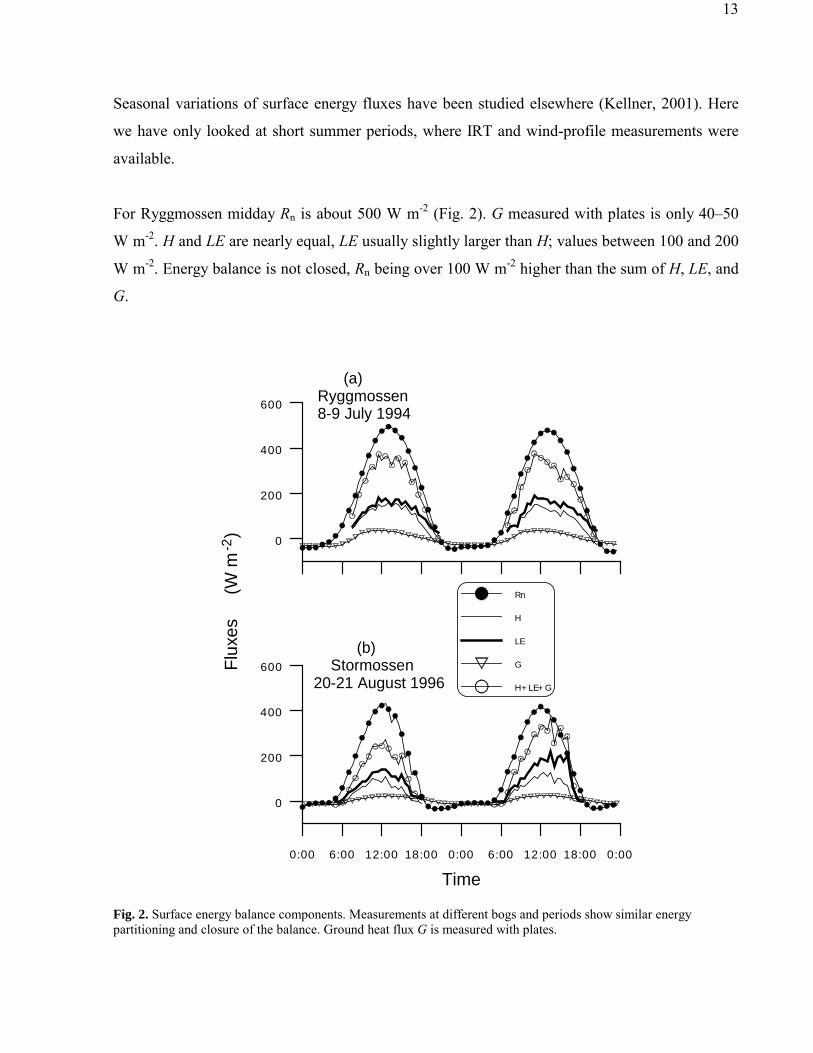
Seasonal variations of surface energy fluxes have been studied elsewhere (Kellner, 2001). Here
we have only looked at short summer periods, where IRT and wind-profile measurements were
available.
For Ryggmossen midday Rn is about 500 W m-2 (Fig. 2). G measured with plates is only 40–50
W m-2. H and LE are nearly equal, LE usually slightly larger than H; values between 100 and 200
W m-2. Energy balance is not closed, Rn being over 100 W m-2 higher than the sum of H, LE, and
G.
0
200
400
600
(a)Ryggmossen8-9 July 1994
0:00 6:00 12:00 18:00 0:00 6:00 12:00 18:00 0:00
Time
0
200
400
600Flux
es
(W
m
)
(b) Stormossen20-21 August 1996
Rn
H
LE
G
H+LE+G
-2
Fig. 2. Surface energy balance components. Measurements at different bogs and periods show similar energy partitioning and closure of the balance. Ground heat flux G is measured with plates.

14
For Stormossen midday Rn is greater than 400 W m-2 (Fig. 2). The plate-measured G is below 30
W m-2. That is even lower than for the previous year. However, this is not so striking as both net
radiation and soil heat flux normally decreases from mid June to end of August. H is about 100
W m-2. LE is larger than H and up to 200 W m-2. Energy balance closure is as bad as up to 200 W
m-2. A discrepancy is present, more or less, on every analysed day.
As we see, LE is not considerably exceeding H. Because the surface can get very hot relative to
the air (8–10 K higher), considerable sensible heat fluxes occur.
Similar bog energy partitioning was obtained by den Hartog et al. (1994): H and LE from direct,
eddy correlation measurements were approximately equal and nearly 150 W m-2. Moors et al.
(1998) report for a drained bog that sensible heat fluxes reach typically 100–200 W m-2 but latent
heat fluxes are rather high, 300–400 W m-2. Note that their LE is calculated as a residual term of
the surface energy balance.
Den Hartog et al. (1994) report a good surface energy balance closure of about 90%. Thompson
et al. (1999) obtained good closure (91%) with fetches above 600 m and poor closure (78%) with
limited fetches below 300 m. Lafleur et al. (1997) got similarly poor closure with both good and
bad fetches, the distinction criterion being about 400 m. We obtained poor closure of about 75%
although our fetches above 400 m can be classified to be good rather than bad.
The two bogs were different in size, shape, and orientation relative to the north, also, the distance
from the masts to the nearest forest was different, but the discrepancy in the energy budget is
very similar. It is difficult to attribute this problem to the profile measurements, rather the ground
heat flux needs to be estimated better. An attempt is given below.
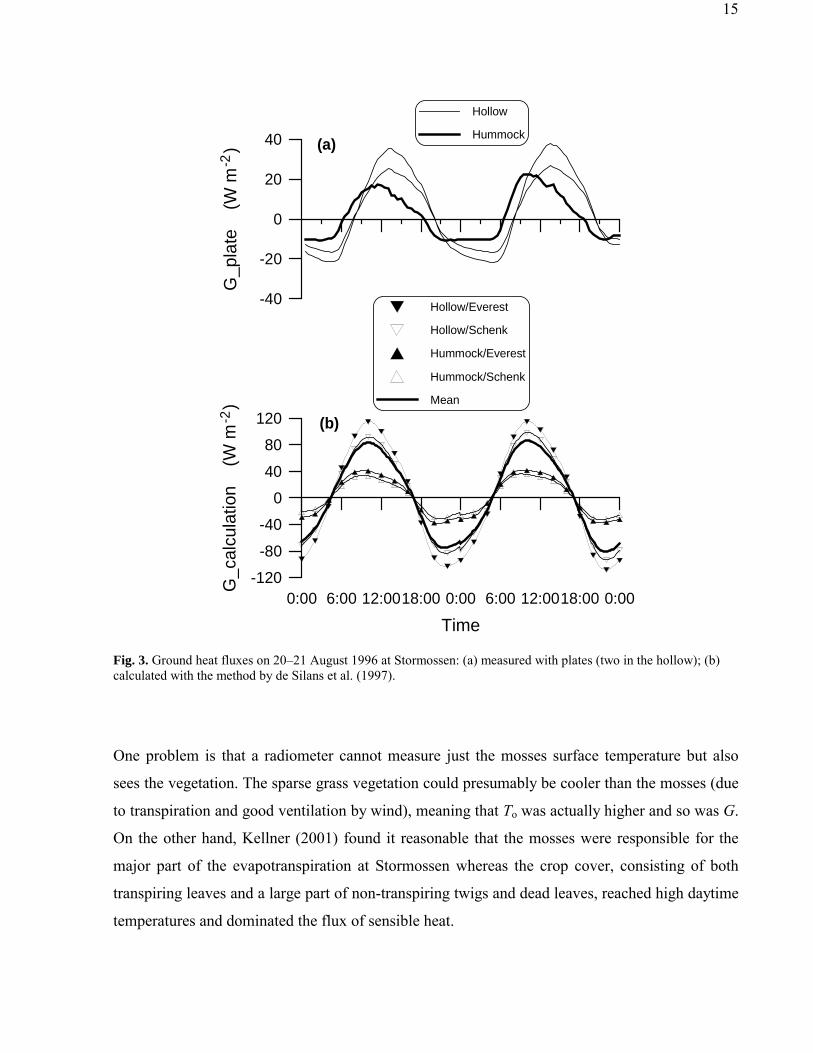
The alternative method to calculate ground heat fluxes could only be applied on Stormossen data,
because soil temperature and wetness measurements were not available for Ryggmossen. Both
the measured and calculated fluxes show similar features (Fig. 3): the flux in hollows is about
twice the flux in hummocks, the shape of the hollow curves is symmetrical while the maximum is
skewed towards morning hours in the case of hummocks. The most important result is that the
calculated area-averaged fluxes are about 60 W m-2 higher than the measured ones at noon.
15
0:00 6:00 12:0018:00 0:00 6:00 12:0018:00 0:00
Time
-120-80-40
04080
120
G_c
alcu
latio
n
(W m
)
-40
-20
0
20
40
G_p
late
(W
m
)
Hollow/Everest
Hollow/Schenk
Hummock/Everest
Hummock/Schenk
Mean
Hollow
Hummock(a)
(b)
-2-2
Fig. 3. Ground heat fluxes on 20–21 August 1996 at Stormossen: (a) measured with plates (two in the hollow); (b) calculated with the method by de Silans et al. (1997).
One problem is that a radiometer cannot measure just the mosses surface temperature but also
sees the vegetation. The sparse grass vegetation could presumably be cooler than the mosses (due
to transpiration and good ventilation by wind), meaning that To was actually higher and so was G.
On the other hand, Kellner (2001) found it reasonable that the mosses were responsible for the
major part of the evapotranspiration at Stormossen whereas the crop cover, consisting of both
transpiring leaves and a large part of non-transpiring twigs and dead leaves, reached high daytime
temperatures and dominated the flux of sensible heat.

16
Using the new method to calculate G allows to improve the surface energy balance closure by 60
W m-2, but that is not enough to close the budget properly. Still, a discrepancy of 100 W m-2
remains unexplained. One possible explanation is that the ground heat flux is even higher than
predicted by the alternative method. Kellner (2002) has pointed out the importance of lateral heat
exchange in hummocks. His model simulations required much higher heat inputs into the
hummocks in order to fit the simulated temperatures in the hummocks with the corresponding
measured temperatures
6. Conclusions
Micrometeorological measurements at two bog sites in central Sweden have been analysed to
estimate the surface energy balance components. Turbulent fluxes of sensible and latent heat are
partitioned almost equally, the latent heat fluxes still being systematically higher. The surface
energy balance closure is poor, discrepancies of up to 200 W m-2 appear. As the discrepancies at
the two bogs are very similar, there should not be any fetch-related problem in profile
measurements. One reason for the poor closure might be that the ground heat flux that is
measured with plates is erroneously too low, probably due to bad thermal contact between the
plate and the peat. Calculations with an alternative method from the literature, which is based on
soil temperature measurements and knowledge of peat moisture content, give fluxes that reach 80
W m-2 near noon. This improves the energy balance closure, but some 100 W m-2 still remains
unexplained. We believe that very detailed peat temperature and moisture measurements in
combination with 3D modelling taking the structure of hummocks into account can give a new
insight into these problems. For the time being, the ground heat flux plates should be avoided
when the Bowen ratio method is used.
Acknowledgements
The authors thank Dr. Mattias Lundblad and Mr. Ola Pettersson for providing Ryggmossen TIS
data, Mr. Per-Erik Mellander for helping with field work at Stormossen and the Swedish Natural
Science Research Council for financial support.

17
References
Brutsaert, W., 1982. Evaporation into the Atmosphere. D. Reidel Publishing Company,
Dordrecht, Holland, 352 pp.
Burba, G.G., Verma, S.B., Kim, J., 1999. Surface energy fluxes of Phragmites australis in a
prairie wetland. Agric. For. Meteorol. 94, 31–51.
Campbell, D.I., Williamson, J.L., 1997. Evaporation from a raised peat bog. J. Hydrol. 193, 142–
160.
den Hartog, G., Neumann, H.H., King, K.M., Chipanshi, A.C., 1994. Energy budget
measurements using eddy correlation and Bowen ratio techniques at the Kinesheo Lake
tower site during the Northern Wetland Study. J. Geophys. Res. 99(D1), 1539–1549.
de Silans, A.P., Monteny, B.A., Lhomme, J.P., 1997. The correction of soil heat flux
measurements to derive an accurate surface energy balance by the Bowen ratio method. J.
Hydrol. 188–189, 453–465.
Farouki, O.T., 1986. Thermal properties of soils. Trans. Tech. Publications, Series on Rock and
Soil Mechanics 11, 136 pp.
Halldin, S., Bergström, H., Gustafsson, D., Dahlgren, L., Hjelm, P., Lundin, L-C., Mellander, P-
E., Nord, T., Jansson, P-E., Seibert, J., Stähli, M., Szilagyi-Kishne, A., Smedman, A-S.,
1999. Continuous long-term measurements of soil-plant-atmosphere variables at an
agricultural site. Agric. For. Meteorol. 98–99, 75–102.
Halliwell, D.H., Rouse, W.R., 1987. Soil heat flux in permafrost: characteristics and accuracy of
measurements. J. Climatol. 7, 571–584.
Högström, U., 1996. Review of Some Basic Characteristics of the Atmospheric Surface Layer.
Boundary-Layer Meteorol. 78, 215–246.
Kellner, E., 2001. Surface energy exchange and hydrology of a poor Sphagnum Mire. Acta
Universitatis Upsaliensis, Comprehensive Summaries of Uppsala Dissertations from the
Faculty of Science and Technology 657, Uppsala, Sweden, 38 pp.
Kellner, E., 2002. Surface energy fluxes and control of evapotranspiration from a Swedish
Sphagnum mire. Agric. For. Meteorol. 110, 101–123.
Kellner, E., Halldin, S., 2002. Water budget and surface-layer water storage in a Sphagnum bog
in central Sweden. Hydrol. Processes. 16, 87–103.

18
Kellner, E., Lundin, L-C., 2001. Calibration of time domain reflectometry for water content in
peat soil. Nordic Hydrol. 32, 315–332.
Lafleur, P.M., McCaughey, J.H., Joiner, D.W., Bartlett, P.A., 1997. Seasonal trends in energy,
water, and carbon dioxide fluxes at a northern boreal wetland. J. Geophys. Res. 102(D24),
29009–29020.
Laurén, A., 1997. Physical properties of the moor layer in a scots pine stand. III. Thermal
conductivity. Can. J. Soil Sci. 77, 643–648.
Lindroth, A., Halldin, S., 1990. Gradient measurements with fixed and reversing temperature and
humidity sensors above a thin forest. Agric. For. Meteorol. 53, 81–103.
Mölder, M., 1997. Parameterization of exchange processes over a barley field. Boundary-Layer
Meteorol. 84, 341–361.
Mölder, M., Lindroth, A., Grelle, A., 1999. Experimental determination of the roughness length
for temperature over a field of tall grass in central Sweden. Geogr. Ann. 81A, 87–99.
Mölder, M., Kellner, E., 2002. Excess resistance of bog surfaces in central Sweden. Agric. For.
Meteorol. (submitted)
Moore, K.E., Fitzjarrald, D.R , Wofsy, S.C., Daube, B.C., Munger, J.W., Bakwin, P.S., Crill, P.,
1994. A season of heat, water vapor, total hydrocarbon, and ozone fluxes at a subarctic fen.
J. Geophys. Res. 99(D1), 1937–1952.
Moors, E.J., Stricker, J.N.M., van den Abeele, G.B., 1998. Evapotranspiration of cut over bog
covered by Molinia Caerulae. Report 73. Wageningen Agricultural University, Department
of Water Resources, Wageningen, 66 pp.
Phersson, M., Pettersson, O., 1997. Energy and water balances of a bog in central Sweden.
Nordic Hydrol. 28, 263–272.
Souch, C., Wolfe, C.P. and Grimmond, S.B., 1996. Wetland evaporation and energy partitioning:
Indiana Dunes National Lakeshore. J. Hydrol. 184, 189–208.
Spieksma, J.F.M., Moors, E.J., Dolman, A.J., Schouwenaars, J.M., 1997. Modelling evaporation
from a drained and rewetted peatland. J. Hydrol. 199, 252–271.
Thompson, M.A., Campbell, D.I., Spronken-Smith, R.A., 1999. Evaporation from natural and
modified raised peat bogs in New Zealand. Agric. For. Meteorol. 95, 85–98.
Van Wijk, W.R., De Vries, D.A., 1963. Periodic temperature variations in a homogeneous soil.
In: Van Wijk, W.R. (Ed.), Physics of plant environment. North-Holland Publishing
Company, Amsterdam, pp. 102–143.

19
Zilitinkevich, S.S., 1970. Dynamics of the atmospheric boundary layer. Hyrometeorol. Press.,
Leningrad, 292 pp. (in Russian)