energy audit of lighting in east african … · energy audit of lighting in east african breweries...
TRANSCRIPT

ENERGY AUDIT OF LIGHTING IN EAST AFRICAN BREWERIES LTD (EABL)
BREWING DEPARTMENT
BY
LAWRENCE MUTUA MUMO
F52/82755/2012
POST GRADUATE DIPLOMA
ENERGY MANAGEMENT
UNIVERSITY OF NAIROBI
MAY 2013

DECLARATION
STUDENTS DECLEARATION
This project is my original work and has not been presented for degree in any other university.
No part of this project may be reproduced without the prior permission of the author/University of
Nairobi
Signature……………………………………….
Date ………………………………………………..
MUMO, Mutua Lawrence F52/82755/2012
SUPERVISORS DECLARATION
I confirm that the above student carried out this research under our supervision as university supervisor.
Signature ……………………………………
Date …………………………………………….
Prof F.M. Luti
(Department of mechanical and manufacturing engineering, University of Nairobi)

ACKNOWLEDGEMENT
The almighty lord has guided me through the course and given me the wisdom and strength plus ability
to carry out this research to completion. I wish to acknowledge each person who helped me in his or her
special way to make this project a success. I would like to sincerely thank my supervisor Prof. F M Luti
for providing me with guidance throughout the project.

DEDICATION
I dedicate this project to my dear son and wife, Trevor and Mary thanks for your undying support and to
my dear brothers and sister.

TABLE OF CONTENTS
DECLARATION .........................................................................................................................................
................................................................................................................................................................. I
ACKNOWLEDGEMENT ...............................................................................................................................
................................................................................................................................................................ II
DEDICATION .............................................................................................................................................
............................................................................................................................................................... III
LIST OF TABLES................................................................................................................................ VI
LIST OF FIGURES ........................................................................................................................................
.............................................................................................................................................................. VII
ABBREVIATIONS AND ACRONYMS ............................................................................................................
............................................................................................................................................................. VIII
APPENDICES ..............................................................................................................................................
X
ABSTRACT ..................................................................................................................................................
............................................................................................................................................................... XI
CHAPTER 1:
1.1 Background of the Study ................................................................................................................... 1
1.2 Statement of the Problem ................................................................................................................ 3
1.2.1 Company description ..................................................................................................................... 4
1.3 Objectives.......................................................................................................................................... 5
CHAPTER 2: LITERATURE REVIEW
2.1 Introduction ...................................................................................................................................... 6
2.2 Energy management process ............................................................................................................ 9

2.2.1 Energy data analysis ..................................................................................................................... 10
2.2.2 Light energy consumption audit .................................................................................................. 10
2.2.3 Implementation ........................................................................................................................... 10
2.2.4 Monitoring & targeting ................................................................................................................ 11
2.2.5 Benefits of monitoring and targeting ........................................................................................ 11
2.2.6 Main elements of monitoring & targeting ................................................................................... 12
2.3 Electrical metering and tariffs ......................................................................................................... 12
2.3.1 Cost of electricity ......................................................................................................................... 13
2.3.2 Rate structure .............................................................................................................................. 13
2.3.3 Rate element ................................................................................................................................ 13
2.3.4 Simple payback period ................................................................................................................. 14
2.4 Lighting system ............................................................................................................................... 15
2.4.1 Effective use of daylight ............................................................................................................... 16
2.5 IES recommended lighting levels .................................................................................................... 17
2.6 Assessing lighting system ................................................................................................................ 18
2.6.1 Assessing lighting system ............................................................................................................. 18
2.6.2 Determination of installed load efficacy and installed load efficacy ratios ................................. 18
2.6.3 Basic units of light ........................................................................................................................ 19
2.7 Light sources ................................................................................................................................... 20
2.7.1 Incandescent lamps ..................................................................................................................... 20
2.81 Fluorescent fixtures ...................................................................................................................... 20
2.8.2 High Sodium Pressure Lamps ....................................................................................................... 21
CHAPTER THREE: METHODOLOGY
3.1 Introduction .................................................................................................................................... 22
3.2 Data collection methods ................................................................................................................. 22
CHAPTER 4: RESULTS AND DISCUSSION
4.1 Introduction .................................................................................................................................... 24
4.2 Burnt-out fluorescent light fixtures ................................................................................................ 24
4.3 Halogen security light system ......................................................................................................... 28
4.4 Reflectors installation ..................................................................................................................... 29

4.5 Energy management matrix ............................................................................................................ 29
CHAPTER 5: CONCLUSION AND RECOMMEDATIONS
5.1 Conclusion ....................................................................................................................................... 31
5.2 Recommendations .......................................................................................................................... 32
REFERENCES .......................................................................................................................................... 34

LIST OF TABLES
Table 2.1 The current customer categories in Kenya..........................................................14
Table 2.2 Lighting levels recommended for various tasks....................................................17
Table 2.3 Determination of number of measurement points................................................18
Table 2.4 Indicators of performance.....................................................................................19
Table 4.1 Analysis for savings from fluorescent lamps.........................................................27
Table 4.2 Energy management matrix.................................................................................30
Table B 1 Analysis for savings from fluorescent lamps.........................................................36
Table B 2 site data for 58W fluorescent light fixture............................................................37
Table B 3 Daily electrical consumption at EABL....................................................................38

LIST OF FIGURES
Page
Fig 2.1 connection of fluorescent lamp………………………………………………………………………………………….21

ABBREVATIONS AND ACRONYMS
EABL East African Breweries ltd
EAC Energy accountable centre
EMS Energy Management System
EUI Energy use indices
ESO Energy saving opportunities
HSP High sodium pressure
IEA International Energy Agency
IES Illuminating engineering society
ILER Installed load efficiency ratio
KPLC Kenya power and lighting
Ksh Kenya shillings
KVA Kilo volt amperes
KVAHr Kilo volt ampere hours
KW Kilo watts
LPG Liquid petroleum gas

MT Monitoring and targeting
RI Room index
SADC South African Development Corporation
SPB Simple payback period
UDV United Distillers Ventures
VSD Variable speed drives
BAT Best available techniques

APPENDICES
APPENDIX A Lamp types and their features……………………………………………………………………………….36
APPENDIX B site data for 58W fluorescent light fixture…...............................................................37
APPENDIX C Daily electrical consumption at EABL …………………………………………………………………… 38
APPENDIX D East African Breweries energy policy………………………………………………………………………… 39

ABSTRACT
Currently EABL energy policy does not define the roles of each employee in implementing it; this is a big
drawback since many people do not take the energy saving initiatives with the seriousness they deserve.
A lot of energy is wasted in the brewing department through lights, which are left on when not in use.
Systems and not people should be the driving factor of saving energy in the brewing department this is
due to the fact that automated system are more effective when it comes to switching on and off lights
rather than reliance on people to remember to switch off lights. This is going to be achieved through
installation of occupancy sensors and photo sensors respectively and removing light fixtures where
there is excess light.
Energy consumption measurement meters should also be installed within the department for various
types of consumption instead of the current system of one meter for the whole operation of the
department. This will enable an itemized audit and ease of monitoring and reporting changes for further
evaluation. All the fluorescent light fixtures currently being used should be replaced with energy
efficient fluorescent fixtures utilizing electronic ballast to save energy.
There are a lot of burnt out fixtures which are consuming power without giving out any output and
these should be replaced or removed in areas with excess light this is a no cost measure which is going
to save the company over ksh 300,000 annually by removing of the fixtures which are not required in
some areas
The incandescent lamps should all be replaced with the compact fluorescent lamps, which consume less
energy, and they are more efficient and they have a longer lifespan, this will bring down the cost of
power consumption and the cost of replacing the bulbs since they have longer lifespan
All the employees should be given training on the importance and ways of saving energy and the
benefits, which can be brought by such initiatives
CHAPTER ONE
INTRODUCTION
1.1 Background
East African Breweries Limited (EABL) spends a sum of Ksh500 million on average per annum, on
electricity.
A small percentage reduction in the energy consumption and thus the cost reduction will allow for
significant reduction in the cost of production per unit volume of the factory, this will translate to more
competitive pricing and increased profit for the company. EABL as a manufacturing establishment
utilizes several inputs which determine its productivity and the competitiveness and profitability in the
market those inputs include:
Capital investment –this refers to the further capital input into the establishment inform
of profit ploughed back to buy new machinery and equipment.
Raw material – these refers to the process input which are processed through a pre-
determined set of factory operation to produce the finished products.
Energy cost – energy expenses take a big share of the company`s total expenditure.
Human resource- this refers to the skilled and semi skilled labor input into the
production. Process and the supporting staff, the labor costs include wages and salaries.
Overhead costs –these refers to the operating expenses incurred by the company to
facilitate its operation, these include: maintenance costs stationary, insurance and other
bills.

Energy is one of the major inputs for the economic development of any country. For the developing
countries the energy sector takes a critical contribution view of the ever increasing energy needs
requiring huge investment to meet them.
In the developed countries there are various motivations to improve the energy efficiency. Reducing
energy use will directly reduce the energy cost of a company which results in financial savings and
better pricing of goods to consumers. Reducing energy use is also a key to reducing the green house
gas emissions according to Tuner and Steve, energy management handbook 6th edition, 2007.
According to the (IEA) International Energy Agency, (2009), improved energy efficiency in industrial
processes buildings and transportation has the potential of reducing the world energy needs by one
third by the year 2050; this will help to control the global emissions of greenhouse gases. Towards
this effort energy efficiency and renewable energy are the twin pillars of sustainable energy policy.
According to Sant R., (1991), economic growth is directly proportional to per capita energy
consumption. The energy capacity in most of the developing countries is below the demand thus the
slow economic growth pace.
Reduction in the level of energy importation and the depletion of the domestic energy resources can
be realized by the use of energy efficient systems.
The Kenyan government through the ministry of energy and (KPLC) Kenya power and lighting
company has introduced pilot project to supply energy saving bulbs for domestic users in an effort to
save energy.
Energy is consumed in all the sectors of the economy namely the manufacturing, commercial,
transport and residential. The manufacturing sector is the largest consumer of electrical energy
followed by the commercial sector.

1.2 Statement of the problem
For the enhanced productivity and profitability of EABL as a manufacturing company, competitiveness
of the company`s products in the market is fundamental as a driver of its growth. For enhanced
market performance of the company in view of the competition promotion effort and good pricing
are necessary. All these are achieved with low cost of production i.e. controlled factory overheads of
which energy costs take a big share. This can be reduced considerably because unlike other inputs in
manufacturing energy is a manageable expense.
The nature of operating environment and the competition in business requires clear strategies for
managing the operating expenses which are incurred on daily basis including energy cost. Not only is
energy manageable but organizations can set up measures to asses energy use and identify energy
savings opportunities.
EABL operates in 24 hours for seven days a week 365 a year at all this time light is required thus
lighting accounts for a major expense of energy consumption.
The Brewing Department is engaged in production of beer from the raw materials which is barley and
malt converting them to worth then through fermentation and filtration before being passed to
packaging.
The Department occupies a large area with 850 fluorescent light fixtures using magnetic ballast, 100
incandescent lamps, 30 High Sodium Pressure Lamps (HSP), 40 High Bay Incandescent fixtures.
Electrical energy is used to energize all the lights within the department.

Energy audit of the lights in the department will be conducted to establish energy saving
opportunities which can be realized by carrying out no cost measures and low cost measures
implementation. This will be done by looking at the times of use of the lights, the benefits and savings
of replacing the lights with better more efficient alternatives, the number of the fixtures with a view
of establishing if they can be reduced and still maintain enough light level.
EABL has been working towards increased productivity at a reduced cost and higher profitability but a
major drawback to this goal is the escalating cost of energy and the inefficient utilization of the
factors of production thus the need for professional energy audit and management. Energy
management entails pursuing practical means of energy saving with a clear focus of reaching the
target energy use levels. The achievement of this will depend on getting commitment from the top
management down all levels of the organization and this will include the establishment of functional
energy management systems (EMS).
Light is not a direct factor of production unlike things like pumps, motors and compressors thus is
always ignored when it comes to implementation of energy saving measures but it consumes a
considerable sum of energy and it can be controlled by introduction of simple measures
1.2.1 Company description
East African breweries ltd (EABL) is a beverage producing company with beer, spirits, and non alcoholic
drinks as its main products. The company does brewing, distilling, packaging marketing and distribution
in eastern Africa countries, south Sudan, great lakes region and also export to Europe and America.
The company produces brands like Tusker, Pilsner, Guinness, White Cap, Senator, Balozi, Bell lager,
Smirnoff Red, Smirnoff Black, Tusker Lite, White Cap Lite and also non alcoholic drinks like Malta
Guinness and Alvaro. In addition EABL distills and produces a range of spirits brands for both local and

export market such as Smirnoff vodka, Popov vodka, Richot Brandy, Three Barrels, Kenya Kane, Kane
Extra, Kenya Gold, and also imports a lot of premium brands from the mother company Diageo plc for
both domestic and duty free market.
The company was incorporated in 1922 as Kenya breweries ltd and later in 1936 it changed its name to
east African breweries. EABL is headquartered in Nairobi Ruaraka area and it is a subsidiary of Diageo
International Company of United Kingdom. EABL Kenya is organized into four major departments
namely:
1. Brewing Department
This is the start of the production process where raw materials which include: Malt, Barley, Sugar, Hops,
Adjuncts and water are converted into beer.
2. Packaging Department
This is where the finished product from the brewing is passed on for bottling and labeling. This done by
Use of highly automated machines observing all the food safety and quality procedures to deliver the
Best quality product to the customer.
3. Utilities
Utilities form the heart of the entire plant, it is charged with constantly providing, regulating, and
Maintaining utility resources such as electricity, steam, carbon dioxide, water, and compressed air also
operating the cooling plant.
4. United Distillers Ventures (UDV)
This is the distillery section which specializes in production of wines and spirits.
1.3 Objectives
To identify energy saving opportunities (ESOs) for the department through the lights
To identify the number of lighting fixtures in the Brewing Department and the number required
for sufficient lighting.

Collect data of lighting fixtures in the department and consider better more energy efficient
alternatives
CHAPTER TWO
LITERATURE REVIEW
2.1 Introduction
East African Breweries limited spends a sum of 1.10 billion Kenya shilling on average every year on its
major energy resources alone this sum comprises of 500 million on electricity and 600 million on fuel oil.
Minor energy sources utilized by the company include the liquefied petroleum gas (LPG) and diesel.
A small percentage reduction in the energy consumption, and thus the cost will allow for significant
reduction in the cost of production of the company. This will in turn lead to a more competitive pricing
of the company products. The earned savings can be ploughed back to benefit the business in terms of
acquisition of new energy efficient equipments and marketing of its products.
EABL has a policy on energy, waste management and environment conservation. Towards
implementation of the policy the company has put up a waste management system which is both
aerobic and anaerobic to manage the waste from the production process. The organization is
committed in promoting energy efficiency use, reduction of waste disposal to the environment and
prevention of environmental degradation by its activities. In line with these the company has installed
Carbon dioxide recovery systems in the fermentation tanks and has also invested in tree planting
activities in various forests including Karura forest through the corporate sector department.
A number of energy saving systems has been established in the company to conserve energy and
ensure efficient energy use, these include:
Changing from hard start to soft start or variable speed drives (VSD) for most of the motors.

Installation of automatic temperature monitoring systems which vary the speed of the
controlled machine according to the load demand mostly in beer cooling systems.
The company has been installed with a supply of 66KV supplementing the existing 11KV this will
Present energy savings resulting from corona effects, harmonics effects, control and usage of Low
current resulting to low heat losses and also saving from having a stable power supply.
The facility has installed capacitor banks to ensure a high power factor thus mitigating the
power factor surcharges; the plant has a mean power factor of 0.97.
For two or more units performing the same functions the design is that one runs while the other
one is in standby mode since running on higher loads enhances the plant efficiency.
Boiler efficiency tests and flue gas analysis are frequently performed on running boilers
Constant measuring and recording of energy consumption of the main consumers in the facility
with a view of establishing a certain trend of consumption.
Most high consuming areas and machineries are metered, to establish the saving opportunities
The high bay security lights have been connected to photo sensors which puts them on at evening
and off at daybreak
Energy saving education to all the personnel within the facility is planned especially on no cost
measures like switching off lights when there is enough natural light.
All the above measures shows the company commitment to energy management but is very important
to take an energy audit and have a clear understanding of what can be saved and where energy is being
lost thus the need for an energy audit. However EABL has not undertaken a proper energy audit of its
facility before except for an electricity evaluation conducted in 2008 among other energy evaluation
exercises. Thus as part of energy management and conservation initiative, a proper energy audit of the
lighting in brewing department of the facility was deemed necessary.

The audit was aimed at thoroughly assessing and inspecting all the functional areas to ascertain their
light use patterns and the type of light fittings in use. This will establish energy saving opportunities
(ESO) and undertake simple energy savings including no cost and low cost measures.
According to the “energy star”, Light can account for over 35% of energy consumption in an industry
depending on the type of activity carried out in them. Light control is one of the easiest ways to make
substantial energy savings for very little investment and its one of the most common energy saving
measures.
Light systems for commercial, industrial and even domestic are governed by standards regulation and
building codes in Kenya it is known as the local government act cap 256. Light not only needs to be
functional but must also meet occupational health and safety standards and be fit for purpose
In many cases office and industrial light is excessive and there is a considerable scope for making
passive energy savings these can be achieved by replacing inefficient luminaries, by replacing obsolete
lights with high performance low consumption alternatives and replacing magnetic ballast with
electronic ones. This kind of approach will work well in the brewing department since light is on for a
long period of time and reliance on manually switching off the light is not effective.
Energy management is a judicious exercise and effective use of energy to cut down on cost and
maximize profits. This can be done by evaluating the current types of lights in use, their rated
consumption compared to the area required light amount, this can be adjusted to reduce costs thus
enhancing chances of competitive pricing of the company products. Effective management of energy
consuming systems can lead to significant savings in energy and cost of energy and also extended
equipment life.

2.2 ENERGY MANAGEMENT PROCESS
Energy management is a process that involves energy auditing as well as a number of other key
elements. These elements include:
Overall assessment of the system, processes or building to identify areas of energy wastages and
in efficiency.
Periodic recording of electricity consumption by use of meters
A listing of appropriate energy conservation measures based on the assessment carried out within
the site over a duration
Regular review of actual energy and cost savings
Once initiated energy management becomes an ongoing process that is fully integrated with routine
plant operations or building maintenance, occupancy or mechanical equipment.
This process approach has a number of advantages:
The best and the most cost effective measures for a particular process or facility are selected and
implemented in proper order
Monitoring energy conservation results provide feedback for improving the energy consumption
and check on project progress
The useful service life of light fixtures and operation is extended
The long term result is a facility that operates at optimum energy efficiency and lower total
operating costs and giving maximum satisfaction to the users.
Like any other management process, energy management requires careful planning. Time is required to
analyze, plan and co-ordinate implementation of the energy saving measures.
There are four steps involved in effective energy management process those are:

2.2.1 Energy Data Analysis
The energy data analysis involves reviewing electricity energy bills on a monthly and annual basis and
comparing them to a previous reference year. In addition, Energy Use Indices (EUI) can be calculated
from the collected data such as energy intensity per unit production.
2.2.2 Light Energy Consumption Audit
A detailed energy audit is a complete assessment of the manufacturing facility and its energy use
patterns by looking at the type of lights installed, their consumption, determining how many are
working and how many are not working. The physical characteristics of the facility including the state of
the paint to determine if it reflects light or absorbs. Utility bills are reviewed to determine actual energy
use. The energy audit provides the necessary information for designing an energy savings
implementation program. Energy saving measures with individual payback periods is developed from
the energy audit. The list is usually divided into no-cost measures, low cost measures and upgrading
and retrofit projects involving considerable capital expenditure. Basing on the nature of the savings
measure, cost implications and payback periods, a simple implementation plan is developed. The no
cost and the low cost measures are usually undertaken first as they provide rapid payback and savings
generated can be used to finance other more costly measures.
2.2.3 Implementation
In addition to the recommended savings measures identified in the energy audit report many practical
concerns are considered when developing the implementation plan these include:
Existing maintenance program for the facility’s mechanical and electrical systems and the building
envelope
Existing repair and upgrading program for the envelope both mechanical and electrical systems
Projected plans for major repair or renovations
Available funds

When complete the implementation plan will integrate these concerns with energy management
measures the result will be practical and cost-effective program tailored to the specific operation.
2.2.4 Monitoring and Targeting
Monitoring and target (M&T) is the activity which uses information on energy consumption downwards.
It essentially combines the principle of thermodynamics and statistics. It involves setting certain targets
to be achieved and monitoring the progress to determine if the plan is on course or it has deviated from
the set target. The two activities of monitoring and targeting are distinct.
Monitoring is the regular collection of information on energy use; its purpose is to establish a basis for
management to control and determine when, where and why energy is deviating from an established
pattern, and as a basis for taking management action where necessary.
Target setting is the identification of levels of energy consumption which is desirable as a management
objective to work towards. The two activities have elements in common and they share much of the
same information but as a general rule monitoring comes before targeting.
2.2.5 Benefits of Monitoring and Targeting
Monitoring and targeting is a proven strategy for management. In addition to the cost savings the other
key benefits include:
Improved product costing
Improved budgeting
Enhanced preventive maintenance
Material waste avoidance
2.2.6 Main Elements of Monitoring and Targeting
The essential elements of a monitoring and targeting system would apply to a plant, cost centre,
process or other logical division of the facility.

Measuring energy consumption over time
Relating energy consumption to a measure of output production
Setting targets for reduced energy consumption without reducing plants output
Frequent comparison of consumption to target
Reporting the variance
Taking corrective action to rectify the variance
The logical division of the organization that does monitoring and targeting is termed as Energy
Accountable Centre (EAC).Monitoring an energy management program is important in order to
measure results and steer the program with progressive feedback. The simplest monitoring technique
involves daily review of energy use data against the production patterns and to take corrective actions
where necessary. Review of monthly energy bills and annual review will provide a base reference and
historical picture of energy use patterns.
2.3 ELECTRICAL METERING AND TARRIFFS
Electricity is a commodity that cannot be stored and it has to be made immediately available by the
generating utility upon demand by customer.
Electricity tariffs are used to measure electricity consumption as it is actually being used thus accurate
meter data is essential for energy management. Supply authorities measure power by kilowatts (kW)
and active energy consumption in kilowatt-hours (kWh) i.e. the product of power and time. Total
power is measured in kilovolt amperes (kVA), reactive or magnetizing power is measured in kilovolt
amperes or kilovars (kVAr) and consequently reactive energy is measured in reactive volt-amperes-
hours (kVAhr).

2.3.1 Cost of Electricity
Electricity tariffs set out the rates used by the supplier authority to calculate the cost of electricity
supplied to their customers. The tariffs also define the terms and conditions under which an electrical
service is provided to the consumers.
2.3.2 Rate Structure
Tariff rate structure set out the prices charged for electricity according to the class or scale of service
provided. The common classes of service are domestic, commercial industrial, agricultural and mining.
2.3.3 Rate Elements
Basically those comprise of:
1. A fixed charge which establishes a minimum billing
2. A power demand charge (kVA), or kW with power factor penalties) which is included to enable the
utility to recover the capital cost of providing the generating capacity, distribution and transmission
equipments of sufficient rating necessary to meet each and every consumer load requirements
throughout the year.
3. An energy consumption charge (kWh), which covers and is related to the utility fuel cost.
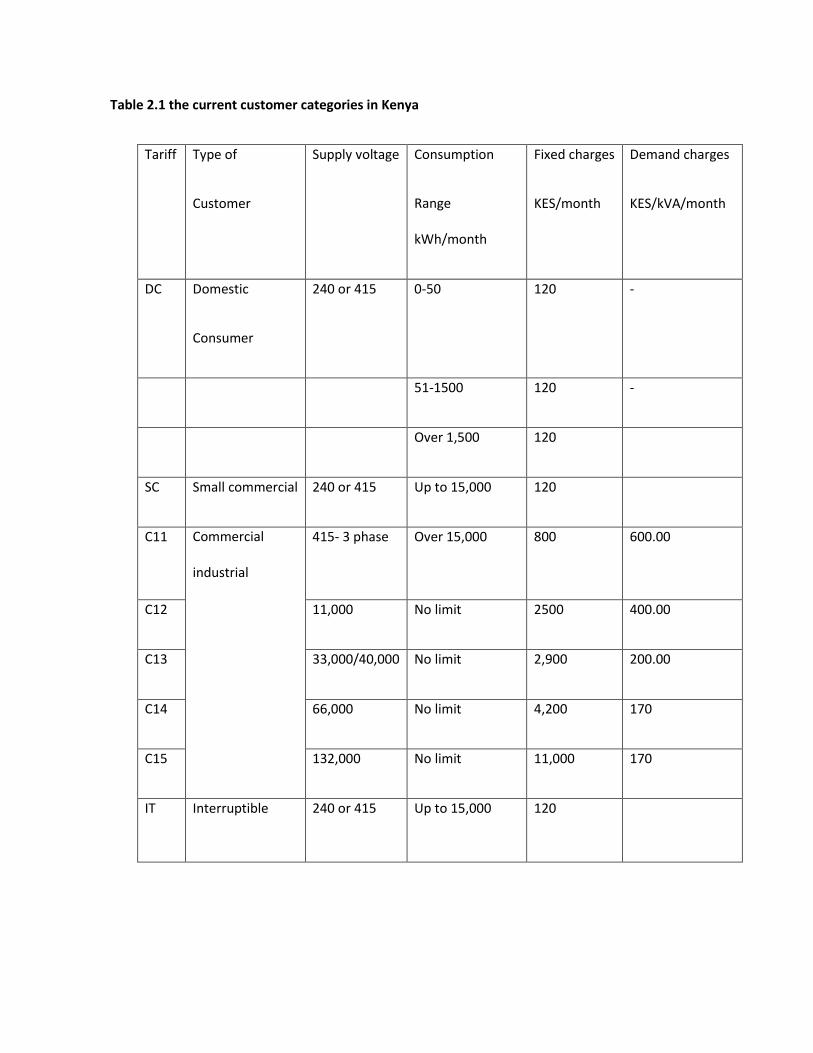
Table 2.1 the current customer categories in Kenya
Tariff
Type of
Customer
Supply voltage Consumption
Range
kWh/month
Fixed charges
KES/month
Demand charges
KES/kVA/month
DC Domestic
Consumer
240 or 415 0-50 120 -
51-1500 120 -
Over 1,500 120
SC Small commercial 240 or 415 Up to 15,000 120
C11 Commercial
industrial
415- 3 phase Over 15,000 800 600.00
C12 11,000 No limit 2500 400.00
C13 33,000/40,000 No limit 2,900 200.00
C14 66,000 No limit 4,200 170
C15 132,000 No limit 11,000 170
IT Interruptible 240 or 415 Up to 15,000 120

2.3.4 Simple Payback Period
Simple payback period refers to the length of time required for running total of net savings before
depreciation to equal the capital cost of the project. The basic idea is that the shorter the pay time the
more attractive the investment.
The features of this method are:
The method is simple to apply and favor project with short payback time, which reduces the
uncertainty of calculating savings for periods along time in future. The effects of change in
technology and market demands are reduced.
By nature the method does not consider the savings made after the payback period therefore
does not asses the overall value of the project.
The payback method does not indicate a rate of return on the money invested.
Simple payback period= [2.1]
2.4 LIGHTING SYSTEMS
The cost of lighting in the brewing department is high this is due to the large number of fittings involved
and the long duration which they operate. Good effective lighting depends not only on providing the
right level of lighting for the task but also on selecting the best suited light source and this will depend
on where the light is being used. Optimizing the lighting controls and utilizing the day light will save a lot
of energy which is normally wasted.

2.4.1 Effective use of day-light
To make good use of natural light however, requires more than just simple addition of more windows.
Light pouring in through the windows can create glare and cause other space to appear very dark by
comparison. The challenges of successful day-light are to admit only as much light as needed, distribute
it evenly, and avoid glare. The effective use of day-light can be greatly enhanced by the overall
architectural design of a building. Day light controls dim or switch lights when there is sufficient daylight,
and can save 30%-40% of energy use for lighting during the day.
2.5 IES RECOMMENDED LIGHTING LEVELS
The Oregon Office of energy has developed a list of lighting level recommendations for the common
tasks performed in buildings according to Oregon department of energy (www.oregon.gov) accessed on
10th march 2013. Lighting levels for the various function areas have been identified. These lighting levels
have been selected based on criteria established by the IES as per the table2.2.
The recommended lighting levels stated in table 2.2 are the maintained levels. This represents lighting
levels after the lamps have depreciated and the fixtures become dirty thus retrofit or new fixtures will
have light levels approximately 25 percent higher than those listed. This assumes existing fixtures are
cleaned when retrofitted.
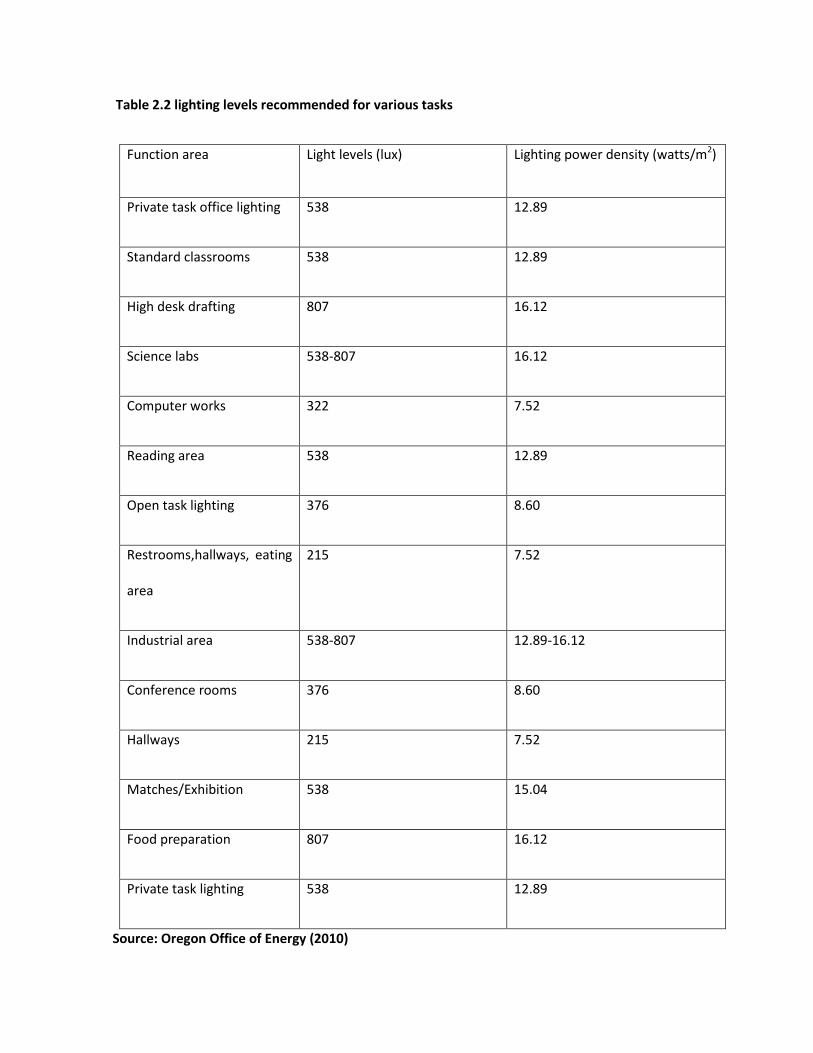
Table 2.2 lighting levels recommended for various tasks
Function area Light levels (lux) Lighting power density (watts/m2)
Private task office lighting 538 12.89
Standard classrooms 538 12.89
High desk drafting 807 16.12
Science labs 538-807 16.12
Computer works 322 7.52
Reading area 538 12.89
Open task lighting 376 8.60
Restrooms,hallways, eating
area
215 7.52
Industrial area 538-807 12.89-16.12
Conference rooms 376 8.60
Hallways 215 7.52
Matches/Exhibition 538 15.04
Food preparation 807 16.12
Private task lighting 538 12.89
Source: Oregon Office of Energy (2010)

2.6 ASSESSING LIGHTING SYSTEM
The procedure for assessing lighting system is as follows
2.6.1 Determining minimum number of measurement points
Calculate the room index (RI) using equation 2.2
[2.2]
The minimum number measurement of points is then established based on table 2.3
Table 2.3 Determination of number of measurement points
Room index Minimum measurement points
Below 1 9
1 and 2 16
2 and 3 25
3 and above 36
Source: Bureau of Energy Efficiency (2006)
2.6.2 Determination of installed load efficacy and installed load efficacy ratios
i. Calculate area of interior in m2
ii. Measure total power consumption of light fixture in watts
iii. Evaluate watts per square meter (W/m2) by dividing (ii) by (i)
iv. Ascertain maintained luminance (mean lux levels recorded at all points)

v. Divide (iv) by (iii) to get Lux per W/m2 this gives the installed load Efficacy (ILE)
vi. Obtain target Lux per W/m2 for type of interior applications using table 2.2
vii. Obtain Installed load Efficacy Ratio (ILER) by dividing (v) by (vi)
After obtaining the ILER then table 2.4 can be used to determine if to add or reduce the light level
Table 2.4 indicators of performance
ILER ASSESSMENT
0.75 and above satisfactory to good
0.51 to 0.74 Review suggested
0.5 and less Urgent action required
Source: Bureau of Energy Efficiency 2006
2.6.3 Basic units of light
Candela-this is the intensity of light
Candela (cd) = Intensity
Lumens-this is the amount of light falling on a surface
Lumens (lm)= Amount of light(Ф)
Lux- this is the density of light
Lux = Illuminance (E)
Lux = lumens/Area (m2)
Lx= I (cd)/distance (m2)
E (lx) = Ф (lm)/A (m2)

2.7 LIGHT SOURCES
The sun is an abundant source of radiant energy. On a sunny day the illuminance on earth’s surface may
exceed 100000 lux. On cloudy day the illuminance drops to 10000 lux. Comparing those with the
recommended levels of illumination which range from 150 lux for public assembly up to 650 lux for
drafting offices it is obvious that there is much scope for utilizing natural lighting in energy management
programs
The electric light sources convert electrical energy into light energy thus it is important that when fitting
the fixtures consideration should be given to the amount of light required depending on the use.
2.7.1 Incandescent lamps
In the incandescent lamps, light is produced by passing an electric current through a tungsten filament
containing an evacuated glass filled with inert gas. The current heats the filament. Only 3% to 6% of
input energy results in light production, the rest is dissipated as heat. The incandescent lamp is not an
efficient light source, but its compact size and variety of type, low cost and the fact that the heat loss
from the lamp makes the rooms warm makes it popular. In this case the incandescent lamps should be
replaced with compact fluorescent lamps which are more efficient and use only one quarter the energy
used by incandescent lamps with the same brightness and lasts 6 to 12 times longer this also means less
time and effort is spend buying and replacing the light bulbs (Eastop and Craft, 1998).

2.7.2 Fluorescent Fixtures
Fig 2.1 connection of fluorescent lamp
Source: How stuff works, www.howstuffworks.com(2001)
This consists of a starter and ballast, when the lamp is turned on the current passes through the least
resistance path through the starter to the electrodes on both ends of the tube which are filaments.
when heated they generate electrons sending them into the gas tube and ionizing the gas creating an
electrically conductive medium the voltage supply to the tubes is then maintained by the ballast.
2.7.3 High Sodium Pressure Lamps
A compact arc tube contains a mixture of xenon, sodium and mercury. The xenon gas which is easily
ionized facilitates striking the arc when voltage is applied across the electrodes. The heat generated by
the arc then vaporizes the mercury and sodium, the mercury vapor raises the gas pressure and voltage
and the sodium vapor produces the light when the pressure within the tube is sufficient. High pressure
sodium lamps are the most efficient artificial white light source with about 29% of the energy used by
the lamp producing light. These lamps require ballast to regulate the arc current flow and deliver the
proper voltage to the arc, they do not contain any starting electrodes instead an electronic starting
circuit within the ballast generates a high voltage pulse to the operating electrodes. The use of these
lights is basically security, and industrial lighting applications and also street lighting.

CHAPTER THREE
METHODOLOGY
3.1 INTRODUCTION
A preliminary survey of the brewing department was conducted. This exercise was aimed at studying
how the lights in the department are distributed and data collection about their power consumption,
their time of operation; how they are switched on and off and to determine the number of installed non
working light fixtures.
3.2 Data collection method
The brewing department is installed with only one meter for measurement of the electrical energy
consumption , this means there is no separate meter for lighting thus for the purpose of this audit data
was obtained from the light fixtures by recording their rated consumption capacity and measuring the
actual consumption by use of a clamp meter to measure the current. A survey of the number of hours of
use of the lights was also conducted this is due to the fact that some areas require light even during
daytime.
Physical count was also employed as a means of obtaining data by establishing the number of working
fixtures and the non working fixtures given that burnt- out fluorescent light fixtures consumes at least
15% of the rated power according to a study on industrial energy management carried out by south
African Development Community (SADC), together with Canadian International Development Agency on
2007.
The data was obtained by performing a one week survey of the site both for the interior and exterior
lights. In the interior survey the factors considered includes:

1. The size of the room
2. The colour of the room since some colours absorb light and others reflect light.
3. The activity which the room is used for since different activities needs different light levels.
4. The way the lights are switched on and off, this is due to the fact that most people just leave the
light on even when they are not required.
5. The kind of existing ventilation in the room, this includes the number and size of the windows
and possible means of modification to enable enough daylight in the room during daytime to
avoid using light.

CHAPTER FOUR
RESULTS AND DISCUSSION
4.1 INTRODUCTION
In this chapter the results of the audit are presented, analyzed and discussed. This is done with a view of
making modification which can bring about energy saving and thus reducing the cost of production. The
analysis is also looking to establish the suitability of the fixtures for the purposes they are installed and
consider an alternative better suited for the purpose.
4.2 BURNT-OUT FLUORESCENT LIGHT FIXTURES
Burnt-out fluorescent light fixtures will still consume some energy. In practice, a fused fixture will
consume 15% of its rated power according to SADC industrial energy management project. The survey
conducted for whole brewing department shows the light installation was done without consideration
of the required light levels for the area.
Some of the light fixtures are not working but still the light level was measured and found to be enough
thus they can be removed without any effect on the required light levels. This can be shown by the
analysis of one office in the beer filtration area.
The room dimensions are 5m width by 6m length
Office area= 5×6= 30m2
The office is fitted with three fixtures each having two tubes of 58 watts
One of the fixtures is fused thus only four tubes are operational which gives an output of
4 × 56 =232 watts

The required light level of the office given that it is used for computer work as per the table 2.2
30 × 7.52 = 225.6 watts
This shows that the two burnt out tubes are not necessary in the office since only four tubes of 58 watts
are required to provide enough lighting for the office.
The energy consumption of the fixture was done using the formula
EQ = (Q×P×H×LF)/1000 [4.1]
EF = (F×P×H×LF)/1000 [4.2]
Where:
EQ = total consumption of functioning fixtures (kWh)
EF = total consumption of fused fixtures
Q = quantity of fixtures functioning
F= quantity of fixtures fused
P = power rating of each fixture
H = utility factor (no of utility hours)
LF = load factor
Electric unit cost = 13.55 ksh/kWh

Case analysis: Tank farm
Q = 180
F = 90
P= 58W
Total utility factor = (7×12×52) weeks = 4368 hrs
EQ = (180×58×4368×0.96)/1000=43,777.84kWh
Cost 1= 43,777.84×13.55 = ksh.593,190
EF = (90×58×4368×0.15)/1000 = 3,420.144 kWh
Cost 2 = 3,420.144×13.55 = ksh.46,343
Savings = cost 2 = ksh.46,343
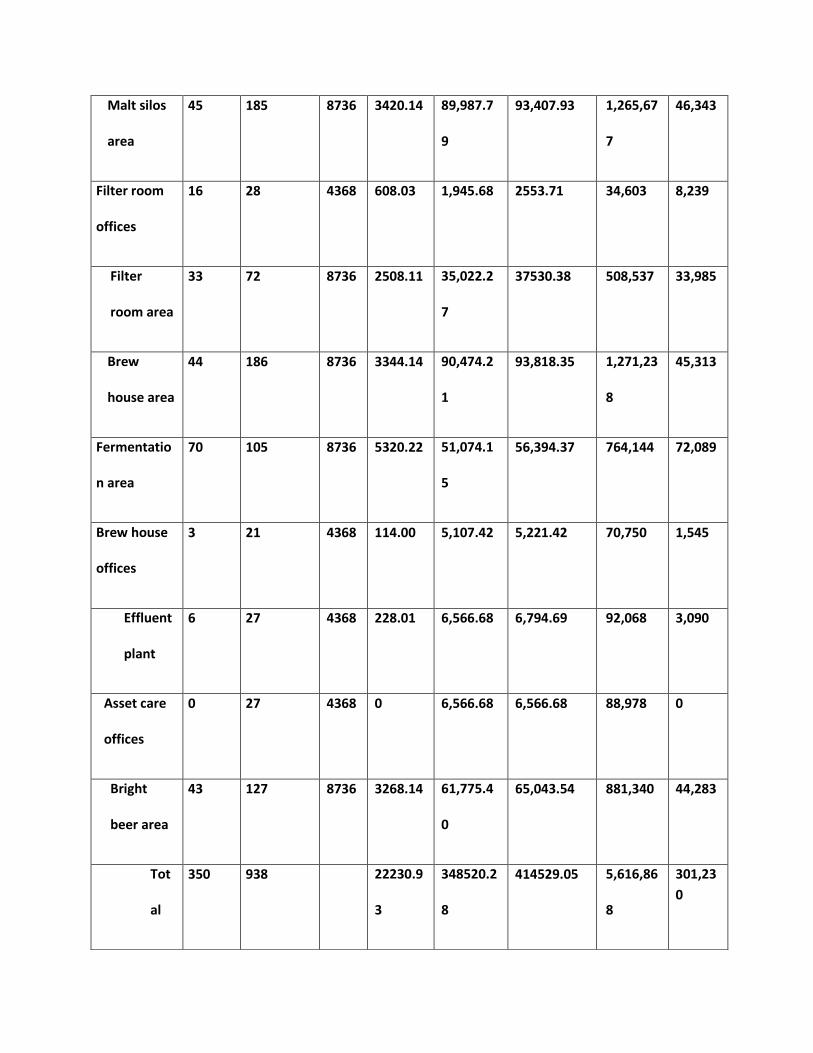
Similar analysis was performed in all areas within the department and the findings are as per table 4.1
Table 4.1 Analysis for savings from fluorescent lamps
Area
Fused
Fixture
s
Functionin
g
fixtures
Hour
s
per year
Energy consumption
KWh
Total
consumptio
n
kWh
Operating cost
Ksh
Annual Savings
Ksh Fused Function
al
Tank
farm
90 180 4368 3420.14
43777.84
47,197.98
639,533 46,343
Malt silos
area
45 185 8736 3420.14 89,987.7
9
93,407.93 1,265,67
7
46,343
Filter room
offices
16 28 4368 608.03 1,945.68 2553.71 34,603 8,239
Filter
room area
33 72 8736 2508.11 35,022.2
7
37530.38 508,537 33,985
Brew
house area
44 186 8736 3344.14 90,474.2
1
93,818.35 1,271,23
8
45,313
Fermentatio
n area
70 105 8736 5320.22 51,074.1
5
56,394.37 764,144 72,089
Brew house
offices
3 21 4368 114.00 5,107.42 5,221.42 70,750 1,545
Effluent
plant
6 27 4368 228.01 6,566.68 6,794.69 92,068 3,090
Asset care
offices
0 27 4368 0 6,566.68 6,566.68 88,978 0
Bright
beer area
43 127 8736 3268.14 61,775.4
0
65,043.54 881,340 44,283
Tot
al
350 938 22230.9
3
348520.2
8
414529.05 5,616,86
8
301,23
0

The operation of the brew house is 24 hours but as per the table it is seen that some areas needs light
for 24 hours but others only require light at night this is due to fact that they utilize daylight for
operation and only require light at night. There is no implementation cost for removing the burnt out
tubes thus the payback period will be zero years.
Implementation cost = 0 years
SPB = implementation cost/savings = years. [4.3]
4.3 HALOGEN SECURITY LIGHT SYSTEM
Note: a sum of 40, 250 W halogen lamps located over the tank farm and filter room are left on during
the day when they are not required this was observed for 3 per week.
E = [4.4]
Where:
E = total consumption (kWh)
Q = quantity of fixtures (40)
P = power rating of each fixture (250W)
H = utility factor (0.96)
Electricity unit cost = 13.55ksh/kWh
Total utility factor = {(3×24) + (4×12)} × 52 = 6240 hrs
Total consumption = =59,904kWh

Operating cost = 59,904 × 13.55 = ksh 811,699
Non utilized utility factor = (3× 12) × 52 = 1872
Non utilized consumption =17,971.20
Savings =17,971.20×1355 = ksh 243,509.76
Implementation cost (installing photo controls around the site) = ksh 50,000
SPB =
4.4 REFLECTORS INSTALLATION
Most of the light fittings do not have reflectors resulting to high energy losses since light is not directed
to the specific area of utilization and it’s just spread and lost. All the lights should be fitted with
reflectors so that light can be directed to where it is needed. These reflectors intensify useful light
resulting in less lights being used and saving energy without any compromise on lighting quality. New
high performance reflectors offer a spectral efficiency of over 90% (kreith and yogi 2008), this means
that two lights can be replaced by a single light, with a potential savings of around 50% in terms of
energy cost.
4.5 ENERGY MANAGEMENT MATRIX
Energy management matrix shows an overall energy appreciation in an organization starting with the
policy adopted by the top management, the implementation, training and the follow up on the
implementation measures. Table 4.2 shows the general energy management matrix with the shaded
regions shows the current position of EABL energy management commitment. This represents the
achievement and areas where improvement is required.

Table 4.2 Energy management matrix
Level Policy Organization Training Performance
measurement
Communication Investment
4 Energy policy
has
commitment
of top
management
Clear
accountability
of energy
consumption
Appropriate
staff
training
conducted
Performance
measured
against targets
Extensive
communication
of energy issues
Energy
efficiency
support
given
resources
3 policy
without
active
commitment
from top
management
Clear line
management
and
accountability
for
improvement
Energy
training
done as per
identified
needs
Weekly
performance
measured for
each unit
Regular
performance
reporting and
staff briefing
Some
appraisal
means used
2 Policy
available but
not adopted
Unclear line
management
on energy
Ad hoc
internal
training
Monthly
monitoring
done
Limited
communication
Low or
medium
cost
measures
considered
1 Un written
set of
guidelines
Informal
mostly
focused on
energy supply
Training for
technical
staff only
Checking of
monthly utility
bills only
No serious
energy
efficiency
promotion
Only low or
no cost
measures
taken
Source: Carbon trust (2011)

CHAPTER FIVE
CONCLUSSION AND RECOMMEDATION
5.1 CONCLUSIONS
Most of the light in the department utilize energy which is not put into effective utilization resulting
into high energy losses. Lights are just left on when daylight is enough to supply the required
luminance thus all the lights not being used should be put off.
Most of the areas are installed with excess lighting fixtures which are not required of which some
are burnt out and consumes energy without giving any output inform of light these should be
replace and the extra fixtures should be removed to maintain the required light levels .
Most people just don’t take the responsibility of switching off lights when they leave their offices a
lot of energy is utilized with no productive use and the average lamp life is easily attained leading to
high rate of replacement of the fixtures, thus occupancy sensors should be installed in offices and
employees should be sensitized on the importance of switching off light when leaving offices.
The company has an energy policy but its implementation is not effective, most of the employees
are not aware of the existence of the energy policy and its contents. This is due lack of structures to
implement energy saving measures and energy management practices in the organization thus
measures should be put in place to implement the energy policy.
There is no direct costing of the energy consumed in the various cost centers like the way the other
materials and services of production are posted in their respective cost centre thus taking control of
the cost and since energy is a very high expense it should be directly allocated to the respective cost
centers as per the usage.

The electrical metering system does not have separate metering for lighting and combines with
other uses of energy thus no means of establishing the actual energy consumption by light alone.
In some areas security lights are left on even in the daytime consuming a lot of energy when not
required this due to lack of automatic controls for the security lighting system.
Incandescent lamps are still being used in the brewing material store and in the washrooms despite
the fact that they are very poor in energy saving.
The design of the buildings in future should factor in proper and adequate ventilation to make use of
natural light during the day and save on light being on all the time.
5.2 RECOMMENDATIONS
Manually turn off the lights when exterior daylight is enough, this does not include any significant
investment. All the employees needs sensitization training on the effects of leaving the lights on
when they are not required especially the amount carbon being generated and its effect to the
climate.
Install occupancy sensors and photo electric sensors, this is a more reliable method to manage the
lights since there is no operator involvement thus the factor of human error is taken care of. From
the research done on the installation of the above technology an occupy sensor will cost between
Ksh 15,000 to Ksh 24,000 depending on type, sensitivity and radius of coverage. Thus the technology
can be taken as a low cost measure. Photo electric sensors cost between Ksh 8,000 and ksh 16,000.
Reduce the light levels where appropriate according to the recommended level, this can be achieved
by reducing the number of fixtures in those areas and also replacing the 58Wrapid start fixtures
with T8, 32W instant start fixtures.

Replace incandescent lamps with compact fluorescent lamps and also replace the electromagnetic
ballast fluorescent lamps with T8 fluorescent lamps with high frequency electronic ballast. This can
be attained since the fluorescent lamps of today are very rugged and versatile thus can operate
under extreme conditions up to temperature of 0oF and provide flicker free operation and harmonic
distortion of less than 5% and power factor of above 90 thus reducing energy consumption by 50%
(Bird. J.2003).
Replace high bay incandescent fixtures with high pressure sodium (HPS) lamps especially in areas
where light rendering is not important this is estimated to increase efficiency by 80 percent.
There is a requirement to establish the energy management section with a full time dedicated
energy manager who shall coordinate and organize training of all the employees on matters related
to energy saving and proper utilization of energy resources.
The energy policy framework should be reviewed and a way formulated to engrave the culture of
energy saving to every employee. This can be better achieved by first making it part of induction for
all the new employees to the company and organizing workshops for the existing workforce. The
company magazine can dedicate a page for energy saving related education which should be posted
by an authority in the field with the input of employees.

REFERENCES
Bureau of Energy Efficiency (2006) “Determining number of measurement
points”,(www.bee-india.nic.in) accessed on 1st march 2013
Bureau of Energy Efficiency, “Energy Performance Assessment of Lighting Systems”,
(http://emt-india.com) Accessed on 3rd April 2013
Canadian International Development Agency, “South African Development Community
Industrial Energy management project”, 2007
Carbon trust, (2011), “Energy management”, (www.carbontrust.co.uk) Accessed on 1st
march 2013
Eastop T D, & Croft D R, “Energy Efficient for Engineers & Technologist, Gulf Publishing
Company 1998
Energy star, (2006), “buildings and plants”, (www.energystar.gov) Accessed on 6th April 2013
Grahams S, “Energy Research in Developing countries”, international Development Research
Centre, Ottawa, Canada 1994
How stuff works, circuit connection of fluorescent fixture http:/www.howstuffworks.com
accessed on 3rd April 2013
International Energy Agency, (2009), “Efficient energy use”, (www.en.wikipedia.org)
Accessed on 5th April 2013
Kenya Power and Lighting Company, “Energy Minister Launches Energy Saving Bulbs
Project” http:/www.kplc.co.ke, Accessed on 2nd march 2013
Kreith F, Yogi G D, “Energy Management and conservation Handbook”, CRC Press, USA, 2008
Oregon energy department, “developing clean energy resources”,
(www.oregon.gov/energy)accessed on 10th March 2013.

Sant R, journal of the American Planning Association, Electric Utility Least-Cost Planning
Making it work within a Multi attribute Decision- Making framework, Volume 57, issue 1,
1991
Tuner W C, Steve D, “Energy management hand book 6th edition”, The Fairmount press USA
2007

APPENDIX A Lamp types and their features
Table A, Lamp types and their features
Type of lamp Lumens per
watts
Colour
Rendering
index
Typical application Typical life
hours
Range Ave
Incandescent 8-18 14 Excellent Homes, restaurants, general
lighting
1000
Fluorescent 46-60 50 Good w.r.t
coating
Offices, shops, hospitals, homes 5000
Compact
fluorescent
40-70 60 Very good Hotels, shops, homes, offices 8000-
10000
High pressure
mercury
44-57 50 Fair General lighting in factories,
garages, parking
5000
Halogen lamps 18-24 20 Excellent Display, flood lighting, stadiums,
exhibitions, construction area
2000-4000
High pressure
sodium
67-121 90 Fair General lighting in factories,
warehouses, street lighting
6000-
12000
Low pressure
sodium
101-
175
150 Poor Warehouses, stores 4000-8000
Source: Bureau of Energy Efficiency (2006)

APPENDIX B site data for 58W fluorescent light fixture
Table B, site data for 58W fluorescent light fixture
Area Fused fixture Functioning fixture Total fixtures Percentage fused
(%)
Tank farm 90 180 270 33
Filter room 16 28 44 36
Malt silo 45 185 130 34
Brew house 44 186 230 19
Effluent plant 6 27 33 18
Asset care offices 0 27 27 0
Bright beer area 43 127 170 250

APPENDIX C Daily electrical consumption at EABL
Table C, Daily electrical consumption at EABL
Area Daily consumption (KWh) Percentage consumption (%)
Main incomer (KPLC) 120340 100
Brewing Department 20320 16.885
Packaging Department 40310 33.497
United Distillers ventures (UDV) 4050 3.365
Air Compressors 25750 21.396
Boilers 5230 4.346
Refrigeration Plant 21660 17.999
Distribution (warehouse) 1500 1.246
Main offices (Tusker house) 1000 0.831
Auxiliaries, controls and losses 520 0.432