energy and sustainable development in...
TRANSCRIPT

Sustainable Energy Watch 2005/2006
Report by: Odón de Buen R. Isabel Bustillos
Email: [email protected] [email protected]
Summary of Report México has still a long way to go to reach acceptable levels of sustainability in its energy sector. As an oil producer and exporter, the country depends highly on fossil fuels. But it is also a country with abundant renewable energy resources that have been barely used for the country’s growing energy needs. There is a growing interest at all levels of the Mexican society to change the way that energy is produced and consumed.
Energy and Sustainable Development in México

HELIO International / México
2
Preface This report concentrates on México, which is part of the North American region. It was prepared using mostly data available in México. Unfortunately, not all the data required for the indicators was available in the form and for the years required for calculating the indicators. One indicator was not calculated (Indicator 4- Investment in clean energy) as data was not available, mainly because these types of investments are minimal at this point in time. Author This document was written by Odón de Buen for Presencia Ciudadana, AC. Odón de Buen has a MS from the Energy and Resources Program of the
University of California in Berkeley and was the General Director of México’s National Commission for Energy Conservation (CONAE) from 1995 to early 2003. He is currently an international consultant based in México who works on renewable energy and energy efficiency themes for the Interamerican Development Bank, the Economic Commission for Latin America of the United Nations, the US Agency for International Development, the European Commission and the United Nations Development
Programme. He is part of the directorate of several renewable energy and energy efficiency related NGOs in México. He is also the editor of a website and newsletter written in Spanish with audiences in most of Latin America. Presencia Ciudadana, AC.
Odón de Buen R. [email protected] Isabel Bustillos [email protected]

HELIO International / México
3
Table of Contents Preface....................................................................................... 2
Executive Summary ..................................................................... 5 Indicator Values ....................................................................................... 6 HELIO Star Diagram.................................................................................. 7
México’s Geographic and Economic Setting ..................................... 8 Impacts of Globalization ..................................................................... 9 Social Issues ..................................................................................... 9
Table 1:México’s Human Development and Environmental Indicators .............10 Environmental Issues ....................................................................... 11 Energy Sector ................................................................................. 11
Energy Policy ..........................................................................................12 Renewable Energy Initiatives.....................................................................14
México’s Sustainable Development Strategy...................................15 Energy Sector and Environmental and Sustainable Development Policies 16
Traditional Fuels ......................................................................................16 Short-Term Energy Developments .............................................................17 Legislative and Regulatory Issues ..............................................................17 Energy Sector Incidents............................................................................17 International Cooperation .........................................................................18
Environmental Sustainability ........................................................18 Indicator 1:Per Capita Energy Sector Carbon Dioxide Emissions ............ 18
Table 2:México’s Energy Supply, 2004........................................................18 Table 3:Indicator Results ..........................................................................19
Indicator 2:Most Significant Energy-Related Local Pollutant(s)............... 19 Table 4:Energy-Related Pollution Emissions - Metropolitan Area, México City...19 Table 5:Particulates (PM-10s) Emissions - Metropolitan Area, México City .......20 Table 6:Sulfur Dioxide Emissions - Metropolitan Area, México City .................20 Table 7:Indicator Results (PM10 and SO2) ..................................................21
Social Sustainability ....................................................................21 Indicator 3:Households with Access to Electricity ................................. 21
Table 8:Indicator Results ..........................................................................21 Indicator 4:Investment in Clean Energy.............................................. 22
Table 9:Renewable Energy Deployment in México, 2004 ...............................22 Table 10:Energy Investments in México, 1991 and 2004 ..............................22 Table 11:Indicator Results ........................................................................22
Economic Sustainability ...............................................................23 Indicator 5:Energy Resilience: Energy Trade Benefits ........................... 23
Table 12:Share of Oil Exports in México’s Total Exports, 1990 and 2004 .........23 Table 13:Indicator Results ........................................................................23
Indicator 6:Burden of Public Energy Investments................................. 24 Table 14:Public Investments in the Energy Sector, México (million US$).........24

HELIO International / México
4
Table 15:Burden of Public Energy Investments in México ..............................24 Table 16:Indicator Results ........................................................................24
Technological Sustainability .........................................................25 Indicator 7:Energy Intensity (energy consumption/GDP) ...................... 25
Figure 1:Energy Intensity of México’s Economy, 1990-2003 ..........................25 Table 17:Indicator Results ........................................................................25
Indicator 8:Renewable Energy Deployment ......................................... 26 Table 18:Renewable Energy Production in México (Pjoules)...........................26 Table 19:Primary Energy Consumption in México, 1990 and 2003 (Petajoules) 26 Table 20:Indicator Results ........................................................................27
Presentation of the SEW Star .......................................................27 Indicator Values ......................................................................................27 Figure 2:SEW Star: Scale 0 to 2 ................................................................28 Figure 3:SEW Star: Scale 0 to 6 ................................................................29
Conclusions and Policy Recommendations......................................29
Bibliography...............................................................................30

HELIO International / México
5
Executive Summary México has still a long way to go to reach acceptable levels of sustainability in its energy sector. As an oil producer and exporter, the country depends highly on fossil fuels. But it is also a country with abundant renewable energy resources that have been barely used for the country’s growing energy needs. There is a growing interest at all levels of the Mexican society to change the way that energy is produced and consumed. One of the main drivers for this interest is environmental, which is demonstrated by the continuous strengthening of environmental policy, regulations and institutions in México over the past thirty years. There are now clear limits as to the acceptable impacts energy systems can have on the environment and this includes the state’s energy (oil and electricity) monopolies. One aspect where México has been advancing very strongly towards a sustainable energy system is in energy efficiency. México has several very successful programs that have notably reduced its energy intensity. In preparing the HELIO indicators we have identified several trends that demonstrate this tendency:
• The per capita CO2 emissions indicator shows practically no change over the period 1990 to 2003. This a positive sign as the economy grew 44% and population only 17%.
• As a local, energy-related, indicator, the PM10 indicator shows a
radical change from 1990 to 2001 as it reduced by half. This a result of a number of policies established in the early 1990s that include mandatory environmental vehicle check-ups, the elimination of lead in gasoline, the shift from fuel oil to natural gas in the region’s power plants and the day-without-a-car policy that favors newer vehicles with much lower emissions by allowing them to operate everyday.
• The indicator that measures households with access to electricity
shows progress on electrification since 1990. However, changes in the way financial resources for this activity are managed—as municipalities and not the national utility get the resources for electrification—have reduced the rate of growth of this process in the last few years.
• There was no information available on investments in clean energy
before 2000 and the only data shows very little installed in 2004. However, investments in these types of installations remain relatively insignificant.

HELIO International / México
6
• The energy resilience indicator shows that the importance of oil exports in the general Mexican economy has declined. However, the oil sector still generates over 10 percent of the country’s export earnings and one-third of government revenues.1
• México’s energy efficiency has improved notably since 1990. As the
National Energy Balance 2003, the energy intensity indicator for México was 25% lower for the year 2003 in relation to 1990.
• As the renewable energy deployment indicates, renewable energy
deployment in México has had drawbacks, as energy coming from this form of energy has not advanced as fast as the energy demand.
In regards to policy recommendations, there are positive developments such as an initiative for a renewable energy law is going through the legislative process. However, it is important that non-governmental organizations remain close to the process, as a complete change in the legislative bodies and a renewal of México’s federal government will take place before the end of 2006. Indicator Values No Indicator Name I(current) I(1990) 1 CO2 emissions 0.814 0.818 2 Ambient pollutants 4.740 5.775 3 Access to electricity 0.040 0.140 4 Investments in clean energy 1.063 1.063 5 Energy resilience 0.126 0.248 6 Burden of public sector
investment 0.088 0.124 7 Energy intensity 0.977 0.992 8 Renewable energy
deployment 0.914 0.874
1 México Country Analysis, 2005. US Energy Information Agency . www.eia.doe.gov/emeu/cabs/México.

HELIO International / México
7
HELIO Star Diagram
Eight Sustainability Indicators
0
1
2
3
4
5
6
1) CO2 emissions
2) Ambient pollutants
3) Access to electricity
4) Investments
5) Vulnerability
6) Public sector investment
7) Energy productivity
8) Renewables
Current Year Base Yeart

HELIO International / México
8
México’s Geographic and Economic Setting México is a country with nearly 105 million inhabitants living in a territory of approximately 2 million square kilometers (CONAPO, 2005). The annual population growth rate is 1.18%, and it is expected that the population will reach 140 million by the year 2020. A fourth of the total population lives in rural areas where average density of population is 5.2 persons per square kilometer. The number of households is close to 22 million (INEGI 2005). The country’s economy is diversified and the most important sources of income are oil revenues, tourism, manufacturing exports and remittances of Mexican citizens living abroad. Annual GDP is close to US$650 billion. Economic growth in 2004 was 4.4% and the estimate for 2005 is 3%. During the last years the country has had economic stability, which is reflected in an annual inflation rate of 5.2% in 2004 and an estimate of 3.8% for 2005. The privatization in México is uneven; some sectors have been fully opened to the private sector (such as banks and financial services, phone systems, railroads, airports, natural gas distribution), others remain partially owned by the state (as roads, airlines and power generation), and some very important economic activities remain in full control of the state. This is the case with the oil industry (exploration and transformation) as well as power transmission and distribution. Power generation has private sector participation but this power has to be sold to the public utilities. According to the results of the last economic census undertaken in México in 2000, there are over 3.1 million economic units which provide job opportunities for 16.7 million people. Of these economic units, the manufacturing industry represents 11.5% of the total, providing employment to a fourth of the employed population, while those devoted to commercial activities are almost 48% of the economic units, providing job opportunities to almost 23% of the labor force. Those dedicated to services represent 40% of total economic units and 49% of labor force (EIA, 2005). México’s main trade partners are the United States, Canada, Japan, Germany and the United Kingdom. In 2004, exports from México were valued at $US188 billion and imports were valued at $US197 billion (Banco de México, 2005). The main exports were manufacturing products (mainly from maquila plants2), oil and agricultural products. In terms of imports, aside from those raw materials necessary for maquila manufacturing, the most important products were capital and retail goods, raw materials and intermediate goods.
2 Maquila plants are those that perform the labor intensive part of a manufacturing process, that is, they import parts, assemble the products, and export them again. These types of plants are located in tax-free areas. In México, most of the maquila plants are located in the Mexican side of the México-US border.

HELIO International / México
9
Of its approximately 2 million square kilometers, the total area used for cultivation is only 0.145 million square kilometers with most of this being used to cultivate corn (56%). The remaining area is used to cultivate sorgum (15.1%), beans (14.1%), sugarcane (4.9%) and wheat (4.3%). Of the area used for cultivation 86% depends on rainfall, while only 14% is irrigated (SIAP, SAGARPA, 2005). Regarding livestock, the estimated national cattle headcount is 35.4 million, while pigs total 16.6 and goats and sheep together are close to 3.0 million (SIAP, SAGARPA, 2005). Impacts of Globalization México has been exposed to globalization since 1985 when the country became a member of the GATT agreement and import taxes that protected local production and enterprises were drastically reduced. A second step was its incorporation to the North American Free Trade agreement in 1994, where most barriers to the exchange of goods and services with the United States and Canada were eliminated. One more step was the signing of a free trade agreement with the European Union in 1997. México’s exposure to globalization has had mixed outcomes. It has resulted in economic stability with low inflation, but economic growth has not been high enough to reduce social pressures. From an environmental perspective the outcome has been positive as México has slowly been adopting international best practices as part of its need to compete for markets in countries with higher environmental standards. Social Issues México has been subjected, since the middle of the last century, to a process of fast urbanization. Cities with more than one million inhabitants have grown from one in 1950 to ten in 2000. Rates of growth for cities with more than 100,000 inhabitants have been from 4 to 9% per year in that period, while small locations have grown at a rate of 1% or less (GeoMéxico, 2004). Data from the 2000 population census shows that 9.5% of the population over 15 years of age is illiterate, while 28% of that population never finished elementary school. Only 2.12% of the population has a college or university diploma (CONAPO, 2005). According to data from the World Bank Group, the Gross National Income is US$6,770 per capita. Average life expectancy in 2004 was 72 years for men and 77 years for women. This places México among the first five countries in Latin America with the better life expectancy rates, according to ratings provided by the United Nations.

HELIO International / México
10
In México, those who have water services pay less than those who live in the cities´ slums (and have to pay for its transportation by truck). One of the most persistent problems of recent times has been the pressure for greater rights for México's indigenous people. A law passed in 2001 fell short of giving México’s Indians political autonomy. Social development issues are considered among the top priorities within any strategy of sustainable development carried out in México. Although México’s government has developed important programs and policies which have resulted in some improvements over the past decades in terms of reducing poverty, still nearly 30% of the population –mostly in rural areas- lives under extreme poverty conditions. This factor led to an increase in urbanization and mass migration of population from rural areas in the 70´s and 80’s. These factors, together with the lack of a comprehensive public health system and increasing attrition rates from elementary school, among others, have created a large gap in terms of economic inequity. A large segment of the population still lives with on an income of less than US$5.00 per day. Unemployment rates over the past years have increased and informal sources of income make up an significant portion of macroeconomic indicators. Table 1 shows human development and environmental indicators for México and its ranking in the world. Though its ranking in the Human Poverty index is good (13), its ranking in human development is poor (53) as is its rank for environmental sustainability (95). Table 1: México’s Human Development and Environmental
Indicators
Indicator Value Ranking Human Development Index* 0.814 53 Human Poverty Index* 8.4 13 Environmental Sustainability Index** 46.2 95 GHG Emissions*** 686,118Gg 13 GDP**** 676.5 - GDP per capita**** US$6,902 -
*HDI and HPI index and ranking in 2003. Source: Human Development Report 2005, United Nations Development Program. **ESI index in 2004. Source: ESI 2005, Yale Center for Environmental Law and Policy, Center for Earth Science Information Network ***Aggregate information of GHG emissions (CO2-equivalent) in 1996. Value considers CO2, CH4 and N2O emissions. Source: National GHG Inventory 1994-1998, National Ecology Institute, SEMARNAT. ****Preliminary information for 2004. GDP information in billion US$. Source: National Institute of Statistics, Geography and Informatics (INEGI).

HELIO International / México
11
Environmental Issues Water supply is an extremely important environmental and development issue in México. A very large fraction of México’s population (76%), two thirds of its manufacturing capacity and the lands dedicated to agriculture and livestock are located where water is scarce. Moreover, 90% of the yearly rainfall takes place during the 4 to 6 months of a rainy season. As a result, water extraction and supply are an important issue in some regions of the country. In the central, north and northwest regions the ratio of water extraction versus rainfall is greater than 40%, which is considered high and problematic (GEOMÉXICO 2004). Most of the pressure on water supply comes from the agricultural sector; agriculture is responsible for 78% of water extraction from rivers, lakes and underground sources. This is complicated by the fact that water has, in many cases, no price and, as a result, it is used with great inefficiency. With regards to water quality, evaluations made in 2001 on superficial water bodies revealed that 23% of its volume was heavy contaminated, while 51% showed some contamination. Most of the contamination was present in the form of fecal coliforms, oil, diluted solids and detergents (GEOMÉXICO 2004). These water pollution problems extend to México’s coastal regions, as a small percentage of water used in the urban centers is either recycled or cleaned before disposal. Most of the air quality problems are related to industrialization and urbanization and to the use of petroleum derivates in industry, transportation and power generation. While for many years industry was the main polluter, the growth in the vehicle stock has resulted in vehicles (transportation) as the main source of air pollution in México’s urban centers and comprising 50 to 70% of total urban emissions. Fortunately, policies established in the last part of the 20th century have lowered concentrations of “criteria pollutants”, such as lead, sulfur dioxide and carbon monoxide. However, levels of ozone and PM10 particles remain a concern as their levels remain above acceptable standards. Human activities in México have resulted in significant soil degradation, with close to 50% of its soil “severely” and “very severely” degraded. The main causes of the degradation are overgrazing (25%), deforestation (24%), and change of use (GEOMÉXICO 2004). Energy Sector México is one of the most important oil producers in the world, with an average daily production of 3.8 million barrels of oil, of which 53% are for domestic consumption3. Natural gas production averaged 4.5 billion cubic

HELIO International / México
12
feet per day in 2003, mostly as gas associated with oil production. This production, however, is not sufficient to address the current national consumption levels; more of the 18% of the gas consumed in México is imported at high prices. This has increased the interest in establishing liquid natural gas (LNG) storage facilities, mainly in the northern part of México, near the border with the United States. For the energy sector, the Mexican regulatory framework stipulates that the State holds control of the majority of the industry. However, private participation is permitted for LNG and LPG distribution. Electricity generation by independent power producers, which is then sold to the Federal Electricity Commission (CFE), as well as the electricity generation for self-supply, cogeneration and small production are also permitted. In the electricity sector, the state-owned utility, Comision Federal de Electricidad (CFE)—including independent power producers which sell capacity and electricity to CFE—has an effective installed capacity of 46,140 MW. Of this total, 8,250 MW are owned by the independent power producers (mainly thermal generation plants), 10,268 MW hydro, 22,690 MW thermal (mostly oil-based), 2,600 MW coal plants, 960 MW geothermal, 1,365 MW nuclear, and 2.2 MW wind. Altogether these plants generated 205,000 GWh of electricity in 2004 (CFE, 2005). Energy Policy There are a number of laws within the legal framework of the energy sector that define the role of the Mexican State and the particularities of its institutions and its functions. The following three are the most relevant concerning hydrocarbons and electricity. Ruling Act of Article 27th of the Constitution concerning oil. This Act defines:
• the scope of the oil industry, the exploration, exploitation, refining, transportation, storage, distribution and first hand sales of oil and its refined products;
• the exploration, exploitation, manufacturing and first hand sales of
gas, as well as the transportation and storage needed to interconnect its exploitation and manufacturing; and,
• the manufacturing, transportation, storage, distribution and first hand
sales of all oil and gas by-products which could be used as basic industrial raw materials and are considered basic petrochemicals.
All of these industries are operated by the national petroleum company (PEMEX). This Act also refers to the areas which are open for private property.

HELIO International / México
13
Public Electricity Service Act. This Act establishes the scope of what is considered as the electricity sector as well as the role of the State within it. It refers that “… it falls exclusively to the Nation to generate, conduct, transform, distribute and supply electricity aimed at public service” and that “… in this matter no concessions will be granted to the private sector, and the Nation will take advantage, through the Federal Electricity Commission, of the goods and material resources required for such purpose”. This same Act refers that “… all actions related to the electricity public service are of the public dominion”, but, at the same time, opens up a space for private sector participation not considering as public service: (a) electricity generation for self-supply, cogeneration and small production, (b) electricity generation of independent producers to be sold to the Federal Electricity Commission, (c) electricity generation for export, which resulted from cogeneration, independent production and small production, (d) electricity imports devoted exclusively to self-supply of persons or enterprises, and (e) electricity generation devoted to emergencies resulting from electricity blackouts.” The only formal statement of a national energy policy is referred in the six-year national energy program (Programa Sectorial de Energía 2001-2006) which is drafted by the Energy Ministry (Secretaría de Energía). The main goals and objectives stated in this six-year plan are:
• assure enough energy supply, with international quality standards and competitive prices, with world-class private and public energy enterprises;
• promote participation of Mexican companies in energy-infrastructure
projects;
• increase the use of renewable energy sources and promote conservation and the efficient use of energy;
• use nuclear energy safely and with reliability, keeping with the highest
international standards; and,
• make the (Mexican) energy sector a leader in environmental protection.
This plan, however, is not mandatory, only indicative. This means that the goals that are established in the plan are not monitored beyond internal administrative procedures of México’s Federal Government, as there is no civil society participation in any part of the design-implementation-evaluation process. In practical terms, México’s energy policy has the following characteristics:
• focuses on the cheapest short-term sources;
HELIO International / México
14
• power sector growth based on natural gas (combined-cycle power plants);
• limited and very constrained private participation;
• centralized decisions on infrastructure expansion (decided by the two
large state-owned enterprises, PEMEX and CFE);
• subsidies for energy consumed by the agricultural and residential sector (of more than 5 billion $US/year just for electricity) (SENER, 2005); and,
• no subsidies for renewable energy.
There is one regulator in the energy sector, the Energy Regulatory Commission (CRE). CRE’s main role is to regulate the (limited) private participation in the energy sector, and its basic functions are established in the Energy Regulatory Commission Act, which defines that the objective of the Commission shall be to promote the efficient development of the following activities:
• the supply and sale of electricity as allowed by the Public Electricity Service Act;
• first hand sale of natural gas and LPG;
• the transportation and storage of natural gas that is not indispensable
or necessary for its exploitation and refining;
• natural gas distribution; and,
• the transportation and distribution of LPG through pipelines. Renewable Energy Initiatives After many years of pressure by non-governmental organizations a draft for a Renewable Energy Promotion Act has been drafted and recently passed by the Mexican Congress and sent to the Senate for approval and conversion into law. This initiative has the purpose of promoting renewable energy use, cogeneration and the promotion of the use of biofuels. The proposal establishes, among other lines of action, that (1) the energy ministry (SENER) will draft a Renewable-Energy and Cogeneration Promotion Program, and will co-ordinate its implementation; (2) open access (unless CFE has any technical limitations); (3) renewable energy will be paid by -at least- 95% of total short-term cost of the most expensive generation plant of the supplier, at the time and in the region where is purchased; (4) SENER will establish the minimum participation percentages of renewable energy for

HELIO International / México
15
electricity generation, in the short, medium and long term; and (5) SENER, jointly with the National Council on Science and Technology, will establish a Trust Fund to support renewable energy R&D. It is expected that the initiative will be voted on by the Senate in the first months of 2006. Beyond the law initiative, there is one regulatory instrument established in 2001 by CRE (the Interconnection Contract for renewable-energy sources) which allows renewable-energy projects through self-supply to have preferential treatment – considering the intermittence renewable energy has – which takes advantage of the differentiated costs and rates that electricity has throughout the days and the seasons. This regulatory instrument was recently modified to recognize some of the contributions that renewable energy power plants (particularly wind driven) make in terms of capacity; the previous version of the instrument did not exempt the plants under this type of self-supply arrangement for back-up power charges (which made them uneconomical). México’s Sustainable Development Strategy México’s sustainable development strategies are carried out under a number of national policies and laws both in the energy and environmental sectors. From a governmental stand point, the Secretariat of Environment and Natural Resources (SEMARNAT) is responsible of conducting all sustainable development policies and programs. The main purpose set forth in the National Development Plan is to achieve environmental management which aligns sustainable development both in the economic and social areas with the protection and preservation of natural resources. The national strategy developed by the federal government through SEMARNAT also includes specific measures to promote new ways of participation to encourage people, either individually or collectively, to become involved in the preparation and execution of the environmental policy and to keep a watchful eye on the use of resources and the environment. It has also been designed to prioritize matters relating to women and indigenous races, social groups that are fundamentally important for protecting the environment and preserving biodiversity, as these groups have often been excluded from the preparation and execution of public policies. Sustainable development criteria are described within the six stages of the overall national environment policy. The four most relevant are:
1. Environmental policy should be managed under a wide-spectrum approach which includes not only ecological considerations but a

HELIO International / México
16
comprehensive focus in which the existing relationship between water, air, soil, forestry resources and the biological diverse elements will be taken into account.
2. Sustainable development actions should be included within the
attributions and functions of the different agencies which are responsible of conducting economic, social and energy policies.
3. Implementation of efficient management instruments and restructuring
of the federal environmental sector considers the involvement of all federal, state and municipal authorities, to jointly implement coordinated actions to ensure that environmental management is effective and efficient.
4. Accurate assessment of natural resources, where the national policy
will encourage users of natural resources and environmental services to recognize their economic and social value and this will result in them being used rationally.
Energy Sector and Environmental and Sustainable Development Policies Beyond the above-referred main goals and objectives of the Energy Sector Program 2001-2006, it also establishes strategies that relate to the environment and sustainable development:
• to maintain and to strengthen a clean-fuel development policy, which mostly relates to the use of natural gas and improved gasolines;
• to foster the fulfillment of all related environmental laws and
regulations by the public energy companies, which means that the state-owned energy companies are not beyond these laws and regulations;
• to promote sustainable energy projects, which reflects more an
intention than a law-mandated commitment; and,
• to contribute in the mitigation of GHG emissions. Traditional Fuels Wood is an important source of energy in México; it represents close to 30% of the energy consumed by the residential sector. It is mostly used by the rural poor in efficient and non-sustainable ways for food preparation and water heating. As a renewable energy resource, it is desirable to use it in a more sustainable way, but policies in this direction are only discussed in the academic sector.

HELIO International / México
17
Short-Term Energy Developments In the short term there are two energy projects that have been the focus of social activism. One involves the installation of a liquefied natural gas storage plant in the Coronado Islands in the Baja California coast. The issue here is that these islands are the natural environment for local and migrating birds. The second project is the La Parota hydro power plant in the state of Guerrero. This 900 MW plant would inundate 10 communities, consisting of more than 800 families and the land of 2,000 farmers. At issue is the value of the land and what is offered in exchange. There has been social unrest and there is a chance the project will be postponed or cancelled. In August 2005, CFE awarded a contract to a Spanish consortium of Iberdrola and Gamesa Eolica to increase the capacity of the La Venta wind power facility from 3 to 83 MW. Completion is expected in November 2006. México also has 960 MW of geothermal capacity spread between seven plants. Legislative and Regulatory Issues México’s energy sector development has been dominated for decades by a very nationalistic vision of its power sector. This situation has its roots in events that happened more than 60 years ago when the Mexican Government nationalized the oil companies and created PEMEX. The energy sector has since evolved but this nationalistic perspective is still defended by political groups closely associated with the unions of the oil and power industries. As a result, México’s energy sector lags behind in many aspects that are common in more modern energy systems, such as efficiency, use of renewable energy, social accountability, and decentralization. In the power sector a series of reform attempts by the last two administrations have failed to have a majority vote required in the Mexican Congress to become law. This is both a reflection of the political strength of those opposing it and poor political work by the government. Most recently, a proposal for a Renewable Energy Promotion Act (presented end of 2004) is being considered in the Mexican Congress. The purpose of this act is to promote renewable energy use and cogeneration. The proposal, drafted by the energy ministry, has the support of the renewable-energy community, though many in the community consider the terms of the proposal as not much more than good intentions, as no specific budget is committed. Moreover the proposal allows the power utilities to have the last word on open access to the grid. Energy Sector Incidents In the past two years there have been a series of incidents involving underground oil pipelines. In several cases there have been considerable oil spills into rivers (as in the case of Coatzacoalcos). Others have involved explosions with the loss of human life and equipment. This is a result of the ageing of the pipeline infrastructure and reduced spending on its

HELIO International / México
18
maintenance. PEMEX, the national oil company that owns and operates the pipelines, is also heavily taxed4, leaving little room for new investments. More recently gasoline theft, where gasoline is taken illegally from pipelines that are perforated to extract the fuel, has become an issue, both economically and as a safety hazard. International Cooperation International cooperation activities of the Mexican government in the energy sector have been undertaken with a number of agencies, particularly from North America, Europe and the Asia-Pacific region. Collaboration activities focus on technical cooperation and information and technology exchange. Examples include specific cooperation activities and projects with the United States and Canada, under the North American Energy Working Group, and under the framework of the Asia-Pacific Economic Cooperation (APEC). Other activities include collaboration projects on renewable-energy promotion with countries from the European Union. Environmental Sustainability Indicator 1: Per Capita Energy Sector Carbon Dioxide
Emissions México is highly dependent on fossil fuels: 90% of its energy supply comes from non-renewable sources (Table 2) and more than 75% of the energy sources for power generation are fossil fuels. Table 2: México’s Energy Supply, 2004
Energy source Petajoules Coal 361 Oil 3,019 Natural gas 1,653 Hydroelectricity 205 Nuclear energy 115 Biomass 345 Other 214 TOTAL 5,912
Source: Balance Nacional de Energía 2004.
However, the total per capita CO2 emissions indicator shows practically no change in the 1990-2003 period as it went from 0.818 to 0.814, as per capita
4 About a third of México´s government budget comes from what PEMEX contributes through its tax burden.

HELIO International / México
19
emissions of CO2 in 1990 were 986 kgC and 983 KgC in 2003 (see Table 3) This a positive sign as the economy grew 44% and population by 17%. Table 3: Indicator Results
Parameter 1990* 2003**
X 986 983 W 1,130 1,130 Y 339 339 Z 791 791 Indicator 0.818 0.814
*Source: National GHG Inventory 1990. National Ecology Institute5
**Source: Key World Energy Statistics, International Energy Agency, 2005 X = emissions for current year and those for 1990 (KgC) W = 1130kgC/capita (world average for 1990) Y = 339 kgC/capita (3/10 the world’s average for 1990) Z = 791 kgC/capita Equation: I = (X – 339) / 791
Indicator 2: Most Significant Energy-Related Local
Pollutant(s) Mainly because of its size and economic activity, the Metropolitan Area of México City is the single most important geographic area with local energy-related pollution problems in México. México City concentrates nearly 30% of México’s total population and contributes 26.1% of GDP. Almost two thirds of México City’s local pollutant emissions come from the transportation sector and 26% from waste disposal. Small particles (PM10) and sulphur dioxide emissions in México City are considered as the main parameters for the energy-related local pollutant indicator. Data are available for the years 1990 and 2001 (see Table 4). Table 4: Energy-Related Pollution Emissions in the Metropolitan
Area of México City
Pollution levels 1990* 2001*
X(PM10) µgr/m3 187 95
X(SO2) µgr/m3 354 365 * Source: Estadísticas del Medio Ambiente del Distrito Federal y Zona Metropolitana. Gobierno del Distrito Federal, INEGI, México 2002
5 The National GHG Emission Inventory was updated with information on carbon dioxide emissions until 1998. The 1994-1998 GHG inventory was included in the Second National Communication of México, which was presented as part of the commitments of México before the United Nations Framework Convention on Climate Change. The information on carbon dioxide emissions for 2003 is an estimate elaborated by the International Energy Agency, presented in its Key World Energy Statistics, 2005. The information provided by IEA estimates per capita emissions of CO2 in 3,640 kg.

HELIO International / México
20
The PM10 indicator shows a radical change from 1990 to 2001 as it was reduced by half. This a result of a number of policies established in the early 1990s and that include mandatory environmental vehicle check-ups, the elimination of lead in gasoline, the shift from fuel oil to natural gas in the region’s power plants and the day-without-a-car policy that favors newer vehicles with much lower emissions (see Table 5).6 Table 5: Particulates (PM-10s) Emissions in the Metropolitan
Area of México City
Parameter 1990* 2001*
X 187 95 W 50 50 Y 10 10 Z 40 40 Indicator 4.425 2.215
* Source: Estadísticas del Medio Ambiente del Distrito Federal y Zona Metropolitana. Gobierno del Distrito Federal, INEGI, México 2002 X = selected pollutant for current year and for 1990 W = WHO maximum levels for total particulate suspension (µgr/m3) Y = 1/10 of 1990 value Z = W – W/10 = 9W/10 Equation: I = (X – 0.1W) / 0.9W
On the other hand, sulfur dioxide concentrations have increased, as low-sulfur liquid fuels are not yet available in the market. Table 6: Sulfur Dioxide Emissions in the Metropolitan Area of
México City
Parameter 1990* 2001*
X 354 365 W 60 60 Y 12 12 Z 48 48 Indicator 7.125 5.775
* Source: Estadísticas del Medio Ambiente del Distrito Federal y Zona Metropolitana. Gobierno del Distrito Federal, INEGI, México 2002 X = selected pollutant for current year and for 1990 W = WHO maximum levels for total sulfur dioxide (µgr/m3) Y = 1/10 of 1990 value Z = W – W/10 = 9W/10 Equation: I = (X – 0.1W) / 0.9W
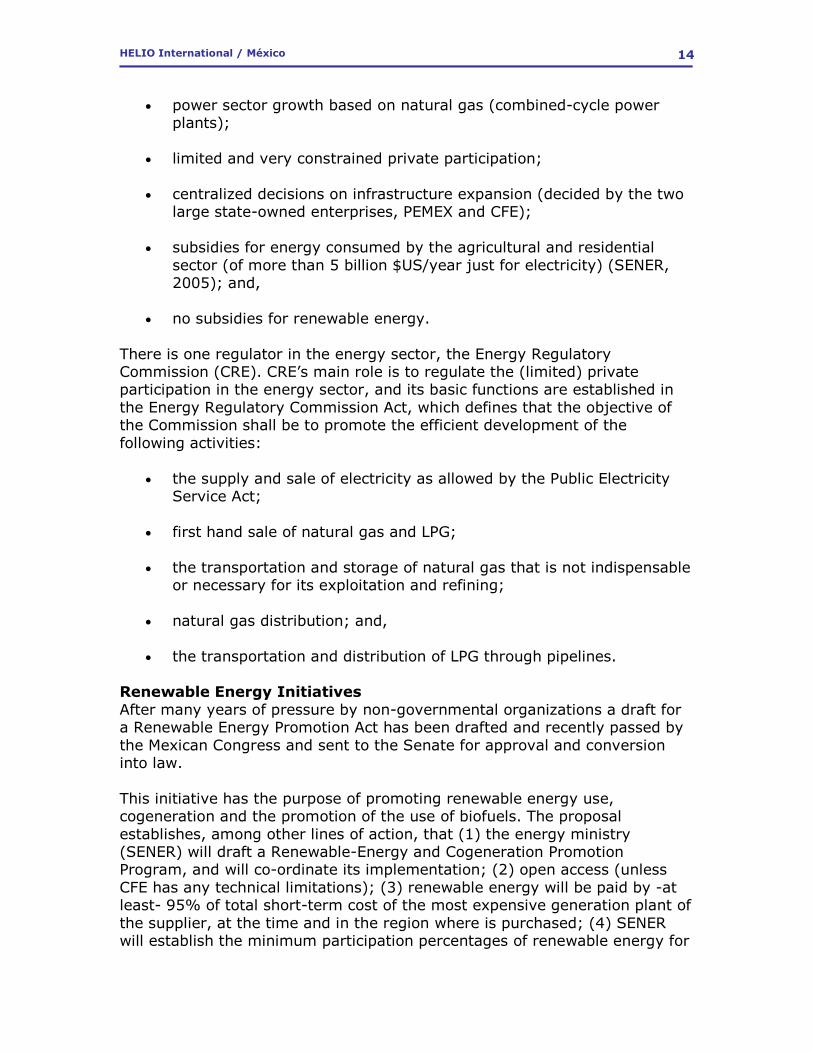
As a global result the indicator for energy-related pollution emissions has gone down from 5.775 in 1990 to 4.740 in 2001 (see Table 7).
6 Day-without-a-car favors newer vehicles as it allows new cars to ride all the time, that is, not to be subjected to the measure as older vehicles.
HELIO International / México
21
Table 7: Indicator Results (PM10 and SO2)
Indicator Value 1990 2001
PM10 4.425 2.125
SO2 7.125 5.775 Indicator 5.775 4.740
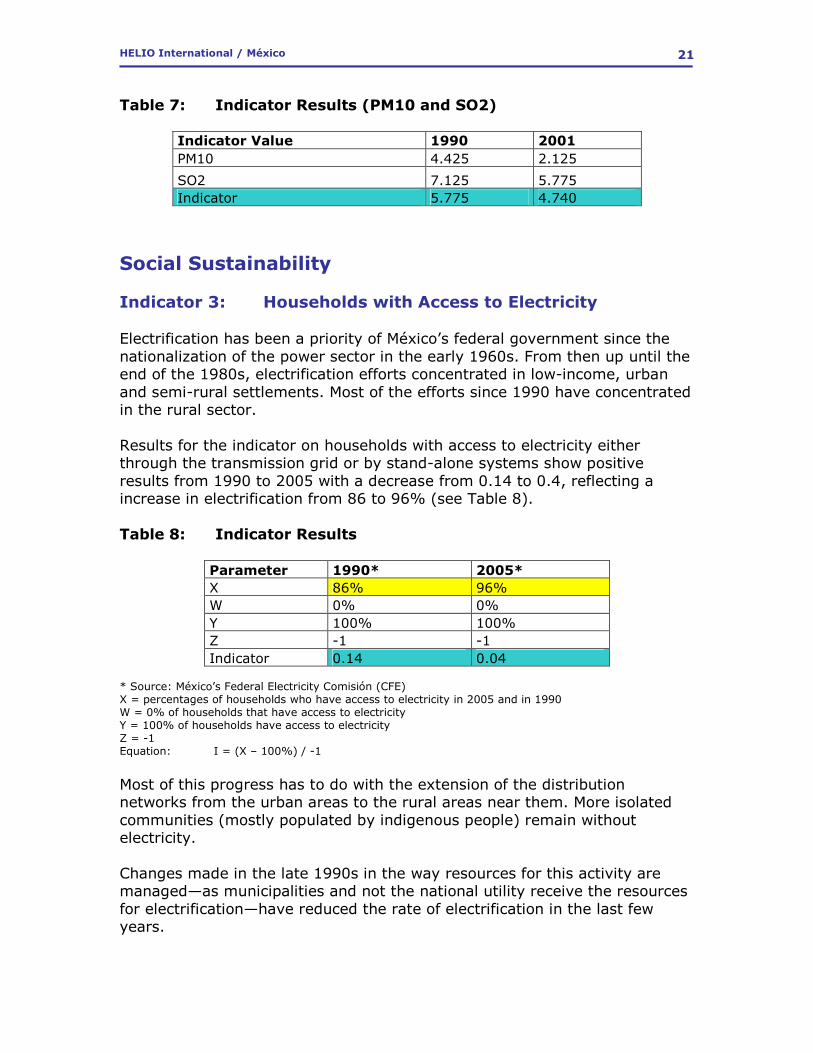
Social Sustainability Indicator 3: Households with Access to Electricity Electrification has been a priority of México’s federal government since the nationalization of the power sector in the early 1960s. From then up until the end of the 1980s, electrification efforts concentrated in low-income, urban and semi-rural settlements. Most of the efforts since 1990 have concentrated in the rural sector. Results for the indicator on households with access to electricity either through the transmission grid or by stand-alone systems show positive results from 1990 to 2005 with a decrease from 0.14 to 0.4, reflecting a increase in electrification from 86 to 96% (see Table 8). Table 8: Indicator Results
Parameter 1990* 2005*
X 86% 96% W 0% 0% Y 100% 100% Z -1 -1 Indicator 0.14 0.04
* Source: México’s Federal Electricity Comisión (CFE) X = percentages of households who have access to electricity in 2005 and in 1990 W = 0% of households that have access to electricity Y = 100% of households have access to electricity Z = -1 Equation: I = (X – 100%) / -1
Most of this progress has to do with the extension of the distribution networks from the urban areas to the rural areas near them. More isolated communities (mostly populated by indigenous people) remain without electricity. Changes made in the late 1990s in the way resources for this activity are managed—as municipalities and not the national utility receive the resources for electrification—have reduced the rate of electrification in the last few years.

HELIO International / México
22
Indicator 4: Investment in Clean Energy There was no information available on investments in clean energy before 2000 and the only data shows very little installed in 2004. Table 9: Renewable Energy Deployment in México, 2004
Type of system
Installed capacity
Unit cost Estimated investments (Million US$)
Energy produced (PJ)
Solar water heating
643,000 m2
800 US$/m2
51.8 3.07
PV systems 16,100 kW 10,000 US$/kW
160.1 0.03
Wind power generation
2,500 kW 1,500 US$/kW
3.75 0.03
Wind water pumps
2,200 kW 500 US$/kW
1.25 0.07
TOTAL 21.69 3.20 Source: Balance Nacional de Energía 2004.
To establish the indicator in clean energy we assume a value of 10% of the 2004 investments for 1991 (see Table 10). Table 10: Energy Investments in México, 1991 and 2004
Concept 1991 2004 Public investment in non-renewable energy (million US$) 4,633 6,020 Investments in clean energy 2 22 Total 4,633 6044
The indicator for investments in clean energy shows no change from 1991 to 2004 (see Table 11). Table 11: Indicator Results
Parameter 1991 2004
X 0.0004% 0.004% W 100% 100% Y 0% 0% Z 1 1 Indicator 1.063 1.063
X=relation between total energy investments and clean energy investments W=the value of X in 1990 Y=95% Z= W – 95% Equation: I = (X – 0%) / 1 = X
HELIO International / México
23
Economic Sustainability
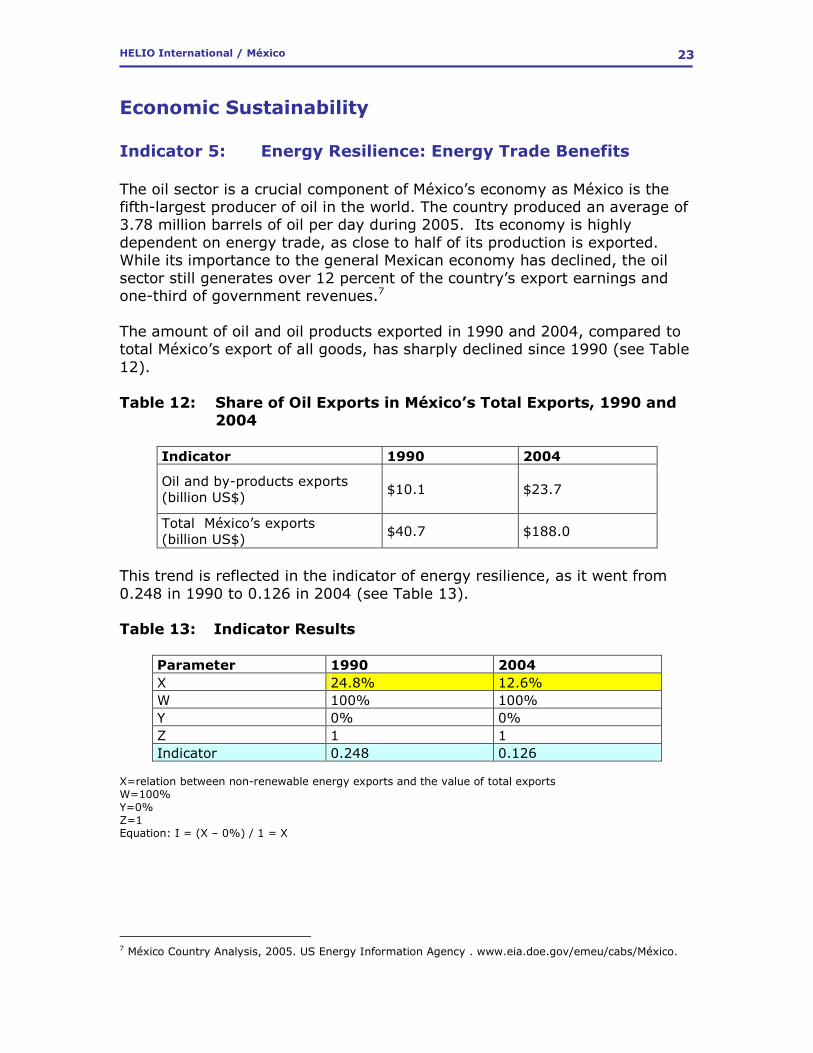
Indicator 5: Energy Resilience: Energy Trade Benefits The oil sector is a crucial component of México’s economy as México is the fifth-largest producer of oil in the world. The country produced an average of 3.78 million barrels of oil per day during 2005. Its economy is highly dependent on energy trade, as close to half of its production is exported. While its importance to the general Mexican economy has declined, the oil sector still generates over 12 percent of the country’s export earnings and one-third of government revenues.7 The amount of oil and oil products exported in 1990 and 2004, compared to total México’s export of all goods, has sharply declined since 1990 (see Table 12). Table 12: Share of Oil Exports in México’s Total Exports, 1990 and
2004
Indicator 1990 2004
Oil and by-products exports (billion US$) $10.1 $23.7
Total México’s exports (billion US$) $40.7 $188.0
This trend is reflected in the indicator of energy resilience, as it went from 0.248 in 1990 to 0.126 in 2004 (see Table 13). Table 13: Indicator Results
Parameter 1990 2004
X 24.8% 12.6% W 100% 100% Y 0% 0% Z 1 1 Indicator 0.248 0.126
X=relation between non-renewable energy exports and the value of total exports W=100% Y=0% Z=1 Equation: I = (X – 0%) / 1 = X
7 México Country Analysis, 2005. US Energy Information Agency . www.eia.doe.gov/emeu/cabs/México.

HELIO International / México
24
Indicator 6: Burden of Public Energy Investments Even as public investments in the energy sector by the Mexican government have increased over the 1991-2004 period (see Table 14), the burden of public energy investments as a percent of in México’s gross domestic product (GDP) has declined from 1.24% in 1991 to 0.88% in 2004 (see Table 15). Table 14: Public Investments in the Energy Sector, México (million
US$)
Company 1991 2004 Observations Petróleos Mexicanos
2,480 3,957 National oil company
CFE 1,941 1,675 National power utility LyF 212 387 Distribution utility TOTAL 4,633 6,020
Table 15: Burden of Public Energy Investments in México
Concept 1991 2004 Public investment in non-renewable energy (million US$) 4,633 6,020 GDP (million US$) 307,765 685,165
As a result, the indicator for burden of public energy investments in México went down from 0.124 in 1991 to 0.088 in 2004 (see Table 16). Table 16: Indicator Results
Parameter 1991 2004
X 1.24% 0.88% W 10% 10% Y 0% 0% Z 0.1 0.1 Indicator 0.124 0.088
X = ratio between public investment in non-renewable energy and GDP W = 10% Y = 0% Z = 0.1 Equation: I = (X – 0%) / 0.1 = 10X
This relative reduction in the burden of energy investments on México’s public spending is a reflection of the increased role of the private sector, mainly in electric generation and natural gas transport and distribution. However, private investments in power generation have an impact on public spending as most of these investments have power-purchase contracts guaranteed by México’s government and increasing amounts of resources have to be allotted in the national budget to guarantee the basic contractual commitments.

HELIO International / México
25
Technological Sustainability Indicator 7: Energy Intensity (energy consumption/GDP) According to the International Energy Agency (IEA, 2005), México’s energy intensity has improved overall since 1990. By 2002 there had been a 14% reduction in energy consumption per dollar of GDP. However, in 2003 (the latest year with available data), this trend was reversed. Figure 1: Energy Intensity of México’s Economy, 1990-2003
10.00
10.50
11.00
11.50
12.00
12.50
13.00
13.50
1990 1991 1992 1993 1994 1995 1996 1997 1998 1999 2000 2001 2002 2003
MJ/U
S$ (2000)
This trend is reflected in the indicator for energy intensity in México, which went down slightly from 0.992 in 1990 to0.977 in 2003 (see Table 17). Table 17: Indicator Results
Parameter 1990* 2003*
X 10.56 10.42 W 10.64 10.64 Y 1.06 1.06 Z 9.58 9.58 Indicator 0.992 0.977
* Source: International Energy Agency (IEA, 2005). Data converted from US$ to Euros at exchange rates for each year. X = ratio between energy consumption and GDP (MJ/Euros) for 1990 and 2003. W = 10.64 MJ/euros which corresponds to the average world consumption of primary energy per unit of GDP in 1990 Y = 1.06 MJ/euros which corresponds to 1/10 W Z = 10.64 – 1.06 = 9.58 Equation: I = (X – 1.06) / 9.58
HELIO International / México
26
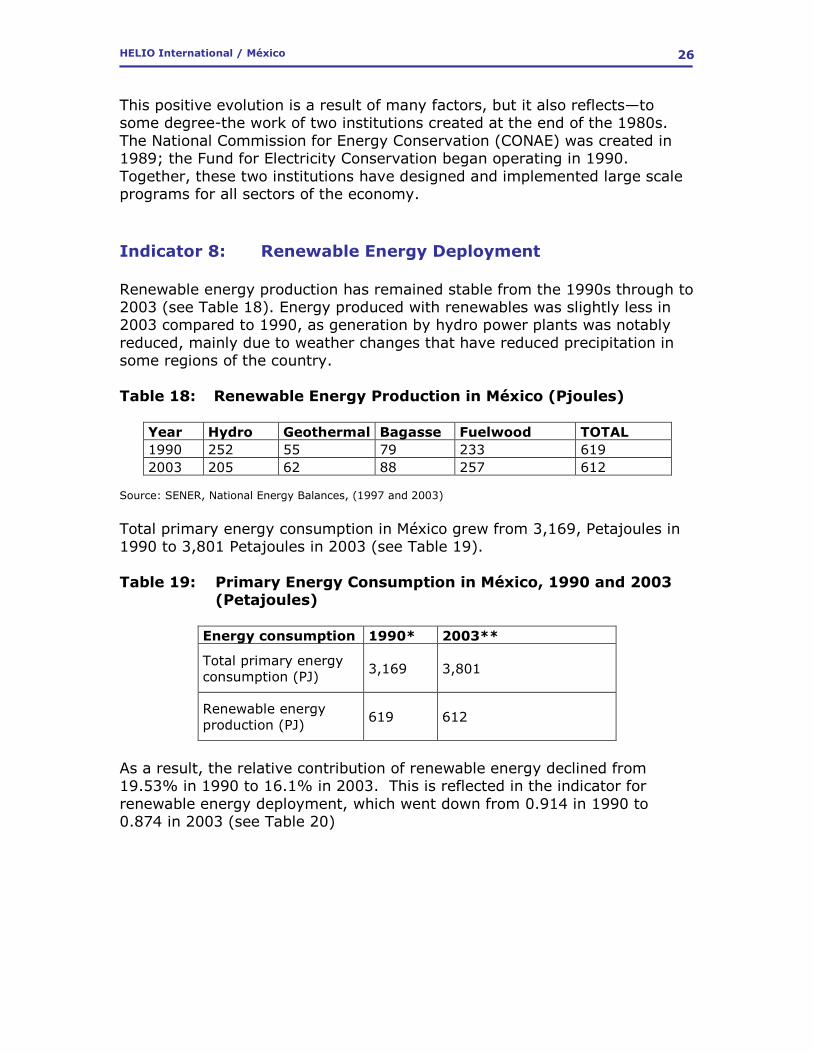
This positive evolution is a result of many factors, but it also reflects—to some degree-the work of two institutions created at the end of the 1980s. The National Commission for Energy Conservation (CONAE) was created in 1989; the Fund for Electricity Conservation began operating in 1990. Together, these two institutions have designed and implemented large scale programs for all sectors of the economy. Indicator 8: Renewable Energy Deployment Renewable energy production has remained stable from the 1990s through to 2003 (see Table 18). Energy produced with renewables was slightly less in 2003 compared to 1990, as generation by hydro power plants was notably reduced, mainly due to weather changes that have reduced precipitation in some regions of the country. Table 18: Renewable Energy Production in México (Pjoules)
Year Hydro Geothermal Bagasse Fuelwood TOTAL
1990 252 55 79 233 619 2003 205 62 88 257 612
Source: SENER, National Energy Balances, (1997 and 2003)
Total primary energy consumption in México grew from 3,169, Petajoules in 1990 to 3,801 Petajoules in 2003 (see Table 19). Table 19: Primary Energy Consumption in México, 1990 and 2003
(Petajoules)
Energy consumption 1990* 2003**
Total primary energy consumption (PJ) 3,169 3,801
Renewable energy production (PJ) 619 612
As a result, the relative contribution of renewable energy declined from 19.53% in 1990 to 16.1% in 2003. This is reflected in the indicator for renewable energy deployment, which went down from 0.914 in 1990 to 0.874 in 2003 (see Table 20)

HELIO International / México
27
Table 20: Indicator Results
Parameter 1990* 2003**
X 19.53% 16.10% W 8.64% 8.64% Y 95% 95% Z -86.36% -86.36% Indicator 0.914 0.874
*Source: Energy Secretariat, National Energy Balance 1997, México, 1998. **Source: Energy Secretariat, National Energy Balance 2003, México, 2004. X = ratio between renewable energy consumption and total primary energy consumption W = 8.64% which corresponds to the ratio between global consumption of renewable energy and total global consumption of primary energy for 1995 Y = 95% Z = 8.64% - 95% = -0.8636 Equation: I = (X – 95%) / -0.8636
It is expected that this indicator may change positively in the near future, as policy developments are anticipated to support increased levels of renewables in México’s energy mix. Presentation of the SEW Star Indicator Values No Indicator Name I(current) I(1990) 1 CO2 emissions 0.814 0.818 2 Ambient pollutants 4.740 5.775 3 Access to electricity 0.040 0.140 4 Investments in clean energy 1.063 1.063 5 Energy resilience 0.248 0.126 6 Burden of public sector
investment 0.088 0.124 7 Energy intensity 0.977 0.992 8 Renewable energy
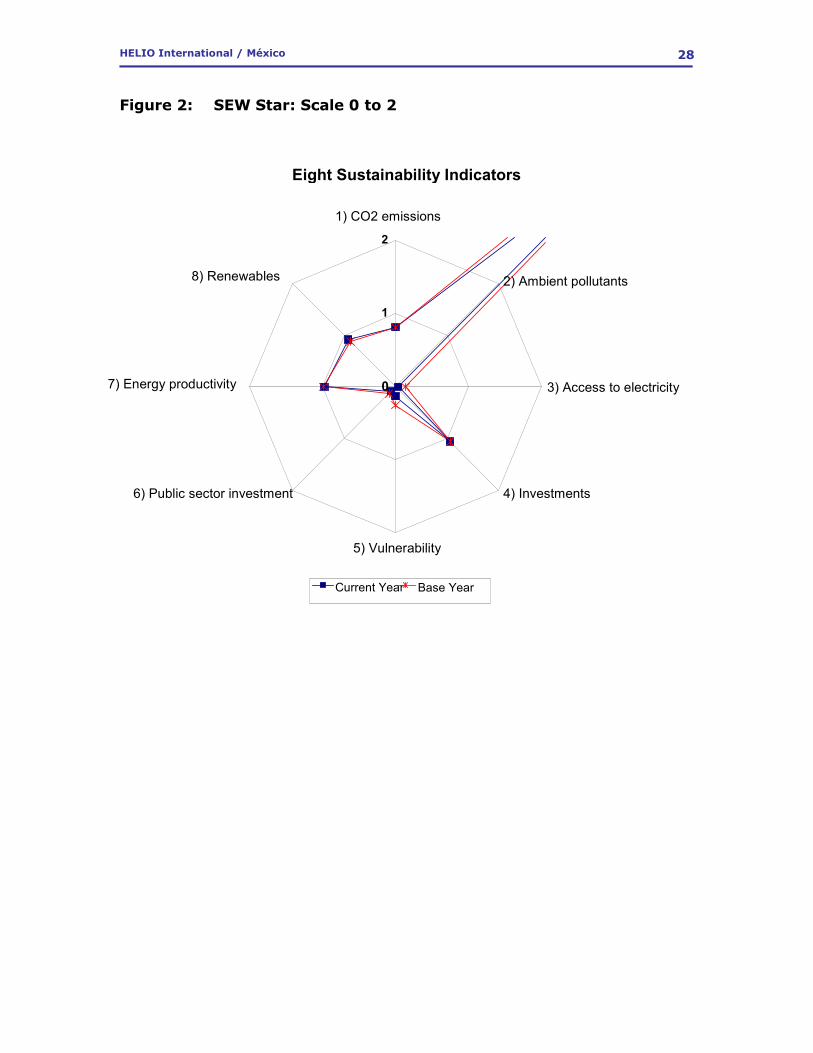
deployment 0.914 0.874 México’s Country Star is presented in two scales: 0 to 2 and 0 to 6.
HELIO International / México
28
Figure 2: SEW Star: Scale 0 to 2
Eight Sustainability Indicators
0
1
2
1) CO2 emissions
2) Ambient pollutants
3) Access to electricity
4) Investments
5) Vulnerability
6) Public sector investment
7) Energy productivity
8) Renewables
Current Year Base Year

HELIO International / México
29
Figure 3: SEW Star: Scale 0 to 6
Conclusions and Policy Recommendations México’s dependence on oil as a source of income has diminished considerably as the energy resilience indicator has shown; it decreased from 24.8 to 12.6 over the course of 15 years. However, México’s dependence on oil as an energy source is taking a heavy toll on its environment. Moreover, present oil reserves will last no more than 12 years at present production levels. Therefore if no radical measures are taken in the near future to transform its energy mix it is highly likely that Mexico’s economy will suffer. Fortunately, in the last few years, pressure has been growing n the energy and environmental sectors of México for greater energy efficiency and renewable energy use. This is clearly reflected by the per capita carbon dioxide emissions and energy intensity indicators, which have not grown over
Eight Sustainability Indicators
0
1
2
3
4
5
6
1) CO2 emissions
2) Ambient pollutants
3) Access to electricity
4) Investments
5) Vulnerability
6) Public sector investment
7) Energy productivity
8) Renewables
Current Year Base Year

HELIO International / México
30
the course of a decade even as the economy has grown. Although present institutions (such as FIDE and CONAE) and policy initiatives (such as the renewable-energy promotion law) are still not strong enough to face the great challenges México — primarily because not enough resources are being invested in these policies— are good enough to jump start the long process. There is, however, great uncertainty in the near future, as the political process for a new government and congress will continue until the middle of 2006, meaning that any major policy changes are effectively postponed. Moreover, given the nature of the process and the more urgent needs of the majority of the Mexican population—education, health, housing and security—the main items in the agenda of the political campaigns will not be renewable energy and energy efficiency. The energy debate will be—as it has already been for several years—about lower energy prices and the role of the state as owner of the energy production and transformation facilities. Given the above scenario, more than state action is needed. Societal action is necessary. Environmental, industry and academic groups in favor of a more balanced energy mix need to be become more active to ensure that the need for change in the energy sector is a central part of any party’s political agenda. Bibliography Banco de México http://www.banxico.gob.mx/ (Accessed:2005, november 17) Comision Federal de Electricidad (CFE) http://www.cfe.gob.mx/es/ (Accessed:2005, november 18) Energy Ministry, National Energy Balance 2003, 1st ed., México (2004) Energy Ministry, Programa Sectorial de Energía 2001-2006 http://www.energia.gob.mx/work/appsite/publicaciones/progsec.pdf (Accessed:2005, november 18) ESI 2005, Yale Center for Environmental Law and Policy, Center for Earth Science Information Network http://www.yale.edu/esi/ (Accessed:2005, november 17) Human Development Report, United Nations Development Program http://hdr.undp.org/reports/global/2005/ (Accessed:2005, november 17) Instituto Nacional de Estadística, Geografía e Informática (INEGI), Estadísticas del Medio Ambiente del Distrito Federal y Zona Metropolitana 2002. 1st ed., México (2005).

HELIO International / México
31
Key World Energy Statistics, International Energy Agency http://www.iea.org/dbtw-wpd/Textbase/nppdf/free/2005/key2005.pdf (Accessed:2005, november 18) National Budget of México, Goverment Report 1991 http://www.shcp.sse.gob.mx/contenidos/informacion_economica/temas/estadisticas_oportunas/index.html (Accessed:2005, november 18) National Population Council (CONAPO) http://www.conapo.gob.mx/00cifras/00indicadores.htm (Accessed: 2005, november 15) National Institute of Statistiscs, Geography and Informatics (INEGI) http://www.inegi.gob.mx/est/default.asp?c=119 (Accessed:2005, november 15) National Institute of Statistiscs, Geography and Informatics INEGI, National Accounts System of México 1988-1997, México (1999). http://www.inegi.gob.mx/est/contenidos/espanol/proyectos/metadatos/derivada/scnmsa_41.asp?c=1487 (Accessed:2005, november 18) National GHG Inventory 1990. National Ecology Institute http://www.ine.gob.mx/ueajei/publicaciones/ (Accessed:2005, november 19) National GHG Inventory 1994-1998, National Ecology Institute, SEMARNAT. http://www.ine.gob.mx/ueajei/publicaciones/download/362.pdf (Accessed:2005, november 17) SEMARNAT-INE. Geo México 2004 , 1st ed., México (2004) Sistema Integral de Información Agroalimentaria y Pesquera, Secretaría de Agricultura Ganadería Desarrollo Rural Pesca y Alimentación http://www.siap.sagarpa.gob.mx/ (Accessed:2005, november 17)