energy and macronutrient intake of one-year-old south african urban children: the birth to ten (btt)...
TRANSCRIPT
Pacdiatric und Pm'wtal Eprdemiology 1996,10,15&160
Energy and macronutrient intake of one-year-old South African urban children: The Birth to Ten (BTT) Study
J. M. MacKeown', P. E. Cleaton-Jones* and G. G. Perdraut 'Dental Research Institute, University of the WitwatersrandlSouth Afrrcun Medical Research Council and +University of the Witwutersrund Computer and Networking Services, [ohannesburg, South Af ica
Summary. With the changing situation in South Africa, new, reliable, longitudinal nutritional information on young children is needed. Part of the objectwe of the Birth to Ten (BTT) Study (1990-2000) in the Soweto- Johannesburg area, is to assess the nutrient intake of children. For each of the 2059 oneyear-old children mean nutient intake was determined using food hequency intakes, determined through interviewing parents or guardians. Urban 'coloured' children had the highest daily intake of all the macronutrients, energy being sigmficantly higher than the other groups. Urban black children had the lowest macronutrient intake and energy was sigxuficantly lower than that of white children. All groups consumed a typical westernised diet, low in unrefined carbohydrate (4749% of energy), but high in protein (200% of Recommended Dietary Allowances (RDA)) and fat (3840% of energy). Among the 'black, 'coloured' and 'white' clinics a difference of approximately 300 kcal/day was noted between the highest and the lowest energy intakes, Pimville and Mofolo showing sigruficantly higher differences among the 'black' clinics. Among the 'coloured' clinics Westbury had a sigruficantly higher energy intake than Eldorado Park. Results have indicated that oneyear- old 'coloured' and white children had adequate nutient intakes, but black and Indian had inadequate energy intakes based on RDA and excluding the contribution of breast milk.
Introduction
Prospective longitudinal epidemiological studies are essentially a tool for under- standing change and process.' There are currently a number of these longitudinal
Address for correspondence: J.M. MacKeown, Dental Research Institute, University of the Witwatersrand Private Bag X03, Wits, 2050, Johannesburg, South Africa.
150 0 1996 Blackwell Sciencc Ltd.
Energy and macronutrient intake of South Afican children 151
studies in progress or completed2 in which nutritional assessments form an import- ant and essential part.
The Birth to Ten (B'IT) Study is a longitudinal observation study designed to determine the biological, environmental, social, economic and psychological fac- tors associated with the survival and health of South African urban children, residing in the Johannesburg-Soweto metropolis over a ten-year period [199& 2000].3 The B'IT Study has occurred at a vital time in the history of South Afnca as, together with all the political changes that have taken place, health and nutrition are also in a state of change. There is a need for current nutrition information to assess both the existing and future health needs of the South African population. It was stressed by Hagman et aL4 that in a rapidly changing society with altering food habits there is an obvious need for nutritional surveys at frequent intervals that will provide valid information on changes.
Part of the objective of this study is to assess the nutrient intake of participating children over the ten-year period at specified intervals. This paper reports the energy and macronutrient intake of one-year-old urban South African children, participants in the B'IT Study at the first nutritional survey, who had their first birthday during the seven-week period from April to June 1991.
Subjects and methods
Details of the B?T Study design have been reported elsewhere,3+7 so only a brief outline is provided here. Prior to the study, ethical approval was obtained from the University of the Witwatersrand Committee for Research on Human Subjects, and permission was received from local authorities, together with the consent of the parents. The study comprised all births during a seven-week period from April to June 1990 in Soweto-Johannesburg. The source of the population was the official birth notifications, governed by a local ordinance, and completed by delivery staff at the time of every birth in the area. Five thousand four hundred and sixty singleton births occurred during this time to women who gave a permanent address within the defined region. Enrolment into B'IT took place during the first 15 months of the study and covered antenatal, delivery, six-month and one-year periods. By the end of this time 74% of all births (4029 cases) had been enrolled into the study, but there were marked variations in levels of enrolment by population group, residential area and place of delivery. Seventy-eight per cent of all births in the black community within the prescribed time frame were enrolled, 86.5% from the 'coloured' community, 69.5% from the Indian and 38% from the white
Choice of nutrition assessment method is difficult. From the literatur+l4 a semi-quantitative food frequency questionnaire appeared to be the most appropri- ate method for this type of large-scale study in culturally diverse populations. The
COKXUXIU~~ ties.
8 1996 Blackwell Science Ltd. Pardiafrir and Pmnofal Epidemiology, 10, 1.50-160
152 J. M. MacKeown et al.
foods h ted in the questionnaire were based on many years of experience in diet assessment among South African children.
During Apd/May 1991 interviews were conducted at 23 municipal clinics in the Soweto-Johannesburg area and home visits were carried out in Soweto. A total of 2059 children’s dietary intakes were assessed, 1753 from the black community, 170 from the ‘coloured’, 43 from the indian and 93 from the white community. Parents or guardians were asked by trained interviewers to indicate how fre- quently listed food items were consumed, ranging from seldom or rarely to more than twice a day. The nutritional contribution of breast feeding was not included in this paper as the data were collected by a separate research group and are not yet available for publication. However, studies on breast feeding among South African communities by our team have shown ethnic variations. The frequency and number of children breast feeding is highest among the black community, in particular the rural black, and lowest among the ~ h i t e s . ‘ ~ , ’ ~ More than 90% of children in the black community tended to be breast fed and for a longer period of time than the other communities. Roberts et found that 64-74% of the rural and urban black children were still being breast fed at 1 year, compared with 2635% in the other communities. The prevalence and [mean daily frequency] of breast feeding was; rural black 92% 17.31, urban black 92.3% [5.51, ‘coloured‘ 93.3% 15.91, Indan 73.1% [6.41 and white 73.2% f2.51. The difference between these groups in breast feeding practices showed similar results as in the same racial groupings studied by fichardson et d . I 5 4 years before and preliminary information on the frequency of breast feeding of the BTT children at 1 year seems to indicate a similar trend.I7 The BTT data at one year indicated that 93% of the total group had been breast fed, 94% of the black community, 91 % of the ‘coloured’, 87% of the Indian and 61% of the white. More than half the study group (56%) were still receiving some breast milk at one year, 62% of the black community, 29% of the ‘coloured’, 37% of the Indian and 16% of the white.I7 In addition most nutritional studies analysing the nutrient intake of breast milk have used young infants who were totally or partially breast fed, the amount consumed being determined by test weighingla20 or by the deuterium method.20,21 By the time the c u d is a year old, breast feeding has stopped or has become erratic and variable.u*”.
Information on food intake was coded onto computer coding forms using the South African Medical Research Cound (MRC) Food Composition Tables and Codes.24 Standard portion sizes in the National Research Institute of Nutritional Diseases (NIUND) Food Quantities Manual,= together with actual portions con- sumed by older individuals in the same communities in previous studies were used to calculate the portion sizes used for these BIT children.
The daily amounts consumed were calculated from the intake frequency, and OUT MRC dietary analysis programme was applied to determine the mean nutrient intake for each individual. The Statistical Analysis System (SAS) was used for statistical analysis.26 Because distribution of energy was skewed, a log
,O 1996 Blackwell Science Ltd. Paediornr and Prnnarol Epidemiology, 10, 150-1M3
Energy and macronutrient intake of South Afrzcan children 153
transformation was performed prior to further analysis. A two-way ANOVA was performed with the log of energy (kcal) as the dependent variable and group and clinic as the independent variables. This was followed by the Tukey multiple comparison test with alpha set at 0.05.
Results
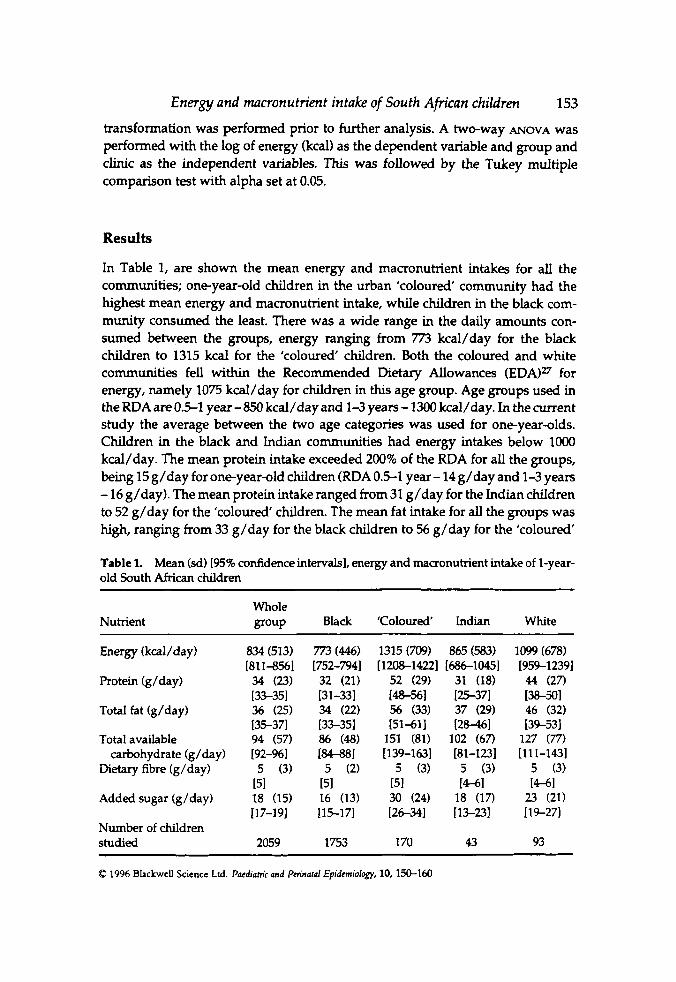
In Table 1, are shown the mean energy and macronutrient intakes for ail the communities; one-year-old children in the urban 'coloured' community had the highest mean energy and macronutrient intake, while children in the black com- munity consumed the least. There was a wide range in the daily amounts con- sumed between the groups, energy ranging from 773 kcal/day for the black children to 1315 kcal for the 'coloured' children. Both the coloured and white communities fell within the Recommended metary Allowances (EDAP for energy, namely 1075 kcal/day for children in this age group. Age groups used in the RDA are 0.51 year- 850 kcal/day and 1-3 years - 1300 kcal/day. In the current study the average between the two age categories was used for one-year-olds. Children in the black and Indian communities had energy intakes below loo0 kcal/day. The mean protein intake exceeded 200% of the RDA for all the groups, being 15 g/day for one-year-old children (RDA 0.5-1 year- 14 g/day and 1-3 years - 16 g/day). The mean protein intake ranged from 31 g/day for the Indian children to 52 g/day for the 'coloured' children. The mean fat intake for all the groups was high, ranging from 33 g/day for the black children to 56 g/day for the 'coloured'
Table 1. Mean (sd) [95% confidence intervals], energy and macronutrient intake of l-year- old South African children
Nutrient Whole group Black 'Coloured' Indian White
Protein (g/day)
Total fat (g/day)
Total available
Dietary fibre (g/day) carbohydrate (g/day)
Added sugar (g/day)
Number of children Studied
834 (513) [811-8561 34 (23) [3%351 36 (25) [35-371 94 (57) 192-%I
5 (3) 151 18 (15) 117-19)
2059
773 (446) [752-7941 32 (21) [31-331 34 (22) [33-351 86 (48) 184-881 5 (2)
151 16 (13) 115-171
1753
1315 (709) 865 (583) [1208-14221 1686-10451
52 (29) 31 (18) (48-561 15371 56 (33) 37 (29) I51411 [28-461
151 (81) 102 (67) [139-163] [81-1231
5 (3) 5 (3) 151 [ M I 30 (24) 18 (17) 126-341 [13-231
170 43
1099 (678) [959-12391 44 (27) [38-501 46 (32) 139-531
127 (77) 1111-1431
5 (3) (4-61
23 (21) [ 19-27)
93
Q 1996 Blackwcll Science Ltd. Pacdiahic and Pmnaral Epidemiology, 10, 150-160
154
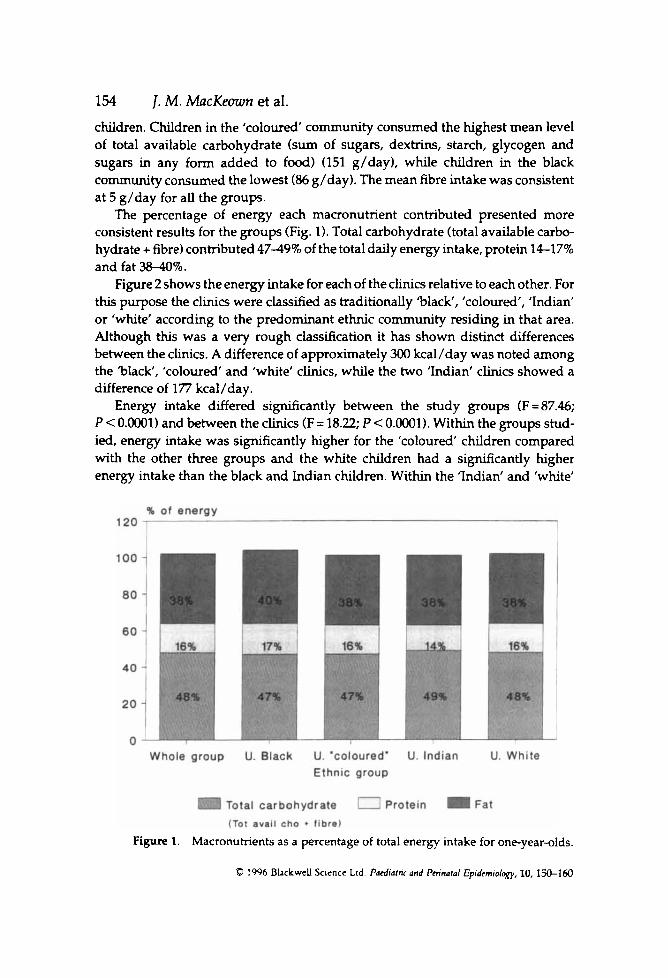
children. Children in the ‘coloured’ community consumed the highest mean level of total available carbohydrate (sum of sugars, dextrins, starch, glycogen and sugars in any form added to food) (151 g/day), while children in the black community consumed the lowest (86 g/day). The mean fibre intake was consistent at 5 g/day for all the groups.
The percentage of energy each maaonutient contributed presented more consistent results for the groups (Fig. 1). Total carbohydrate (total available carbo- hydrate + fibre) contributed 4749% of the total daily energy intake, protein 1417% and fat 3840%.
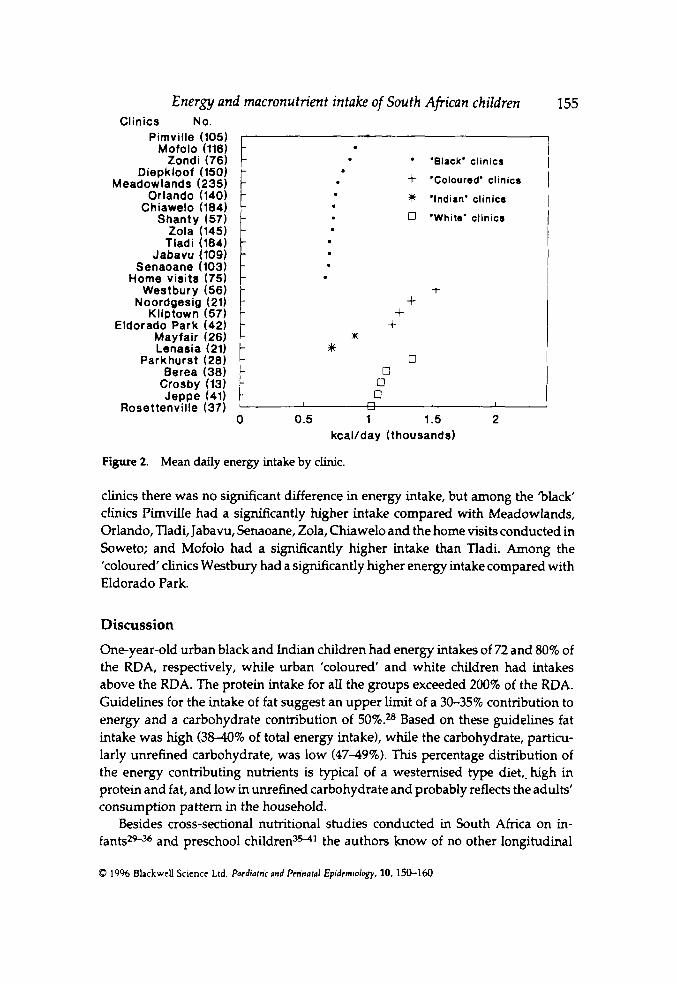
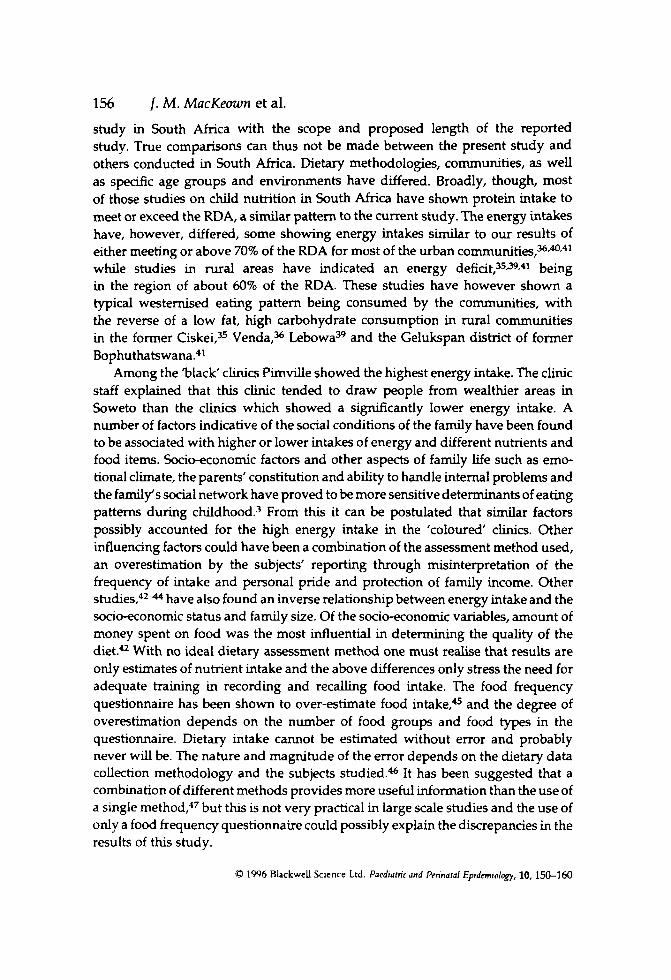
Figure 2 shows the energy intake for each of the clinics relative to each other. For this purpose the clinics were classified as traditionally ‘black‘, ‘coloured‘, ‘Indian’ or ‘white’ according to the predominant ethnic community residing in that area. Although this was a very rough classification it has shown distinct differences between the clinics. A difference of approximately 300 kcal/day was noted among the ‘black, ’coloured’ and ’white’ clinics, while the two ’Indian‘ clirucs showed a difference of 177 kcal/day.
Energy intake differed sigruficantly between the study groups (F = 87.46; P < O.OOO1) and between the clinics (F= 18.22; P C O.OOO1). Within the groups stud- ied, energy intake was significantly higher for the ’coloured’ children compared with the other three groups and the white children had a sigruficantly higher energy intake than the black and Indian children. Within the ’Indian’ and ‘white’
1. M. MacKeown et al.
Figure 1. Macronutrients as a percentage of total energy intake for one-year-olds.
0 1996 BLckweU Science Ltd Paediatnr and Pmnatol Epidcmiolqy, 10, 1jO-160
Mofolo (116)
E Tladi (184) Jabavu (109)
Senaoane (103) Home visits (75)
Westbury (56) Noordgesig (21)
Kliptown (57) Eldorado Park (42)
Mayfair (26) Lenasia (21)
Parkhurst (28) Berea (38)
Crosby (13) - Jeppe (41) t
Rosettenville (37) 0
t
t + + + m
;K
1 m 1.5 2 , i 0 0
0 Q
I u
0.5 kcallday (thousands)
Figure 2. Mean daily energy intake by clinic.
clinics there was no sigruficant difference in energy intake, but among the 'black clinics Pimvllle had a sigruficantly higher intake compared with Meadowlands, Orlando, Tladi, Jabavu, Senaoane, Zola, Chiawelo and the home visits conducted in Soweto; and Mofolo had a sigruficantly higher intake than lladi. Among the 'coloured' clinics Westbury had a significantly hgher energy intake compared with Eldorado Park.
Discussion
One-year-old urban black and Indian children had energy intakes of 72 and 80% of the RDA, respectively, while urban 'coloured' and white children had intakes above the RDA. The protein intake for all the groups exceeded 200% of the RDA. Guidelines for the intake of fat suggest an upper limit of a 30-35% contribution to energy and a carbohydrate contribution of 5O9im Based on these guidelines fat intake was high (3840% of total energy intake), while the carbohydrate, particu- larly unrefined carbohydrate, was low (4749%). This percentage distribution of the energy contributing nutrients is typical of a westernised type diet,.high in protein and fat, and low in unrefined carbohydrate and probably reflects the adults' consumption pattern in the household.
Besides cross-sectional nutritional studies conducted in South Afnca on in- fants*+% and preschool children3w1 the authors know of no other longitudinal
0 1996 BhckwcU Science Ltd. P a c d i h c and Pm'ndal Epidemiology, 10. 150-160
156 1. M. MacKeown et al. study in South Africa with the scope and proposed length of the reported study. True comparisons can thus not be made between the present study and others conducted in South Africa. Dietary methodologies, communities, as well as speafic age groups and environments have differed. Broadly, though, most of those studies on child nutrition in South Africa have shown protein intake to meet or exceed the RDA, a similar pattern to the current study. The energy intakes have, however, differed, some showing energy intakes similar to our results of either meeting or above 70% of the RDA for most of the urban c o m ~ n i t i e s , ~ ~ ~ ~ ~ ~ while studies in rural areas have indicated an energy defiat,3539,41 being in the region of about 60% of the RDA. These studies have however shown a typical westernised eating pattern being consumed by the communities, with the reverse of a low fat, high carbohydrate consumption in rural communities in the former Ciskei,= Vends,% L e b o ~ a ~ ~ and the Gelukspan district of former B~phuthatswana.~'
Among the 'black clinics Pimville showed the highest energy intake. The clinic staff explained that this clinic tended to draw people from wealthier areas in Soweto than the clinics which showed a sigruficantly lower energy intake. A number of factors indicative of the social conditions of the family have been found to be associated with higher or lower intakes of energy and different nutrients and food items. Socio-economic factors and other aspects of family life such as emo- tional climate, the parents' constitution and ability to handle internal problems and the family's social network have proved to be more sensitive determinants of eating patterns during ~hi ldhood.~ From this it can be postulated that similar factors possibly accounted for the hgh energy intake in the 'coloured' clinics. Other influencing factors could have been a combination of the assessment method used, an overestimation by the subjects' reporting through misinterpretation of the frequency of intake and personal pride and protection of family income. Other studies,42* have also found an inverse relationshp between energy intake and the socio-economic status and family size. Of the socio-economic variables, amount of money spent on food was the most influential in determining the quality of the diet." With no ideal dietary assessment method one must realise that results are only estimates of nutrient intake and the above differences only stress the need for adequate training in recording and recalling food intake. The food frequency questionnaire has been shown to over-estimate food and the degree of overestimation depends on the number of food groups and food types in the questionnaire. Dietary intake cannot be estimated without error and probably never wdl be. The nature and magnitude of the error depends on the dietary data collection methodology and the subjects studied.46 It has been suggested that a combination of different methods provides more useful mformation than the use of a single method,47 but this is not very practical in large scale studies and the use of only a food frequency questionnaire could possibly explain the discrepancies in the results of this study.
Q 19Y6 BbckweU Science Ltd. Poediumr ond Ptn'nafd Epldemdogy, 10, 150-160
Energy and macronutrient intake of South Afican children 157 Most commonly the RDAs are used as reference values for the daily intakes.M.49
An individual's nutrient intake may be less than the RDA and yet may be adequate to meet the individual's needs. For another individual the same level of intake might not be sufficient.50 Scrimshaw5l stated that even population groups with average intakes well below the RDA may contain few individuals who are deficient in certain nutrients. If this is true children in both the black and Indian communities with energy intakes below the RDA may not be considered undernourished. In addition one must remember that with the higher percentage of children st i l l breast feeding at 1 year among the black community, breast milk would contribute substantially to the total energy and macronutrient intake of this group and the RDA could well be met. In fact Mills et ~ 1 . ~ ~ noted that breast milk contributed more than 100 kcal/day among British infants st i l l being breast fed at 9-12 months. This could also apply to children in the Indian community but to a lesser extent as there was a lower percentage of Indian children still breast feeding at 1 year. There are, however, no RDA specifically estimated for the South African population and thus to compare the energy and nutrient intakes of these children with the American RDA will not give a true indication of their nutritional status. The results of all South African nutritional studies should thus be interpreted with caution. Pub- lished data35*55 suggest that the current recommendations for energy intake should be revaluated, as the requirements may be lower than the recommen- dations. Since the nutrient requirements vary considerably from one person to another and since the needs of an individual are almost never known it does not seem meaningful or possible to try to define a safe lower limit which cannot be determined scientifically with an acceptable degree of precisi~n.~
In conclusion, infant nutrition during the latter part of the first year is an area of paediatric nutrition that is st i l l surrounded by uncertainty, particularly in the changing South Africa. This is also a time when growth is still relatively rapid and when organs are developing and maturing. This development is influenced by nutrition19 that may exert significant consequences later in life. The preschool period has also long been accepted as an interval in which the child presents a number of problems in eating. The age of onset of poor appetite varies from one child to another, being most often between 9 and 18 rnonths.%s7 It is for these reasons that longitudinal nutrition studies of young South African children are essential to identdy high-risk groups and their future health and nutritional needs. Each community is unique in their development and needs, and this study pro- vides original and specific data on South African children that may be used to determine their future health requirements in a rapidly changing counhy.
Acknowledgements
We wish to thank the B'IT coordinators and staff, interviewers, local authorities, clinic staff and parents for making this study possible.
Q 1996 Blackwell Science Ltd. Paediamric and Pcfinaral Epidemiology, 10, 150-160
158
References
1. M. MacKeoutn et al.
1 Baltes P, Nesselroade J. History and rationale of longitudinal research. In: Longttudiml Research in the Study ofBehmriourand Deoelopment. Editors: Nesselroade J, Baltes J. New York: Academic Press, 1979. 2 Young C, Savola K, Phelps E. Inaentory of Longitudinal Studies in the Social Sciences. Sage: Newbury Park, 1991 . 3 Yach D, Cameron N, Padayachee N, Wagstaff LA, Richter L, FOM S. Birth to Ten: Child health in South Africa in the 1 W s . Rationale and methods of a birth cohort study. Paediatric and Pm'natal Epidemiolo 1991; 5211-233. 4 Hagman U, Bruce?( Persson L-A, Samuelson G, Sjolin S. Food habits and nutrient intake in childhood in relation to health and socio-economic conditions. A Swedish multi- centre study 198041. Acta Paediutrica Scandimmica 1986; Suppl328:1-56. 5 Fonn S, de Beer M, Kgamphe JS, McIntyre J, Cameron N, Padayachee GN et al. Birth to Ten: Pilot studies to test the feasibility of a birth cohort study investigating effects of urbanisation in South Africa. South Af ican Medical Journal1991; 79:449454. 6 Anderson A, Richter LM. Birth to Ten: Error detection and correction in a longitudinal address database. South Afncan Journal of Epidemiology and Infection 1994; 9:16-19. 7 Richter LM, Yach D, Cameron N, Griesel RD, de Wet T, Anderson A. Enrolment into Birth to Ten (BTI'): Sample and population characteristics. Paediatric and Perimtal Epidemi- ology 1995; 9:109-120. 8 Block G. A review of validations of dietary assessment methods. American Journal of Epidemiology 1982; 115492-505. 9 Chu SY, Kolonel RN. A comparison of frequency and quantitative dietary methods for epidemiologcal studies of diet and disease. Amoican Journal of Epidemiology 1984; 119:325334. 10 Block G, Dresser CM, Hartman AM, Carrol MD. Nutrient sources in the American diet: Quantitative data from the NHANES I1 survey. 11. Macronutrients and fats. American Journal of Epidemiology 1985; 122:27#. 1 1 Margetts BM, Cade JE, Osmond C. Comparison of a food frequency questionnaire with a diet record. International Journal of Epldemiology 1989; 18:868-873. 12 Borelli R. Collection of food intake data: A reappraisal of criteria for judging the methods. British Journal ofhcutrition 1990; 63:411417. 13 Thompson RL, Margetts BM. Comparison of a food frequency questionnaire with a l0-day weighed record in cigarette smokers. International Journal of Epidemiology 1993; 22:824-833. 14 Hankin JH, Wilkens LR. Development and validation of dietary assessment methods for culturally diverse populations. American Journal of Clinical Nutrition 1994; 59(1 suppl):198S-2ooS. 15 Richardson BD, Cleaton-Jones PE, McInnes PM, Rantsho JM. Infant feeding patterns and nursing bottle caries. Journal of Dentistry for Children 1981; 48:423-429. 16 Roberts GJ, Cleaton-Jones PE, Richardson BD, Sinwel RE, Lucas VS. Breast and bottle feeding in rural and urban South African children. Journal of Human Nutrition and Dietetrics 1995; 8:255-263. 17 Wagstaff LA, de Wet T, Anderson A. Infant feeding. In: 'Birth to Ten': report back - initial findings. Urbanisation and Health Newsletter. Editors: de Wet T, Richter L. National Urban- isation and Health Research Programme, South African Medical Research Council (MRC), 1 9 3 ; 18: part 2, Y-12. 18 Michaelson KF, Larsen PS, Thomsen BL, Samuelson C. The Copenhagen cohort study on infant nutrition and growth: breastmilk intake, human milk macronutrient content, and influencing factors. American Journal of Clinical Nutrition 1994; 59:600-611.
C 1996 Blackwell Science Ltd. P d e d i m c and P m n d Epidemiulqgy, 10, 150-160
Energy and macronutrient intake of South Afrrcan children 159 19 Axelsson IEM, RZihi NCR. Protein and energy during weaning. Advances in Pediatrics 1992; 3 9 : a w . 20 Butte NF, Wong WW, Patterson BW, Garza C, Klun PD. Human milk intake measured administration of deuterium oxide to the mother. A comparison with test weighing. Ameri- can Journal of Clinical Nutrition 1988; 47:815-821. 21 Lucas A, Ewing G, Roberts SB, Coward WA. Measurement of milk intake by deuterium dilution. ArchivPs of Disease in Childhood 1987; 62:7!%-800. 22 Neville MC, Keller R, Seacat J, Lutes V, Neifert M, Casey C et al. Studies in human lactation; milk volumes in lactating women during the onset of lactation and full lactation. Amm'can Journal of Clinical Nutrition 1988; 48:13751386. 23 Drewett R, Amatayakul K, Wongsawasdii L, Mangklabxuks A, Ruckpaopunt S, Ruan- gyuttikarn C et al. Nursing frequency and the energy intake from breast milk and supple- mentary food in a rural Thai population: a longitudinal study. European Journal of Clinical Nutrition 1993; 47:880-891. 24 Langenhoven ML, Kruger M, Gouws E, Faber M. Research Institute of Nutritional Diseases (RIND) Food Composition Tables. Third edition. Parow: South African Medical Research Council (MRC), 1991; pp. 1-248. 25 Langenhoven ML, Conradie PJ, Gouws E, Wolmarans P, van Edc M. National Research Institute of Nutritional Diseases (NRIND) Food Quantities Manual. First edition. Parow: South African Medical Research Council (MRC), 1986; pp. 1-147. 26 SAS Institute Inc. SAS Users' Guide: Basics. Version 5 Edition. Cary, NC: SAS Institute Inc., 1985; pp. 1290. 27 NAS-NRC 1989. Food and Nutrition Board, National Academy of Sciences - National Research Council. 20th Edifion. Revised Recommended Dietary Allowances. Washington, D.C. Also published in Journal of the American Dietetic Association 1989; 89:1748-1752. 28 Margarey A, Boulton JC. Food intake during childhood: percentiles of food energy, macronutrient and selected micronutrients from infancy to eight years of age. Medical journal of Australia 1987; 147124-127. 29 Ross SM, van Middlekop A, Khoza NC. Breastfeeding practices in a black community. South African Medical Journal 1983; 63:23-25. 30 Brink A, Boshoff E. Babavoeding in Ga-Rankuwa, Bophuthatswana. Journal of Dietetics and Home Economics 1984; 1214-17. 31 Bergh AM, Borsvoeding by die Pedi in Sekhukhuneland, Lebowa. Journal of Dietetics and Home Economics 1986; 14:105-108. 32 Ross SM, Loening WEK, Mbele BE. Breast-feeding support. South African Medical Journal
33 Steyn NP, Badenhorst CJ, Nel JH, Ladzani R. Breast-feeding and weaning practices of Pedi mothers and the dietary intake of their preschool children. South Afncan Journal of Food Science and Nutrition 1993; 5:1&13. 34 van Staden E, Langenhoven ML, Donald PR, Laubacher JA. Dietary intake of children with failure to thrive. South Afncan Journal of Food Science and Nutrition 1994; 690-93. 35 Richter MJC, Langenhoven ML, du Plessis JP, Ferreira JJ, Swanepoel ASP, Jordaan KJ. Nutritional value of diets of blacks in Ciskei. South African Medical Journal 1984; 6538-345. 36 Gericke GJ, Borchardt S, Crous JM. Venda-kinder-voedingraktyke: stad en platteland. Journal of Dietetics and Home Economics 1987; 5:48-54. 37 MacKeown JM, Cleaton-Jones PE, Granath L, Richardson BD, Sinwel RE. A study of the relative amounts of food items consumed by South African preschool children. South Abcan Journal of Food Science and Nutrition 1989; 1:19-21.
1987; 72:357-359.
0 1996 Blackwell Sclencc Ltd. Poediafnr and Pmnaral Eptdemiolqy, 10, 150-160
160 J. M . MacKemn et al. 38 MacKeown JM, Cleaton-Jones PE, SeneM M. Individual food items in the diets of South Afncan preschool children - energy, protein, carbohydrate, fibre, added sugar and fat intake. South African Journal of Food Science and Nutrition 1994; 6:94-98. 39 S t e p NP, Badenhorst CJ, Nel JH, Jooste PL. The nutritional status of Pedi preschool children in two rural areas of Lebowa. South African Journal ofFood Scienceand Nutrition 1992;
40 Langenhoven ML, Swanepoel ASP, Steyn M, Bremner B, van Wyk Kotze TJ. Macro- nutrient intake of preschool children and the contribution of specific food groups. South Afncan Journal of Food Science and Nutrition 1991; 36-9. 41 Richardson BD, Sinwel RE, Cleaton-Jones PE, Cranath L, MacKeown jM, Walker ARP et al. Nutrient intake. In: Nutrient intake, dietary habits, anthropometric status, ma1 hygiene, and salivary factors and microbiota in South Afican black, Indian and white 4-5-year-old children. Editors: Cleaton-Jones P, Cranath L, Richardson BD. Parow: South African Medical Research
42 Eppright ES, Fox HM, Fryer BA, Lamkin GH, Vivian VM, Fuller ES. Nutrition of infants and preschool children in the North Central Region of the United States of America. WmId Review of Nutrition and Dietetics 1972; 1426S332. 43 M W o p F, Durnin JVGA. The energy and nutrient intake of a random sample (305) of infants. Humun Nuhition: Applied Nutn’twn 1982; 36A40W21. 44 Black AE, Billewiu WZ, Thomson AM. The diets of preschool children in Newcastle upon Tyne, 1968-71. British Journal ofNutrition 1976; 3510S113. 45 Persson L-A, Carlgren G. Measuring children’s diets: evaluation of dietary assessment techniques in infancy and childhood. International Iournal of Epulmiology 1984; 13:-517. 46 Cassidy CM. Walk a mile in my shoes: culturally sensitive food-habit research. American Journal of Clinical Nutrition 1994; 59(1 Suppl):l!30!%197s. 47 Szostak WB. The need for improved methods of diet assessment for developing and monitoring food policy in Eastern Europe. American Journal of Clinical Nutrition 1994; 590 Supp1):273S-274!5. 48 Kyleberg E, Hofvander Y, Sitjlin S. Diets of healthy Swedish children 4-24 months old. U. Energy intake. Acta Paediatrica Scandinauica 1986; 75932-936. 49 Kyleberg E, Hovander Y, Splin S. Diets of healthy Swedish children 4-24 months old. III. Nutrient intake. Acta Paediatrica Scandinavica 1986; 75937-946. 50 Kelsay JL. Compendium of nutritional status studies and dietary evaluation studies conducted in the United States, 1957-1%7. Journal of Nutrition 1970; 99:123-141. 51 Scrimshaw NE. Significance of the appraisal of the nutrient intake and the nutritional status of man. American Journal ofClinica1 Nutn’tion 1962,11:331. 52 Mills A, Tyler H. Ministry of Agriculture, Fisheries and Food (MAFF) survey -Food and nutrient intakes of British infants aged 6-22 months. London: HMsO,l992. 53 Stuff JE, Nichols BL. Nutrient intake and growth performance of older infants fed human milk. Journal of Pediatrics 1989; 115:95%%8. 54 Butte NF, Wong WW, Ferlic L, Smith EO, Klun PD, Carza C. Energy expenditure and deposition of breast-fed and formula-fed infants during early infancy. Pediatric Reseurch 1990; 2 8 : 6 3 1 4 . 55 C a m C, Butte NF. Energy intakes of human mdk-fed infants during the first year. Jouml vf Pediatrics 1990; 117124-131. 36 Beal VA. Nutritional intake of children. 2 . Calories, carbohydrate, fat and protein. Journal of Nutrition 1953; 50:223-234. 57 Pipes PL. Nutrition in infancy and childhood. Primary Care 1982; 9:497-516.
4:24-2a.
council (MRC), 1991; pp. 54-85.
D 1996 Blackwell Sctencc Ltd. Pwdiafrir and Pminaful Epidemiology, 10, 150-160